1. Introduction
In recent decades, Algeria has made significant investments in road construction. Consequently, attention is shifting towards maintaining and rehabilitating these road assets to ensure their continued serviceability. However, these structures deteriorate rapidly after construction, prompting questions about the specific causes and potential remedies. Previous studies have often examined various types of pavements in isolation. This work represents a comprehensive comparative study between flexible and flexible reinforced (utilizing geosynthetics) pavements and rigid pavements.
The numerical simulation tool employed in this study is a specialized code based on the finite element (FE) method, which we have successfully used to address various complex problems within the Burmister multi-layer elastic theory framework. We meticulously constructed the model mesh and support structures to ensure accurate FE analysis and increasingly favorable results. The numerical analysis was conducted using the Abaqus computer program [
1], with the geogrid considered as the geosynthetic material. The supporting soil layer plays a significant role in the deterioration of road structures. This layer is inherently complex, and its behavior is challenging to predict due to its heterogeneity and the complex constitutive laws governing it [
2].
Our primary focus is on the behavior of the support soil layer for various pavement structures. Before delving into this issue, it is essential to note that traditional flexible pavements constitute the majority of existing roads [
3,
4]. These typically consist of a base layer and a mechanically stabilized rolled or crushed gravel base layer, often sourced from wadi deposits. The upper portion of this base layer is usually impregnated with a hydrocarbon binder. These pavements are typically topped with a single-layer or two-layer surface coating, with the possibility of a bonding layer beneath. In certain cases, they are surfaced with hot mix (bituminous concrete), while a cold mix is commonly applied for roads in southern regions.
In contrast, rigid pavements consist of a cement concrete slab approximately 25 cm thick, potentially with reinforcement (equivalent to the surface layer of a flexible pavement). This slab rests on a mechanically stabilized gravelly cement foundation layer about 15 cm thick, which can be composed of mechanically stabilized gravel, gravel treated with hydrocarbon binders, or hydraulic binders. Cross-joints and longitudinal joints are created every 4–5 to prevent uncontrolled cracking of the concrete.
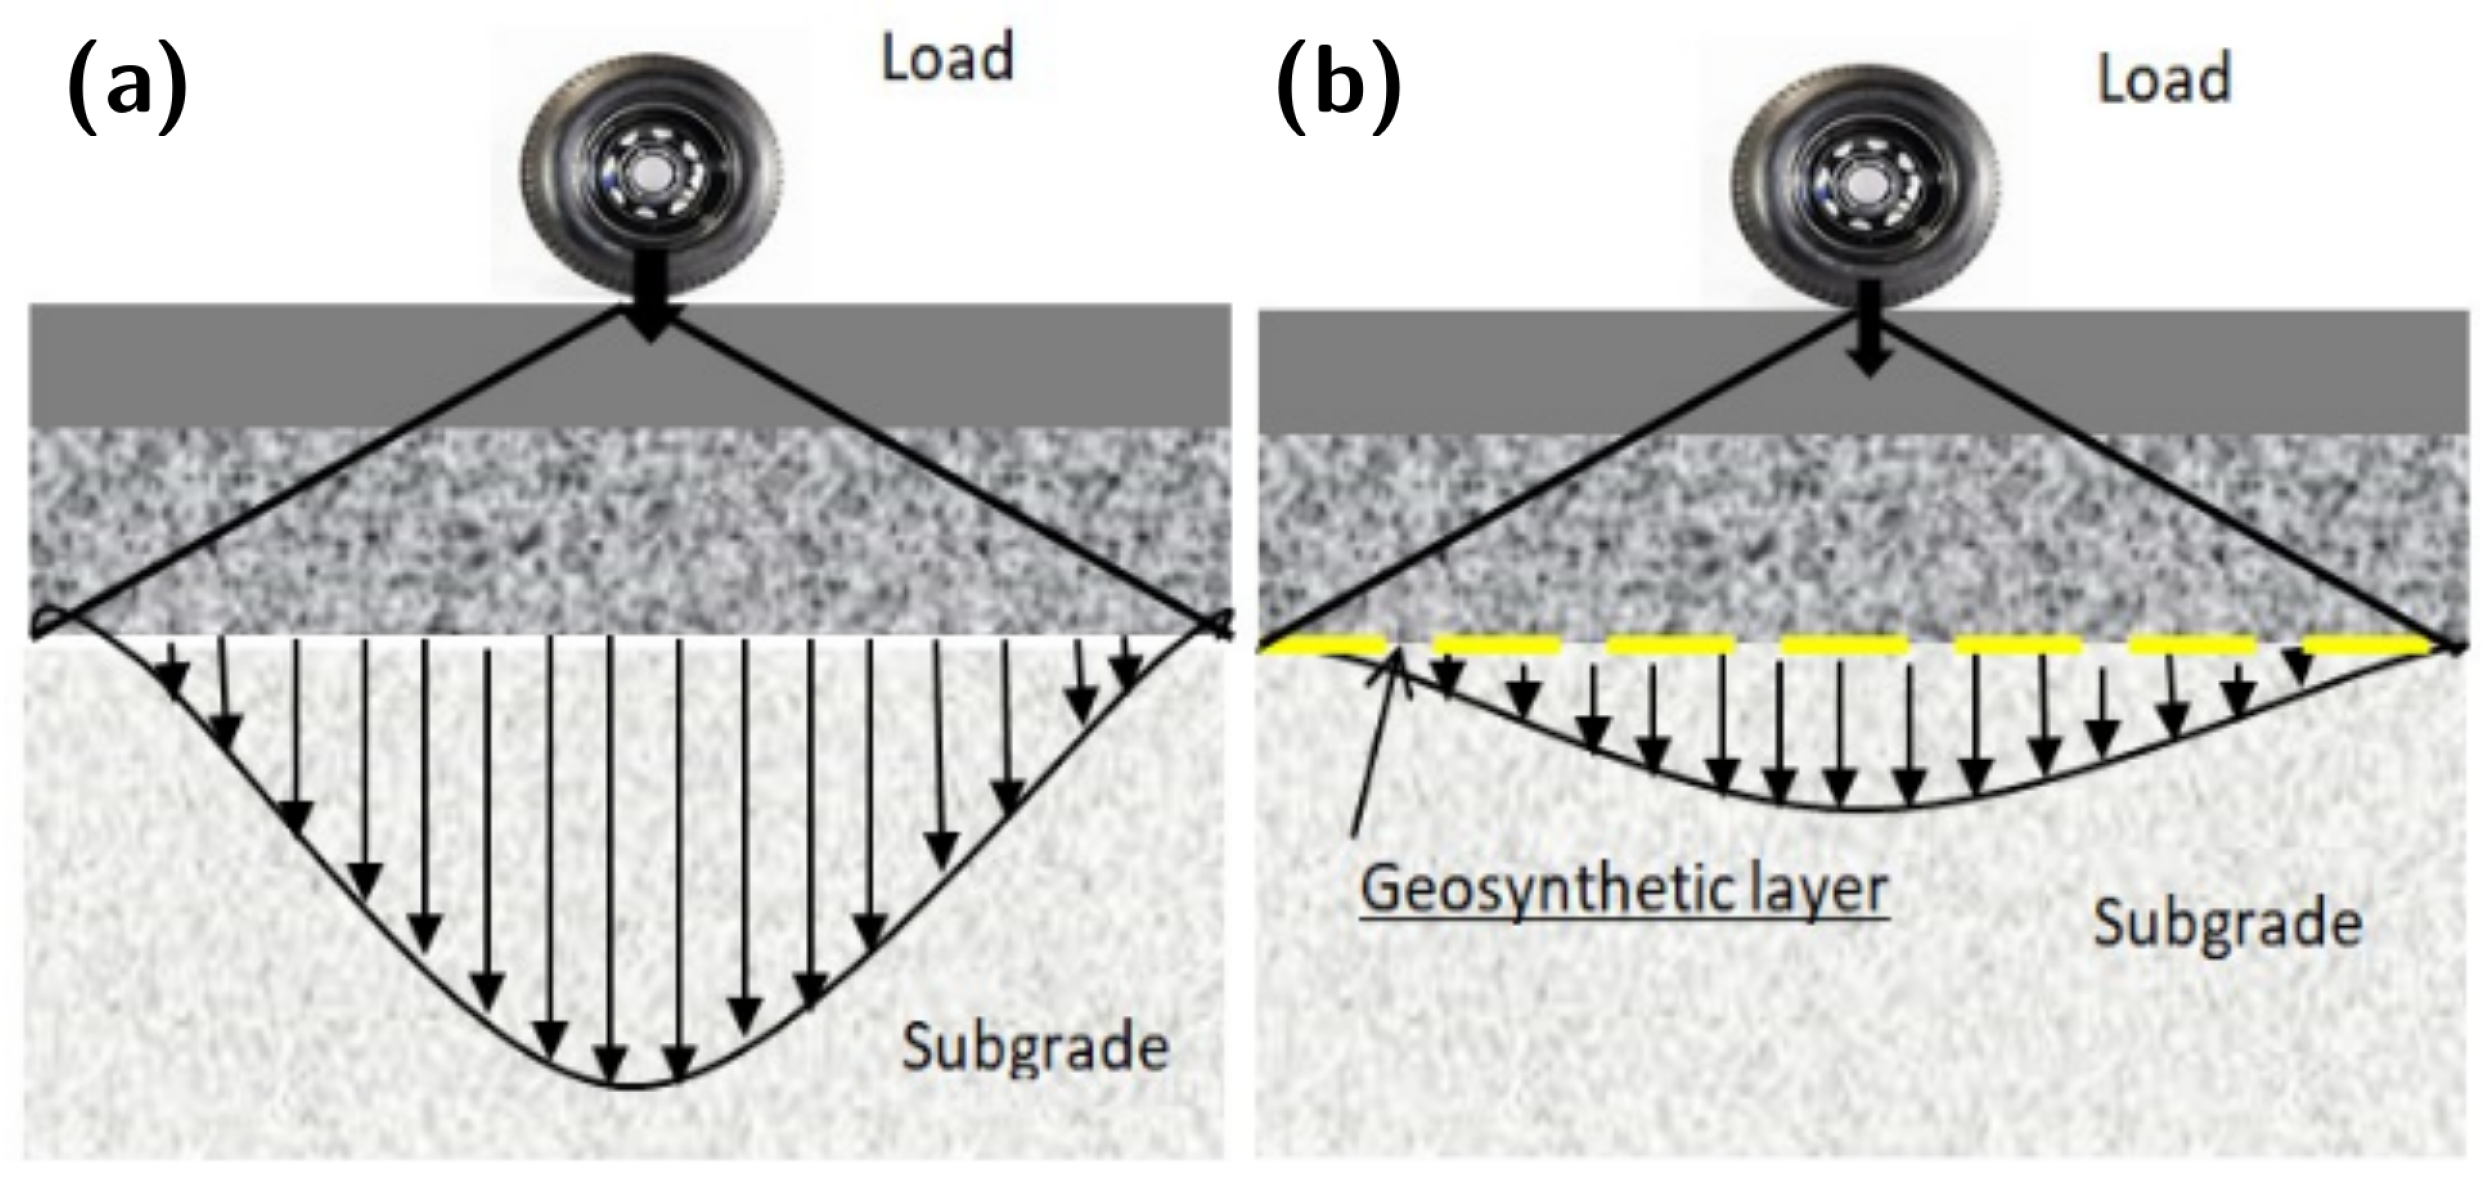
In general, pavements can suffer from two types of failure, namely, functional and structural. Structural failure results in the roadway’s collapse, rendering it incapable of supporting surface loads. Conversely, functional failure means that the roadway cannot fulfill its intended purpose, leading to passenger discomfort. Flexible pavements facilitate the transfer of surface layer loads to lower layers. Vertical pressure on the base layer must be reduced to minimize horizontal tensile forces beneath the asphalt layer and reduce the risk of fatigue-induced cracking. This pressure is closely linked to the shear strength of the base layer. Geosynthetics are employed to limit crack propagation by sealing the asphalt layer. When reinforcing a pavement, geosynthetics are introduced into one of its layers.
Geosynthetics are synthetic materials used in various fields, including geotechnics, civil engineering (for heavy construction and buildings), hydrogeology, and environmental applications. One of their primary roles is filtration, allowing fluid passage while preventing uncontrolled soil particle migration. In addition, they serve as a separator when placed between two soils with differing particle sizes, preventing intermixing while maintaining fluid circulation. Another key function is reinforcement. Geotextiles used for reinforcement enhance the mechanical strength of the included soil mass, improving both tensile strength and ductility before failure [
5,
6]. Reinforcement can involve stress redistribution, such as when a geomembrane on a slope is covered with a soil layer. In this scenario, a geotextile placed between the geomembrane and the soil helps to redistribute stresses.
The application of geotextiles in reinforcement first became significant during the mid-1980s, especially for projects involving vertical or quasi-vertical slope reinforcement walls, embankments with weak soil, and foundations or pavements on compressible or karstic soils [
7,
8]. When accommodating traffic-induced stresses, road structures must effectively distribute the forces generated in the foundation soil. Rolling loads induce bending deformation within the structure’s layers, resulting in compressive stresses at the load location and tensile stresses at the base of the asphalt layers (
Figure 1).
Previous research has covered various aspects of road infrastructure reinforcement, from soil reinforcement to pavement body enhancement. In the context of flexible pavements, multiple aspects have been explored, including performance improvement [
9,
10,
11], reduction of pavement thickness [
12,
13], and an examination of factors influencing the design of geogrid-reinforced pavements [
14]. In the case of rigid pavements, studies have primarily focused on calculating slab thickness, the properties of the constituent materials, and the diverse forms of degradation resulting from repeated load applications [
15,
16,
17,
18]. Other studies have conducted comparisons between flexible and rigid pavements, often delineating the advantages and drawbacks of each pavement type, or performed economic analyses to estimate differences in design and maintenance costs [
12,
19,
20,
21,
22,
23,
24]. Alternatively, finite element modeling has been utilized to analyze the deterioration processes affecting rigid pavements and to track the propagation of cracks leading to degradation [
8].
What distinguishes our current work is that it explores the idea of approximating the performance of a (more expensive) rigid pavement with judicious reinforcement using more cost-effective flexible pavement. To the best of our knowledge, the derivation of such a result using the polynomial curve fitting relationship of data points obtained from finite element analysis (FEM) calculations had not been addressed in previous research.
2. Methods
To validate our finite element model for reinforced flexible pavements, we performed calculations using the layered elastic theory (LET), which has been successfully used in the structural analysis of flexible pavements for over 60 years. This theory is a mathematical model that was originally developed by Burmister [
25,
26] for two-layered systems, and has subsequently been extended to systems with any number of layers. For rigid pavements, we used the Westgaard model (1926).
The LET models a pavement system as an n-layered structure subjected to a load, as shown in
Figure 2. It is assumed that the layers are numbered from top to bottom starting with layer 1 and ending with layer
n. The nth layer is an elastic half-space. Following Burmister, it is convenient to express the solutions of the LET (stresses, strains, and displacements) for layer
i in terms of the biharmonic function
:
where
z is the vertical position from the top surface of layer i,
r is the distance from the evaluated point to the vertical coordinate axis (of rotational symmetry),
m is an integration parameter,
,
,
, and
are functions independent of both
r and
z, and
is the Bessel function of the first kind with zero order. With each layer
i characterized by its Young’s modulus
and Poisson’s ratio
, which are the input parameters with
,
, and thickness
, we have the following responses:
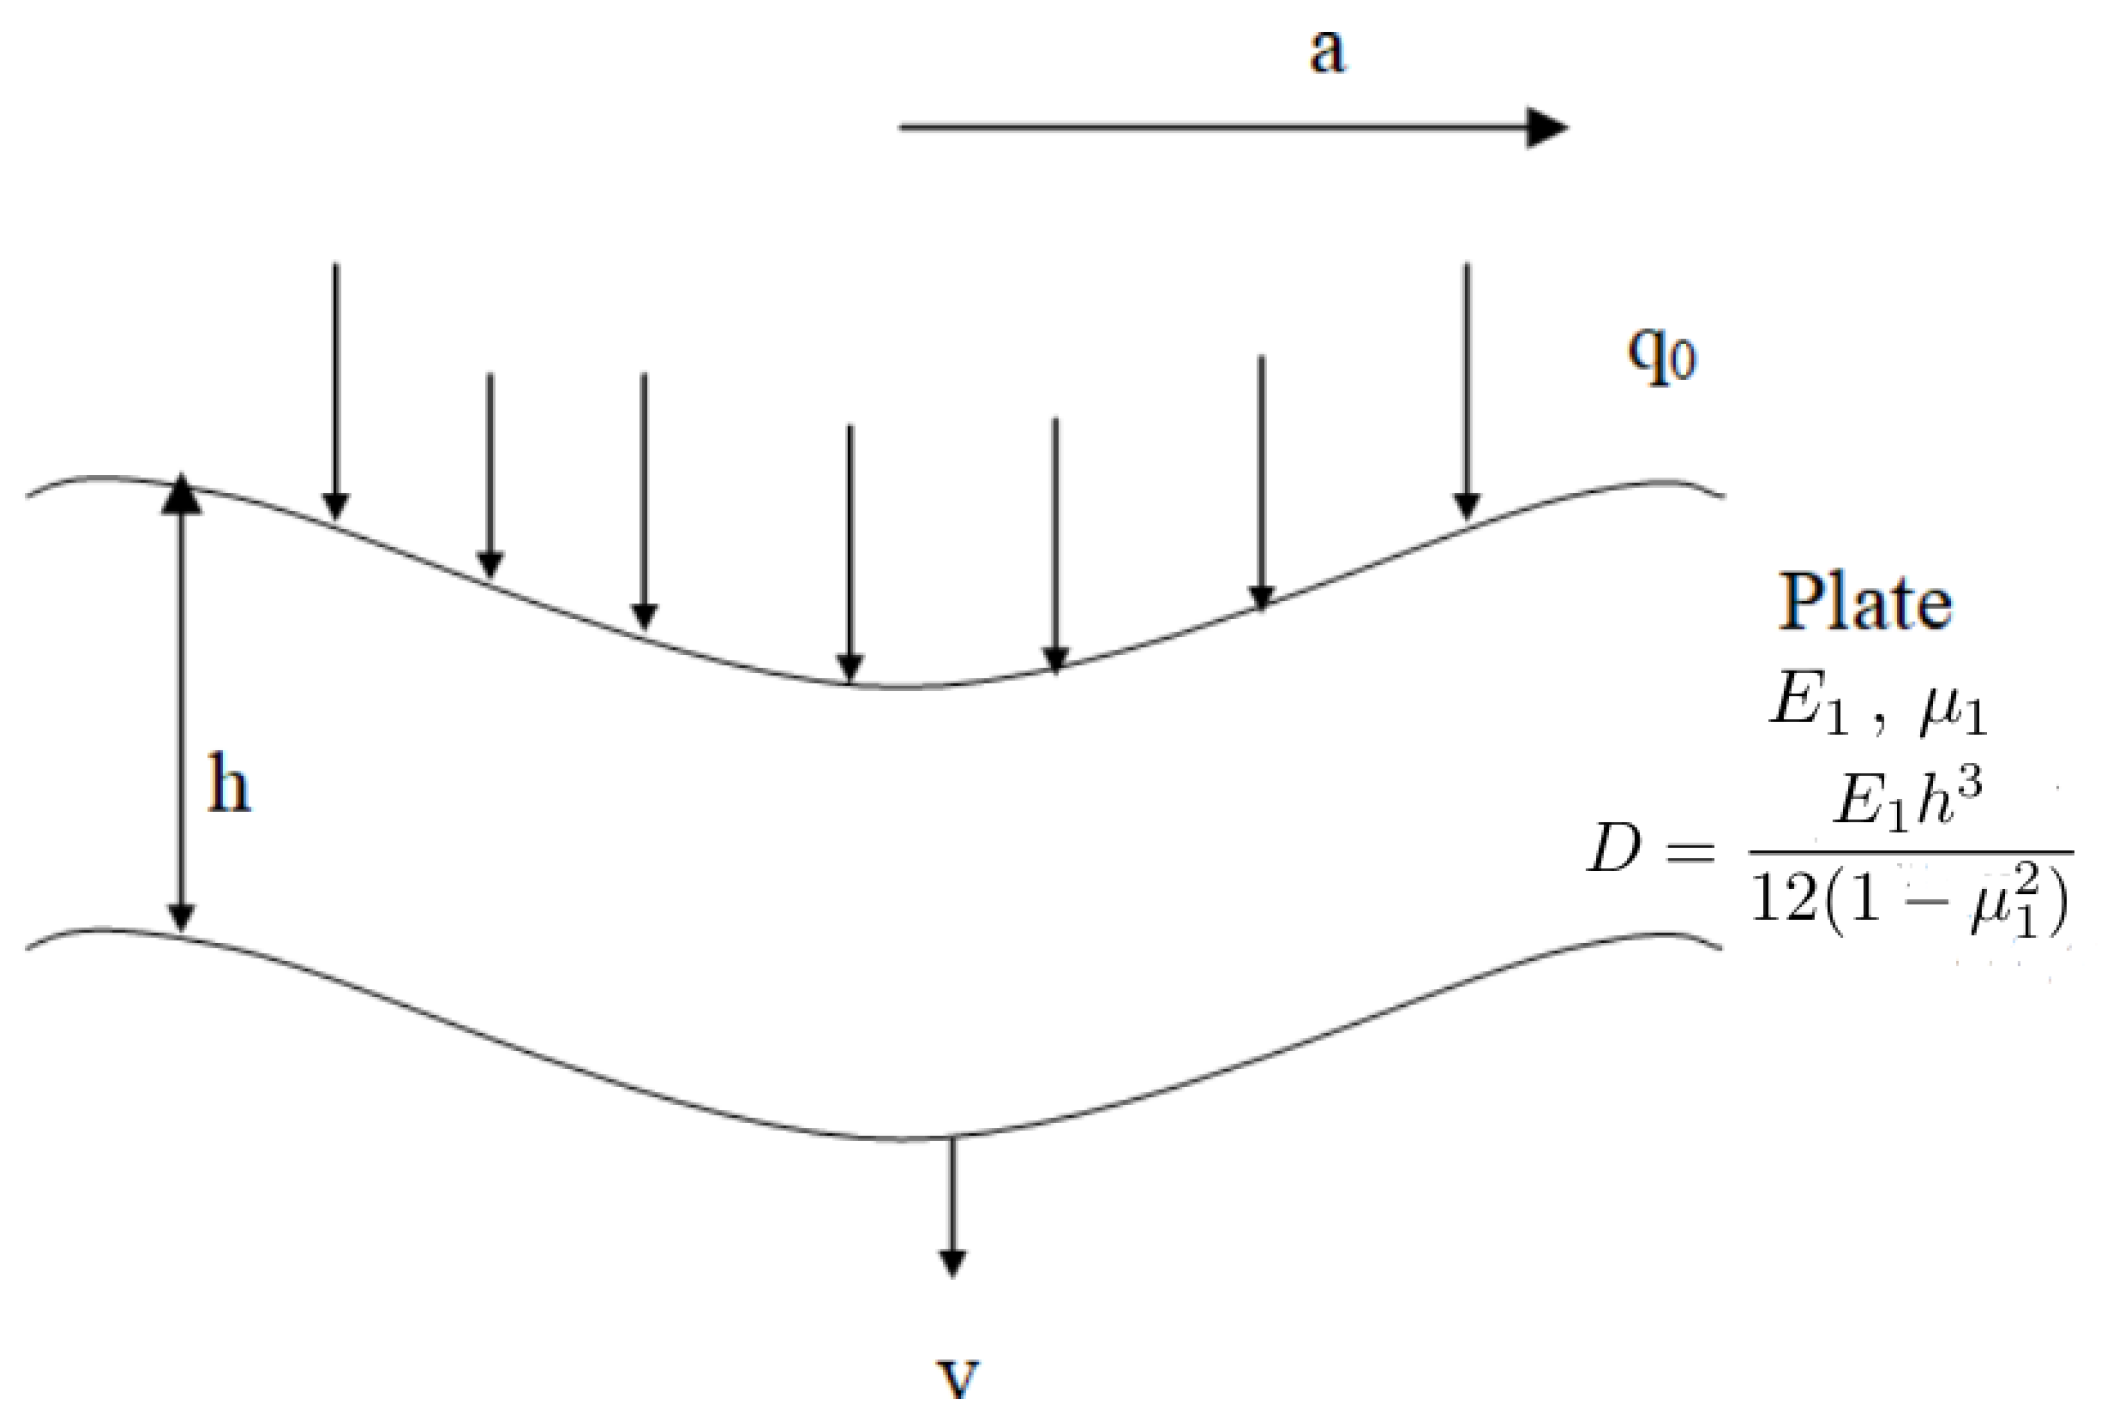
The Westergaard model is one of the methods used for calculating rigid pavements. Unlike the Hogg model, which followed a logical extension of the Boussinesq model, Westergaard took a distinct approach. The Hogg model’s complexity arises from its reliance on a massive Boussinesq plate to support the roadway, a simplifying assumption shared with Westergaard’s model. However, it is worth noting that this assumption simplifies the actual ground behavior, which in reality is far more complex. Westergaard introduced an additional simplifying assumption regarding the soil, which helps to streamline the analysis. In addition to assuming a thin plate for the pavement, the Westergaard model incorporates a specific subgrade mapping, as shown in
Figure 3.
Using this model, it is possible to find the following relationship expressing the stresses
(or
) as functions of the total applied load
p, the subgrade reaction modulus
k, the elastic modulus
E, the Poisson’s ratio
, and the thickness of the slab
h:
Here, a and b respectively correspond to the lengths of the major and minor axes of the elliptical contact area of the applied load.
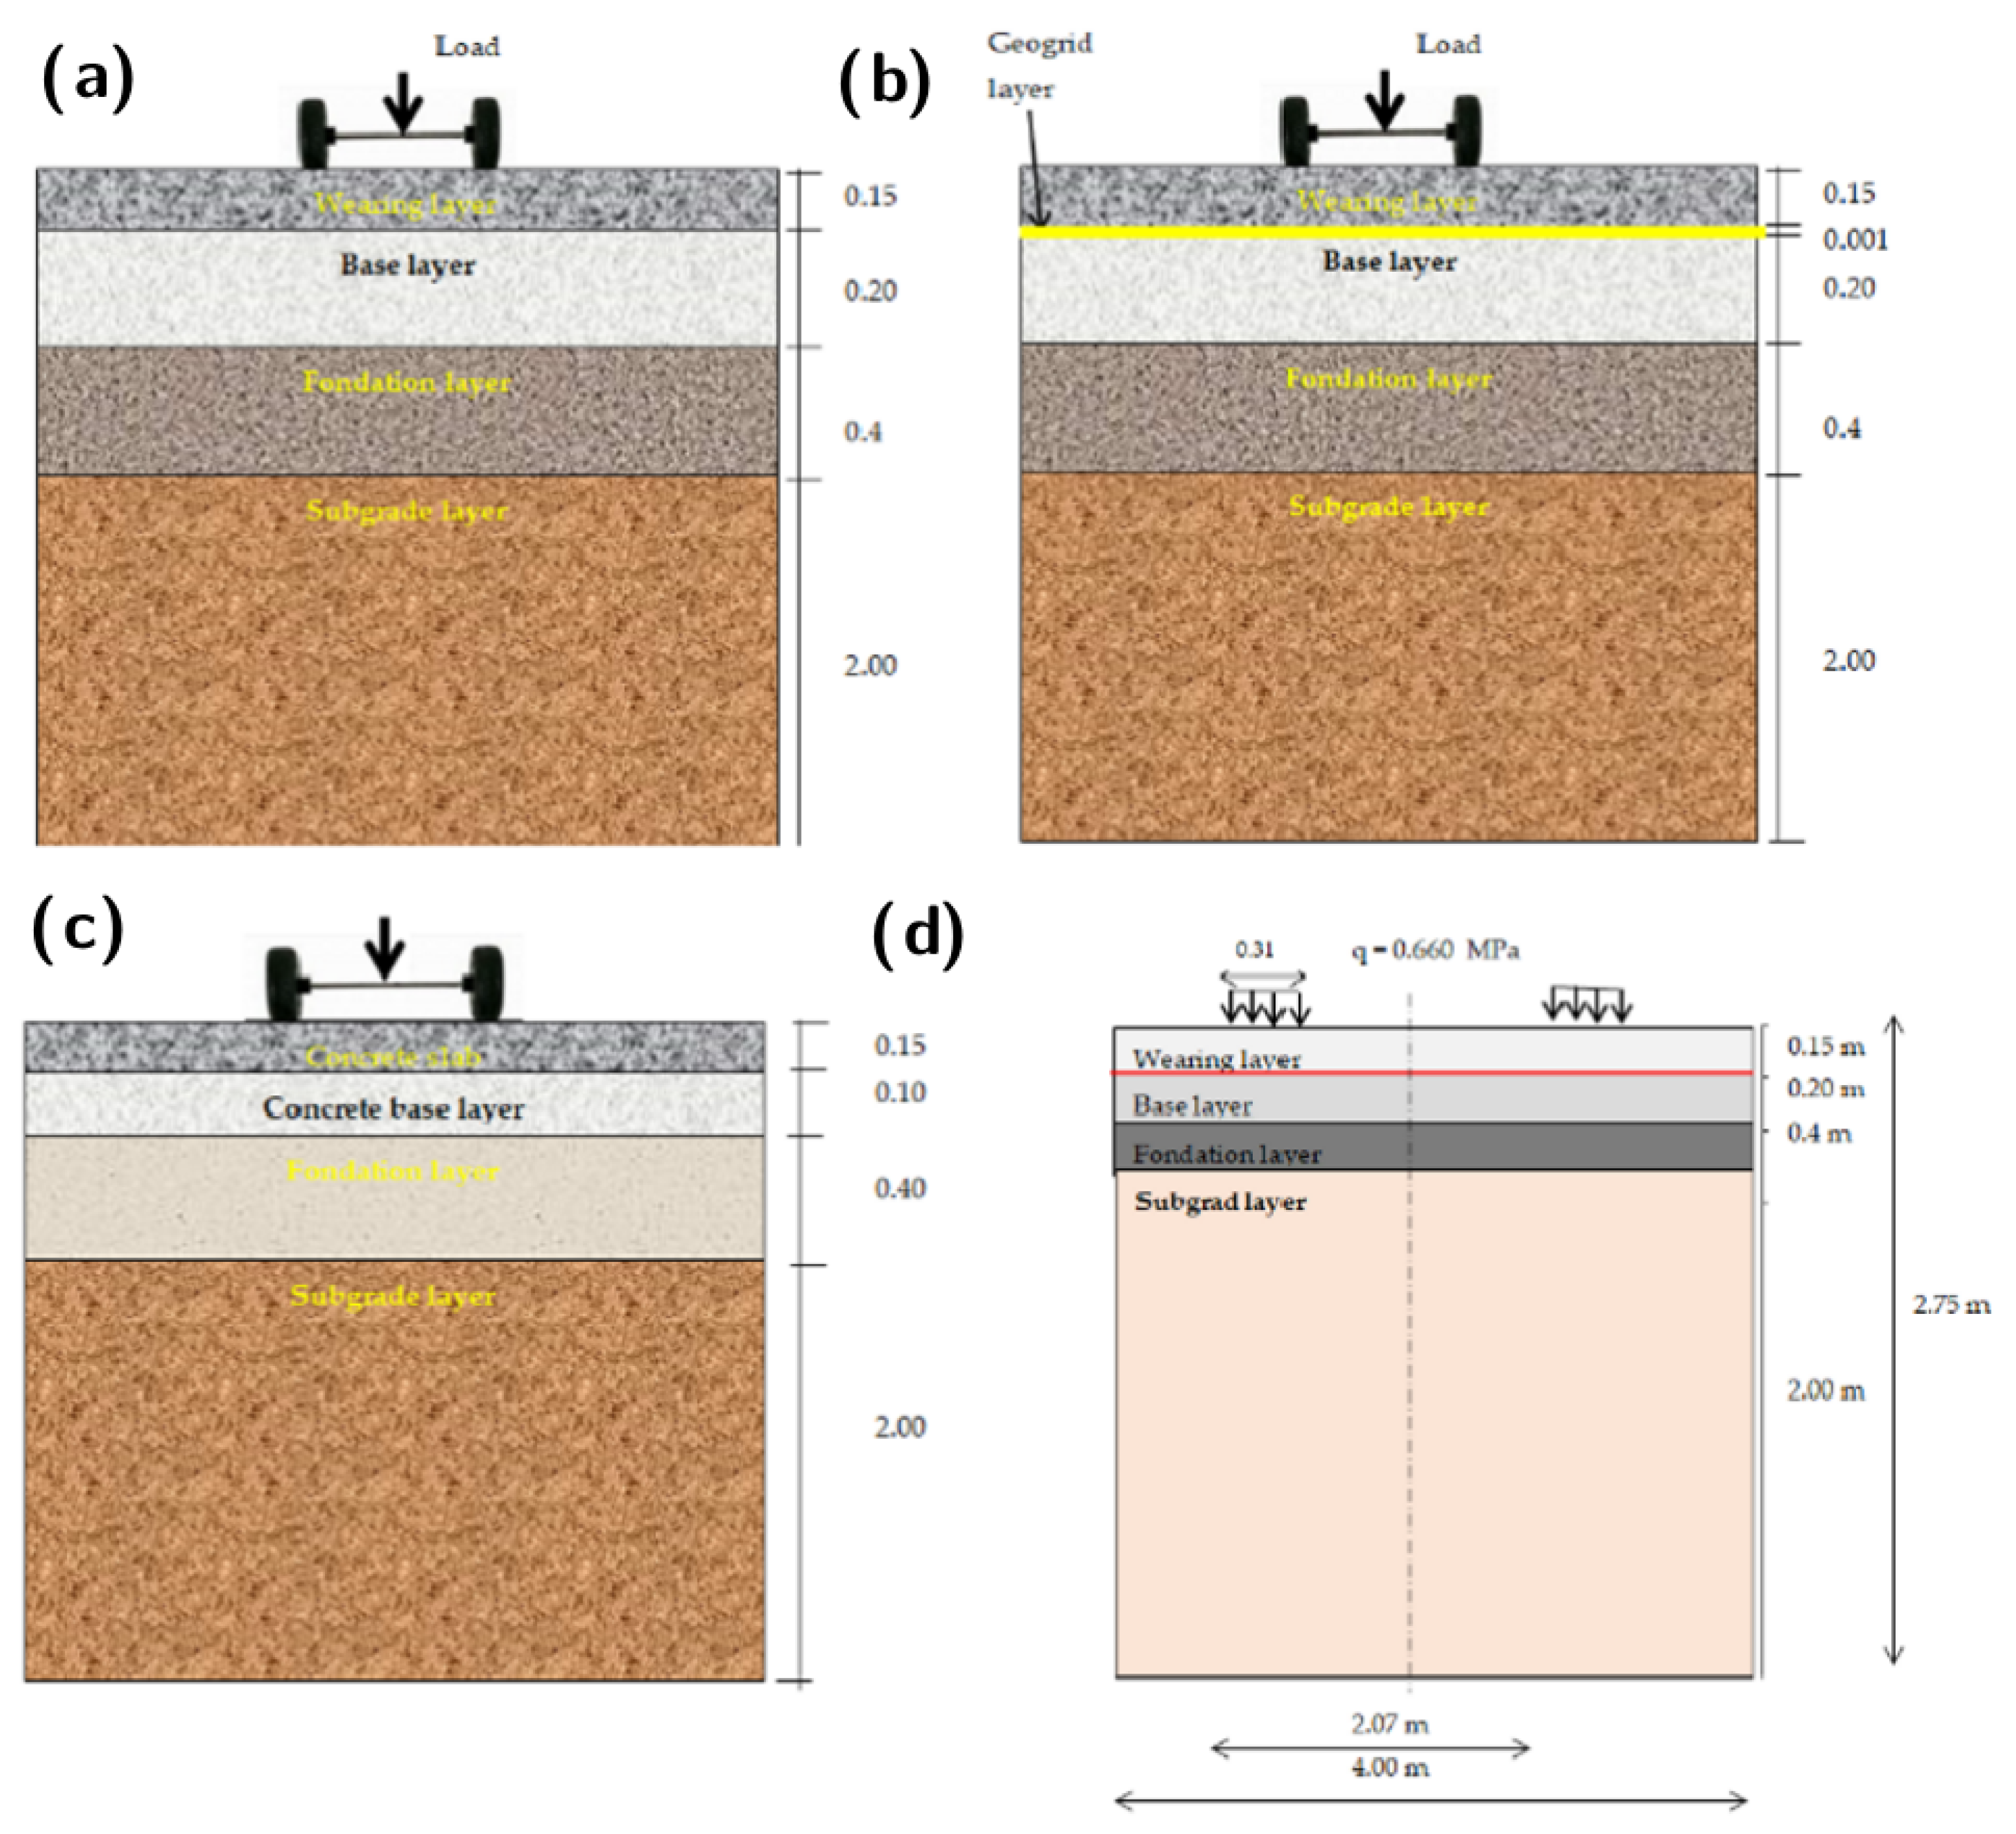
Two types of pavements were considered in this study, namely, flexible and rigid pavements. The body of the flexible pavement was made up of a wear layer of bituminous concrete (BC), a base layer of severe bitumen (SB), and a foundation layer of untreated gravel (UG).
Figure 4 shows an example mechanical model of a flexible pavement structure under central loading. The whole structure is placed on an embankment, which forms the support soil. We studied two flexible pavements: a simple pavement without any reinforcement, and a pavement reinforced by geosynthetics (
Figure 4a,b). The rigid pavement consisted of a layer of class IV concrete as the wearing course, a layer of lean concrete with a base layer of granular material (MG-20), and a granular material (MG-56) surmounting the support floor (
Figure 4c). The reference load was 13 tons, equivalent to a pressure of 0.660 MPa distributed over a disc of 0.125 m radius. The geometry was represented over a length of 14 m and a depth of 6 m, and the width of the roadway was 10 m (
Figure 4d).
The mechanical and physical properties of the different materials used in this modelling are provided in
Table 1 for the support soil,
Table 2 for the flexible pavement,
Table 3 for the rigid pavement, and
Table 4 for the geosynthetic characteristics.
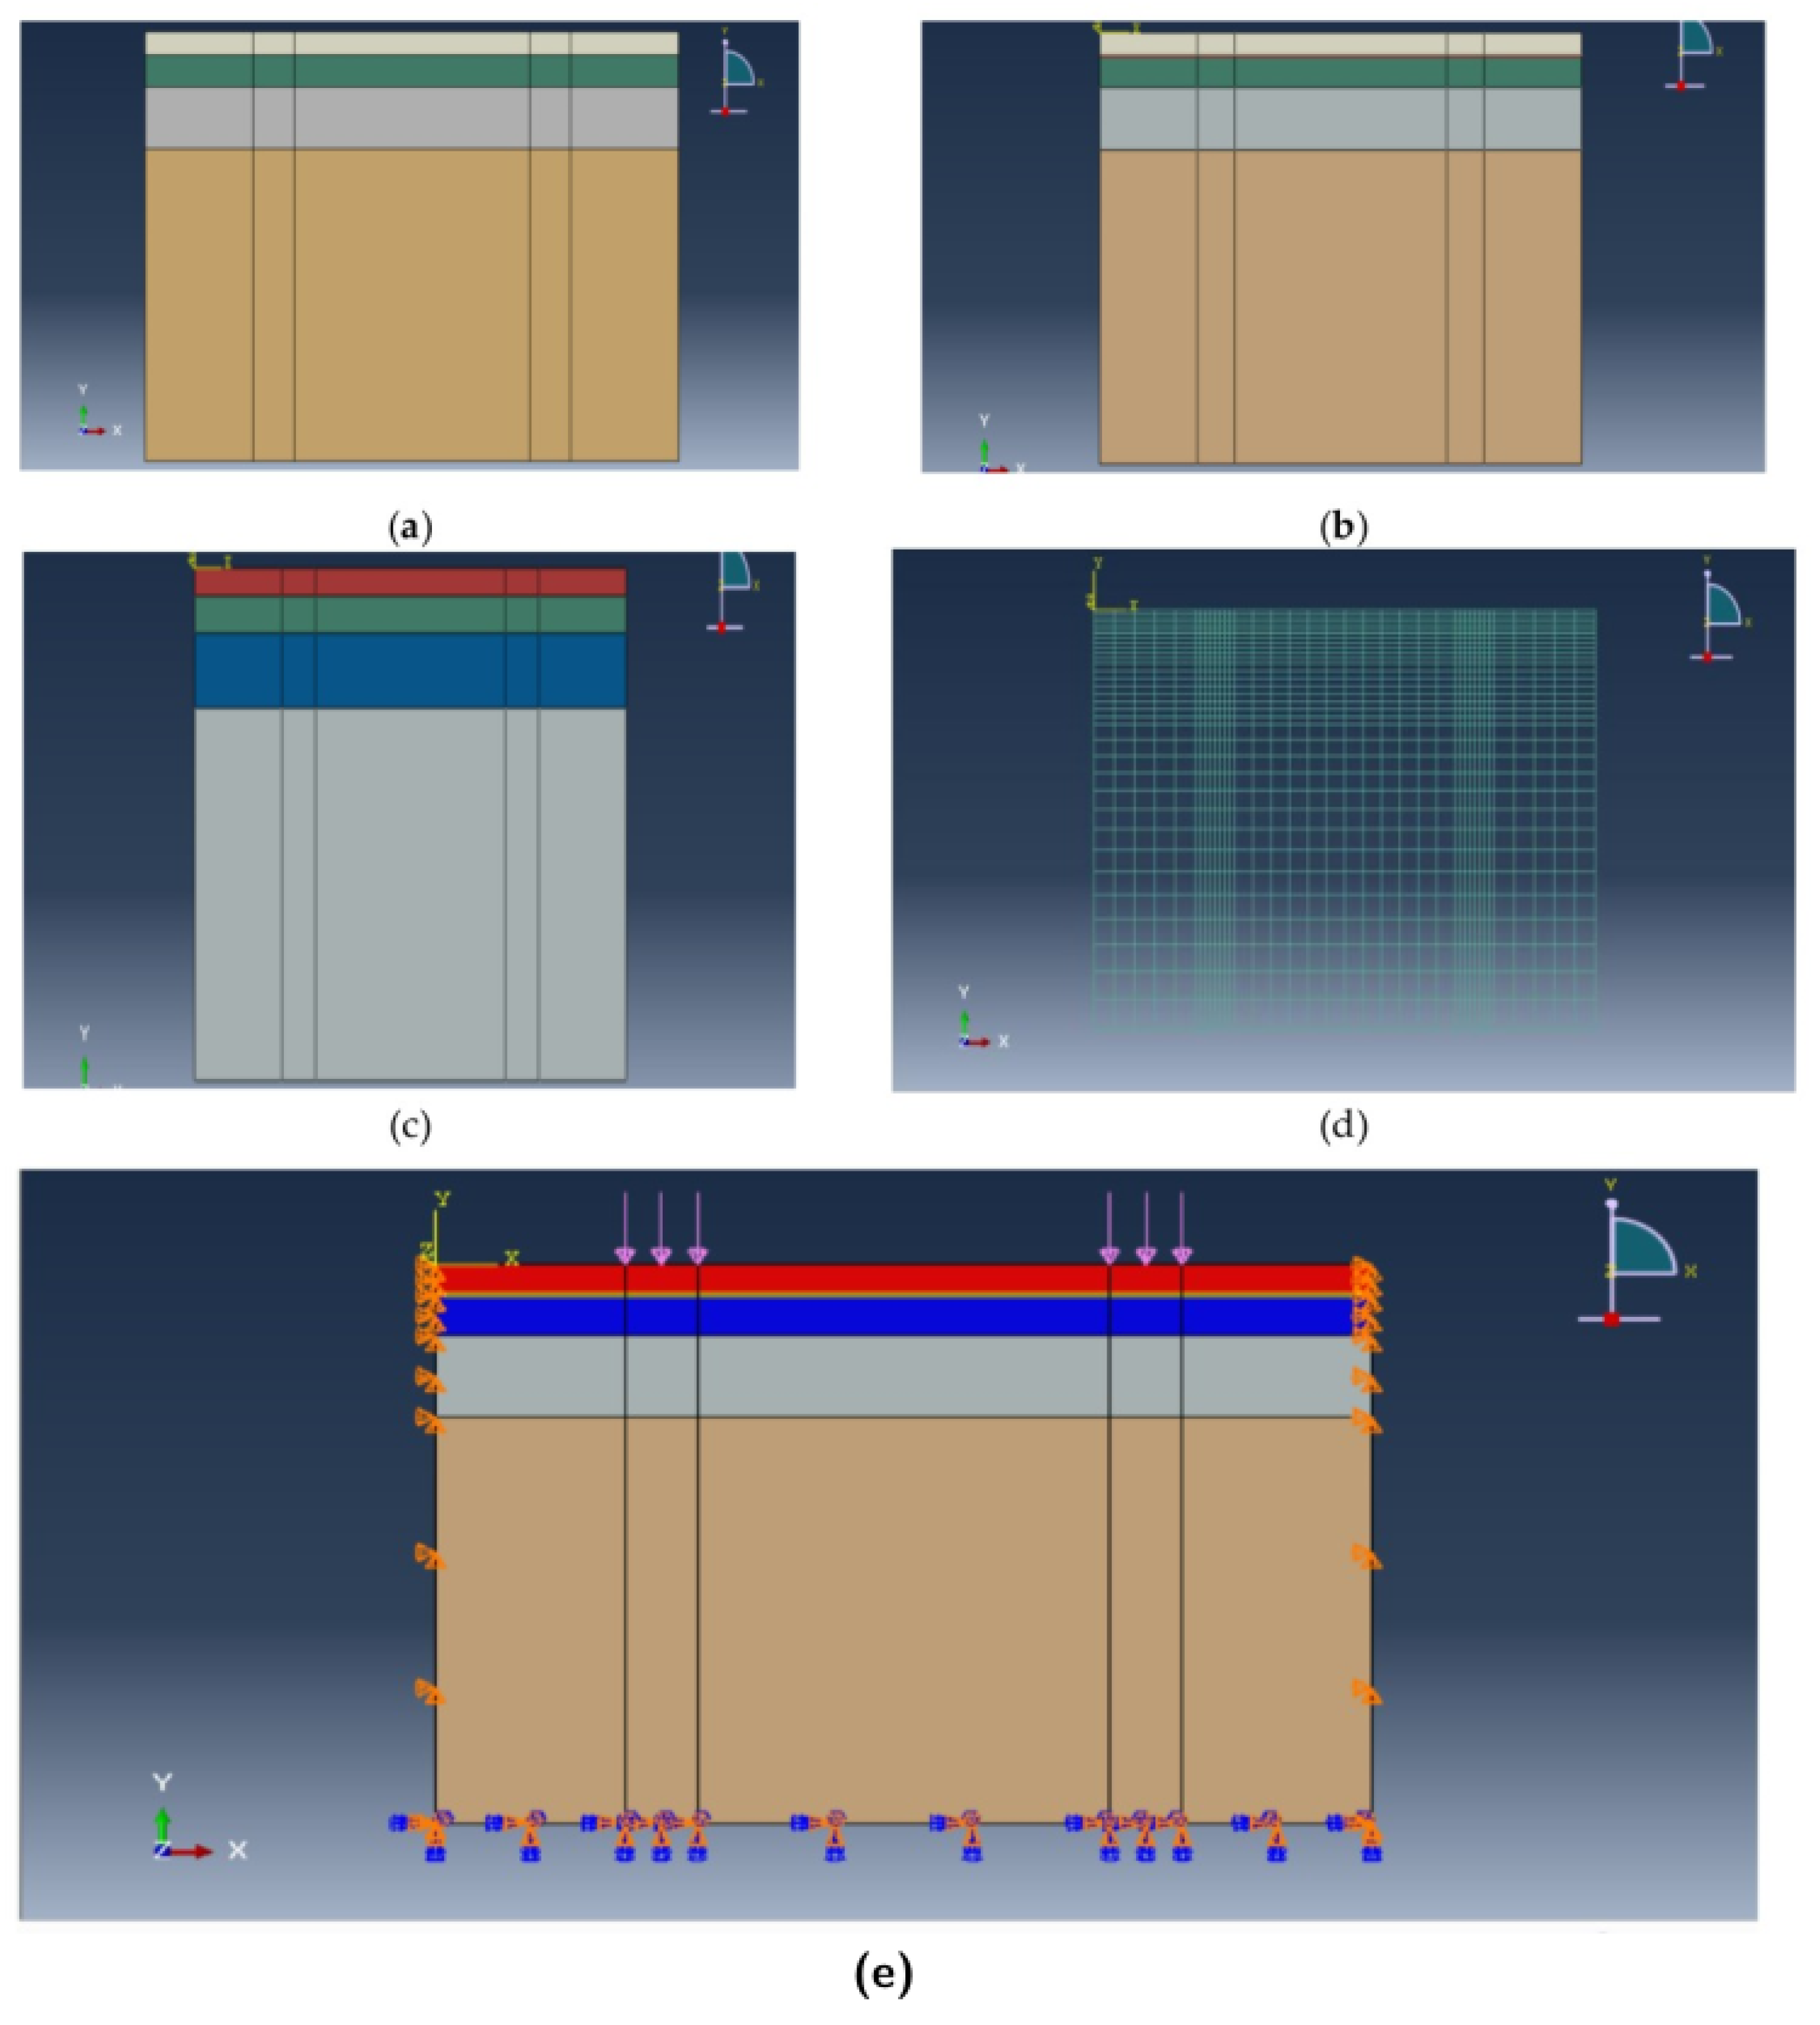
Finite element modelling requires the mesh of the structure to be analyzed. The choices with respect to the types and sizes of elements to be used, especially in the crack tip, depend on the fundamental parameters. To control the strong gradients of stresses and deformations in the crack tip vicinity, we first chose the type of element most well adapted to the studied problem. Then, we divided the structure into several parts.In a flexible or rigid pavement model in which the ground is considered a semi-infinite elastic solid, the mesh criteria are essential. The generated meshes were of fine types; we assigned them to the zones under the wheels’ trajectory because of the thin thickness of the road layers. This situation justifies the need for a fine mesh around the loading areas [
24]. Rectangular elements were used to discretise the model of flexible pavement, with 1292 elements, 1365 nodes, and 2730 total variables in the model. The mesh must be sufficiently thin in the areas where the stress variation is significant, that is, near the roadway and under its base. On the other hand, more prominent elements need to be placed in less crowded areas in order to reach the external borders. The lateral limits of the mesh must be fixed at a sufficient distance from the thinly meshed zones to ensure that the boundary conditions do not influence its behaviour. The initial conditions require the initial interstitial pressures and initial constraint to be generated. The horizontal displacement is zero according to the lateral limits of the model. Likewise, according to this model, there is no vertical displacement. We kept the weight of the soil at 1, which corresponds to a total application of gravity. We used the function of the initial conditions to define the density of the water and a general water line, as interstitial pressures are not considered in the model. The generated mesh was refined in the areas where the rigid road behaviour must be determined most precisely: the load location, interface between the layers, and interface between the roadway and ground. In all, 1152 rectangular elements and 9393 nodes made up the discretisation of the model; see
Figure 5.
3. Results and Discussion
The finite element modelling technique we have adopted here has many interesting features. When combined, it is unique and different from those previously reported in the literature. We treat the base as an elastoplastic and the geosynthetic reinforcement as a linear elastic material, i.e., modelled as a membrane element. Moreover, we assume a perfect bond, with no slip at the interface between the geosynthetic reinforcement and the surrounding foundation layers. Naturally, the asphalt concrete layer is linear elastic, while we consider the rigid pavement as a rigid plate.
The validation of the numerical models was ensured by comparison of the numerical results with the analytical results. The methodology adopted here is simple. With the developed material model (see below), the behavior of three pavement types was studied: a flexible pavement, a flexible pavement reinforced with geosynthetics, and a rigid pavement. The model was validated by comparing the results with those of Burmister’s solutions. These solutions were designed using a Python program similar to UNLEA SciLab [
27]. After validation, it was possible to highlight the role of the geosynthetic material and compare the behavior of the supporting soil in the cases of flexible and rigid pavement structures. Our results demonstrate the particularity of each structure. A series of tests were carried out to improve the performance of reinforced flexible pavements in order to find the best components to achieve similar behavior to that of rigid pavements.
In this section, the results are analysed based on the different behaviours of the two types of structure (flexible and rigid) according to the following three parameters: vertical displacement, vertical stress, and stress at the interface. We take the results at the middle of the pavement and at the location of the geogrid layer.
Figure 6 shows the results for reinforced and unreinforced flexible pavements in the case of central loading. The displacement has an initial value of
mm for the flexible pavement and
mm for the reinforced flexible pavement, i.e., a deviation of
mm. The displacements decrease simultaneously and become null on the ground for the two models. The results corresponding to the modelling of a rigid structure differ widely from those specific to the flexible design. The displacement is manifested by a maximum value characterized by an initial displacement of
mm, almost constant, which then decreases to vanish at 6 mm, which is the level of the support soil. A difference between the initial displacement values of the three curves is observed. The rigid structure has minimal displacement of
mm relative to the basic structure and
mm relative to the reinforced structure. This is because as vehicle wheels pass, the ground around the wheels “swells”, causing the already stretched geotextile to become deformed. Thus, the geotextile becomes more rounded, and the concave side of the geogrid absorbs more stress when the wheels pass over it. As the geogrid experiences more stress vertically when the wheels pass over it, the aggregate layer experiences less stress.
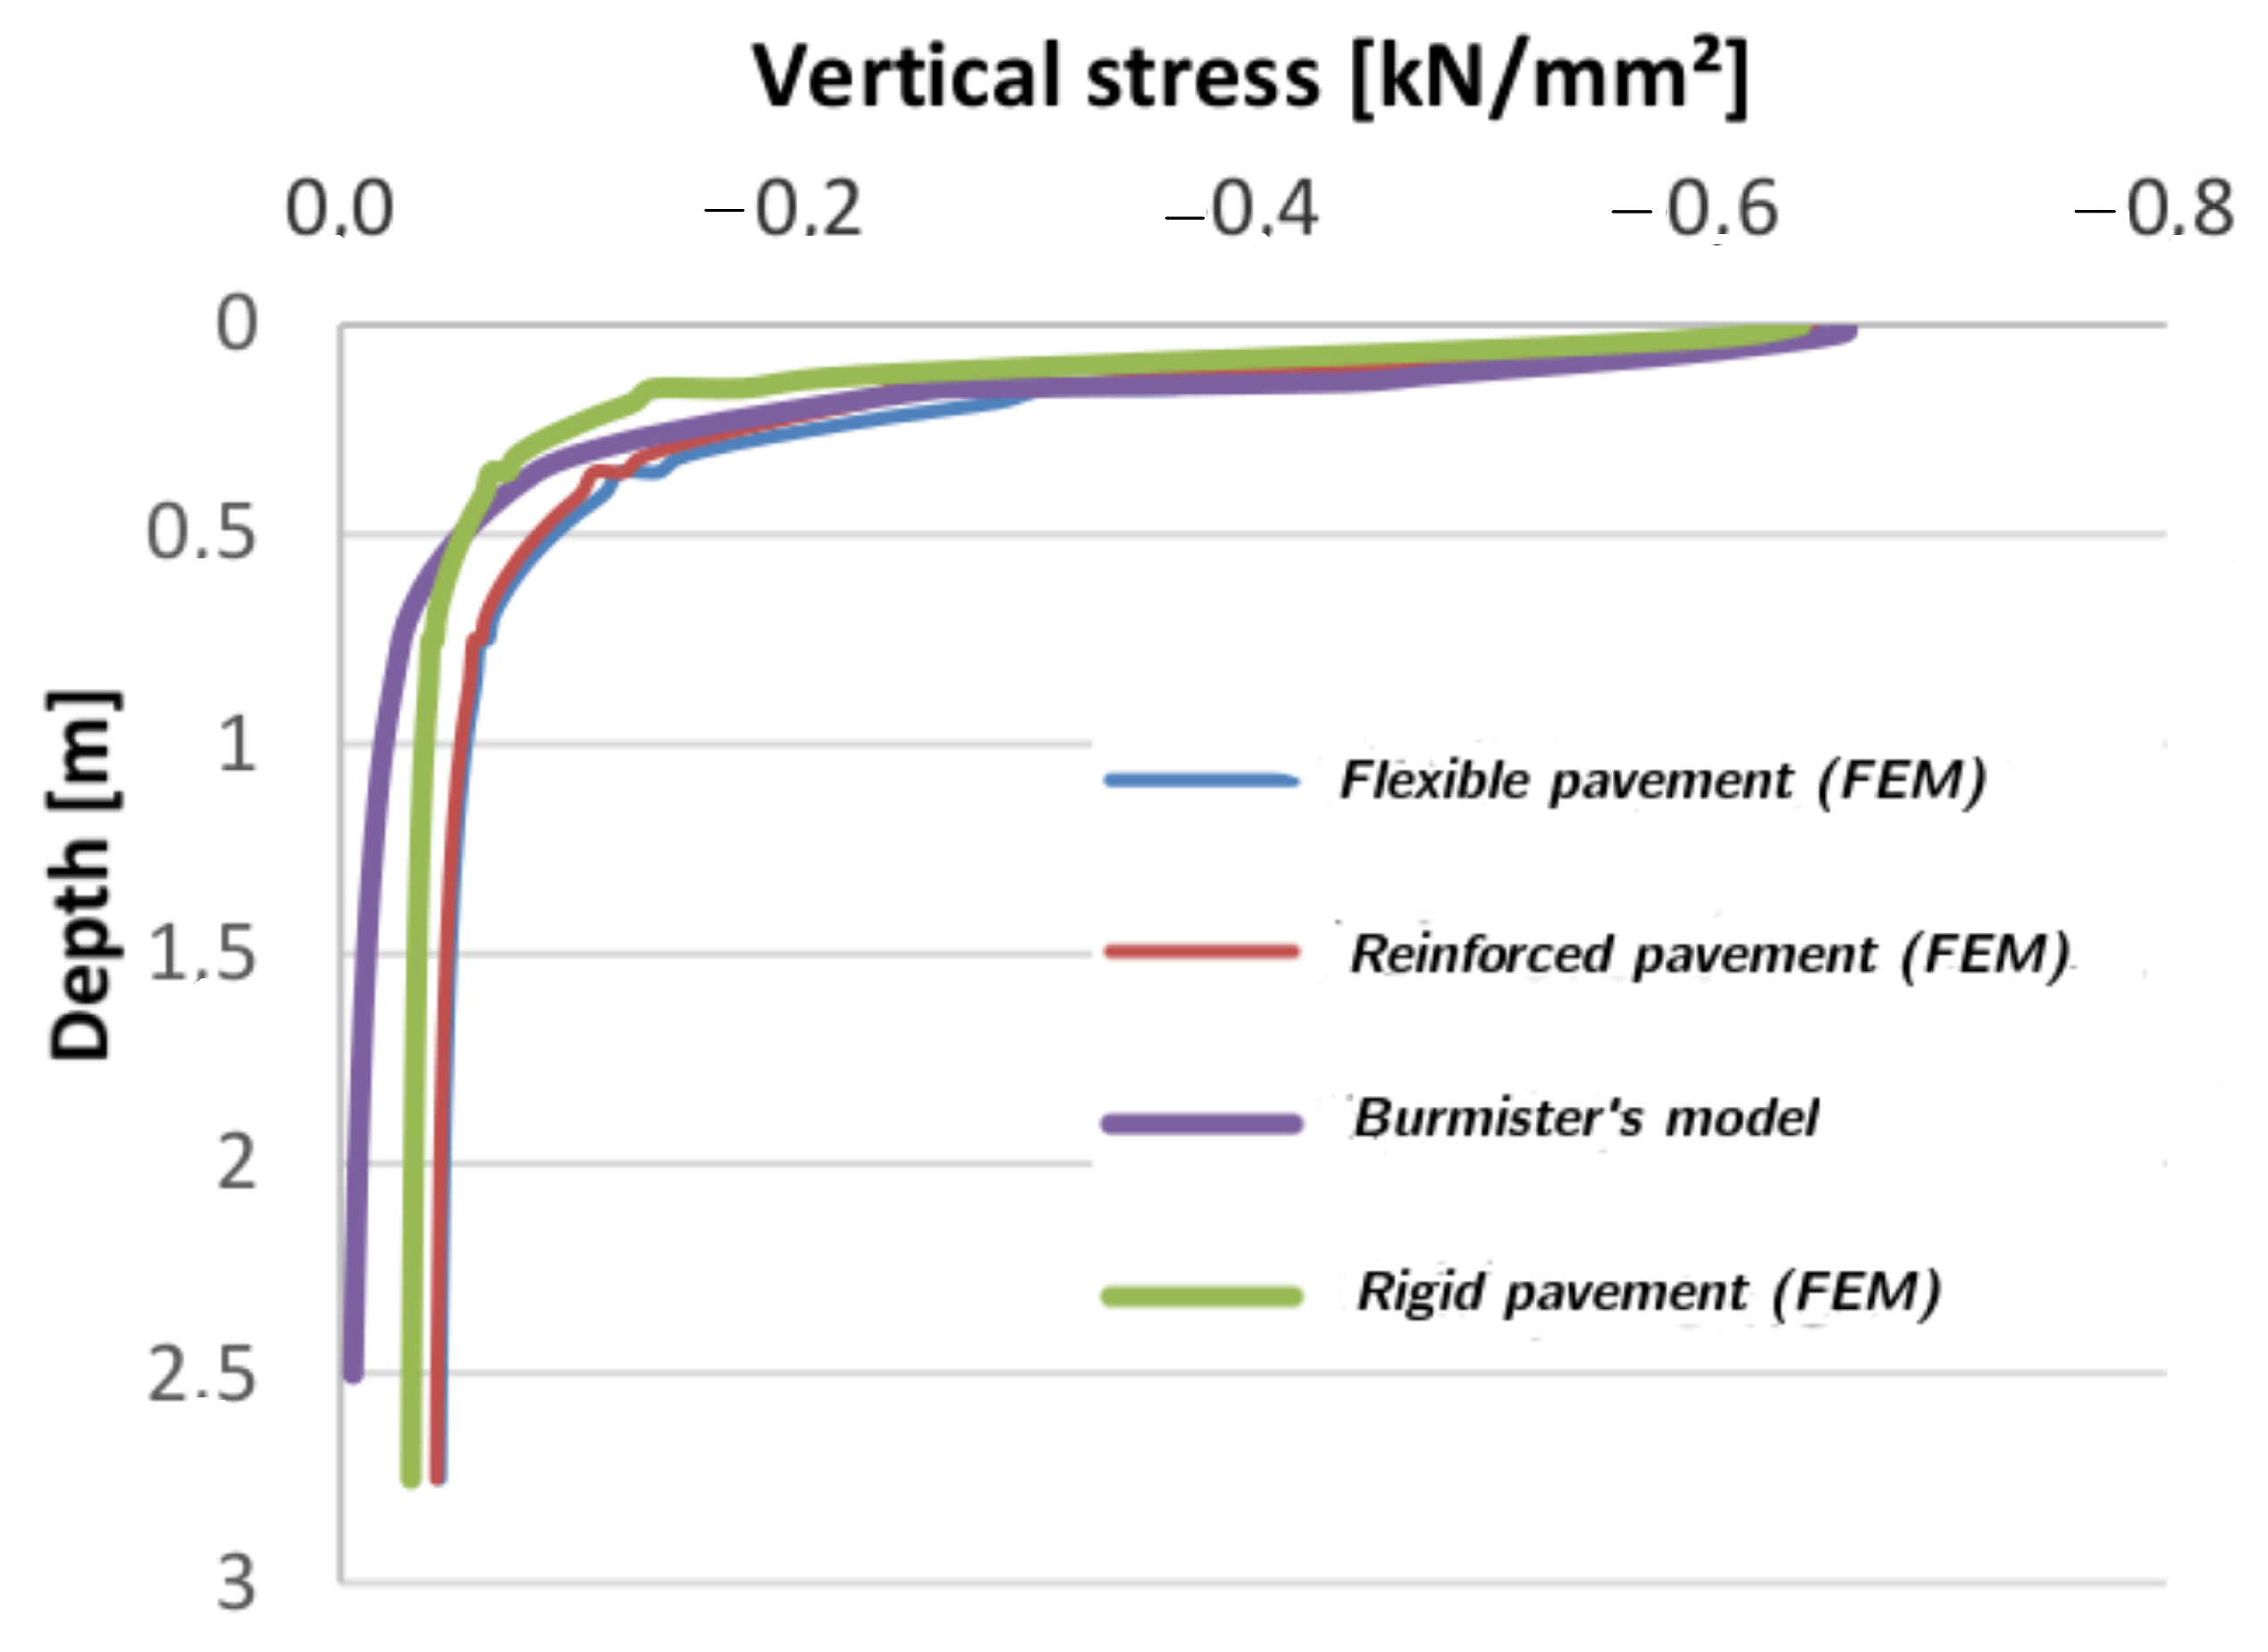
Moreover,
Figure 7 shows that the diffusion of stresses begins with a maximum value at the surface and gradually decreases in the ground to become zero beyond six meters. It is observed that the rigid road body absorbs all of the stress, while the minimum overstress on the order of 7 × 10
5 decreases slightly in the ground before disappearing. The remarkable difference between rigid and flexible pavements should be noted; the stress curve in the rigid structure shows a significant drop, whereas in the reinforced flexible structure it first decreases gradually before joining the curves of the rigid structures.
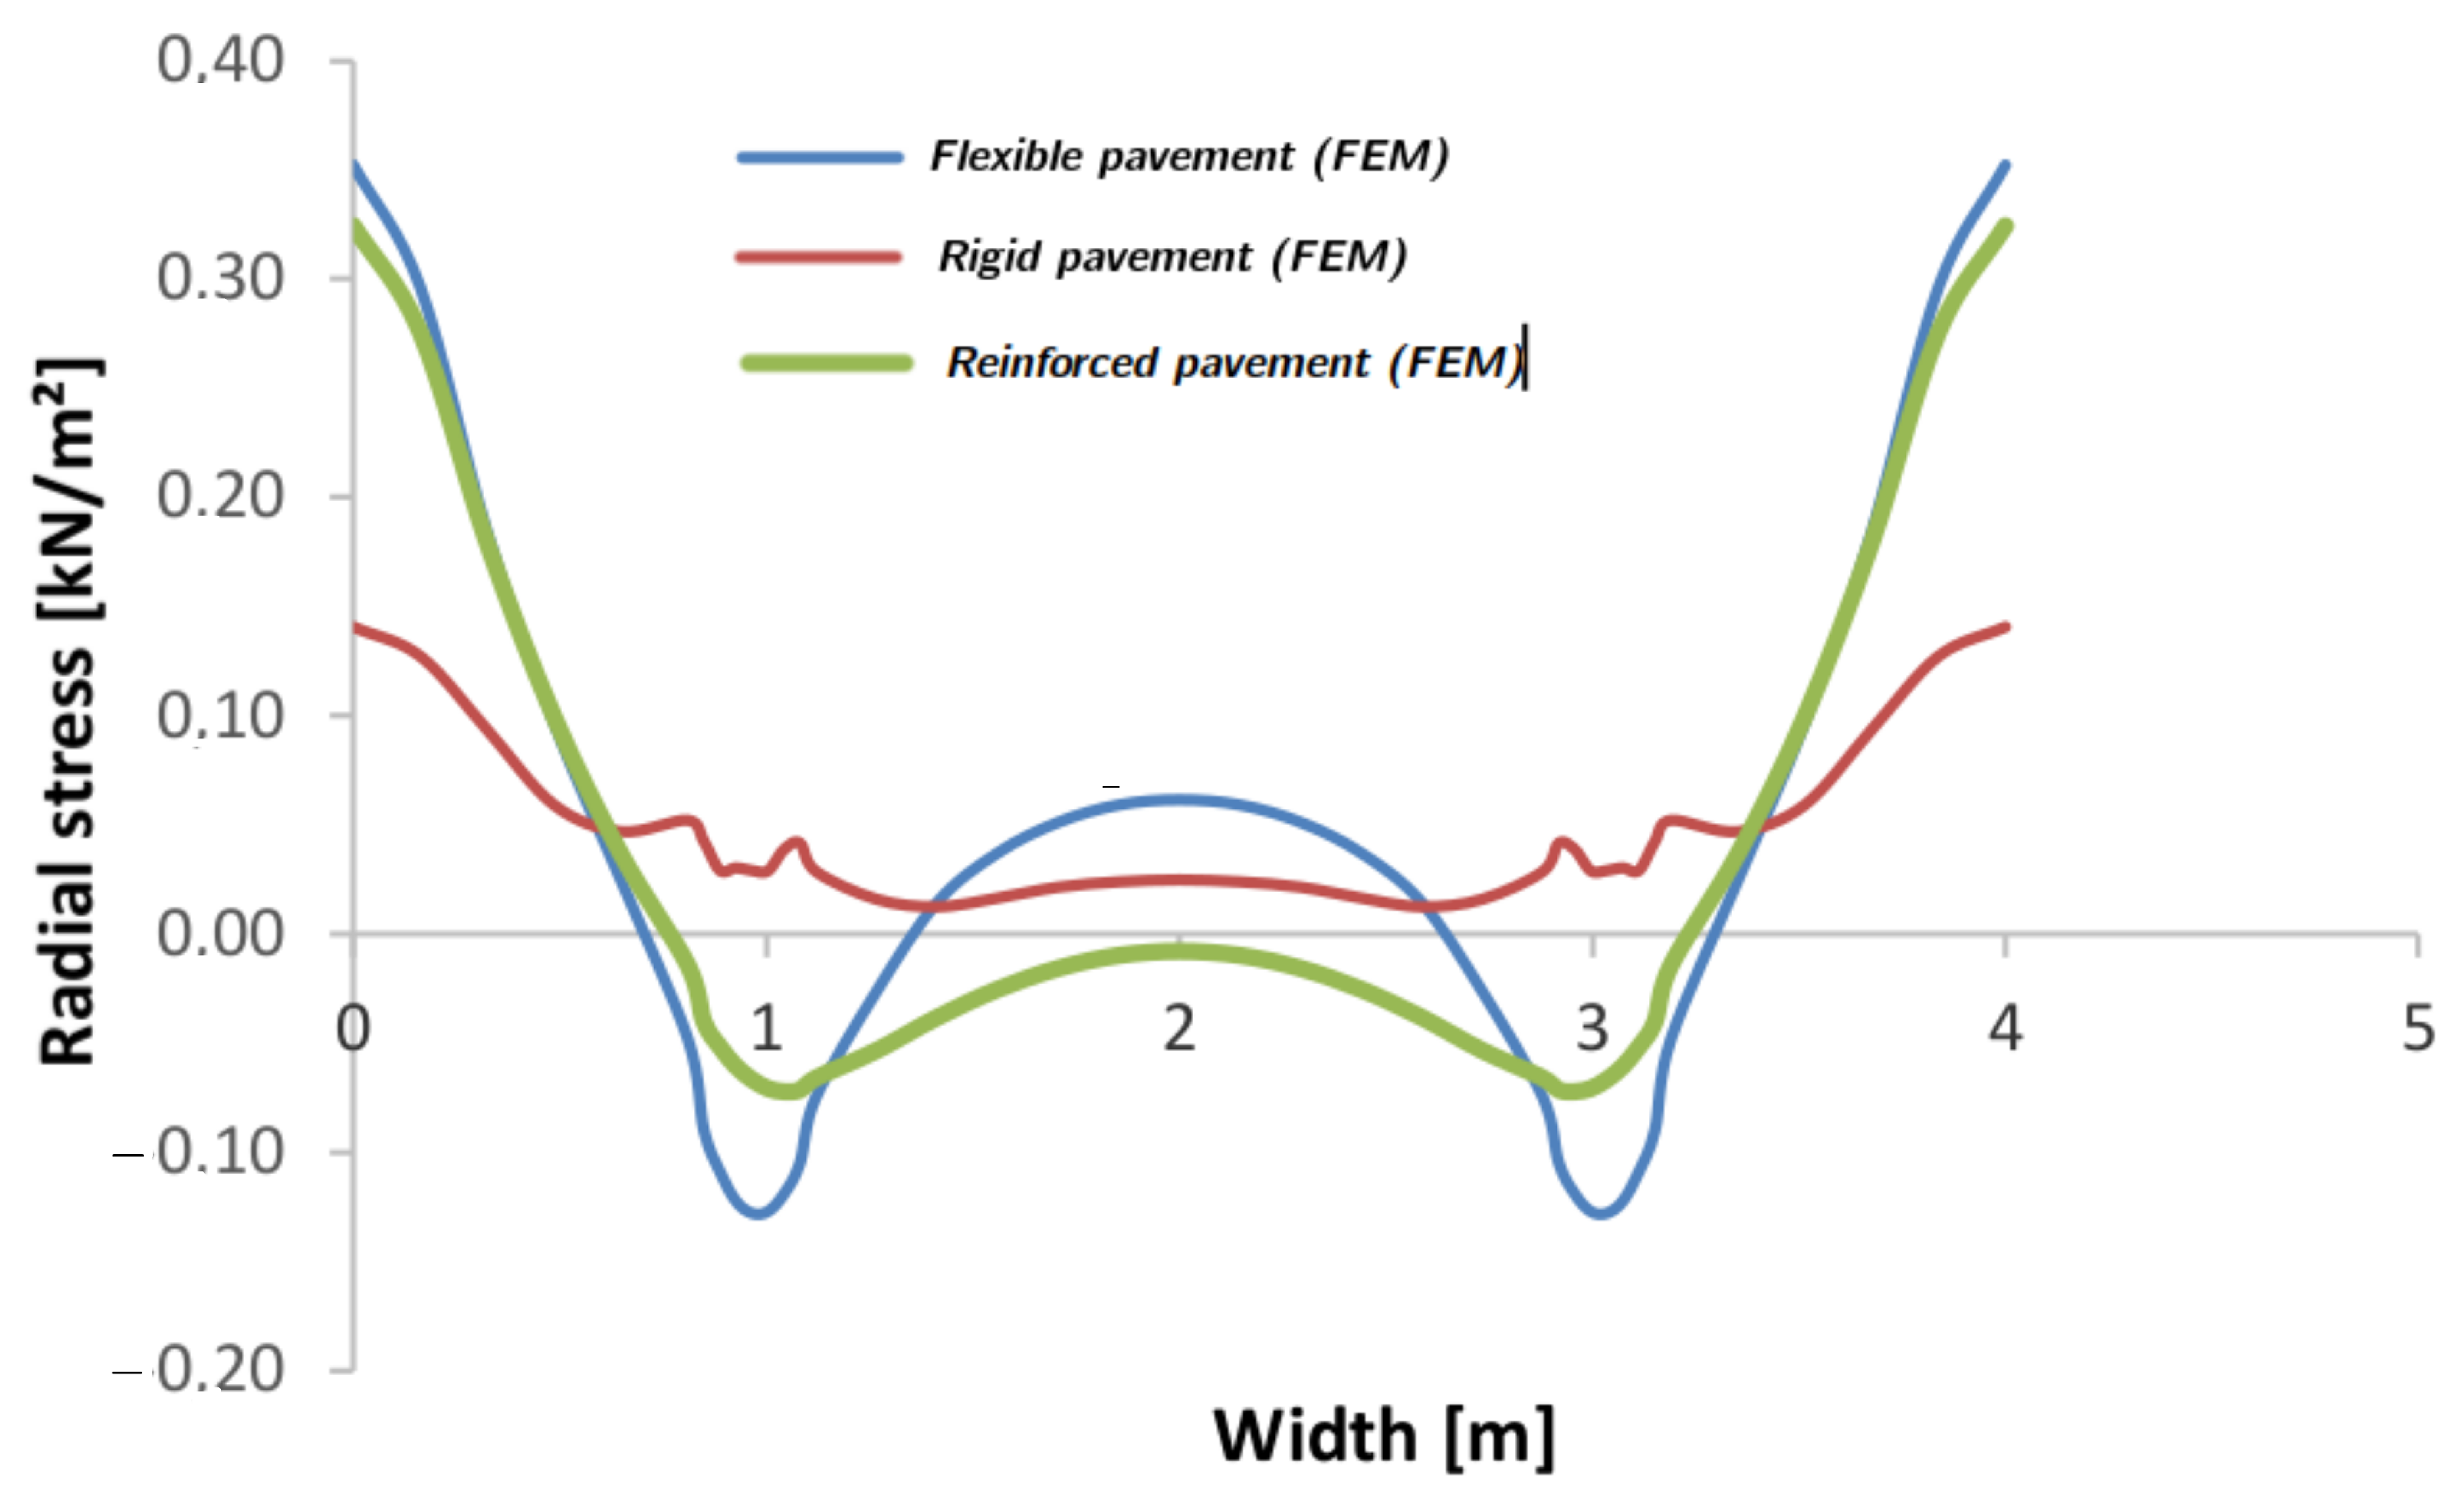
A comparison of the stress at the interface between reinforced and unreinforced flexible pavement is reported in
Figure 8. Due to compression and traction at the interface, the stress is manifested by a dip under the wheel’s axis location. A remarkable difference can be observed between the two curves, which highlights the important role of the geogrid in reducing the effect of load. It is notable that for the rigid pavement the value of the stress at the interface is constant and uniform throughout the width of the pavement (
/
−2). On the other hand, there is a divergence between the three curves in the interval 4–10 m. The stress curve in the rigid structure is almost horizontal near zero, while in the other structures (flexible and reinforced) there is rapid symmetrical variation because of the combined compression (flexible: −1.25 × 10
5 kN m
−2; flexible reinforced: −0.75 × 10
5 kN m
−2) and traction (flexible: 3.1 × 10
5 kN m
−2; flexible reinforced: 3.05 × 10
5 kN m
−2) in the area of load application. Therefore, we can estimate the stress reduction to be at
%.
We observe a decrease in the displacement values from the upper surface of the pavement gradually attenuating into the ground for all three types of pavements (
Figure 9, colors from red to blue). The initial displacement values differ:
mm for the flexible pavement,
mm for the reinforced pavement, and
mm for the rigid pavement.
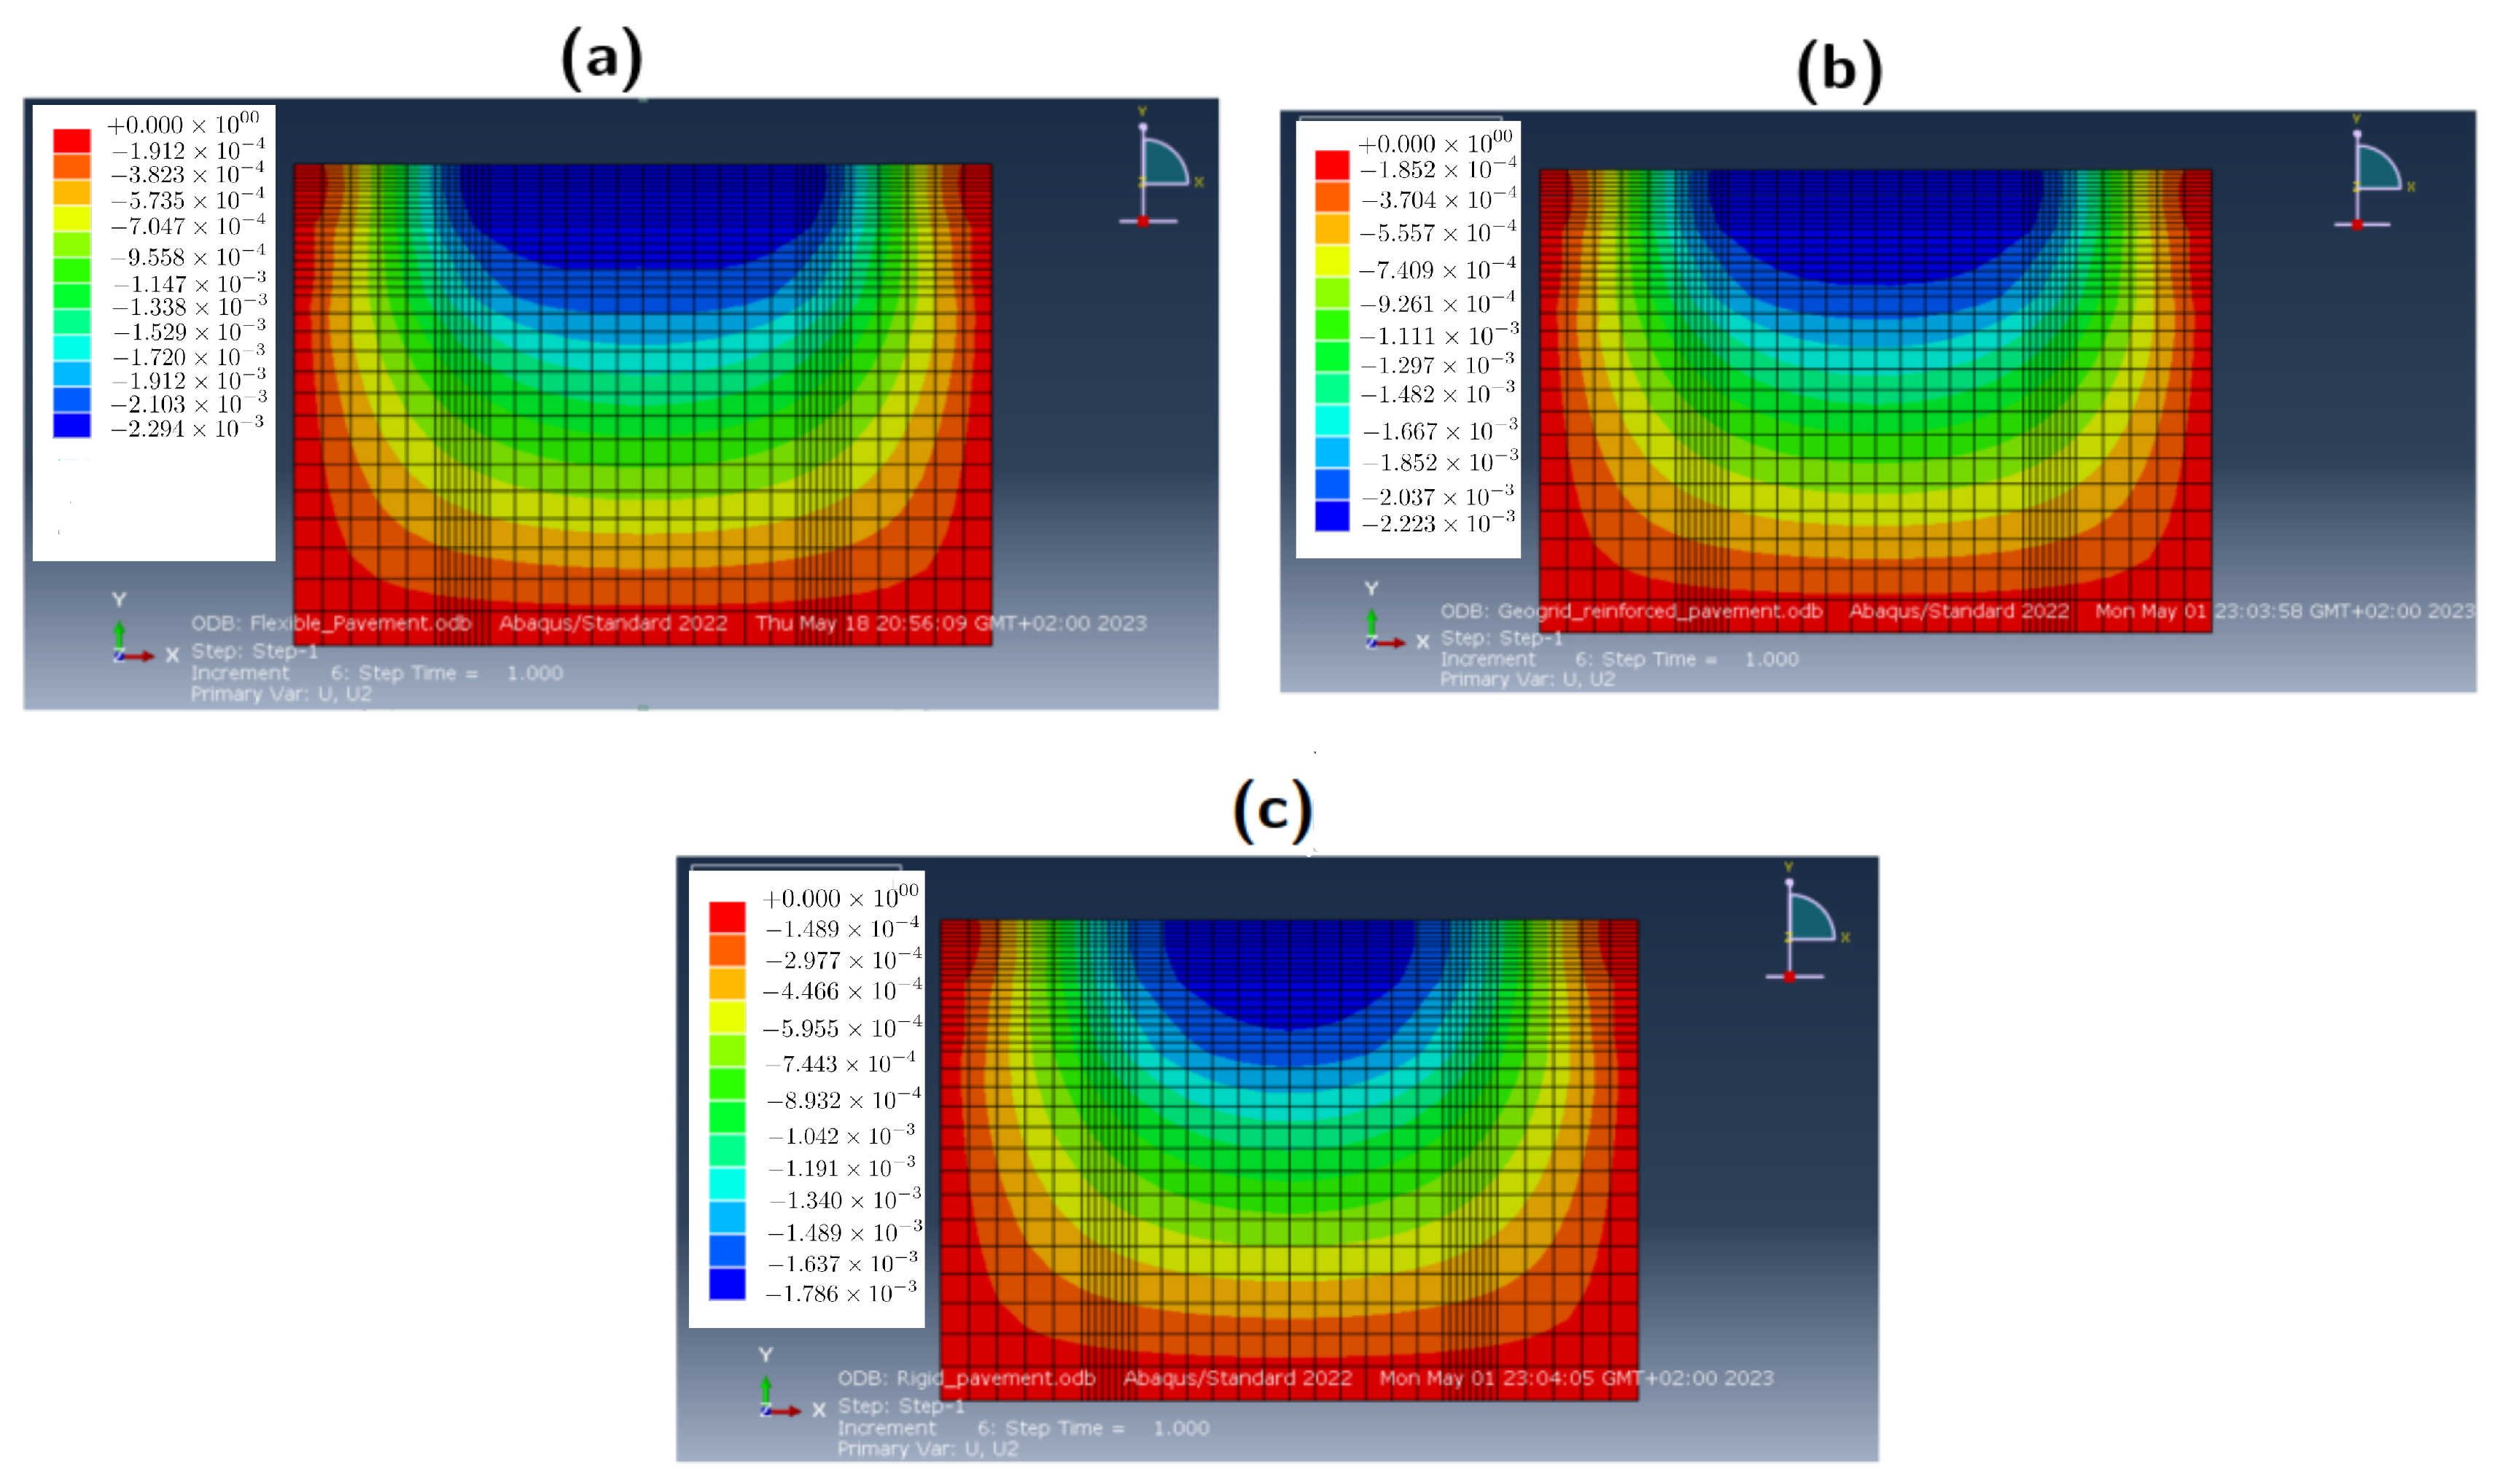
Figure 10 presents a comparative analysis of the vertical stress distribution among the different scenarios. Notably, a concentration of stresses beneath the wheels (indicated in intense blue) is prominently observed in
Figure 10a, signifying significant compression in the case of the flexible pavement. This stress concentration extends deep into the soil, as indicated by the green coloration representing its propagation.
Further, there is an area along the shoulders exhibiting tensile pressures (depicted in red), with stress propagation (illustrated in orange) evident in its vicinity.
In the case of reinforced flexible pavements (
Figure 10b), a similar behavior to that of the standard flexible pavement is observed, with a concentration of compressive stresses beneath the wheels (red) and pressure leading to tensile stresses along the pavement edges. However, a notable distinction arises within the geogrid layer, where one of its advantages becomes evident, namely, the dampening of various pressures. The stress diffusion is more uniform, and extends to a greater depth (indicated in green), effectively alleviating the load on the soil and mitigating the risk of soil rupture.
In contrast, for rigid pavements nearly uniform compression is observed across the entire pavement width, with minimal stress diffusion into the soil and only slight tensile stresses along the pavement edges (
Figure 10c). This behavior is attributed to the rigid pavement structure’s ability to absorb a substantial portion of the applied load.
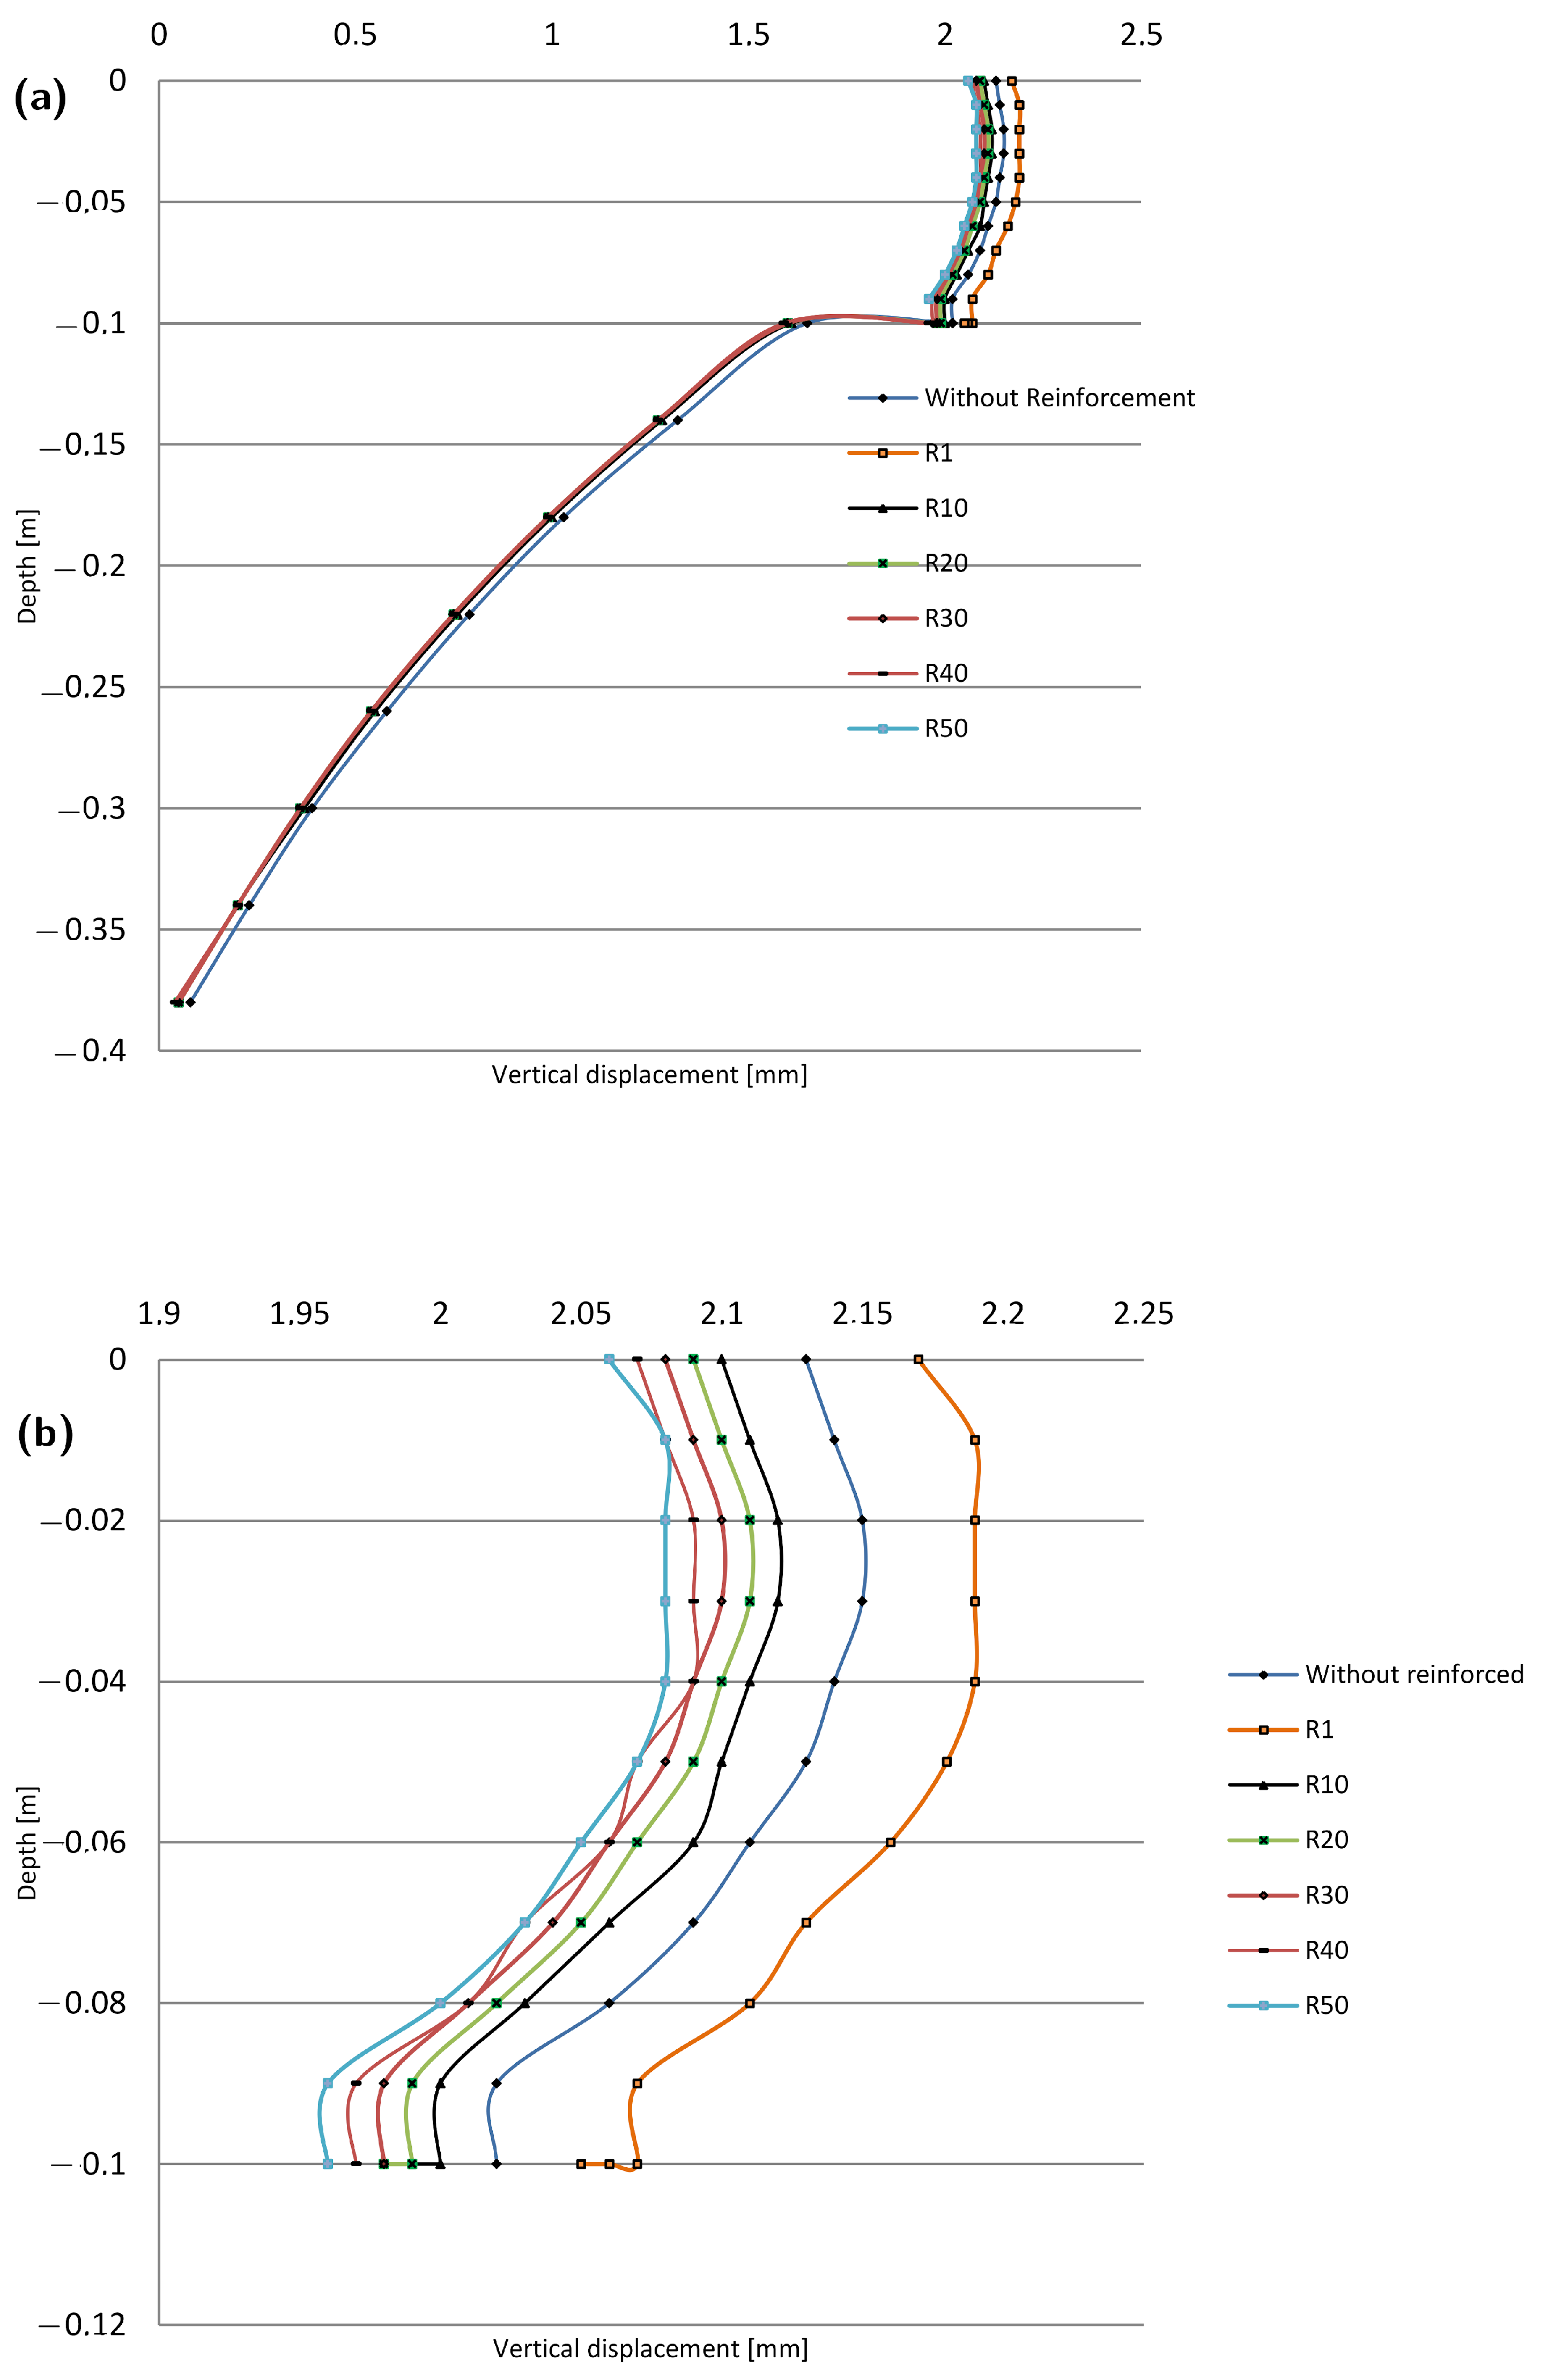
Rigid pavements are renowned for their remarkable durability, which is due to their high rigidity. By incorporating geogrids into the structure of flexible pavements, it becomes possible to attain the performance characteristics associated with rigid pavements. Among the most influential factors, two critical parameters are the stiffness of the reinforcing materials and the soil, the stiffness of which is contingent upon its composition. As our goal was to replicate the behavior of rigid pavements by manipulating the soil characteristics and type of geogrid employed with flexible pavements, we conducted a series of tests to investigate changes in the stiffness ratio between the soil and geogrid using values of 0, 1, 10, 20, 30, 40, and 50, then analyzed the results (
Figure 11).
When the ratio of total vertical displacement to surface displacement is graphed against the ratio of geogrid stiffness to ground stiffness, it yields the data points depicted in
Figure 12. Polynomial regression analysis establishes a mathematical relationship that depends on soil type, geogrid placement, and geogrid properties, with a correlation coefficient of
. This allows the optimal vertical displacement ratio to be determined based on the chosen geogrid-to-soil stiffness ratio, thereby approximating the performance characteristics observed in rigid pavements.
Overall, our findings demonstrate that geosynthetics can extend the service life of pavements and enhance the behavior of flexible pavements, bringing them closer to the characteristics of rigid pavements. This rigid behavior offers several advantages in terms of durability, road surface quality, and more while simultaneously mitigating the high maintenance costs associated with rigid pavements.
4. Conclusions
In summary, this research involved numerical simulations with Abaqus software that allowed us to understand how pavement structures behave in conjunction with the surrounding soil. By analyzing stress and strain parameters, this study illuminates the profound influence of geosynthetics on the overall performance of road infrastructure.
Our investigation has unveiled a range of benefits associated with incorporating geosynthetics. These advantages encompass a reduction in vertical displacement, a significant alleviation of vertical stresses coupled with soil relief, decreased sensitivity to radial stresses, and a noteworthy decrease in stresses at the interface within areas subject to stretching and compression.
Despite the proven effectiveness of rigid pavements in various regions, their widespread adoption faces challenges due to a shortage of specialized expertise and skilled labor. The substantial costs associated with rigid pavements have contributed to hesitancy in altering established construction, maintenance, and rehabilitation practices.
In this research, we aimed to capitalize on the benefits of rigid pavements by enhancing the performance of flexible pavements by incorporating geogrid reinforcement to achieve similar characteristics. Preliminary findings have demonstrated a substantial reduction in deformations, marking a significant advancement in pavement behavior. A comprehensive grasp of deformation assessment methodologies is crucial to effectively monitoring and predicting pavement performance, even during the design phase.
Currently, reinforced flexible pavements are emerging as a practical solution, particularly in regions where the widespread adoption of rigid pavements encounters challenges.


