
Industrial Carbon Footprint (ICF) Calculation Approach Based on Bayesian Cross-Validation Improved Cyclic Stacking


Abstract
:1. Introduction
- (1)
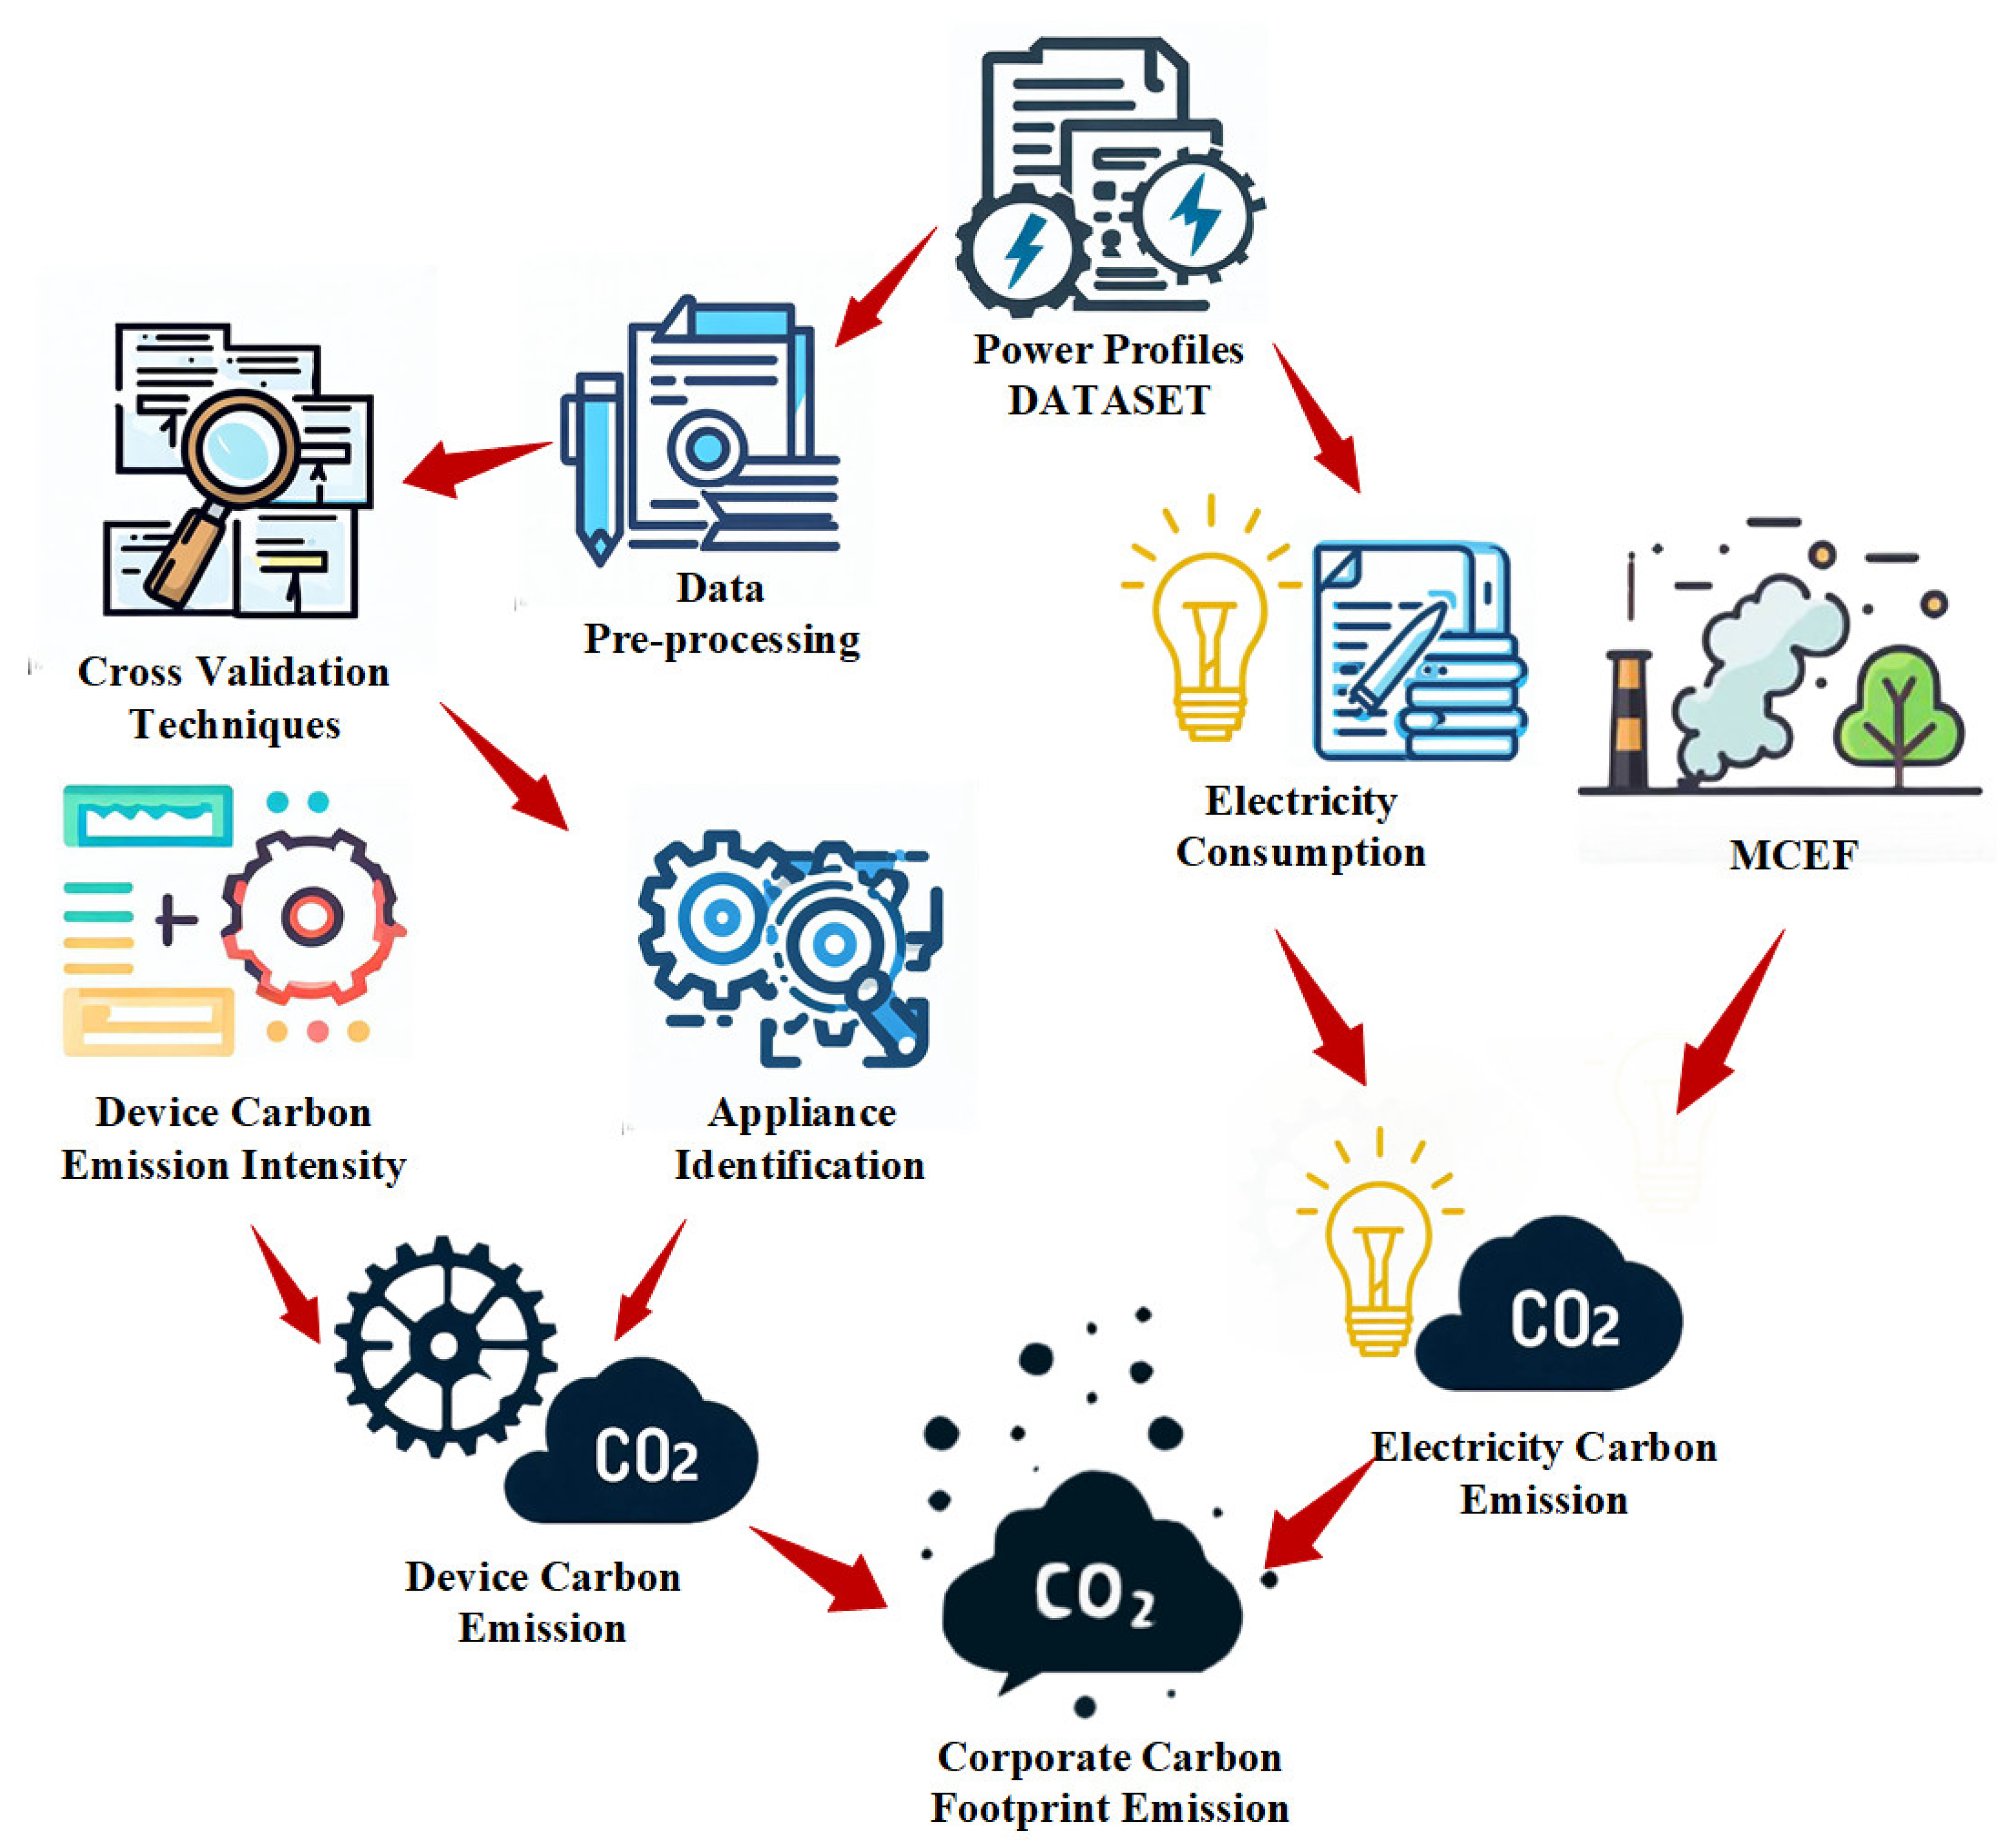
- A real-time ICF calculation approach is proposed, which divides the carbon emissions of the factory into two categories. The appliance identification method and the technique for calculating MCEF based on DC-OPF are used, respectively, for calculation to obtain the total ICF calculation.
- (2)
- In response to the problem of real-time carbon emission calculation, an appliance identification approach based on Bayesian cross-validation improved cyclic stacking is proposed. This method can accurately monitor the state of the device and estimate the carbon emissions of the device with high precision. Moreover, based on the study of the characteristics of the operation state of industrial devices, a device state correction link SHMM is proposed to correct the appliance identification results.
- (3)
- A total of 7 cross-validation techniques and 14 machine learning models are compared to determine the artificial intelligence models and cross-validation technique required for the appliance identification model.
2. Related Works
2.1. ICF Calculation
2.2. Nonintrusive Load Monitoring
3. Materials and Methods
3.1. ICF Calculation Approach Statement
3.2. Appliance Identification Technology
3.3. Algorithm Selection
3.3.1. LightGBM
3.3.2. XGBoost
3.3.3. Random Forest
3.3.4. Extreme Learning Machine
3.3.5. KNN
3.3.6. AdaBoost
3.3.7. Multilayer Perceptron
3.3.8. Support Vector Classifier
3.3.9. Feed-Forward Network
3.3.10. Decision Tree
3.3.11. Gradient Boosting
3.3.12. Gaussian Processes
3.3.13. Naïve Bayes
3.3.14. CNN
3.4. Electricity Carbon Emission Calculation Method
4. Experiments
4.1. Data Description and Analysis
4.2. Experimental Indicators
4.3. Experiment Setup
5. Results and Analysis
5.1. Algorithm Selection Results
5.2. Appliance Identification Results
5.3. Statistics for Justification
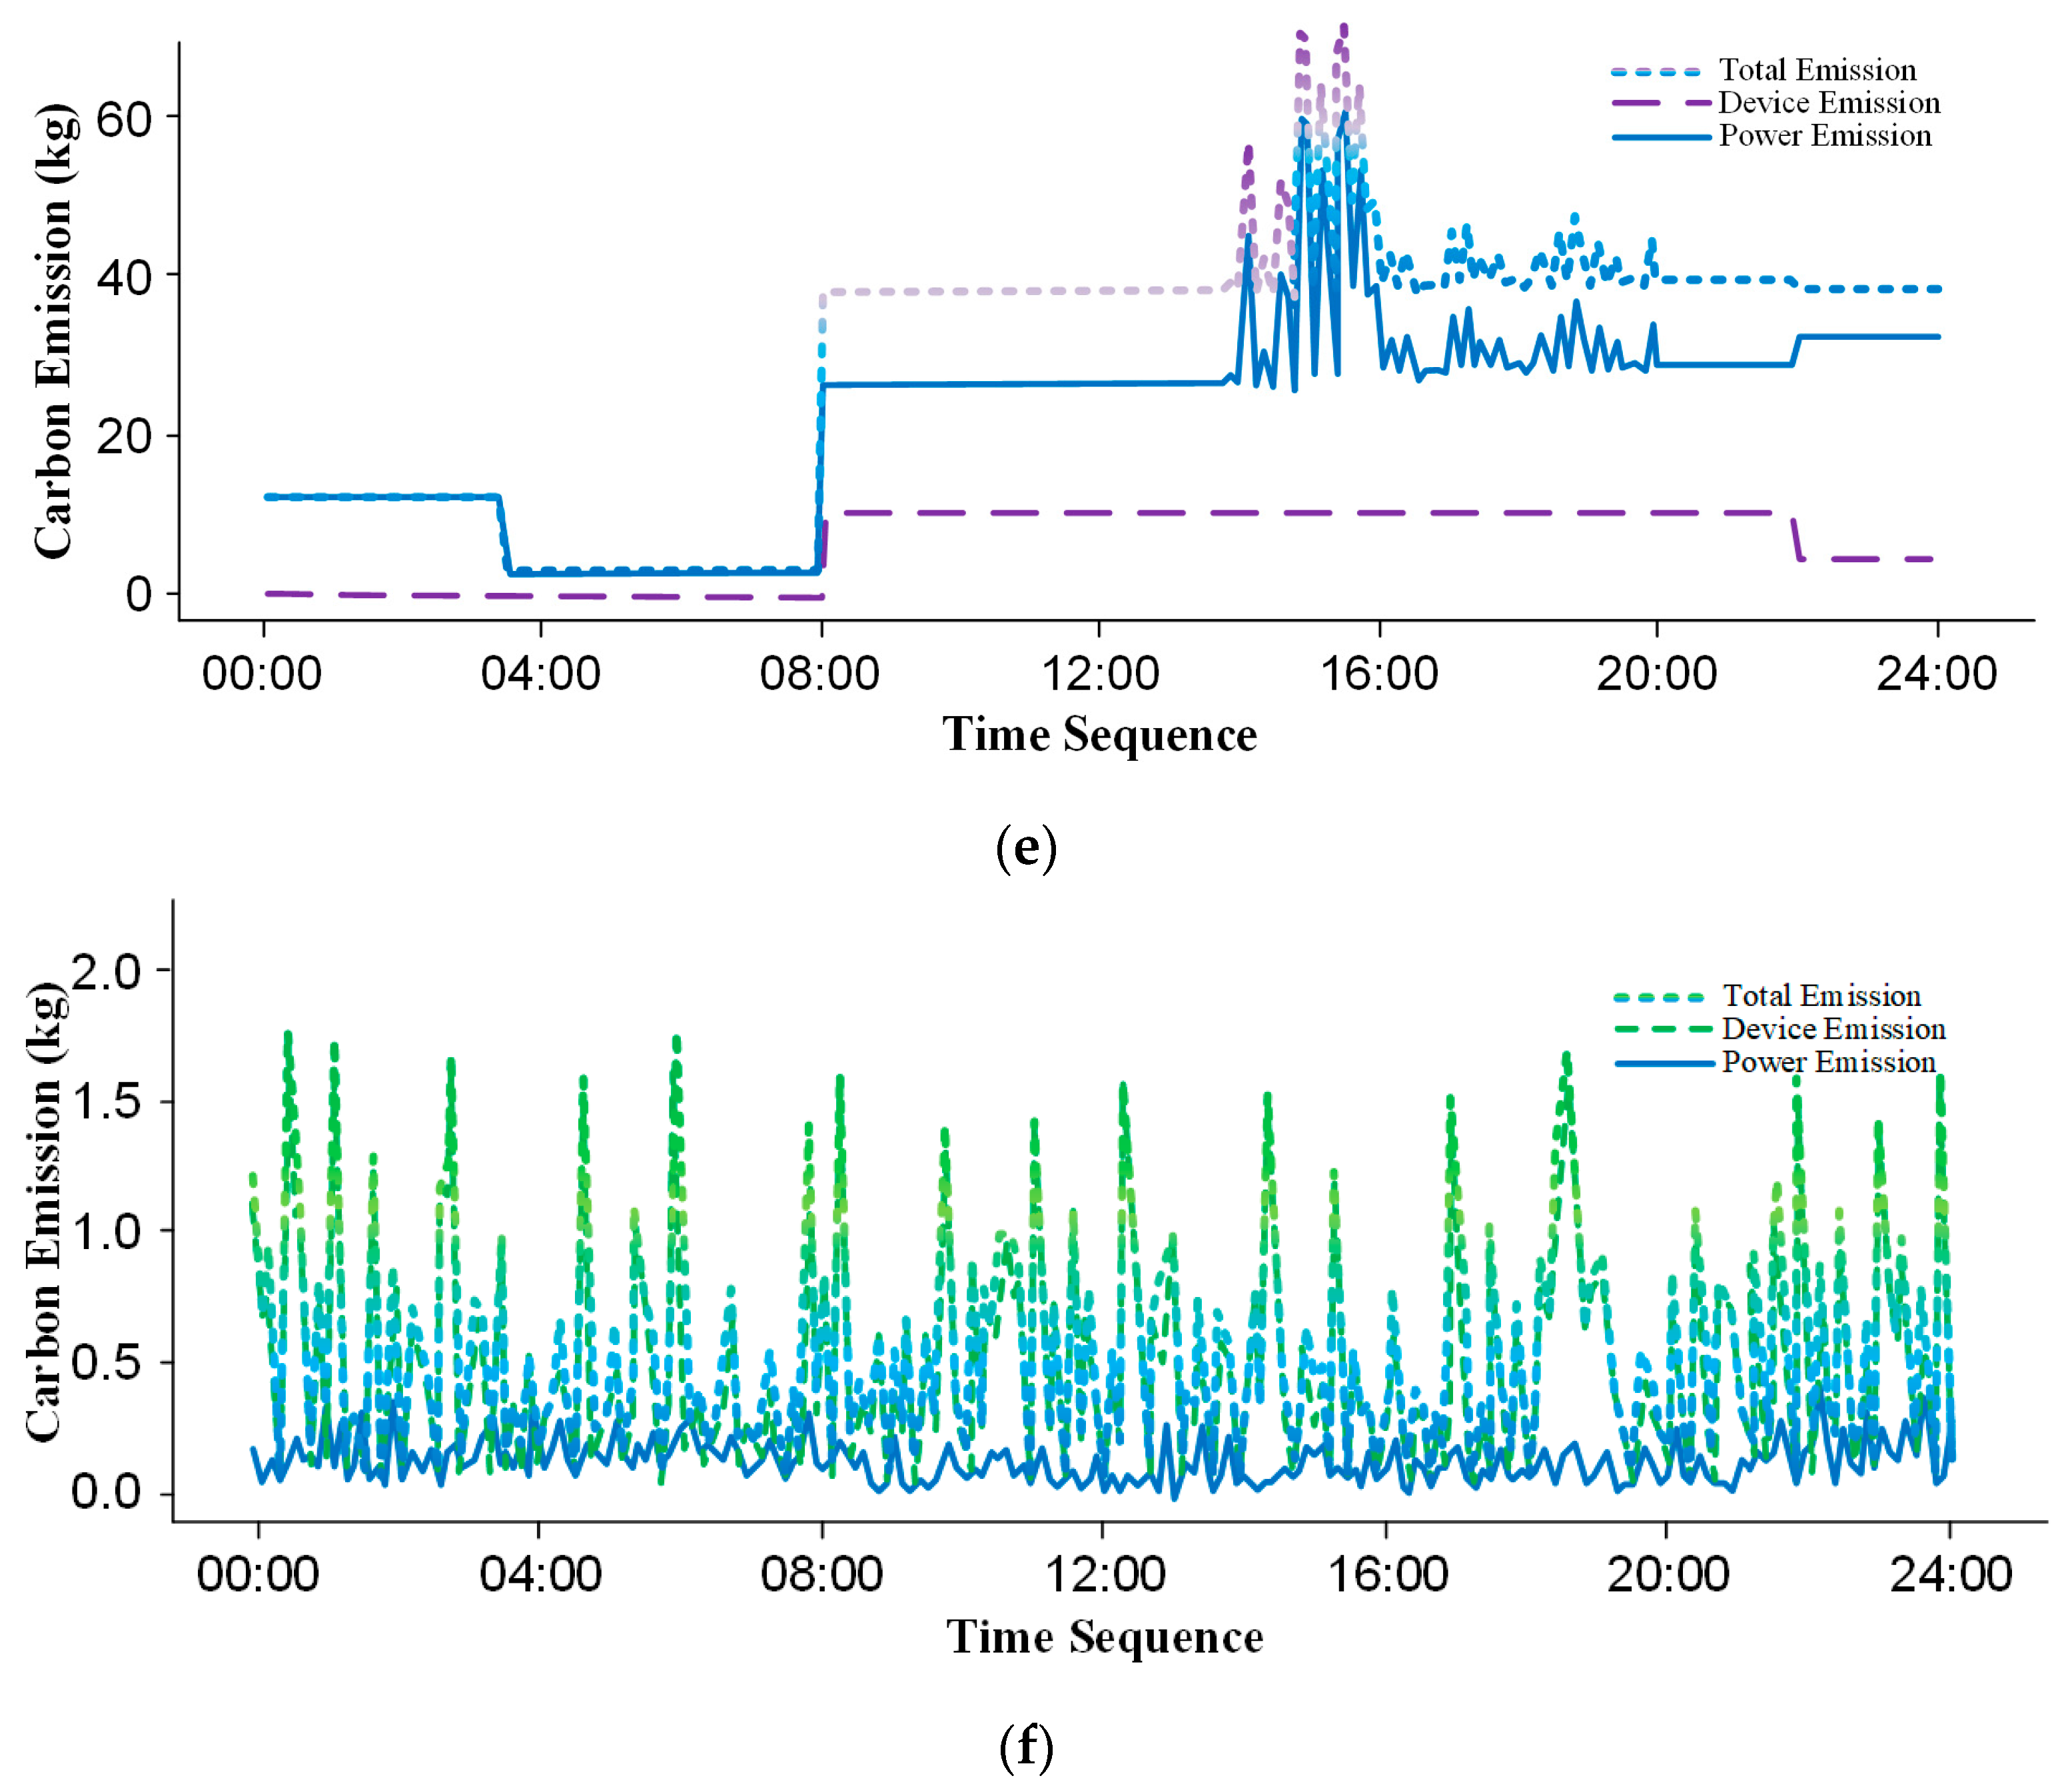
5.4. ICF Calculation Results
6. Conclusions
Author Contributions
Funding
Data Availability Statement
Acknowledgments
Conflicts of Interest
Appendix A

| Models | Description |
|---|---|
| K-Fold | A dataset is divided into k subsets, and the learned model is then tested on the remaining subsets. Each of the “k” subsamples is utilized precisely once as validation data after the cross-validation technique has been applied k times. The k estimates may then be averaged [60]. |
| Leave-P-Out | Cross-validation uses P samples from the sample set as the test set and the remainder of the samples as the training set. It requires n area samples, and takes times to train and test the model. The sample set is denoted by S. This is carried out again until the original sample is clipped on the training dataset and the validation data of p observations [61]. |
| Leave-One-Out | In leave-p-out cross-validation, the value of P is set to one. |
| Hold-Out | Data points are randomly assigned to the training set and the test set. Each set’s size is arbitrary, but often, the test set is smaller than the training set. After that, the set is tested on test data and then trained using test data [62]. |
| Repeated K-Fold | All that is needed is to repeatedly execute the Cross-Validation approach and provide the mean outcome across all folds from all runs. A high number of calculations is always desired to provide trustworthy performance calculation or comparison [60]. |
| Stratified K-Fold | Stratified folds are produced by the cross-validation class, a K-fold variation. The folds are produced by maintaining a consistent proportion of observations for each class. This ensures that each dataset fold has the same percentage of instances with each label. When seeking to make inferences from multiple sub-groups or strata, stratified sampling is a typical sampling strategy [63]. |
| Monte Carlo | The dataset is randomly split into training and validation data using Monte Carlo cross-validation. The model is fitted to the training instances for each such split, and the anticipated accuracy is determined using the validation data. The outcomes of the splits are then averaged [64]. |
Appendix B
| Model | Accuracy | Precision | Recall | F1 Score | Kappa |
|---|---|---|---|---|---|
| KNN Classifier | 0.91 | 0.78 | 0.87 | 0.82 | 0.74 |
| AdaBoost Classifier | 0.90 | 0.88 | 0.83 | 0.85 | 0.79 |
| Random Forest Classifier | 0.93 | 0.89 | 0.91 | 0.90 | 0.85 |
| Multilayer Perceptron | 0.71 | 0.80 | 0.84 | 0.82 | 0.62 |
| Support Vector Classifier | 0.89 | 0.76 | 0.89 | 0.81 | 0.68 |
| Feed-Forward Network | 0.82 | 0.67 | 0.81 | 0.73 | 0.69 |
| Decision Tree Classifier | 0.91 | 0.87 | 0.84 | 0.85 | 0.82 |
| Gradient Boosting | 0.93 | 0.93 | 0.92 | 0.92 | 0.90 |
| Gaussian Processes | 0.73 | 0.75 | 0.68 | 0.71 | 0.73 |
| Naïve Bayes | 0.86 | 0.79 | 0.83 | 0.81 | 0.80 |
| Extreme Learning Machine | 0.78 | 0.74 | 0.80 | 0.76 | 0.65 |
| CNN | 0.83 | 0.82 | 0.85 | 0.83 | 0.81 |
| LightGBM | 0.89 | 0.74 | 0.76 | 0.75 | 0.72 |
| XGBoost | 0.94 | 0.83 | 0.87 | 0.85 | 0.78 |
Appendix C
| Model | CV Technique | Accuracy | Precision | Recall | F1 Score | Kappa |
|---|---|---|---|---|---|---|
| KNN Classifier | K-Fold | 0.93 | 0.81 | 0.87 | 0.83 | 0.79 |
| Leave-P-Out | 0.73 | 0.53 | 0.75 | 0.62 | 0.41 | |
| Leave-One-Out | 0.99 | 0.98 | 0.98 | 0.98 | 0.99 | |
| Hold-Out | 0.92 | 0.79 | 0.89 | 0.84 | 0.72 | |
| Repeated K-Fold | 0.90 | 0.78 | 0.85 | 0.81 | 0.71 | |
| Stratified K-Fold | 0.95 | 0.83 | 0.86 | 0.84 | 0.75 | |
| Monte Carlo | 0.91 | 0.78 | 0.82 | 0.80 | 0.83 | |
| AdaBoost Classifier | K-Fold | 0.96 | 0.92 | 0.96 | 0.94 | 0.92 |
| Leave-P-Out | 0.75 | 0.58 | 0.77 | 0.66 | 0.52 | |
| Leave-One-Out | 0.99 | 0.99 | 0.99 | 0.99 | 0.99 | |
| Hold-Out | 0.93 | 0.89 | 0.91 | 0.90 | 0.85 | |
| Repeated K-Fold | 0.96 | 0.99 | 0.97 | 0.98 | 0.90 | |
| Stratified K-Fold | 0.96 | 0.98 | 0.96 | 0.97 | 0.91 | |
| Monte Carlo | 0.94 | 0.90 | 0.86 | 0.88 | 0.82 | |
| Random Forest Classifier | K-Fold | 0.98 | 0.96 | 0.98 | 0.97 | 0.95 |
| Leave-P-Out | 0.97 | 0.95 | 0.98 | 0.97 | 0.94 | |
| Leave-One-Out | 0.99 | 0.99 | 0.99 | 0.99 | 0.99 | |
| Hold-Out | 0.93 | 0.81 | 0.91 | 0.85 | 0.78 | |
| Repeated K-Fold | 0.99 | 0.97 | 0.99 | 0.98 | 0.96 | |
| Stratified K-Fold | 0.98 | 0.95 | 0.98 | 0.97 | 0.94 | |
| Monte Carlo | 0.99 | 0.96 | 0.99 | 0.97 | 0.96 | |
| Multilayer Perceptron | K-Fold | 0.85 | 0.81 | 0.76 | 0.78 | 0.68 |
| Leave-P-Out | 0.82 | 0.92 | 0.65 | 0.76 | 0.47 | |
| Leave-One-Out | 0.79 | 0.82 | 0.70 | 0.76 | 0.56 | |
| Hold-Out | 0.90 | 0.88 | 0.83 | 0.85 | 0.79 | |
| Repeated K-Fold | 0.83 | 0.79 | 0.83 | 0.81 | 0.65 | |
| Stratified K-Fold | 0.91 | 0.84 | 0.83 | 0.83 | 0.70 | |
| Monte Carlo | 0.78 | 0.73 | 0.82 | 0.78 | 0.62 | |
| Support Vector Classifier | K-Fold | 0.81 | 0.75 | 0.81 | 0.78 | 0.72 |
| Leave-P-Out | 0.75 | 0.70 | 0.83 | 0.76 | 0.65 | |
| Leave-One-Out | 0.90 | 0.77 | 0.87 | 0.82 | 0.74 | |
| Hold-Out | 0.76 | 0.83 | 0.70 | 0.76 | 0.64 | |
| Repeated K-Fold | 0.82 | 0.79 | 0.75 | 0.77 | 0.61 | |
| Stratified K-Fold | 0.81 | 0.78 | 0.81 | 0.80 | 0.74 | |
| Monte Carlo | 0.88 | 0.82 | 0.84 | 0.83 | 0.82 | |
| Feed-Forward Network | K-Fold | 0.83 | 0.78 | 0.75 | 0.76 | 0.63 |
| Leave-P-Out | 0.80 | 0.91 | 0.63 | 0.74 | 0.38 | |
| Leave-One-Out | 0.94 | 0.90 | 0.92 | 0.92 | 0.85 | |
| Hold-Out | 0.77 | 0.80 | 0.68 | 0.74 | 0.58 | |
| Repeated K-Fold | 0.81 | 0.76 | 0.81 | 0.79 | 0.69 | |
| Stratified K-Fold | 0.89 | 0.80 | 0.80 | 0.80 | 0.73 | |
| Monte Carlo | 0.76 | 0.71 | 0.81 | 0.76 | 0.65 | |
| Decision Tree Classifier | K-Fold | 0.88 | 0.85 | 0.87 | 0.86 | 0.75 |
| Leave-P-Out | 0.76 | 0.71 | 0.79 | 0.75 | 0.83 | |
| Leave-One-Out | 0.91 | 0.83 | 0.89 | 0.86 | 0.79 | |
| Hold-Out | 0.73 | 0.75 | 0.68 | 0.71 | 0.73 | |
| Repeated K-Fold | 0.89 | 0.86 | 0.82 | 0.84 | 0.74 | |
| Stratified K-Fold | 0.90 | 0.92 | 0.81 | 0.86 | 0.79 | |
| Monte Carlo | 0.90 | 0.83 | 0.94 | 0.87 | 0.82 | |
| Gradient Boosting | K-Fold | 0.92 | 0.81 | 0.90 | 0.85 | 0.86 |
| Leave-P-Out | 0.79 | 0.74 | 0.56 | 0.64 | 0.40 | |
| Leave-One-Out | 0.99 | 0.99 | 0.99 | 0.99 | 0.99 | |
| Hold-Out | 0.94 | 0.83 | 0.90 | 0.86 | 0.76 | |
| Repeated K-Fold | 0.93 | 0.79 | 0.83 | 0.81 | 0.76 | |
| Stratified K-Fold | 0.95 | 0.90 | 0.90 | 0.90 | 0.74 | |
| Monte Carlo | 0.91 | 0.78 | 0.82 | 0.80 | 0.80 | |
| Gaussian Processes | K-Fold | 0.78 | 0.77 | 0.72 | 0.75 | 0.67 |
| Leave-P-Out | 0.78 | 0.89 | 0.61 | 0.72 | 0.48 | |
| Leave-One-Out | 0.73 | 0.76 | 0.66 | 0.71 | 0.57 | |
| Hold-Out | 0.71 | 0.80 | 0.84 | 0.82 | 0.62 | |
| Repeated K-Fold | 0.80 | 0.75 | 0.75 | 0.75 | 0.60 | |
| Stratified K-Fold | 0.86 | 0.79 | 0.78 | 0.79 | 0.65 | |
| Monte Carlo | 0.75 | 0.78 | 0.69 | 0.73 | 0.50 | |
| Naïve Bayes | K-Fold | 0.89 | 0.87 | 0.83 | 0.85 | 0.83 |
| Leave-P-Out | 0.74 | 0.96 | 0.80 | 0.87 | 0.82 | |
| Leave-One-Out | 0.90 | 0.80 | 0.90 | 0.85 | 0.76 | |
| Hold-Out | 0.71 | 0.78 | 0.69 | 0.73 | 0.80 | |
| Repeated K-Fold | 0.86 | 0.83 | 0.81 | 0.82 | 0.83 | |
| Stratified K-Fold | 0.89 | 0.95 | 0.80 | 0.87 | 0.79 | |
| Monte Carlo | 0.82 | 0.80 | 0.94 | 0.87 | 0.79 | |
| Extreme Learning Machine | K-Fold | 0.76 | 0.79 | 0.71 | 0.75 | 0.77 |
| Leave-P-Out | 0.76 | 0.89 | 0.60 | 0.72 | 0.58 | |
| Leave-One-Out | 0.70 | 0.78 | 0.68 | 0.73 | 0.76 | |
| Hold-Out | 0.73 | 0.80 | 0.84 | 0.82 | 0.42 | |
| Repeated K-Fold | 0.78 | 0.79 | 0.64 | 0.75 | 0.66 | |
| Stratified K-Fold | 0.85 | 0.79 | 0.75 | 0.79 | 0.61 | |
| Monte Carlo | 0.74 | 0.78 | 0.65 | 0.71 | 0.55 | |
| CNN | K-Fold | 0.93 | 0.88 | 0.85 | 0.86 | 0.81 |
| Leave-P-Out | 0.86 | 0.79 | 0.87 | 0.82 | 0.74 | |
| Leave-One-Out | 0.90 | 0.83 | 0.85 | 0.84 | 0.61 | |
| Hold-Out | 0.91 | 0.78 | 0.89 | 0.82 | 0.69 | |
| Repeated K-Fold | 0.92 | 0.84 | 0.84 | 0.84 | 0.68 | |
| Stratified K-Fold | 0.91 | 0.87 | 0.89 | 0.88 | 0.75 | |
| Monte Carlo | 0.92 | 0.88 | 0.85 | 0.86 | 0.67 | |
| LightGBM | K-Fold | 0.96 | 0.92 | 0.92 | 0.92 | 0.89 |
| Leave-P-Out | 0.82 | 0.78 | 0.85 | 0.81 | 0.72 | |
| Leave-One-Out | 0.99 | 0.98 | 0.98 | 0.98 | 0.98 | |
| Hold-Out | 0.94 | 0.89 | 0.91 | 0.90 | 0.82 | |
| Repeated K-Fold | 0.94 | 0.86 | 0.91 | 0.88 | 0.82 | |
| Stratified K-Fold | 0.97 | 0.96 | 0.98 | 0.97 | 0.85 | |
| Monte Carlo | 0.94 | 0.86 | 0.90 | 0.88 | 0.83 | |
| XGBoost | K-Fold | 0.97 | 0.96 | 0.99 | 0.98 | 0.96 |
| Leave-P-Out | 0.98 | 0.98 | 0.98 | 0.98 | 0.95 | |
| Leave-One-Out | 0.99 | 0.99 | 0.99 | 0.99 | 0.82 | |
| Hold-Out | 0.89 | 0.76 | 0.89 | 0.81 | 0.68 | |
| Repeated K-Fold | 0.99 | 0.99 | 0.98 | 0.99 | 0.93 | |
| Stratified K-Fold | 0.98 | 0.98 | 0.98 | 0.98 | 0.96 | |
| Monte Carlo | 0.94 | 0.98 | 0.98 | 0.98 | 0.96 | |
| Proposed Stacking | K-Fold | 0.99 | 0.96 | 0.99 | 0.98 | 0.96 |
| Leave-P-Out | 0.99 | 0.98 | 0.98 | 0.98 | 0.95 | |
| Leave-One-Out | 0.99 | 0.99 | 0.99 | 0.99 | 0.82 | |
| Hold-Out | 0.89 | 0.76 | 0.89 | 0.81 | 0.68 | |
| Repeated K-Fold | 0.99 | 0.99 | 0.98 | 0.99 | 0.93 | |
| Stratified K-Fold | 0.99 | 0.98 | 0.98 | 0.98 | 0.96 | |
| Monte Carlo | 0.99 | 0.98 | 0.98 | 0.98 | 0.96 |
References
- Li, S.; Niu, L.; Yue, Q.; Zhang, T. Trajectory, driving forces, and mitigation potential of energy-related greenhouse gas (GHG) emissions in China’s primary aluminum industry. Energy 2022, 239, 122114. [Google Scholar] [CrossRef]
- Du, Y.; Guo, X.; Li, J.; Liu, Y.; Luo, J.; Liang, Y.; Li, T. Elevated carbon dioxide stimulates nitrous oxide emission in agricultural soils: A global meta-analysis. Pedosphere 2022, 32, 3–14. [Google Scholar] [CrossRef]
- Yin, K.; Liu, L.; Gu, H. Green paradox or forced emission reduction—The dual effects of environmental regulation on carbon emissions. Int. J. Environ. Res. Public Health 2022, 19, 11058. [Google Scholar] [CrossRef] [PubMed]
- Sun, W.; Huang, C. Predictions of carbon emission intensity based on factor analysis and an improved extreme learning machine from the perspective of carbon emission efficiency. J. Clean. Prod. 2022, 338, 130414. [Google Scholar] [CrossRef]
- Karakurt, I.; Aydin, G. Development of regression models to forecast the CO2 emissions from fossil fuels in the BRICS and MINT countries. Energy 2023, 263, 125650. [Google Scholar] [CrossRef]
- Liu, G.; Liu, J.; Zhao, J.; Qiu, J.; Mao, Y.; Wu, Z.; Wen, F. Real-time corporate carbon footprint estimation methodology based on appliance identification. IEEE Trans. Ind. Inform. 2022, 19, 1401–1412. [Google Scholar] [CrossRef]
- Zhang, L.; Yan, Y.; Xu, W.; Sun, J.; Zhang, Y. Carbon emission calculation and influencing factor analysis based on industrial big data in the “double carbon” era. Comput. Intell. Neurosci. 2022, 2022, 2815940. [Google Scholar] [CrossRef]
- Gao, P.; Yue, S.; Chen, H. Carbon emission efficiency of China’s industry sectors: From the perspective of embodied carbon emissions. J. Clean. Prod. 2021, 283, 124655. [Google Scholar] [CrossRef]
- Nguyen, Q.; Diaz-Rainey, I.; Kuruppuarachchi, D. Predicting corporate carbon footprints for climate finance risk analyses: A machine learning approach. Energy Econ. 2021, 95, 105129. [Google Scholar] [CrossRef]
- Babaeinejadsarookolaee, S.; Birchfield, A.; Christie, R.D.; Coffrin, C.; DeMarco, C.; Diao, R.; Ferris, M.; Fliscounakis, S.; Greene, S.; Huang, R. The power grid library for benchmarking ac optimal power flow algorithms. arXiv 2019, arXiv:1908.02788. [Google Scholar]
- Yin, L.; Sharifi, A.; Liqiao, H.; Jinyu, C. Urban carbon accounting: An overview. Urban Clim. 2022, 44, 101195. [Google Scholar] [CrossRef]
- Müller, L.J.; Kätelhön, A.; Bringezu, S.; McCoy, S.; Suh, S.; Edwards, R.; Sick, V.; Kaiser, S.; Cuéllar-Franca, R.; El Khamlichi, A. The carbon footprint of the carbon feedstock CO2. Energy Environ. Sci. 2020, 13, 2979–2992. [Google Scholar] [CrossRef]
- Zheng, J.; Suh, S. Strategies to reduce the global carbon footprint of plastics. Nat. Clim. Chang. 2019, 9, 374–378. [Google Scholar] [CrossRef]
- Aamir, M.; Bhatti, M.A.; Bazai, S.U.; Marjan, S.; Mirza, A.M.; Wahid, A.; Hasnain, A.; Bhatti, U.A. Predicting the Environmental Change of Carbon Emission Patterns in South Asia: A Deep Learning Approach Using BiLSTM. Atmosphere 2022, 13, 2011. [Google Scholar] [CrossRef]
- Fang, D.; Zhang, X.; Yu, Q.; Jin, T.C.; Tian, L. A novel method for carbon dioxide emission forecasting based on improved Gaussian processes regression. J. Clean. Prod. 2018, 173, 143–150. [Google Scholar] [CrossRef]
- Saleh, C.; Dzakiyullah, N.R.; Nugroho, J.B. Carbon dioxide emission prediction using support vector machine. In Proceedings of the IOP Conference Series: Materials Science and Engineering, Bali, Indonesia, 19–20 March 2016; p. 012148. [Google Scholar]
- Bakay, M.S.; Ağbulut, Ü. Electricity production based forecasting of greenhouse gas emissions in Turkey with deep learning, support vector machine and artificial neural network algorithms. J. Clean. Prod. 2021, 285, 125324. [Google Scholar] [CrossRef]
- Maino, C.; Misul, D.; Di Mauro, A.; Spessa, E. A deep neural network based model for the prediction of hybrid electric vehicles carbon dioxide emissions. Energy AI 2021, 5, 100073. [Google Scholar] [CrossRef]
- Han, Z.; Li, J.; Hossain, M.M.; Qi, Q.; Zhang, B.; Xu, C. An ensemble deep learning model for exhaust emissions prediction of heavy oil-fired boiler combustion. Fuel 2022, 308, 121975. [Google Scholar] [CrossRef]
- Carlsson, L.S.; Samuelsson, P.B.; Jönsson, P.G. Interpretable machine learning—Tools to interpret the predictions of a machine learning model predicting the electrical energy consumption of an electric arc furnace. Steel Res. Int. 2020, 91, 2000053. [Google Scholar] [CrossRef]
- Liu, G.; Liu, J.; Zhao, J.; Wen, F.; Xue, Y. A real-time estimation framework of carbon emissions in steel plants based on load identification. In Proceedings of the 2020 International Conference on Smart Grids and Energy Systems (SGES), Perth, Australia, 23–26 November 2020; pp. 988–993. [Google Scholar]
- Angelis, G.-F.; Timplalexis, C.; Krinidis, S.; Ioannidis, D.; Tzovaras, D. NILM applications: Literature review of learning approaches, recent developments and challenges. Energy Build. 2022, 261, 111951. [Google Scholar] [CrossRef]
- Ruano, A.; Hernandez, A.; Ureña, J.; Ruano, M.; Garcia, J. NILM techniques for intelligent home energy management and ambient assisted living: A review. Energies 2019, 12, 2203. [Google Scholar] [CrossRef]
- Faustine, A.; Pereira, L.; Bousbiat, H.; Kulkarni, S. UNet-NILM: A deep neural network for multi-tasks appliances state detection and power estimation in NILM. In Proceedings of the 5th International Workshop on Non-Intrusive Load Monitoring, Online, 18 November 2020; pp. 84–88. [Google Scholar]
- Dinesh, C.; Makonin, S.; Bajić, I.V. Residential power forecasting using load identification and graph spectral clustering. IEEE Trans. Circuits Syst. II Express Briefs 2019, 66, 1900–1904. [Google Scholar] [CrossRef]
- Le, T.-T.-H.; Kim, H. Non-intrusive load monitoring based on novel transient signal in household appliances with low sampling rate. Energies 2018, 11, 3409. [Google Scholar] [CrossRef]
- Harell, A.; Makonin, S.; Bajić, I.V. Wavenilm: A causal neural network for power disaggregation from the complex power signal. In Proceedings of the ICASSP 2019—2019 IEEE International Conference on Acoustics, Speech and Signal Processing (ICASSP), Brighton, UK, 12–17 May 2019; pp. 8335–8339. [Google Scholar]
- Çimen, H.; Wu, Y.; Wu, Y.; Terriche, Y.; Vasquez, J.C.; Guerrero, J.M. Deep learning-based probabilistic autoencoder for residential energy disaggregation: An adversarial approach. IEEE Trans. Ind. Inform. 2022, 18, 8399–8408. [Google Scholar] [CrossRef]
- Bejarano, G.; DeFazio, D.; Ramesh, A. Deep latent generative models for energy disaggregation. In Proceedings of the AAAI Conference on Artificial Intelligence, Honolulu, HI, USA, 27 January–1 February 2019; pp. 850–857. [Google Scholar]
- Regan, J.; Saffari, M.; Khodayar, M. Deep attention and generative neural networks for nonintrusive load monitoring. Electr. J. 2022, 35, 107127. [Google Scholar] [CrossRef]
- Kaselimi, M.; Doulamis, N.; Voulodimos, A.; Doulamis, A.; Protopapadakis, E. EnerGAN++: A generative adversarial gated recurrent network for robust energy disaggregation. IEEE Open J. Signal Process. 2020, 2, 1–16. [Google Scholar] [CrossRef]
- Pan, Y.; Liu, K.; Shen, Z.; Cai, X.; Jia, Z. Sequence-to-subsequence learning with conditional gan for power disaggregation. In Proceedings of the ICASSP 2020—2020 IEEE International Conference on Acoustics, Speech and Signal Processing (ICASSP), Barcelona, Spain, 4–8 May 2020; pp. 3202–3206. [Google Scholar]
- D’Incecco, M.; Squartini, S.; Zhong, M. Transfer learning for non-intrusive load monitoring. IEEE Trans. Smart Grid 2019, 11, 1419–1429. [Google Scholar] [CrossRef]
- Gopinath, R.; Kumar, M.; Joshua, C.P.C.; Srinivas, K. Energy management using non-intrusive load monitoring techniques–State-of-the-art and future research directions. Sustain. Cities Soc. 2020, 62, 102411. [Google Scholar] [CrossRef]
- Srinivasan, K.; Cherukuri, A.K.; Vincent, D.R.; Garg, A.; Chen, B.-Y. An efficient implementation of artificial neural networks with K-fold cross-validation for process optimization. J. Internet Technol. 2019, 20, 1213–1225. [Google Scholar]
- Greenhill, S.; Rana, S.; Gupta, S.; Vellanki, P.; Venkatesh, S. Bayesian optimization for adaptive experimental design: A review. IEEE Access 2020, 8, 13937–13948. [Google Scholar] [CrossRef]
- Mor, B.; Garhwal, S.; Kumar, A. A systematic review of hidden Markov models and their applications. Arch. Comput. Methods Eng. 2021, 28, 1429–1448. [Google Scholar] [CrossRef]
- Soloviev, V.; Feklin, V. Non-life Insurance Reserve Prediction Using LightGBM Classification and Regression Models Ensemble. In Cyber-Physical Systems: Intelligent Models and Algorithms; Springer: Berlin/Heidelberg, Germany, 2022; pp. 181–188. [Google Scholar]
- Yin, Z.; Shi, L.; Luo, J.; Xu, S.; Yuan, Y.; Tan, X.; Zhu, J. Pump Feature Construction and Electrical Energy Consumption Prediction Based on Feature Engineering and LightGBM Algorithm. Sustainability 2023, 15, 789. [Google Scholar] [CrossRef]
- Fatahi, R.; Nasiri, H.; Homafar, A.; Khosravi, R.; Siavoshi, H.; Chehreh Chelgani, S. Modeling operational cement rotary kiln variables with explainable artificial intelligence methods–a “conscious lab” development. Part. Sci. Technol. 2023, 41, 715–724. [Google Scholar] [CrossRef]
- Chelgani, S.C.; Nasiri, H.; Tohry, A.; Heidari, H. Modeling industrial hydrocyclone operational variables by SHAP-CatBoost-A “conscious lab” approach. Powder Technol. 2023, 420, 118416. [Google Scholar] [CrossRef]
- Wang, X.; Li, J.; Shao, L.; Liu, H.; Ren, L.; Zhu, L. Short-Term Wind Power Prediction by an Extreme Learning Machine Based on an Improved Hunter–Prey Optimization Algorithm. Sustainability 2023, 15, 991. [Google Scholar] [CrossRef]
- Kherif, O.; Benmahamed, Y.; Teguar, M.; Boubakeur, A.; Ghoneim, S.S. Accuracy improvement of power transformer faults diagnostic using KNN classifier with decision tree principle. IEEE Access 2021, 9, 81693–81701. [Google Scholar] [CrossRef]
- Hu, G.; Yin, C.; Wan, M.; Zhang, Y.; Fang, Y. Recognition of diseased Pinus trees in UAV images using deep learning and AdaBoost classifier. Biosyst. Eng. 2020, 194, 138–151. [Google Scholar] [CrossRef]
- Alnuaim, A.A.; Zakariah, M.; Shukla, P.K.; Alhadlaq, A.; Hatamleh, W.A.; Tarazi, H.; Sureshbabu, R.; Ratna, R. Human-computer interaction for recognizing speech emotions using multilayer perceptron classifier. J. Healthc. Eng. 2022, 2022, 6005446. [Google Scholar] [CrossRef]
- Alam, S.; Sonbhadra, S.K.; Agarwal, S.; Nagabhushan, P. One-class support vector classifiers: A survey. Knowl.-Based Syst. 2020, 196, 105754. [Google Scholar] [CrossRef]
- Hu, M.; Gao, R.; Suganthan, P.N.; Tanveer, M. Automated layer-wise solution for ensemble deep randomized feed-forward neural network. Neurocomputing 2022, 514, 137–147. [Google Scholar] [CrossRef]
- Priyanka; Kumar, D. Decision tree classifier: A detailed survey. Int. J. Inf. Decis. Sci. 2020, 12, 246–269. [Google Scholar]
- Khan, M.S.I.; Islam, N.; Uddin, J.; Islam, S.; Nasir, M.K. Water quality prediction and classification based on principal component regression and gradient boosting classifier approach. J. King Saud Univ.-Comput. Inf. Sci. 2022, 34, 4773–4781. [Google Scholar]
- Xiao, G.; Cheng, Q.; Zhang, C. Detecting travel modes using rule-based classification system and Gaussian process classifier. IEEE Access 2019, 7, 116741–116752. [Google Scholar] [CrossRef]
- Chen, H.; Hu, S.; Hua, R.; Zhao, X. Improved naive Bayes classification algorithm for traffic risk management. EURASIP J. Adv. Signal Process. 2021, 2021, 1–12. [Google Scholar] [CrossRef]
- Deng, J.; Cheng, L.; Wang, Z. Attention-based BiLSTM fused CNN with gating mechanism model for Chinese long text classification. Comput. Speech Lang. 2021, 68, 101182. [Google Scholar] [CrossRef]
- Schram, W.; Lampropoulos, I.; AlSkaif, T.; Van Sark, W.; Helfert, M.; Klein, C.; Donnellan, B. On the use of average versus marginal emission factors. In Proceedings of the SMARTGREENS 2019—Proceedings of the 8th International Conference on Smart Cities and Green ICT Systems, Heraklion, Greece, 3–5 May 2019; pp. 187–193. [Google Scholar]
- Risi, B.-G.; Riganti-Fulginei, F.; Laudani, A. Modern techniques for the optimal power flow problem: State of the art. Energies 2022, 15, 6387. [Google Scholar] [CrossRef]
- Zhu, J.; Cao, J.; Saxena, D.; Jiang, S.; Ferradi, H. Blockchain-empowered federated learning: Challenges, solutions, and future directions. ACM Comput. Surv. 2023, 55, 1–31. [Google Scholar] [CrossRef]
- Qasim, R.; Bangyal, W.H.; Alqarni, M.A.; Ali Almazroi, A. A fine-tuned BERT-based transfer learning approach for text classification. J. Healthc. Eng. 2022, 2022, 3498123. [Google Scholar] [CrossRef] [PubMed]
- Kousounadis-Knousen, M.A.; Bazionis, I.K.; Georgilaki, A.P.; Catthoor, F.; Georgilakis, P.S. A Review of Solar Power Scenario Generation Methods with Focus on Weather Classifications, Temporal Horizons, and Deep Generative Models. Energies 2023, 16, 5600. [Google Scholar] [CrossRef]
- Mobasher-Kashani, M.; Noman, N.; Chalup, S. Parallel lstm architectures for non-intrusive load monitoring in smart homes. In Proceedings of the 2020 IEEE Symposium Series on Computational Intelligence (SSCI), Canberra, Australia, 1–4 December 2020; pp. 1272–1279. [Google Scholar]
- Jung, A.; Hanika, J.; Dachsbacher, C. Detecting Bias in Monte Carlo Renderers using Welch’s t-test. J. Comput. Graph. Tech. Vol 2020, 9, 1–25. [Google Scholar] [CrossRef]
- Wong, T.-T.; Yeh, P.-Y. Reliable accuracy estimates from k-fold cross validation. IEEE Trans. Knowl. Data Eng. 2019, 32, 1586–1594. [Google Scholar] [CrossRef]
- Liu, S. Leave-p-Out Cross-Validation Test for Uncertain Verhulst-Pearl Model with Imprecise Observations. IEEE Access 2019, 7, 131705–131709. [Google Scholar] [CrossRef]
- Tanner, E.M.; Bornehag, C.-G.; Gennings, C. Repeated holdout validation for weighted quantile sum regression. MethodsX 2019, 6, 2855–2860. [Google Scholar] [CrossRef] [PubMed]
- Prusty, S.; Patnaik, S.; Dash, S.K. SKCV: Stratified K-fold cross-validation on ML classifiers for predicting cervical cancer. Front. Nanotechnol. 2022, 4, 972421. [Google Scholar] [CrossRef]
- Malone, F.D.; Benali, A.; Morales, M.A.; Caffarel, M.; Kent, P.R.; Shulenburger, L. Systematic comparison and cross-validation of fixed-node diffusion Monte Carlo and phaseless auxiliary-field quantum Monte Carlo in solids. Phys. Rev. B 2020, 102, 161104. [Google Scholar] [CrossRef]


| Model | Hyperparameters Set |
|---|---|
| XGBoost | learning_rate = 1.5 gamma = 0 max_depth = 2 min_child_weight = 4 subsample = 1 colsample_bytree = 1 |
| Random Forest Classifier | min_sample_split = 2 max_depth = 3 |
| LightGBM | learning_rate = 1 max_depth = 5 num_leaves = 19 min_data_in_leaf = 23 |
| AdaBoost Classifier | n_estimators = 50 learning_rate = 12 max_depth = 1 |
| KNN Classifier | n_neighbors = 5 weights = ’uniform’ algorithm = ’auto’ |
| CNN Classifier | filters = 64 kernel_size = (3,3) dropout_rate = 0.7 activation_function = ’rule’ |
| Model | MAPE | Standard Deviation |
|---|---|---|
| Proposed Stacking | 2.67% | 3.29 |
| XGBoost | 2.84% | 4.12 |
| Random Forest Classifier | 2.91% | 3.76 |
| LightGBM | 3.51% | 10.13 |
| AdaBoost Classifier | 4.79% | 4.81 |
| KNN Classifier | 6.32% | 3.93 |
| CNN Classifier | 8.14% | 7.38 |
| Models | Description | Accuracy (%) |
|---|---|---|
| Federated Learning | FL is an alternative that keeps stored all the required data locally on devices and trains a shared model, without the need to centrally store it [55]. | 0.94 |
| Transfer Learning | The work in [56] explores transfer learning in energy disaggregation from different aspects. | 0.91 |
| DGM | Deep generative models (DGMs) are a type of deep neural network that is trained in a large amount of data and tries to synthesize high-dimensional distributions [57]. | 0.87 |
| Parallel-LSTMs | Ref. [58] proposed two architectures with parallel LSTM stacks for appliance power consumption calculation. | 0.86 |
| Models (t-Value|p-Value) | Proposed Stacking | XGBoost | Random Forest | LightGBM | AdaBoost | KNN |
|---|---|---|---|---|---|---|
| Proposed Stacking | 0|1 | 8.52|3.41 × 10⁻⁷ | 5.39|0.032 | 6.23|0.015 | 3.61|2.32 × 10⁻⁴ | 6.73|4.41 × 10⁻⁵ |
| XGBoost | −8.52|3.41 × 10⁻⁷ | 0|1 | 4.07|0.021 | 3.82|1.87 × 10⁻⁵ | 7.26|0.029 | 3.27|1.88 × 10⁻⁴ |
| Random Forest | −5.39|0.032 | −4.07|0.021 | 0|1 | 2.66|0.031 | 4.09|0.027 | 1.62|0.023 |
| LightGBM | −6.23|0.015 | −3.82|1.87 × 10⁻⁵ | −2.66|0.031 | 0|1 | 5.13|1.09 × 10⁻⁶ | 6.11|0.016 |
| AdaBoost | −3.61|2.32 × 10⁻⁴ | −7.26|0.029 | −4.09|0.027 | −5.13|1.09 × 10⁻⁶ | 0|1 | 1.03|0.042 |
| KNN | −6.73|4.41 × 10⁻⁵ | −3.27|1.88 × 10⁻⁴ | −1.62|0.023 | −6.11|0.016 | −1.03|0.042 | 0|1 |
Disclaimer/Publisher’s Note: The statements, opinions and data contained in all publications are solely those of the individual author(s) and contributor(s) and not of MDPI and/or the editor(s). MDPI and/or the editor(s) disclaim responsibility for any injury to people or property resulting from any ideas, methods, instructions or products referred to in the content. |
© 2023 by the authors. Licensee MDPI, Basel, Switzerland. This article is an open access article distributed under the terms and conditions of the Creative Commons Attribution (CC BY) license (https://creativecommons.org/licenses/by/4.0/).
Share and Cite
Xie, Y.; Zhou, B.; Wang, Z.; Yang, B.; Ning, L.; Zhang, Y. Industrial Carbon Footprint (ICF) Calculation Approach Based on Bayesian Cross-Validation Improved Cyclic Stacking. Sustainability 2023, 15, 14357. https://doi.org/10.3390/su151914357
Xie Y, Zhou B, Wang Z, Yang B, Ning L, Zhang Y. Industrial Carbon Footprint (ICF) Calculation Approach Based on Bayesian Cross-Validation Improved Cyclic Stacking. Sustainability. 2023; 15(19):14357. https://doi.org/10.3390/su151914357
Chicago/Turabian StyleXie, Yichao, Bowen Zhou, Zhenyu Wang, Bo Yang, Liaoyi Ning, and Yanhui Zhang. 2023. "Industrial Carbon Footprint (ICF) Calculation Approach Based on Bayesian Cross-Validation Improved Cyclic Stacking" Sustainability 15, no. 19: 14357. https://doi.org/10.3390/su151914357
APA StyleXie, Y., Zhou, B., Wang, Z., Yang, B., Ning, L., & Zhang, Y. (2023). Industrial Carbon Footprint (ICF) Calculation Approach Based on Bayesian Cross-Validation Improved Cyclic Stacking. Sustainability, 15(19), 14357. https://doi.org/10.3390/su151914357