Article

Causal Analysis of Safety Risk Perception of Iranian Coal Mining Workers Using Fuzzy Delphi and DEMATEL

by
Mitra Hannani
1,
Marc Bascompta
2,
Mojtaba Gerami Sabzevar
1,
Hesam Dehghani
3 and
Ali Asghar Khajevandi
1,*
1
Occupational Health and Safety Department, Kashan University of Medical Sciences, Isfahan 73441, Iran
2
Department of Mining, Industrial and ICT Engineering, Polytechnic University of Catalonia, 08034 Barcelona, Spain
3
Department of Mine Engineering, Hamedan University of Technology, Hamedan 65155, Iran
*
Author to whom correspondence should be addressed.
Sustainability 2023, 15(19), 14277; https://doi.org/10.3390/su151914277
Submission received: 1 August 2023 / Revised: 21 September 2023 / Accepted: 25 September 2023 / Published: 27 September 2023

Abstract

:
Underground coal mines, one of the most dangerous work environments, have experienced accidents and disasters. One of the main reasons for those unsafe events is the workers’ poor understanding of the hazards and risks of working in this work environment. Therefore, the present study aims to identify factors affecting the safety risk perception of underground coal mine workers in Iran and investigate their cause-and-effect relationships. By reviewing the literature, 40 variables were identified in five categories: individual, organizational, environmental, task, and external factors. The identified variables were ranked according to the expert group’s opinion in the form of a fuzzy Delphi study regarding their effects on risk perception. In the next step, 23 variables were selected to investigate the cause-and-effect relationships using the DEMATEL method. The study’s findings showed that organizational factors and some individual factors play a fundamental role in workers’ risk perception. The variables of safety culture, safety management style, and safety attitude had the most significant impact, and the variables of personal protective equipment and risk aversion had the smallest impact on workers’ risk perception. The present study’s findings can be used as a guideline to provide effective solutions for managers and workers in improving safety risk perception, subsequently reducing unsafe behaviors and increasing the safety status of underground coal mines.

1. Introduction

Underground coal mines are considered one of the most dangerous work environments that have experienced fatalities [1]. The working environment in underground mines can be stressful and entail hazardous conditions due to its intrinsic characteristics [2], classifying the workplace as high-risk [3,4,5,6,7,8]. Among the most critical risks, we can mention the collision with layers of gas such as methane, explosive operations, use of machines and conveyor belts, enclosed spaces, roof collapse, and coal oxidation processes [9]. The history of the activities of these mines has commonly been associated with unfortunate events. In addition to the human casualties of the accidents, we can mention the occupational diseases of the workers of these mines, which have resulted in many direct and indirect costs [10]. In recent years, despite the significant reduction in accidents in these mines, the complexity of these accidents has increased significantly [11]. Many studies point to the significant role of human errors in the occurrence of accidents in mines [12,13,14,15,16]. Geng et al. [17] considered the geological complexities and insufficient skills of workers in this sector as the main reasons for accidents in underground mines. A study conducted by the U.S. Department of Mines showed that human error is the cause of about 85% of mining accidents [18]. Mohammadfam et al. [19] reported that workers’ errors are the most important cause of mining accidents. They attribute only 15% of accident-related factors to unsafe conditions. One of the most important factors affecting human errors and occupational accidents is the workers’ incorrect risk perception of the position and the working conditions [20]. Correct risk perception (RP) significantly promotes employees’ awareness of risk management and, ultimately, workers’ safety, while incorrect risk perception causes dangerous behaviors in workers [21]. Perception of the risk and recognition of occupational accidents are essential to minimize the damage caused by risks [22]. RP is an assessment or subjective judgment of the probability of a specific accident and its consequences [23]. RP is very important in safety, health, and environmental issues, and many occupational accidents happen because employees do not have proper and correct risk perceptions of their work environment [24]. Many studies have been done in relation to the factors affecting the perception of risk and unsafe acts.

2. Literature Review

Findings by Chen et al. [25] showed that the factors affecting unsafe behaviors in mines could be classified into four categories: physiological, psychological, organizational, and technological. They introduced physical quality, fatigue level, safety attitude, safety awareness, and safety culture as the most important factors identified in these four categories. Qiami et al. [26] identified a significant and direct relationship between the sources and level of occupational stress and occupational accidents, and the RP score for workers with accident experience was significantly higher than for workers who had not experienced an accident. One of the essential results of this research is demonstrating the dependence of RP on people’s experience of accidents and safety issues in the surrounding environment. The transfer of experience and the development of an educational program based on experience-based learning effectively increase people’s risk perception and, accordingly, strengthen their reactive approach to workplace events, directly affecting the number and severity of occupational accidents. Yeganeh et al. [27] studied the factors affecting workers’ risk perception using the DEMATEL method. The study’s findings showed that safety knowledge, quality and quantity of safety training, and safety climate had the greatest impact on RP. A study by Ding et al. [28] was conducted on the topic of understanding the risk of COVID-19 among college students in China during quarantine and related factors. The study showed a significant relationship between demographic characteristics, social pressure, knowledge, and RP. The results of a study by Pandit et al. [29] revealed that safety climate affected hazard recognition performance, which in turn affected safety risk perception levels. The study of Saeed Khajavi et al. [30] showed that the relationship between the perception of the risk of occupational accidents and the performance of safety management is meaningful and positive. Based on the obtained results, it was found that the perception of positive risk is related to the reduction of risk exposure. Also, safety management can effectively improve risk perception in the workplace. This study provides a framework for RP managers’ macro-planning to protect workers and prevent occupational accidents. For instance, Asivandzadeh et al. [31] showed that safety training significantly impacts all components of safety culture and empowers workers in relation to risk perception of hazardous work situations at height. Shezeen et al. [32] verified that workload and accident experience have a positive effect and safety leadership and safety climate have a negative effect on cognitive and emotional risk perception. In addition, Senay et al. [33] stated that factors such as risk perception, risk management, communication between workers, lack of information, fatigue, high self-confidence due to experience, making more profit due to working faster, and worker training are the main factors affecting unsafe behaviors. Nielsen et al. [34] also showed that high levels of RP are related to low levels of job satisfaction. A higher safety climate causes more job satisfaction, and a safety climate mediates the relationship between RP and job satisfaction [34]. The study by Jahangiri et al. [35] showed that increasing the risk perception in construction workers could improve their safety attitude and performance. The findings of Sa et al. [36] showed that the causes of unsafe behavior can be divided into four groups: (1) unsafe conditions in the work environment, (2) skill and training of workers, (3) poor safety management and supervision, and (4) classified organizational factors. This study showed that practical organizational measures taken by management can increase workers’ commitment to ensuring safety and performing safe behaviors in the workplace.
However, RP is among the most important factors affecting human errors and unsafe behaviors in many sectors, including mining [37]. Many variables have an effect on the risk perception of workers in mines, all of which cannot be controlled by organizations due to financial and time constraints. Therefore, using experts’ judgments to identify the most important variables is a suitable strategy [38].

Problem Statement and Study Contributions

Iran is considered one of the largest mineral countries in the world [39], and suffered one of the most critical incidents in an underground coal mine. This incident happened on 13 May 2016 in the Yurt coal mine, Azadshahr City, Golestan province. In this incident, 43 people died and many were hospitalized under medical care due to carbon monoxide poisoning.
The leading cause of this accident was failure of a diesel engine. The results of the analysis of this catastrophic accident, citing the ignition of the locomotive’s diesel engine by a battery device in the scope of the work front, are reported. The critical point of this incident is that many of those killed had entered the mining area to help [40]. In connection with this vital incident, many questions and uncertainties still remain. For example, what background factors cause a person not to understand the hazards, probability, and consequences of his actions while performing an unsafe act? Alternatively, the miner and mine rescue team entered this dangerous environment regardless of the conditions created after the mine explosion. Identifying the factors affecting risk perception and providing control solutions considering the existing research gaps in this field can significantly prevent the occurrence of similar events in underground coal mines. Therefore, the present study aims to identify, categorize, and determine the cause–effect relationships of factors affecting the RP of underground coal mine workers.
Further, this study contributes to the literature in several ways:
  • Based on the research conducted, this study is one of the first to investigate the factors affecting the risk perception of underground coal mine workers, evaluate their interdependencies, and provide valuable insight into understanding the root causes of human error and unsafe behavior in underground coal mines.
  • In addition, providing control solutions helps managers, experts, and legal organizations understand the underlying factors of accidents and unfortunate events and improve underground mines’ safety management systems.

3. Materials and Methods

The present study was conducted based on the opinion of experts and using multi-criteria decision-making methods, fuzzy Delphi and DEMATEL. Multi-criteria decision-making techniques are one of the simple ways to solve complex human problems. Figure 1 shows the steps of conducting the study.

3.1. Extraction of Influential Factors on Risk Perception

The studies related to RP and the factors affecting it were extracted by determining the appropriate search strategy from reliable citation databases, such as Web of Science and Scopus, according to the accuracy and breadth of information coverage in the study area. Finally, by holding a focus group with experts in the field of safety of underground coal mines, 40 factors affecting risk perception were selected and categorized into five groups: individual, organizational, external, environmental, and task factors as performance-influencing factors (PIFs). PIFs are factors that combine with basic human error tendencies to create error-like situations. These factors are the aspects of human behavior and the context (or environment) that can impact human performance [38,41].

3.2. Classification of Variables with the Fuzzy Delphi Method

3.2.1. The Fuzzy Delphi Method

After specifying effective variables, selecting the main variables affecting RP was necessary. This was done using the collective opinions of experts in underground coal mines based on the triangular fuzzy Delphi method. Multi-criteria decision-making methods are considered a suitable way to solve complex issues and problems with the consensus of experts in a subject area [42]. Combining the Delphi method with fuzzy logic eliminates the problems of the traditional Delphi method, such as the low level of agreement among experts, the long implementation time, and the high cost. There are different types of fuzzy numbers. Triangular fuzzy numbers (TFNs) are among the most practical ones. In this study, TFN is shown as A = (l, m, u), in which the lower bond is (l), the infimum is (m), and the upper bond is (u). Figure 2 shows the graphic representation of the fuzzy number A = (l, m, u).

3.2.2. Setting the Expert’s Panel

The identified factors were sent to 15 experts as a semi-structured questionnaire. The team of experts in the present study included a group of experts in the safety of underground coal mines, which were selected by a non-random method. The criteria for experts to enter the study included having at least five years of experience working in underground coal mines, knowledge and motivation, and the time required to respond.
After collecting the questionnaires, linguistic numbers were converted into fuzzy numbers according to Table 1.

3.2.3. Conducting Rounds 1 and 2 of the Fuzzy Delphi Study

This style of fuzzy Delphi study and the use of a Likert scale and open questions have been used in previous studies as a reliable method to collect experts’ opinions [42,43]. After the design stage, the initial questionnaire was given to three experts to eliminate ambiguities and defects and increase convergence (face validity). The first round of the fuzzy Delphi study ended with collecting and analyzing questionnaires. In the first stage of the fuzzy Delphi study, two other variables were suggested, and problems were introduced to some variables. In this study, the results of the Delphi study were analyzed based on the fuzzy Delphi method provided by Hsu and Yang [44]. In this method, by collecting experts’ opinions about each variable, a triangular fuzzy number is obtained as follows.
a ~ i = ( a i 1 , a i 2 , a i 3 )
a i 1 = M i n B i j
a i 3 = M a x B i j
a i 2 = ( k = 1 n B i j ) 1 n
In this fuzzy number, the lower limit ( a i 1 )and upper limit ( a i 3 ) are respectively the minimum and maximum value of experts’ opinions for each variable in the 5-point Likert scale. The median number ( a i 2 ) is also the geometric mean of experts’ opinions for that variable, which is obtained from Equation (1).
After this step, the TFN was de-fuzzied based on Equation (2) to compare the scores obtained for all the variables.
a i = 1 4 ( a i 1 + 2 a i 2 + a i 3 )
In the second stage, the questionnaire was sent to experts again by adding new variables and correcting bugs. There are two criteria for ending the fuzzy Delphi study rounds, one of which is to reach a high level of convergence among the participants, and if the appropriate level of agreement is not reached, the lack of new opinions by the participants is another sign for ending the fuzzy Delphi rounds [45,46]. Therefore, by analyzing the results of the second round, it was found that the specialists added no new variables, and after the end of the second round, fuzzy Delphi analysis was stopped.

3.2.4. Ranking of Variables

Variables were ranked based on the fuzzy score of each variable. In this way, any variable with a higher de-fuzzied score was more important regarding its effect on RP. The variables and criteria were screened based on the threshold limit, and the variables with a lower score than the threshold limit were considered less important variables and subsequently eliminated. Threshold limits have been set in different studies according to the importance of the subject and other conditions and according to the 5-point Likert scale. Yih (2010) used a value of “3.5” as the threshold for the geometric mean in a Likert scale questionnaire ranging from 1 to 5 [43]. However, the threshold limit can be determined based on the researcher’s opinions and goals [47]. In the present study, the threshold limit was considered three according to the used spectrum.

3.3. Determining the Cause-and-Effect Relationships of the Variables

3.3.1. DEMATEL Method

DEMATEL is one of the multi-criteria decision-making methods used to determine the cause-and-effect relationship between variables [42,48]; the GRCBM Institute invented it to study and solve complex problems through group decision-making [43,49]. This method determines the type and intensity of direct and indirect relations between the elements of a system [42]. The DEMATEL method was performed in four steps as follows [50]:
  • First step: forming a group of experts to collect their group knowledge about the relationship of variables. In this study, ten experts in the field of safety and hygiene of coal mines and risk perception participated in the study as an expert group. Individuals were invited and agreed to participate in the study through official correspondence.
  • Second step: determining the variables to be evaluated. In the first stage, the desired variables were determined through the fuzzy Delphi method, and a total of 23 variables were selected as the most important variables affecting risk perception from each of the sub-groups of external, organizational, task, environmental, and individual variables.
  • Third step: designing a questionnaire and forming a couple relationship matrix. The questionnaire was formed in the form of a 24 × 24 square matrix so that the experts could determine the relationship between the variables in pairs in the form of verbal expressions.
  • Fourth step: analyzing the results based on the DEMATEL method. This analysis is described in Section 3.3.1.

3.3.2. Forming the Matrix of Direct Relationships

  • After obtaining the experts’ opinions, the average matrix was generated (M). Likert scales ranging from 0 to 4 were employed, with the response choices indicating “no influence”, “little influence”, “medium influence”, “strong influence”, and “very strong influence”. In the next step, the overall average impact value was determined for all respondents (Table A1).
  • Calculating the normalized direct-relation matrix (M’):
The normalization procedure in the DEMATEL method consists of dividing the elements of the matrix of direct relations by the highest value of their linear sums, as in Equation (3):
M = λ · M
where:
λ = 1/the highest value of linear sums of matrix M,
M—matrix of direct relationships,
M’—a standardized matrix of direct relationships.
  • Calculate total-relation matrix (T) based on Equation (4):
    T = M I M 1
  • The values of R are obtained based on the components of the matrix of the total relationship for each variable based on Equations (5) and (6):
    J = J = 1 n t i j . j ˙ = 1 , 2 , 3 , n
    R = i = 1 n t i j . i ˙ = 1 , 2 , 3 , n
    where:
    tij = total (direct and indirect) influence from indicator i to indicator j, and
    n = the number of indicators.
  • The values of J + R and J − R were calculated, and the cause-and-effect relationships between the variables were drawn. The value of J + R is placed on the x-axis and J − R on the y-axis.

4. Results

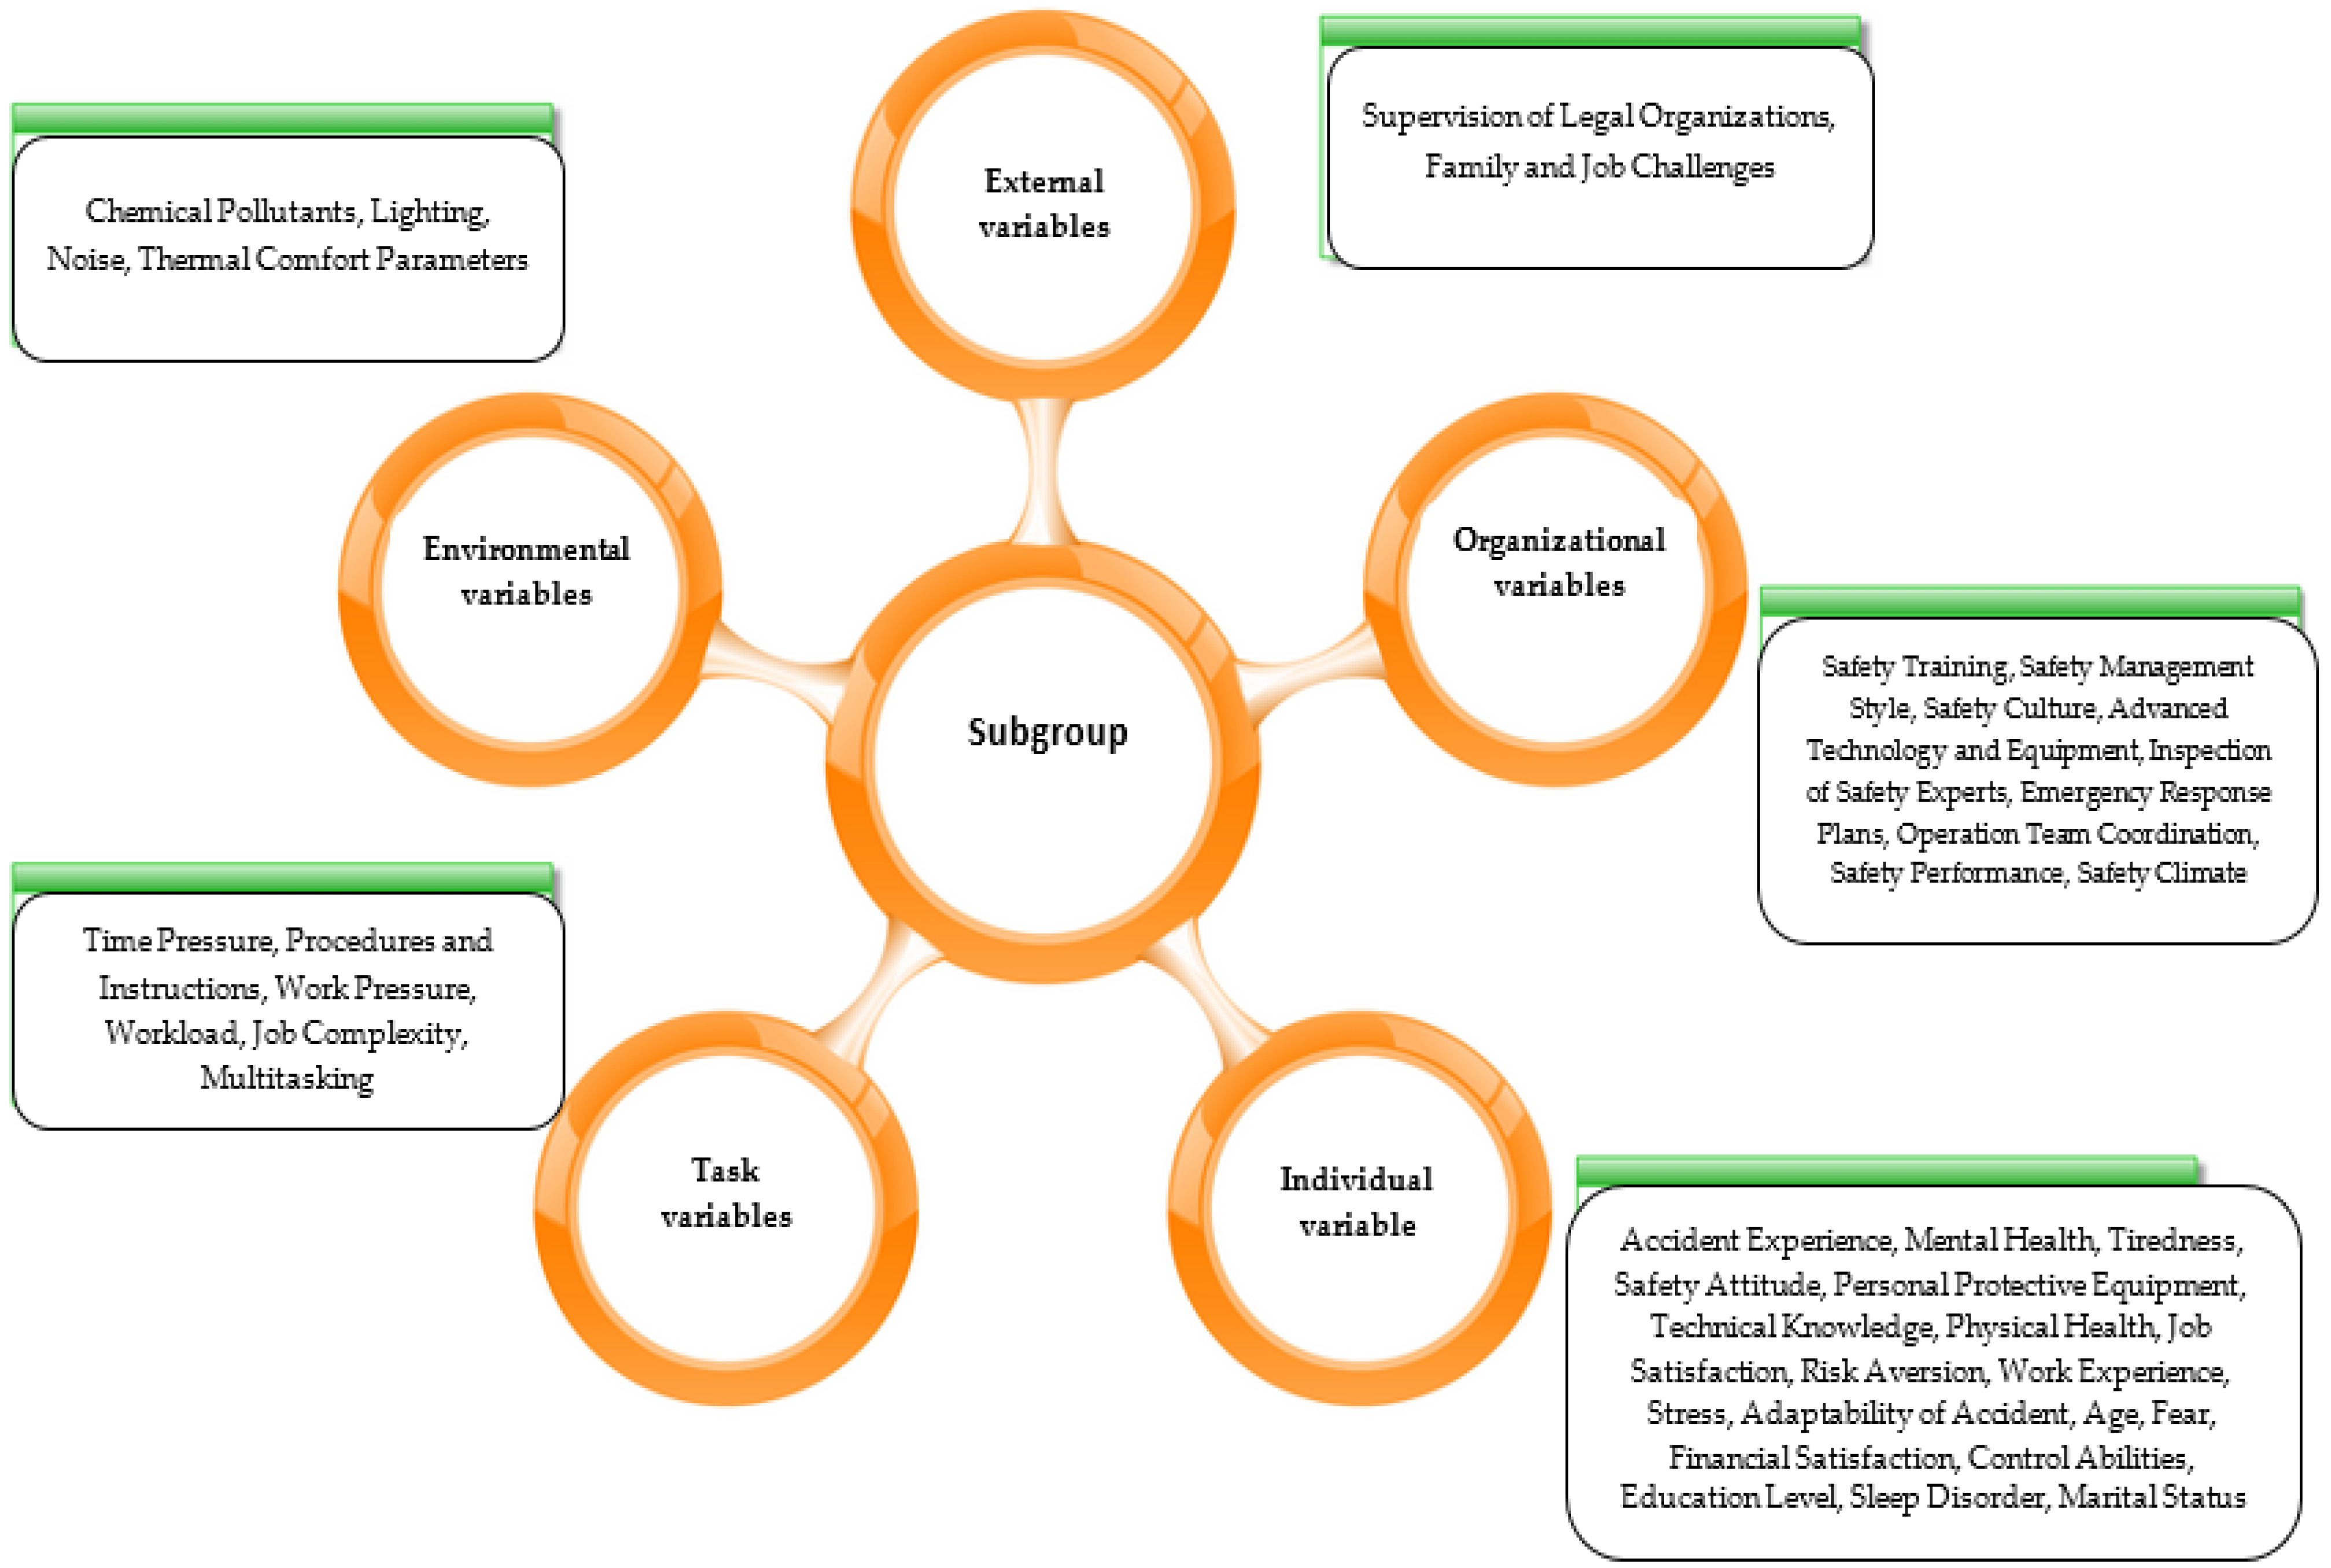
As previously detailed, a comprehensive list of variables affecting the RP of coal mine workers was identified by reviewing the literature for this field and categorized into five categories: individual, organizational, external, task, and environmental factors (Figure 3).

4.1. Ranking Variables Affecting Risk Perception

Based on the results obtained from the fuzzy Delphi study, factors such as safety training, “accident experience”, “time pressure”, “chemical pollutants (methane gas, etc.)”, and “monitoring by legal organizations“ were identified as the most influential factors in the risk perception of coal mine workers in Iran. Based on the findings of the fuzzy Delphi study, from the experts’ point of view, in the group of organizational factors, the three variables “safety training”, “safety management style”, and “safety culture“ had the strongest effect, respectively, and the variables “safety performance“ and “safety atmosphere“ had the weakest effect on risk perception. In the group of extra-organizational factors, the variable “supervision of legal organizations“ had the highest score, and the variable “family and job challenges“ had the lowest score. In the group of environmental factors, the variables “chemical pollutants“ and “lighting“ had the greatest effect, and the variable “thermal comfort parameters“ had the lowest importance for risk perception. In the group of job factors, two variables, “time pressure“ and “procedures and instructions”, had the highest ranking, and “job complexity“ and “multitasking“ had the lowest importance for RP. The variables “accident experience“ and “mental health“ in the group of individual factors had the greatest effect, and “level of education“ and “marital status“ had the weakest effect on risk perception.

4.2. Determining the Cause-and-Effect Relationships among Variables Affecting RP

The 23 variables with the highest score in influencing risk perception (higher than the threshold of 3) were selected from each of the five subgroups to evaluate the cause-and-effect relationship and were sent to the experts as a paired matrix. Table 2 shows selected variables from the fuzzy Delphi study to investigate cause-and-effect relationships.
The matrix of direct relationships was formed after collecting experts’ opinions regarding the effect of variables on each other. The normal direct correlation matrix and then the total correlation matrix were formed in the following steps.
The values of R and J were calculated from the total correlation matrix to determine the influence of the variables. The row sum of the coefficients of the total correlation matrix (R) indicated the intensity of influence on other variables, or, in other words, the degree of influence of a variable on other variables, and the column sum of coefficients (J) indicated the intensity of influence and feedback from other variables, or, in other words, the intensity of the influence of a variable on other variables.
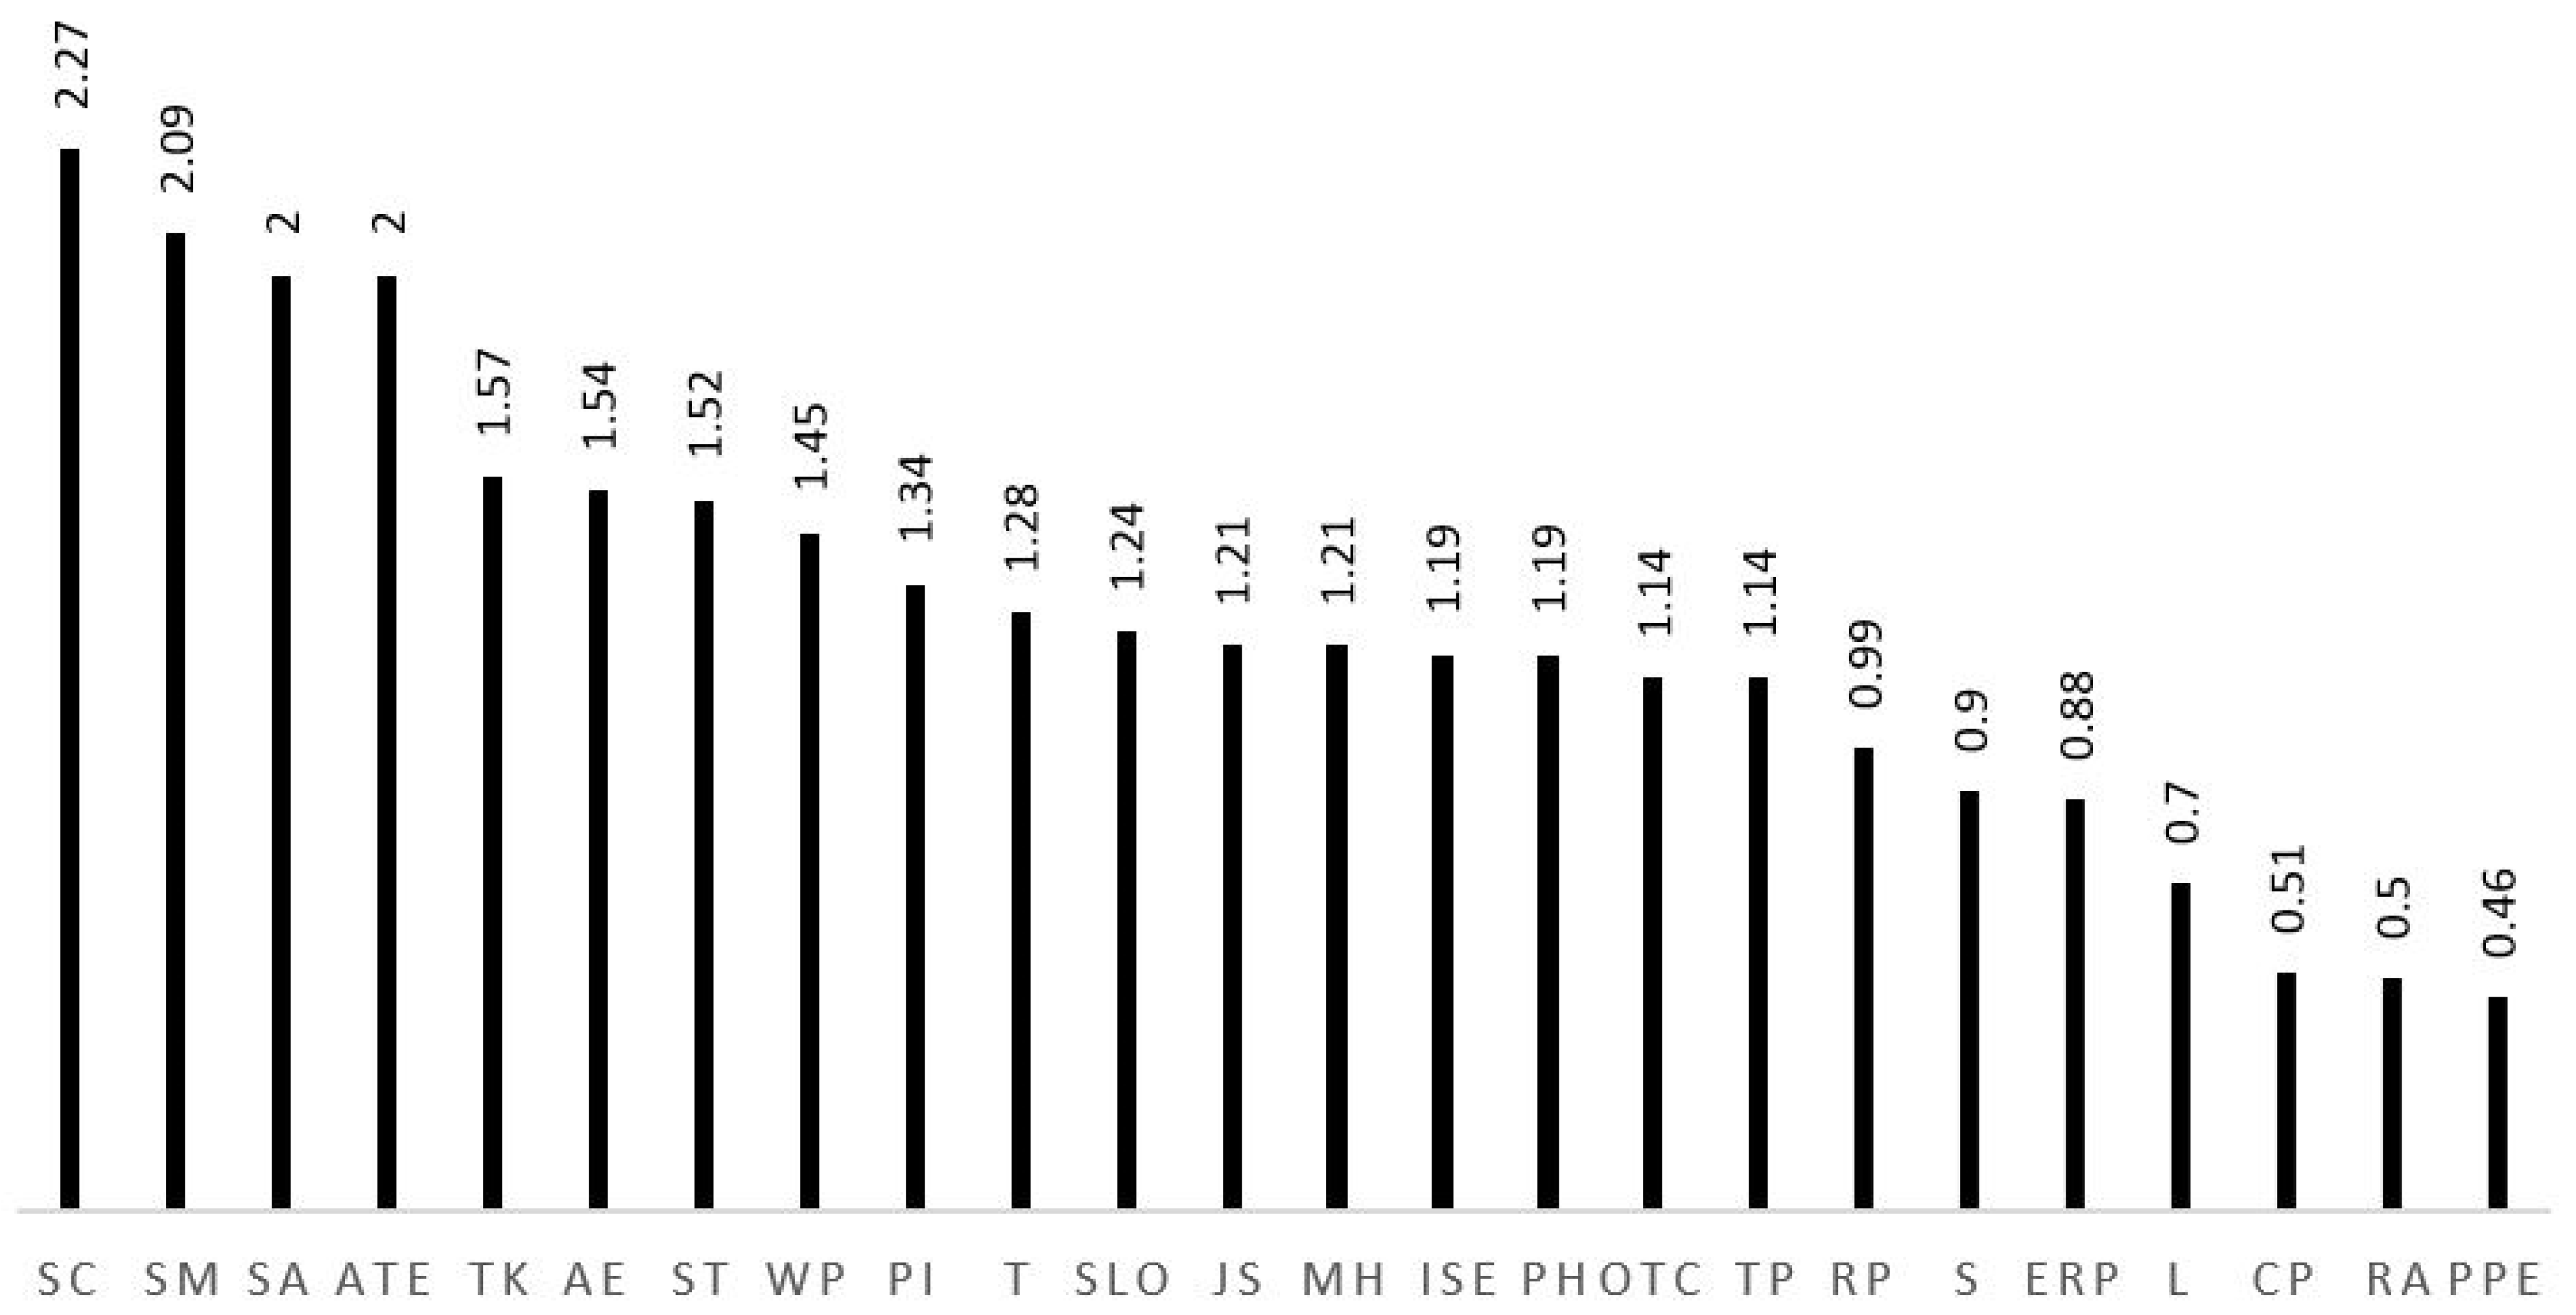
Based on R-values (Figure 4), “safety culture“had the strongest influence, and the variable “safety management style“was in second place. The variables “safety attitude“ and “up-to-date technology and equipment“ were ranked third and fourth in terms of influence. The variables of “chemical pollutants”, “risk aversion”, and “personal protective equipment“ had the weakest impact on other variables. Risk perception also had a significant effect in terms of influencing the variables of “time pressure”, “noise”, “response plans in emergencies”, “lighting”, and “chemical pollutants“.
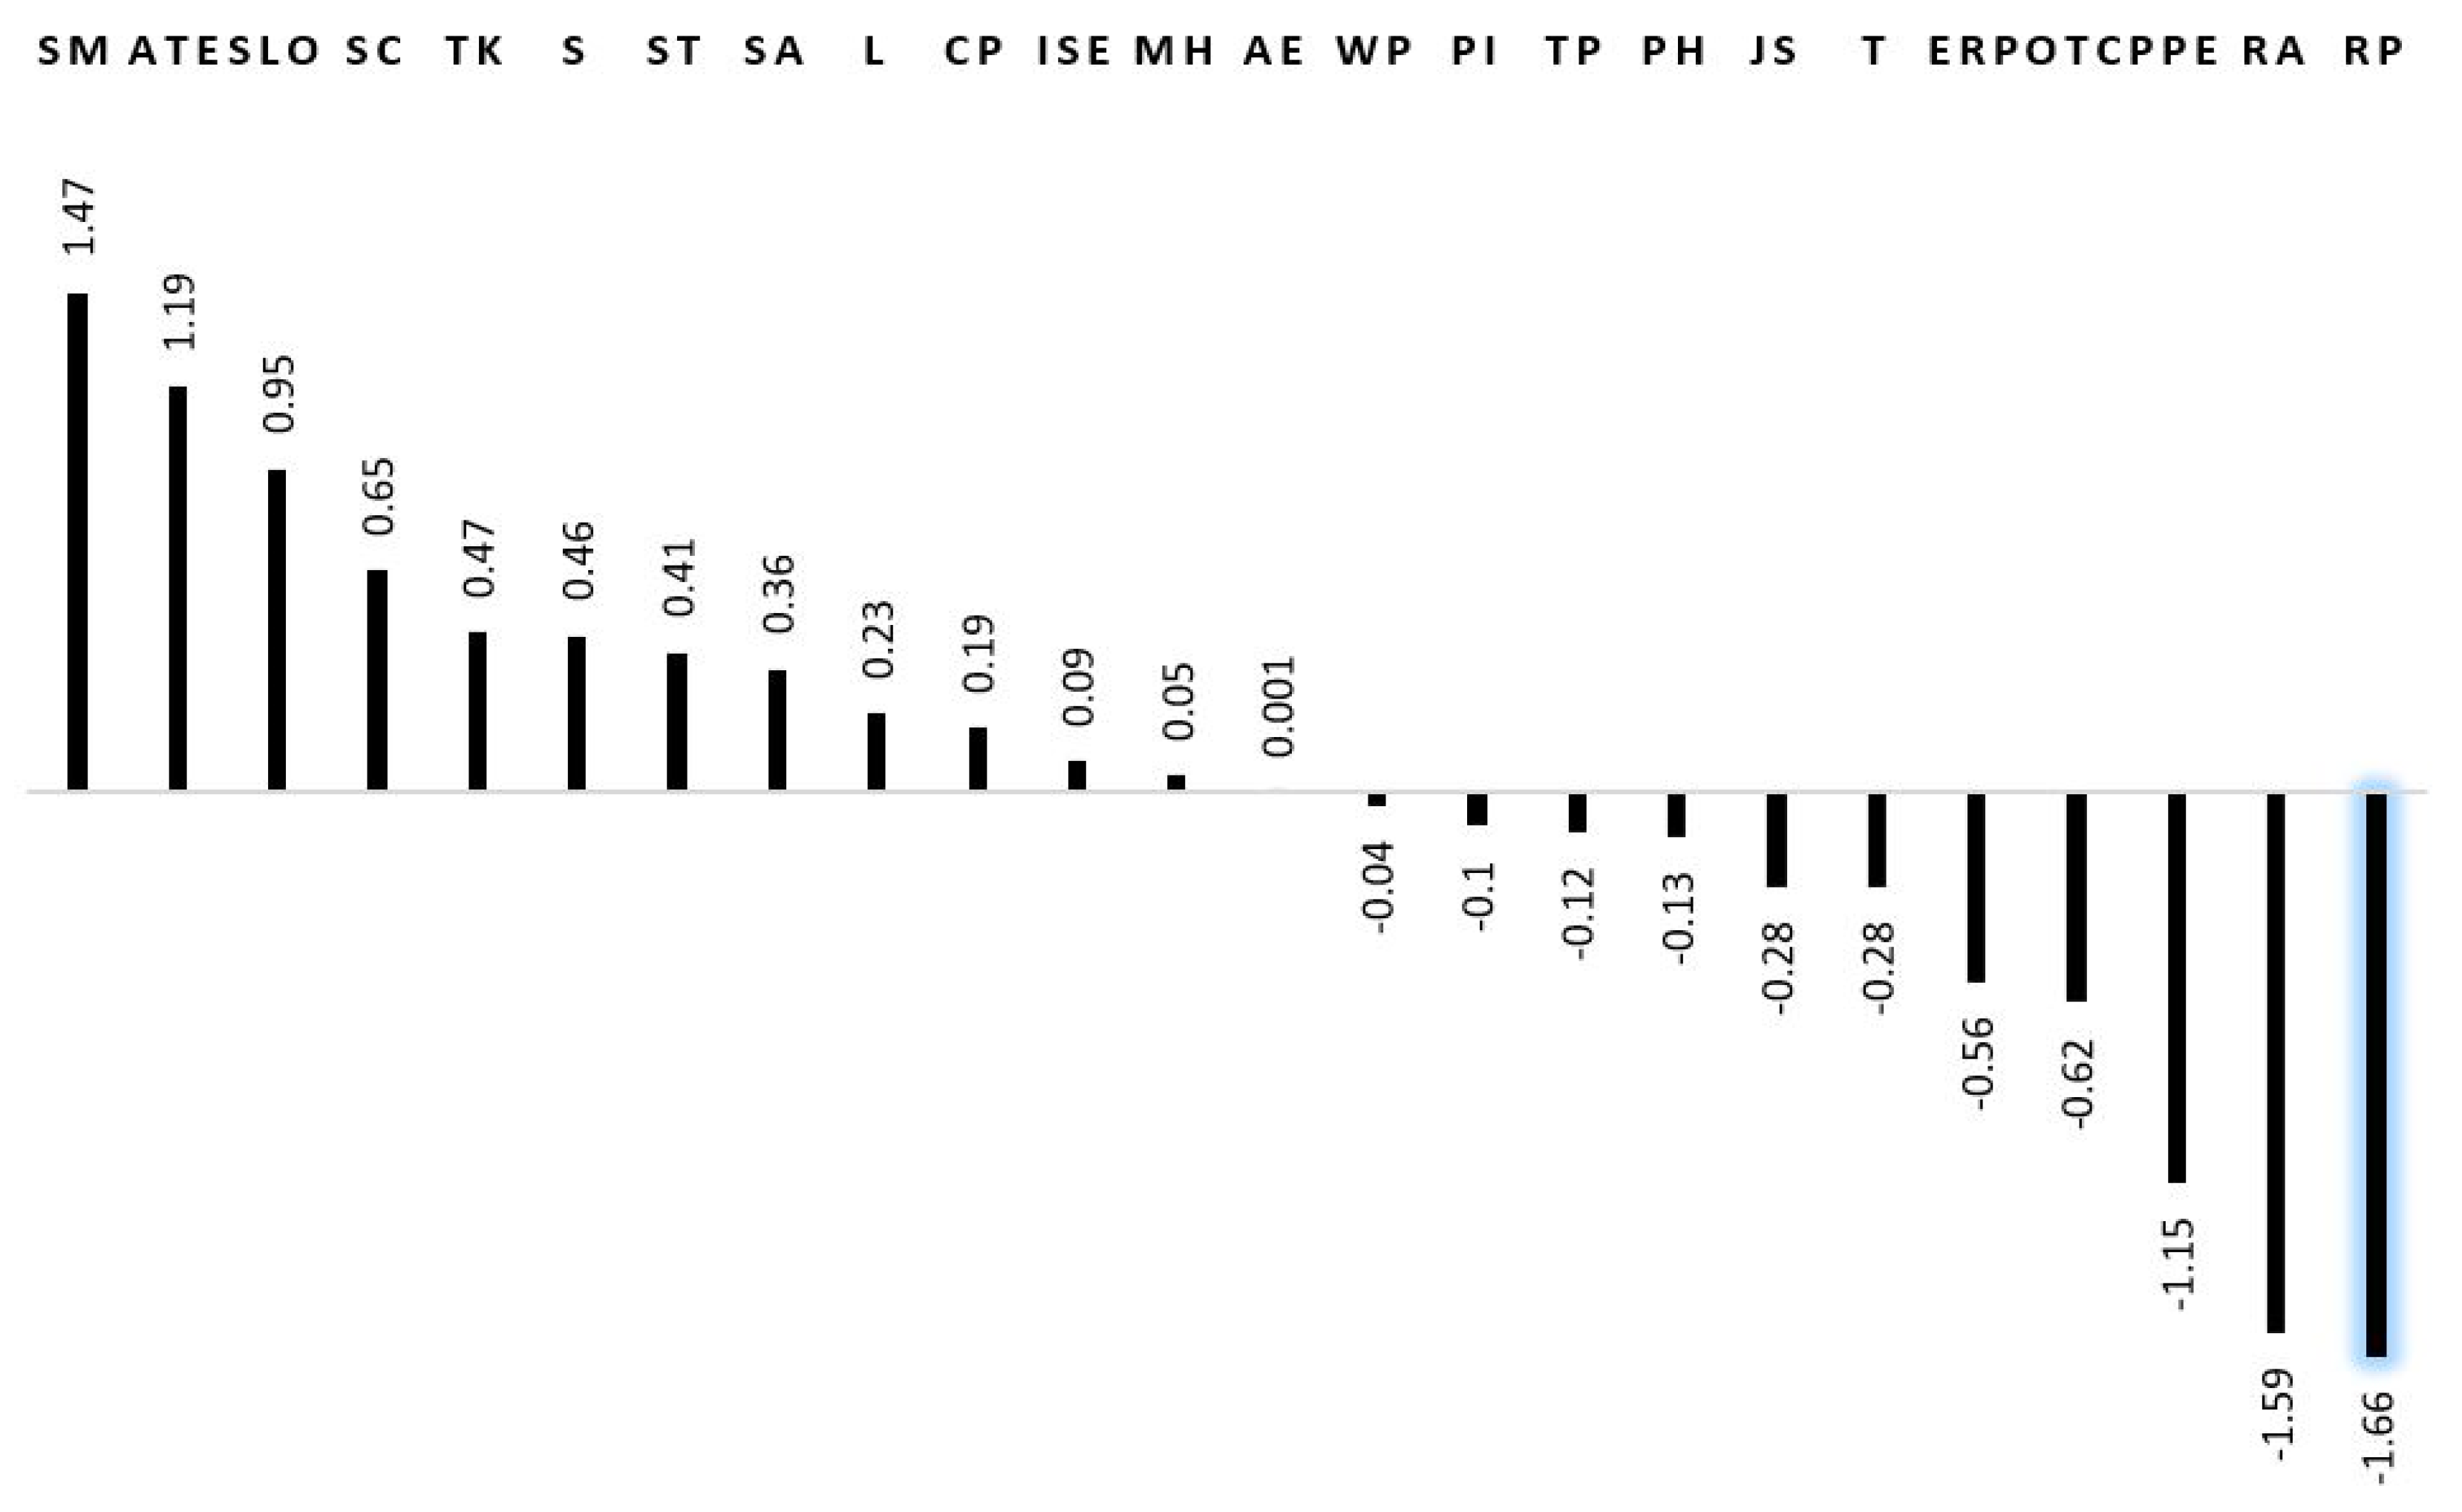
Based on J values (Figure 5), “risk perception“ had the strongest influence, and the “risk aversion“ variable was second. The variables “personal protective equipment“ and “coordination of the operation team“ were ranked third and fourth in terms of effectiveness. The variable “supervision of legal organizations“ had the weakest impact on other variables, and the variables “chemical pollutants“ and “noise“ were also in the following ranks.
According to R + J (Figure 6), “safety culture“ had the highest interaction with other variables, and the variables “safety attitude”, “risk perception”, and “accident experience“ were in the subsequent ranks. The variables of “chemical pollutants”, “lighting”, and “sound“ had the weakest interactions with other variables, respectively.
As can be seen in Figure 7, and based on the opinion of experts and the results of the fuzzy Delphi study, among the 24 final variables, 13 variables had the role of cause, and 11 variables had the role of effect.
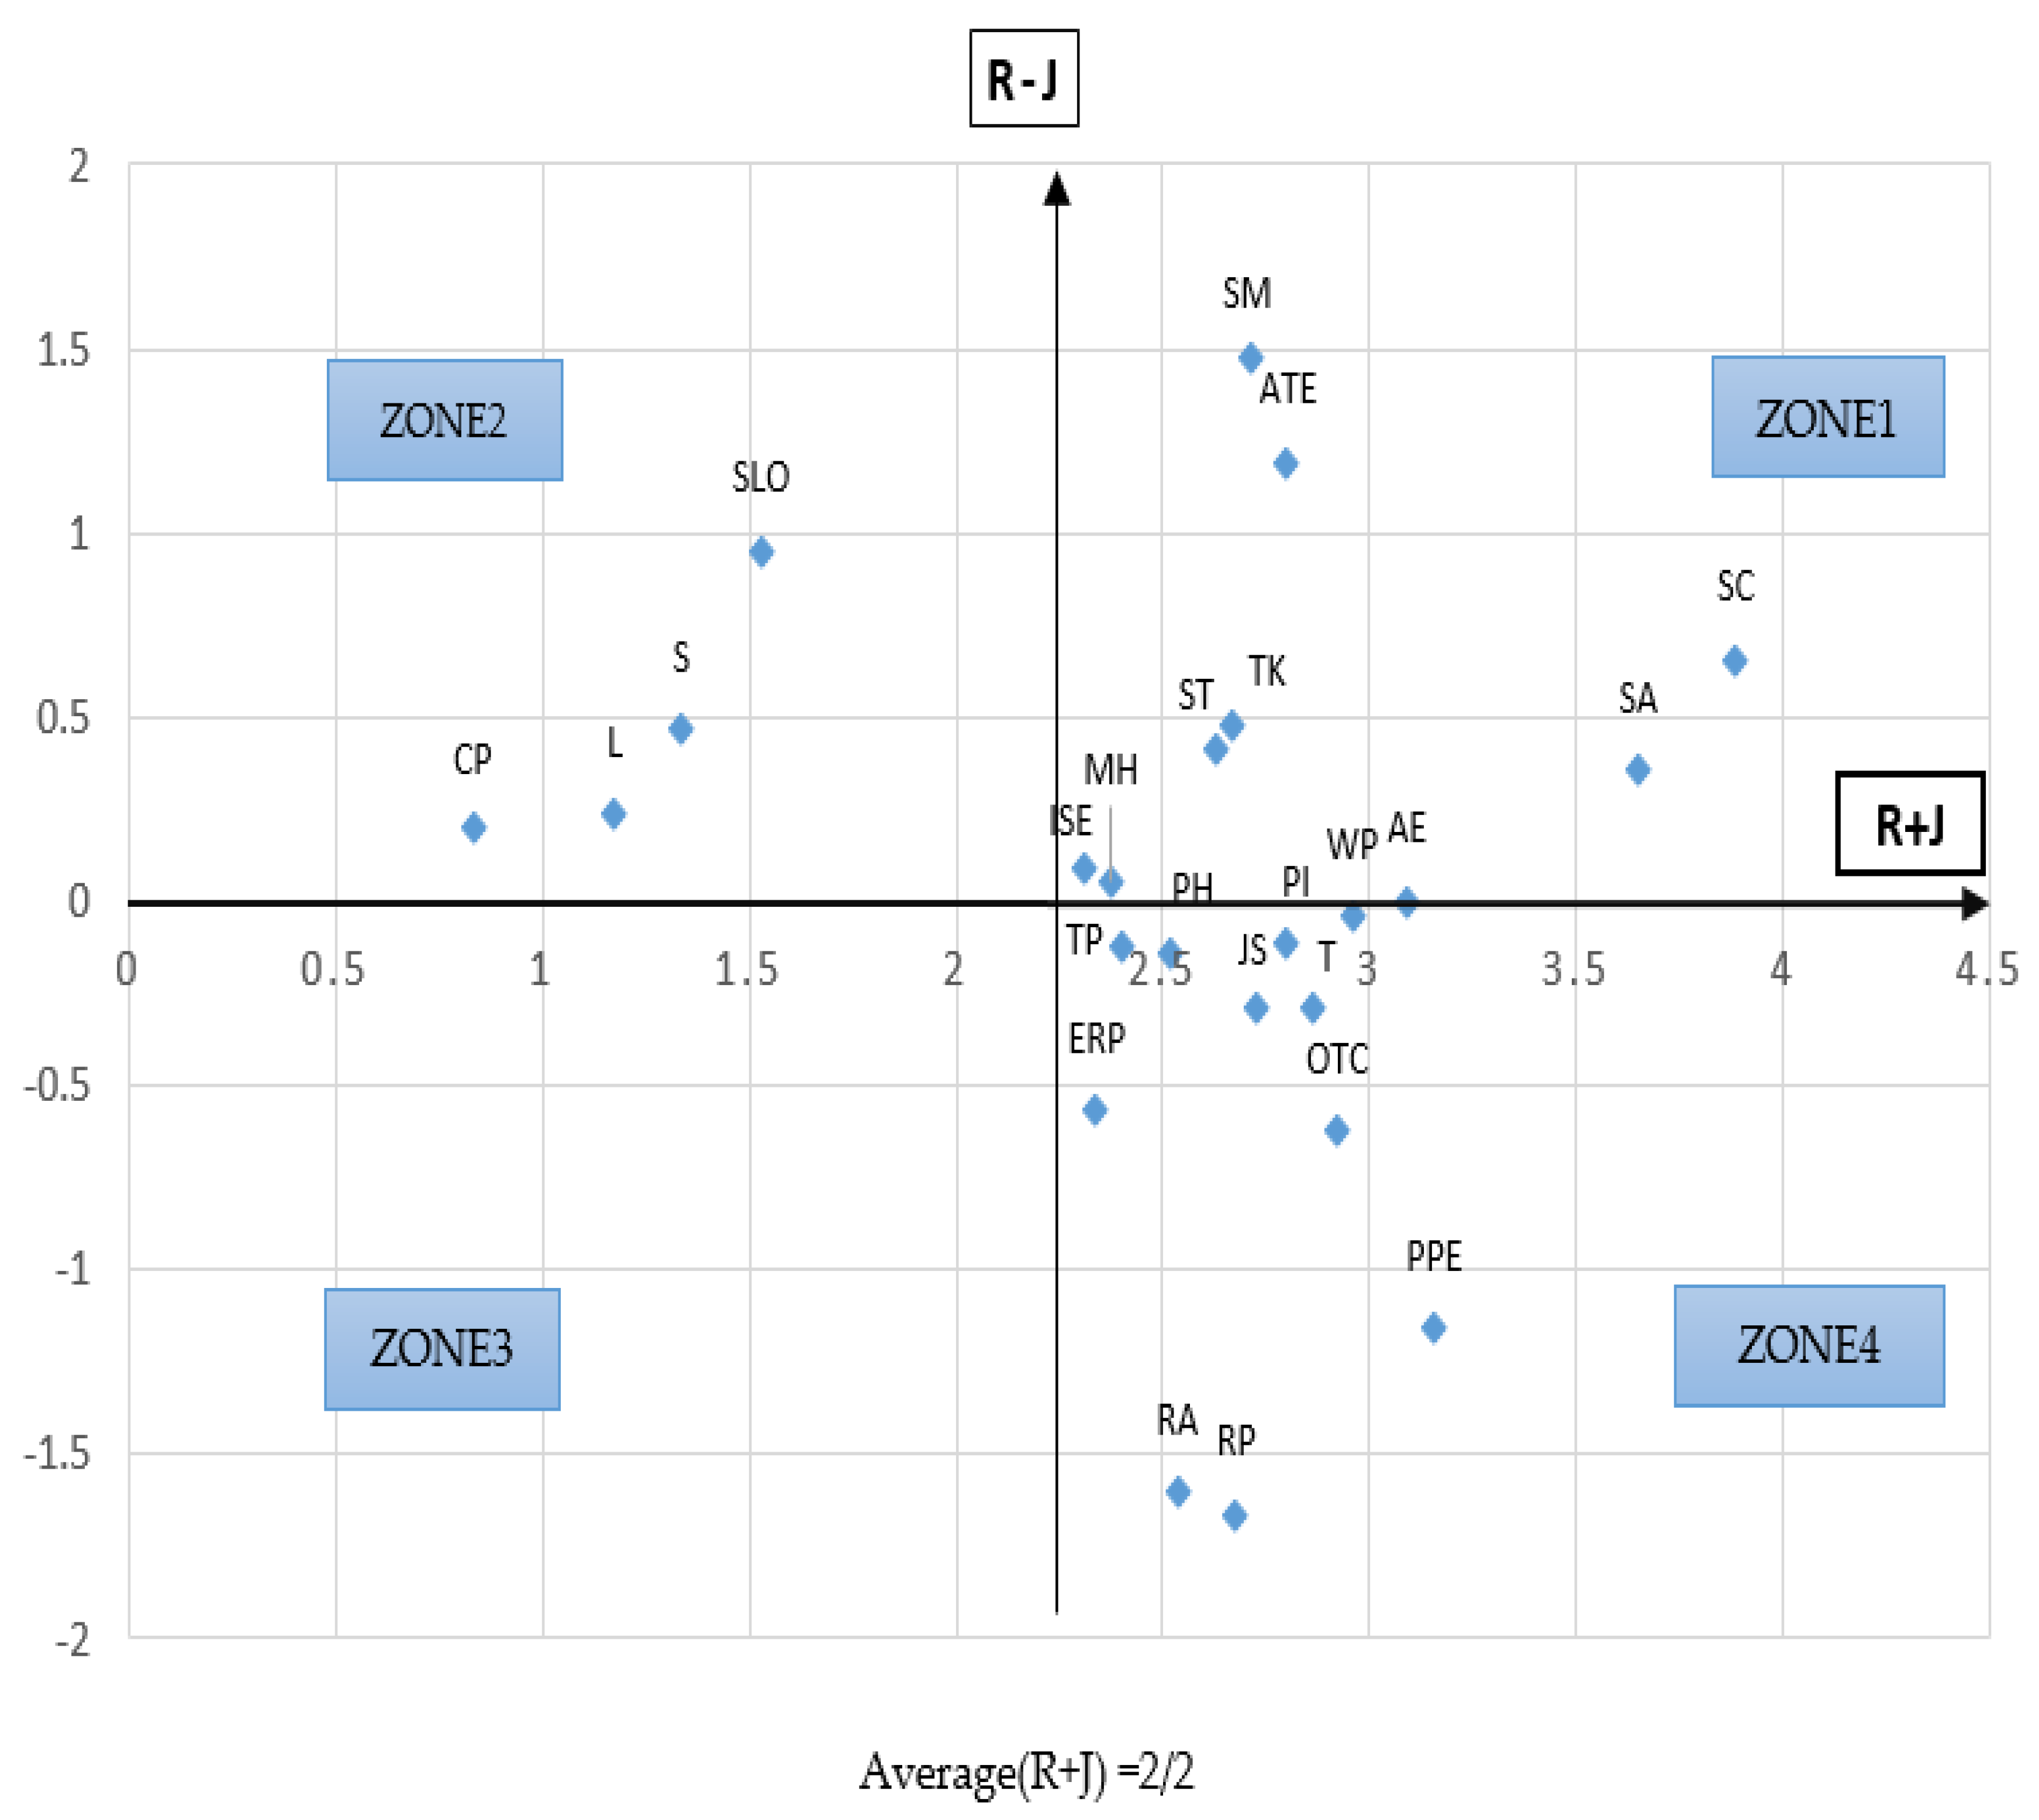
Figure 8 shows the cause-and-effect relationships of the most important influencing variables on the risk perception of underground coal mines in Iran.
The investigated variables are divided into four areas regarding the degree of influence (cause). The variables above the R + J axis are the cause variables, and those below this axis are the effect variables. The results of the DEMATEL study show that the organizational variables “safety culture“ and “safety management style“ were among the most influential variables over other variables. The variable “up-to-date technology and equipment“ was also ranked fourth in effectiveness. In addition to being the most influential, these three organizational variables had the highest causality value compared to other variables, and this shows that organizational variables were among the most important and influential variables in risk perception and the entire system. The two variables “safety training“ and “inspection by safety experts“ were also part of the cause variables and were ranked 7th and 14th, respectively, in terms of influence. Among the organizational variables, the variables of “response plans in emergencies“ and “coordination of the operation team“ were disabled variables, and their influence factors were lower than those of other organizational variables and some personal and occupational variables.
After the organizational variables, the individual variables of “safety attitude“ and “technical knowledge“ had the highest amount of causality compared to other variables. Also, the effect of these variables was higher than that of other variables, which indicates that these individual variables were among the causal variables with a high effect on the whole system. The individual variables “accident experience“ and “mental health“ were also part of the cause variables and were ranked sixth and thirteenth, respectively, in terms of influence. Among the individual variables, the variables “physical health”, “job satisfaction”, “fatigue”, “personal protection equipment”, “risk aversion”, and “perception of risk“ were among the disabled variables, and their influence factors were lower than those of some individual, organizational, occupational, and environmental variables. The dependent variable, i.e., “perception of risk”, was the dependent variable with the lowest R–J value, showing the greatest influence from other variables, and the third variable regarding the level of interaction with other variables.
According to the results, the external variable “supervision of legal organizations” ranked third in terms of causality. Each type of index of influence of this variable received the lowest score compared to other variables, but the index of influence of this variable was relatively high, and the index of interaction of this variable was also low. All these analyses show that the variable “monitoring legal organizations“ had the weakest impact compared to other system variables and was not affected. However, it had a great impact on many variables of the system, including “mental health”, “inspection by safety experts”, “physical health”, “job satisfaction”, “procedures and instructions”, and “emergency response plans“. This variable was placed in a low rank in terms of the level of interaction with other variables, and it can be said that this variable, which is a causal variable, acted relatively independently. Furthermore, it also affected the perception of risk.
The environmental variables “noise”, “light”, and “chemical pollutants“ had a low impact index. These variables, which are part of the cause variables, were placed at the lowest level in terms of interaction with other system variables. Job variables “work pressure”, “procedures and instructions”, and “time pressure“ also had an average influence index, and the R–J values for these variables were negative, so these were considered disabled variables. These variables had a relatively high interaction with other variables, especially “operational team coordination”, “accident experience”, “fatigue”, and “up-to-date technology and equipment“. Among the cause variables, “safety management style”, “safety culture”, “up-to-date technology and equipment”, “safety training”, “safety attitude”, “technical knowledge”, “inspection by safety experts”, “mental health”, and “accident experience“ had the highest R–J values and were the most important variables affecting risk perception. As a result, these variables should be prioritized in terms of corrective actions to promote and improve risk perception. In zone 2 of Figure 8, the variables “supervision of legal organizations”, “noise”, “lighting”, and “chemical pollutants“ are placed among the causal variables that have less importance than the first group and should be placed in the second level of importance in terms of the priority of taking corrective measures. Based on the results of this research and the opinions of experts, no variables were placed in the third zone. In this zone, effect variables are placed that are not significantly affected by the cause variables and do not significantly affect other effect variables. These variables are considered independent and placed in the third degree of importance. In the following, from the category of disabled variables that are in the fourth zone, the variables of “risk perception”, “risk aversion”, “personal protection equipment”, “operation team coordination”, “emergency response plans”, “fatigue”, “job satisfaction”, “physical health”, “time pressure”, “procedures and instructions“, and “work pressure“ are among the most effective variables and therefore corrective action plans should not be directed towards them. Corrective actions that should be taken are the last variables that are considered.

5. Discussion

The study’s findings showed that organizational and individual factors are more influential in shaping risk perception and improving the safety behavior of coal mine workers than other factors. Despite the difference in methodology, past studies emphasize these factors’ key role in risk perception, human errors, and unsafe behaviors. The findings of the study by Shezeen et al. showed that leadership and inappropriate safety atmosphere are two organizational factors that have a negative effect on the cognitive and emotional risk perception of workers, while individual factors of accident experience and workload have a positive effect [32]. Previous studies emphasize the significance of the organization’s management and leadership style in workers’ risk perception and safe behaviors [51,52]. The results of a study by Mohammadfam et al. [19] showed that management style, safety culture, and individual factors of knowledge and experience are among the basic variables affecting workers’ situational awareness, which is consistent with the present study’s findings. When the operator understands the dangerous conditions in the first stage and proceeds to the next stage of risk detection, he must correctly recognize the type and severity of the risks using his experience, knowledge, and comprehensive situational awareness. Therefore, the lack of perception and recognition of risks depends on a person’s experience and knowledge of his job conditions [53]. Training, as an organizational factor, along with the two factors of experience and knowledge, can help improve a person’s awareness of the hazards and risks of his work environment by creating mental models for the worker because these models create mechanisms for the process of perception [54].
So far, the effect of training on safety personnel has been investigated in many studies, and it has been confirmed that training improves safety behavior [55,56,57,58,59] and reduces accidents [60,61,62,63]. Accident experience is another factor affecting the perception of risk, which was placed in the first group in this study. Namian et al. [51] found that when workers regularly perform risky behaviors and do not experience negative consequences of their work (e.g., injury), their risk perception decreases over time, stimulating risk-taking. Another study in South Korea on manufacturing workers showed that accident experiences positively affected workers’ emotional and cognitive risk perception [32]. Environmental variables (noise, lighting, and exposure to chemical pollutants) were placed in the second area in the present study. These variables affect the variables of zone 4, including individual variables (PH, T, PPE, RA), task variables (WP, PI, TP, JS), organizational variables (ERP, OTC), and also RP as an individual and dependent variable. The findings of the studies show that the perception of individual risk and the subjective assessment of the work environment may be affected by environmental variables such as incorrect sound and lighting, and the person may have an incorrect interpretation of possible sources of risk. Therefore, the risk of that danger is misinterpreted, and workers exhibit inappropriate, risky behaviors [64]. Using hearing protection equipment in workplaces in the face of noise is a challenge that can affect workers’ risk perception despite eliminating and controlling noise effects [65]. The study conducted by Jahangiri in 2008 showed a significant relationship between the use of hearing protection, workers’ risk perception (p = 0.048), and their knowledge about hearing protection (p = 0.009). Moreover, the relationship between the general attitude of workers towards safety and risk perception was statistically significant (p = 0.046). He concluded that by removing the barriers of non-acceptance of protective earmuffs by the workers and also by enhancing the workers’ risk perception about hearing loss in the field of hearing protection, the use of hearing protectors could be promoted [66]. According to the theory of environmental comfort, psychological comfort is related to the design and management of the work environment. Therefore, the environmental conditions and physical aspects of the work environment, such as sound, light, temperature, etc., have an effect on the work behaviors and performance of people, reducing job satisfaction and creativity [67]. Environmental parameters can cause fatigue and depression and decrease a person’s concentration, impacting hazard identification and risk perception. Unsuitable air conditions in the workplace increase stress and reduce a person’s efficiency and mental performance [68]. The variables of zone 4 are effect variables that are affected by the variables of zones 1 and 2; work and time pressure are among the variables of this area that have been considered in many studies as dimensions of safety climate, and their effects on safety behaviors have been investigated [69,70,71]. Work pressure, which includes several components such as excessive workload, work speed, and time limitation, increases physiological stress and decreases employee inefficiency [71]. Job satisfaction is one of the variables affecting risk perception. In the study conducted by Biaoan Shan in 2022, it was concluded that perceived occupational health risks have a negative effect on job satisfaction [72]. A study showed that a higher level of risk perception is associated with decreased job satisfaction, which is moderated by safety climate [34]. Fatigue, as one of the individual factors affecting risk perception, includes both physical and mental dimensions. The study conducted by Taherpour showed that fatigue indirectly affects workers’ safety risk perception through mediating variables of safety attitude and risk recognition [52]. In general, fatigue has been the cause of many catastrophic accidents, such as the Three Mile Island accident [73], and the effect of fatigue on the occurrence of accidents has been demonstrated in many studies [74,75,76,77,78,79]. Response plans in emergencies are perhaps one factor affecting coal mine workers’ risk perception. Unfortunately, in the Yurt winter disaster, many of the dead were those who tried to help people trapped in the mine, but they had no perception of dangers after the explosion in the underground coal mines due to the lack of response maneuvers for emergency situations. The analysis of the Soma underground coal mine accident in Turkey showed that the misperception of mine officials’ risk of mine fires could lead to workers’ misperception of safety issues in the mine and, ultimately, the occurrence of a disaster [80].
In addition to covering the existing theoretical gaps related to the determination of factors affecting the perception of risk in coal mines, as one of the most dangerous work environments, the present study has tried to provide practical suggestions to improve the safety situation for senior managers of mines, as well as experts and safety managers. With proper risk perception in the work environment, senior managers of coal mines can provide the basis for improving workers’ risk perception by creating a suitable environment for cooperation, allocating required resources, creating job satisfaction, and paying attention to the physical and mental health of workers by reducing work and time pressure. Mine safety managers and experts can improve the safety situation and reduce accidents by continuously monitoring the environmental conditions, holding training courses, providing a rest–work cycle to prevent fatigue, coordinating hold response maneuvers in emergencies, and many other measures.

6. Conclusions

Workers’ comprehension of existing job risks will significantly impact their safety behavior and performance, especially in hazardous work environments such as underground coal mines. The present study identifies the factors affecting the risk perception of coal mine workers in Iran, one of the world’s important countries with coal reserves, by studying the relationships between the identified variables using a combination of two multi-criteria decision-making methods, fuzzy Delphi and DEMATEL. The study emphasizes the role of organizational factors such as safety culture, management style, technology and equipment, and employee training in increasing workers’ risk perception, as well as individual factors such as safety attitude, technical knowledge, and accident experience. Environmental variables such as inappropriate lighting and noise in the work environment were placed in the second area with less influence. The present study has a few limitations. One of the most important limitations is that a small number of variables were examined in the study, which does not respond to the complexity and uncertainty of unsafe acts. Other important limitations include the small sample size in the Delphi and DEMATEL study and the lack of generalization of information to other industries, especially open-pit coal mines. Future researchers are advised to use a combination of interview and literature review methods as a qualitative study to identify factors affecting risk perception. Also, the presented cause-and-effect model can be tested as a field study with a larger sample size. The present research can help reduce human errors and unsafe behaviors and increase the safety factor in mines by providing operational solutions based on identifying factors affecting workers’ risk perception.

Author Contributions

Conceptualization, M.H., A.A.K. and M.G.S.; Methodology M.H., M.G.S., H.D. and A.A.K.; Software, M.G.S. and A.A.K.; Validation, M.H. and H.D.; Formal analysis, M.G.S., H.D. and A.A.K.; Investigation, M.G.S.; Resources, A.A.K.; Data curation, M.G.S.; Writing—original draft, M.H., M.B., M.G.S. and A.A.K.; Writing—review & editing, M.B. and H.D.; Supervision, M.H., M.B. and A.A.K. All authors have read and agreed to the published version of the manuscript.

Funding

This research was funded by the KASHAN University of Medical Sciences and Health Services and grant number 140008257113.

Institutional Review Board Statement

The study was conducted in accordance with the Declaration of Helsinki and approved by the Institutional Review Board (or Ethics Committee) of the National Committee for Ethics in Medical Research (protocol code IR.KAUMS.NUHEPM.REC.1401.048 and date of approval 15 April 2022).

Informed Consent Statement

Not applicable.

Data Availability Statement

Not applicable.

Conflicts of Interest

The authors declare no conflict of interest.

Appendix A

Table A1. Direct Relations Matrix.
SLOSTSMSCATE……PPERAPHJSRP
03233........33021SLO
00243.........44024ST
24044........43344SM
34404........44144SC
03040........44344ATE
0
01010.......02341PPE
00000......30001RA
00030.......34034PH
00030.......33303JS
00332.......34000RP
Table A2. Normalized Direct Relations Matrix.
SLOSTSMSCATE……PPERAPHJSRPM
00.0380.0250.0380.038........0.0380.03800.0250.012SLO
000.0250.0510.038.........0.0510.05100.0250.051ST
0.0250.05100.0510.051........0.0510.0380.0380.0510.051SM
0.0380.0510.05100.051........0.0510.0510.0120.0510.051SC
00.03800.0510........0.0510.0510.0380.0510.051ATE
0
00.01200.0120.......00.0250.0380.0250.012PPE
00000......0.0380000.012RA
0000.0380.......0.0380.05100.0380.051PH
0000.0380.......0.0380.0380.03800.038JS
000.0380.0380.025.......0.0380.051000RP
Table A3. Total Relations Matrix.
SLOSTSMSCATE……PPERAPHJSRP
0.0070.0650.0390.0740.056........0.0840.0870.0290.0590.062SLO
0.0080.0340.0350.0960.061.........0.01080.1140.0340.0660.110ST
0.0360.0930.0250.1140.081........0.1300.1250.0870.1080.134SM
0.0490.0990.0760.0700.085........0.1360.1430.0670.1120.140SC
0.0090.0750.0220.1060.027........0.1250.1280.0880.1140.129ATE
0
0.0020.020.0050.0270.006.......0.0180.0440.0480.0370.031PPE
0.0030.0210.0060.0150.008......0.0560.0210.0120.0120.032RA
0.0060.0230.0150.0730.018.......0.0830.1000.0290.0710.096PH
0.0060.0250.0150.0840.017.......0.0830.090.0660.0330.086JS
0.0080.0260.0500.0680.042.......0.0760.0910.0220.0250.039RP

References

  1. Qiu, Z.; Liu, Q.; Li, X.; Zhang, J.; Zhang, Y. Construction and analysis of a coal mine accident causation network based on text mining. Process Saf. Environ. Prot. 2021, 153, 320–328. [Google Scholar] [CrossRef]
  2. Bakhtavar, E.; Shahmoradi, M.; Rahmati, S. Evaluation of the impacts of challenging factors on underground colliery occupational hazards in Iran using fuzzy cause and effect interaction. J. Min. Eng. 2018, 13, 34–45. [Google Scholar]
  3. Zhao, L.; Jin-an, W. Accident investigation of mine subsidence with application of particle flow code. Procedia Eng. 2011, 26, 1698–1704. [Google Scholar] [CrossRef]
  4. Lama, R.; Bodziony, J. Management of outburst in underground coal mines. Int. J. Coal Geol. 1998, 35, 83–115. [Google Scholar] [CrossRef]
  5. Onder, M.; Onder, S.; Adiguzel, E. Applying hierarchical loglinear models to nonfatal underground coal mine accidents for safety management. Int. J. Occup. Saf. Ergon. 2014, 20, 239–248. [Google Scholar] [CrossRef]
  6. Saleh, J.H.; Cummings, A.M. Safety in the mining industry and the unfinished legacy of mining accidents: Safety levers and defense-in-depth for addressing mining hazards. Saf. Sci. 2011, 49, 764–777. [Google Scholar] [CrossRef]
  7. Khanzode, V.V.; Maiti, J.; Ray, P. A methodology for evaluation and monitoring of recurring hazards in underground coal mining. Saf. Sci. 2011, 49, 1172–1179. [Google Scholar] [CrossRef]
  8. Maiti, J.; Khanzode, V.V. Development of a relative risk model for roof and side fall fatal accidents in underground coal mines in India. Saf. Sci. 2009, 47, 1068–1076. [Google Scholar] [CrossRef]
  9. Stojadinović, S.; Svrkota, I.; Petrović, D.; Denić, M.; Pantović, R.; Milić, V. Mining injuries in Serbian underground coal mines–A 10-year study. Injury 2012, 43, 2001–2005. [Google Scholar] [CrossRef]
  10. Leigh, J.P.; Waehrer, G.; Miller, T.R.; Keenan, C. Costs of occupational injury and illness across industries. Scand. J. Work Environ. Health 2004, 30, 199–205. [Google Scholar] [CrossRef]
  11. Liu, Q.; Li, X.; Meng, X. Effectiveness research on the multi-player evolutionary game of coal-mine safety regulation in China based on system dynamics. Saf. Sci. 2019, 111, 224–233. [Google Scholar] [CrossRef]
  12. Lawrence, A. Human error as a cause of accidents in gold mining. J. Saf. Res. 1974, 6, 78–88. [Google Scholar]
  13. Kumar, P.; Gupta, S.; Gunda, Y.R. Estimation of human error rate in underground coal mines through retrospective analysis of mining accident reports and some error reduction strategies. Saf. Sci. 2020, 123, 104555. [Google Scholar] [CrossRef]
  14. Simpson, G.; Horberry, T. Understanding Human Error in Mine Safety; CRC Press: Boca Raton, FL, USA, 2018. [Google Scholar]
  15. Wang, L.; Wang, Y.; Cao, Q.; Li, X.; Li, J.; Wu, X. A framework for human error risk analysis of coal mine emergency evacuation in China. J. Loss Prev. Process Ind. 2014, 30, 113–123. [Google Scholar] [CrossRef]
  16. Patterson, J. Human Error in Mining: A Multivariable Analysis of Mining Accidents/Incidents in Queensland, Australia and the United States of America Using the Human Factors Analysis and Classification System Framework. Ph.D. Thesis, Clemson University, Clemson, SC, USA, 2009. [Google Scholar]
  17. Geng, F.; Saleh, J.H. Challenging the emerging narrative: Critical examination of coalmining safety in China, and recommendations for tackling mining hazards. Saf. Sci. 2015, 75, 36–48. [Google Scholar] [CrossRef]
  18. Patterson, J.M.; Shappell, S.A. Operator error and system deficiencies: Analysis of 508 mining incidents and accidents from Queensland, Australia using HFACS. Accid. Anal. Prev. 2010, 42, 1379–1385. [Google Scholar] [CrossRef] [PubMed]
  19. Mohammadfam, I.; Khajevandi, A.A.; Dehghani, H.; Babamiri, M.; Farhadian, M. Analysis of factors affecting human reliability in the mining process design using Fuzzy Delphi and DEMATEL methods. Sustainability 2022, 14, 8168. [Google Scholar] [CrossRef]
  20. Gordon, R.P. The contribution of human factors to accidents in the offshore oil industry. Reliab. Eng. Syst. Saf. 1998, 61, 95–108. [Google Scholar] [CrossRef]
  21. Rundmo, T. Associations between risk perception and safety. Occup. Health Ind. Med. 1997, 2, 53. [Google Scholar] [CrossRef]
  22. Jafari, M.; Kouhi, F.; Movahedi, M.; Allah-Yari, T. The effect of job safety analysis on risk perception of workers at high risk jobs in a refinery. Iran Occup. Health 2010, 6, 12–25. [Google Scholar]
  23. Sjöberg, L.; Moen, B.-E.; Rundmo, T. Explaining risk perception. An evaluation of the psychometric paradigm in risk perception research. Rotunde Publ. Rotunde 2004, 84, 55–76. [Google Scholar]
  24. Hughes, P.W.; Ferrett, E. Introduction to Health and Safety in Construction; Elsevier Butterworth-Heinemann: Oxford, UK, 2005. [Google Scholar]
  25. Chen, L.; Li, H.; Tian, S. Application of AHP and DEMATEL for identifying factors influencing coal mine practitioners’ unsafe state. Sustainability 2022, 14, 14511. [Google Scholar] [CrossRef]
  26. Ghiami, M.; Vaziri, M.H.; Gholamnia, R.; Saeedi, R.; Motalebi, M. Investigating the relationship between risk perception, resources and rate of job stress with occupational accidents in a steel industry. Iran AQ5 Occup. Health 2020, 17, 1109–1121. [Google Scholar]
  27. Yeganeh, R.; Mohammadfam, I.; Soltanian, A.; Mirzaei Aliabadi, M. An integrative fuzzy Delphi decision-making trial and evaluation laboratory (DEMATEL) study on the risk perception-influencing factors. Int. J. Occup. Saf. Ergon. 2023, 29, 1135–1146. [Google Scholar] [CrossRef] [PubMed]
  28. Ding, Y.; Du, X.; Li, Q.; Zhang, M.; Zhang, Q.; Tan, X.; Liu, Q. Risk perception of coronavirus disease 2019 (COVID-19) and its related factors among college students in China during quarantine. PLoS ONE 2020, 15, e0237626. [Google Scholar] [CrossRef] [PubMed]
  29. Pandit, B.; Albert, A.; Patil, Y.; Al-Bayati, A.J. Impact of safety climate on hazard recognition and safety risk perception. Saf. Sci. 2019, 113, 44–53. [Google Scholar] [CrossRef]
  30. Khajavi, S.; Ebrahimi Ghavam Abadi, L. Study of relationship between occupational accidents risk perception of gas stations workers in Ahvaz City with the HSE management performance in fueling stations in 2016. Iran Occup. Health 2018, 15, 34–46. [Google Scholar]
  31. Asivandzadeh, E.; Jamalizadeh, Z.; Safari Variani, A.; Mohebi, A.; Khoshnavaz, H. Evaluating the Impact of Training and Technical Interventions on Improving Safety Culture and Understanding the Risk of Dangerous Situations at Height among Construction Workers. J. Health 2020, 11, 109–122. [Google Scholar] [CrossRef]
  32. Oah, S.; Na, R.; Moon, K. The influence of safety climate, safety leadership, workload, and accident experiences on risk perception: A study of Korean manufacturing workers. Saf. Health Work 2018, 9, 427–433. [Google Scholar] [CrossRef]
  33. Keçeci, Ş. Case Study Analysis; Risk Perception and Unsafe Behaviors İn Occupational Health and Safety. Int. J. Lifelong Educ. Leadersh. 2019, 5, 1–4. [Google Scholar]
  34. Nielsen, M.B.; Mearns, K.; Matthiesen, S.B.; Eid, J. Using the Job Demands–Resources model to investigate risk perception, safety climate and job satisfaction in safety critical organizations. Scand. J. Psychol. 2011, 52, 465–475. [Google Scholar] [CrossRef] [PubMed]
  35. Jahangiri, M.; Sareban Zadeh, K.; Bashar, O.; Saleh Zade, H. Investigation risk perception, safety attitude and safety performance in supervisors of construction sites Shiraz-Iran. Iran. J. Ergon. 2013, 1, 10–18. [Google Scholar]
  36. Sa, J.; Seo, D.-C.; Choi, S.D. Comparison of risk factors for falls from height between commercial and residential roofers. J. Saf. Res. 2009, 40, 1–6. [Google Scholar] [CrossRef] [PubMed]
  37. Song, Y.; Zhang, S. The Differences in Risk Perception between Practitioners in the Non-Coal-Mining Industry: Miners, Managers and Experts. Toxics 2022, 10, 623. [Google Scholar] [CrossRef]
  38. Mohammadfam, I.; Aliabadi, M.M.; Soltanian, A.R.; Tabibzadeh, M.; Mahdinia, M. Investigating interactions among vital variables affecting situation awareness based on Fuzzy DEMATEL method. Int. J. Ind. Ergon. 2019, 74, 102842. [Google Scholar] [CrossRef]
  39. Dehghani, H.; Bascompta, M.; Khajevandi, A.A.; Farnia, K.A. A Mimic Model Approach for Impact Assessment of Mining Activities on Sustainable Development Indicators. Sustainability 2023, 15, 2688. [Google Scholar] [CrossRef]
  40. Sarani, M.; Honarvar, M.; Sahebi, A.; Safi-Keykaleh, M.; Nateghinia, S.; Jahangiri, K. Challenges facing the health system in responding to mining accidents: The case of the zemestan-yurt mine explosion in iran (2017). J. Occup. Health Epidemiol. 2021, 10, 204–208. [Google Scholar] [CrossRef]
  41. Mahdinia, M.; Aliabadi, M.M.; Soltanzadeh, A.; Soltanian, A.R.; Mohammadfam, I. Identifying, Evaluating and Determining of The Most Important Predictive Variables of Safety Situation Awareness Using Fuzzy Logic Approach. J. Health Saf. Work 2021, 11, 176–195. [Google Scholar]
  42. Zhou, Q.; Huang, W.; Zhang, Y. Identifying critical success factors in emergency management using a fuzzy DEMATEL method. Saf. Sci. 2011, 49, 243–252. [Google Scholar] [CrossRef]
  43. Chong, H.Y. E-dispute resolution model on contractual variations. Ph.D Thesis, Universiti Teknologi Malaysia, Johor, Malaysia, 2010. [Google Scholar]
  44. Hsu, T.; Yang, T. Application of fuzzy analytic hierarchy process in the selection of advertising media. J. Manag. Syst. 2000, 7, 19–39. [Google Scholar]
  45. Cafiso, S.; Di Graziano, A.; Pappalardo, G. Using the Delphi method to evaluate opinions of public transport managers on bus safety. Saf. Sci. 2013, 57, 254–263. [Google Scholar] [CrossRef]
  46. Fink, A.; Kosecoff, J.; Chassin, M.; Brook, R.H. Consensus methods: Characteristics and guidelines for use. Am. J. Public Health 1984, 74, 979–983. [Google Scholar] [CrossRef] [PubMed]
  47. Habibi, A.; Jahantigh, F.F.; Sarafrazi, A. Fuzzy Delphi technique for forecasting and screening items. Asian J. Res. Bus. Econ. Manag. 2015, 5, 130–143. [Google Scholar] [CrossRef]
  48. Li, Y.; Hu, Y.; Zhang, X.; Deng, Y.; Mahadevan, S. An evidential DEMATEL method to identify critical success factors in emergency management. Appl. Soft Comput. 2014, 22, 504–510. [Google Scholar] [CrossRef]
  49. Shieh, J.-I.; Wu, H.-H.; Huang, K.-K. A DEMATEL method in identifying key success factors of hospital service quality. Knowl. -Based Syst. 2010, 23, 277–282. [Google Scholar] [CrossRef]
  50. Akyuz, E.; Celik, E. A fuzzy DEMATEL method to evaluate critical operational hazards during gas freeing process in crude oil tankers. J. Loss Prev. Process Ind. 2015, 38, 243–253. [Google Scholar] [CrossRef]
  51. Namian, M.; Albert, A.; Feng, J. Effect of distraction on hazard recognition and safety risk perception. J. Constr. Eng. Manag. 2018, 144, 04018008. [Google Scholar] [CrossRef]
  52. Taherpour, F.; Ghiasvand, E.; Namian, M. The Effect of Fatigue on Safety Attitude, Hazard Recognition and Safety Risk Perception among Construction Workers. Amirkabir J. Civ. Eng. 2021, 53, 3299–3316. [Google Scholar]
  53. Fang, Y.; Cho, Y.K. Measuring operator’s situation awareness in smart operation of cranes. In Proceedings of the Proc. 34th International Symposium on Automation and Robotics in Construction, Taipei, Taiwan, 28 June–1 July 2017; pp. 96–103. [Google Scholar]
  54. Burkolter, D.; Kluge, A.; Sauer, J.; Ritzmann, S. Comparative study of three training methods for enhancing process control performance: Emphasis shift training, situation awareness training, and drill and practice. Comput. Hum. Behav. 2010, 26, 976–986. [Google Scholar] [CrossRef]
  55. Braunger, P.; Frank, H.; Korunka, C.; Lueger, M.; Kubicek, B. Validating a safety climate model in metal processing industries: A replication study. Int. J. Occup. Saf. Ergon. 2013, 19, 143–155. [Google Scholar] [CrossRef]
  56. Brondino, M.; Silva, S.A.; Pasini, M. Multilevel approach to organizational and group safety climate and safety performance: Co-workers as the missing link. Saf. Sci. 2012, 50, 1847–1856. [Google Scholar] [CrossRef]
  57. Neal, A.; Griffin, M.A.; Hart, P.M. The impact of organizational climate on safety climate and individual behavior. Saf. Sci. 2000, 34, 99–109. [Google Scholar] [CrossRef]
  58. Petitta, L.; Probst, T.M.; Barbaranelli, C.; Ghezzi, V. Disentangling the roles of safety climate and safety culture: Multi-level effects on the relationship between supervisor enforcement and safety compliance. Accid. Anal. Prev. 2017, 99, 77–89. [Google Scholar] [CrossRef] [PubMed]
  59. Swedler, D.I.; Verma, S.K.; Huang, Y.-H.; Lombardi, D.A.; Chang, W.-R.; Brennan, M.; Courtney, T.K. A structural equation modelling approach examining the pathways between safety climate, behaviour performance and workplace slipping. Occup. Environ. Med. 2015, 72, 476–481. [Google Scholar] [CrossRef] [PubMed]
  60. Huang, Y.-H.; Ho, M.; Smith, G.S.; Chen, P.Y. Safety climate and self-reported injury: Assessing the mediating role of employee safety control. Accid. Anal. Prev. 2006, 38, 425–433. [Google Scholar] [CrossRef] [PubMed]
  61. Lu, C.-S.; Tsai, C.-L. The effects of safety climate on vessel accidents in the container shipping context. Accid. Anal. Prev. 2008, 40, 594–601. [Google Scholar] [CrossRef]
  62. Probst, T.M.; Estrada, A.X. Accident under-reporting among employees: Testing the moderating influence of psychological safety climate and supervisor enforcement of safety practices. Accid. Anal. Prev. 2010, 42, 1438–1444. [Google Scholar] [CrossRef]
  63. Smith, G.S.; Huang, Y.-H.; Ho, M.; Chen, P.Y. The relationship between safety climate and injury rates across industries: The need to adjust for injury hazards. Accid. Anal. Prev. 2006, 38, 556–562. [Google Scholar] [CrossRef]
  64. Arezes, P.M.; Miguel, A.S. Risk perception and safety behaviour: A study in an occupational environment. Saf. Sci. 2008, 46, 900–907. [Google Scholar] [CrossRef]
  65. Arezes, P.M.; Miguel, A.S. Hearing protection use in industry: The role of risk perception. Saf. Sci. 2005, 43, 253–267. [Google Scholar] [CrossRef]
  66. Jahangiri, M.; Mirzaei, R.; Ansari, H. Risk perception, knowledge and safety attitude and hearing protector use in petrochemical industry workers. Audiology 2008, 17, 11–18. [Google Scholar]
  67. Samani, S.A.; Rasid, S.Z.A.; Sofian, S. The influence of personal control and environmental distraction in open-plan offices on creative outcome. Perform. Improv. Q. 2017, 30, 5–28. [Google Scholar] [CrossRef]
  68. Lee, S.Y.; Brand, J. Can personal control over the physical environment ease distractions in office workplaces? Ergonomics 2010, 53, 324–335. [Google Scholar] [CrossRef] [PubMed]
  69. Bosak, J.; Coetsee, W.J.; Cullinane, S.-J. Safety climate dimensions as predictors for risk behavior. Accid. Anal. Prev. 2013, 55, 256–264. [Google Scholar] [CrossRef]
  70. Cavazza, N.; Serpe, A. Effects of safety climate on safety norm violations: Exploring the mediating role of attitudinal ambivalence toward personal protective equipment. J. Saf. Res. 2009, 40, 277–283. [Google Scholar] [CrossRef] [PubMed]
  71. Fernández-Muñiz, B.; Montes-Peón, J.M.; Vázquez-Ordás, C.J. Safety climate in OHSAS 18001-certified organisations: Antecedents and consequences of safety behaviour. Accid. Anal. Prev. 2012, 45, 745–758. [Google Scholar] [CrossRef]
  72. Shan, B.; Liu, X.; Gu, A.; Zhao, R. The effect of occupational health risk perception on job satisfaction. Int. J. Environ. Res. Public Health 2022, 19, 2111. [Google Scholar] [CrossRef]
  73. Griffith, C.D.; Mahadevan, S. Human reliability under sleep deprivation: Derivation of performance shaping factor multipliers from empirical data. Reliab. Eng. Syst. Saf. 2015, 144, 23–34. [Google Scholar] [CrossRef]
  74. Chan, M. Fatigue: The most critical accident risk in oil and gas construction. Constr. Manag. Econ. 2011, 29, 341–353. [Google Scholar] [CrossRef]
  75. Cheng, E.W.; Li, H.; Fang, D.; Xie, F. Construction safety management: An exploratory study from China. Constr. Innov. 2004, 4, 229–241. [Google Scholar] [CrossRef]
  76. Dong, X. Long workhours, work scheduling and work-related injuries among construction workers in the United States. Scand. J. Work Environ. Health 2005, 329–335. [Google Scholar] [CrossRef] [PubMed]
  77. Gander, P.; Merry, A.; Millar, M.; Weller, J. Hours of work and fatigue-related error: A survey of New Zealand anaesthetists. Anaesth. Intensive Care 2000, 28, 178–183. [Google Scholar] [CrossRef] [PubMed]
  78. Hystad, S.; Nielsen, M.; Eid, J. The impact of sleep quality, fatigue and safety climate on the perceptions of accident risk among seafarers. Eur. Rev. Appl. Psychol. 2017, 67, 259–267. [Google Scholar] [CrossRef]
  79. Powell, R.; Copping, A. Sleep deprivation and its consequences in construction workers. J. Constr. Eng. Manag. 2010, 136, 1086–1092. [Google Scholar] [CrossRef]
  80. Duzgun, H.S.; Yaylaci, E.D. An evaluation of Soma underground coal mine disaster with respect to risk acceptance and risk perception. In Proceedings of the 3rd International Symposium on Mine Safety Science and Engineering, Montreal, QC, Canada, 13–19 August 2016; pp. 368–374. [Google Scholar]
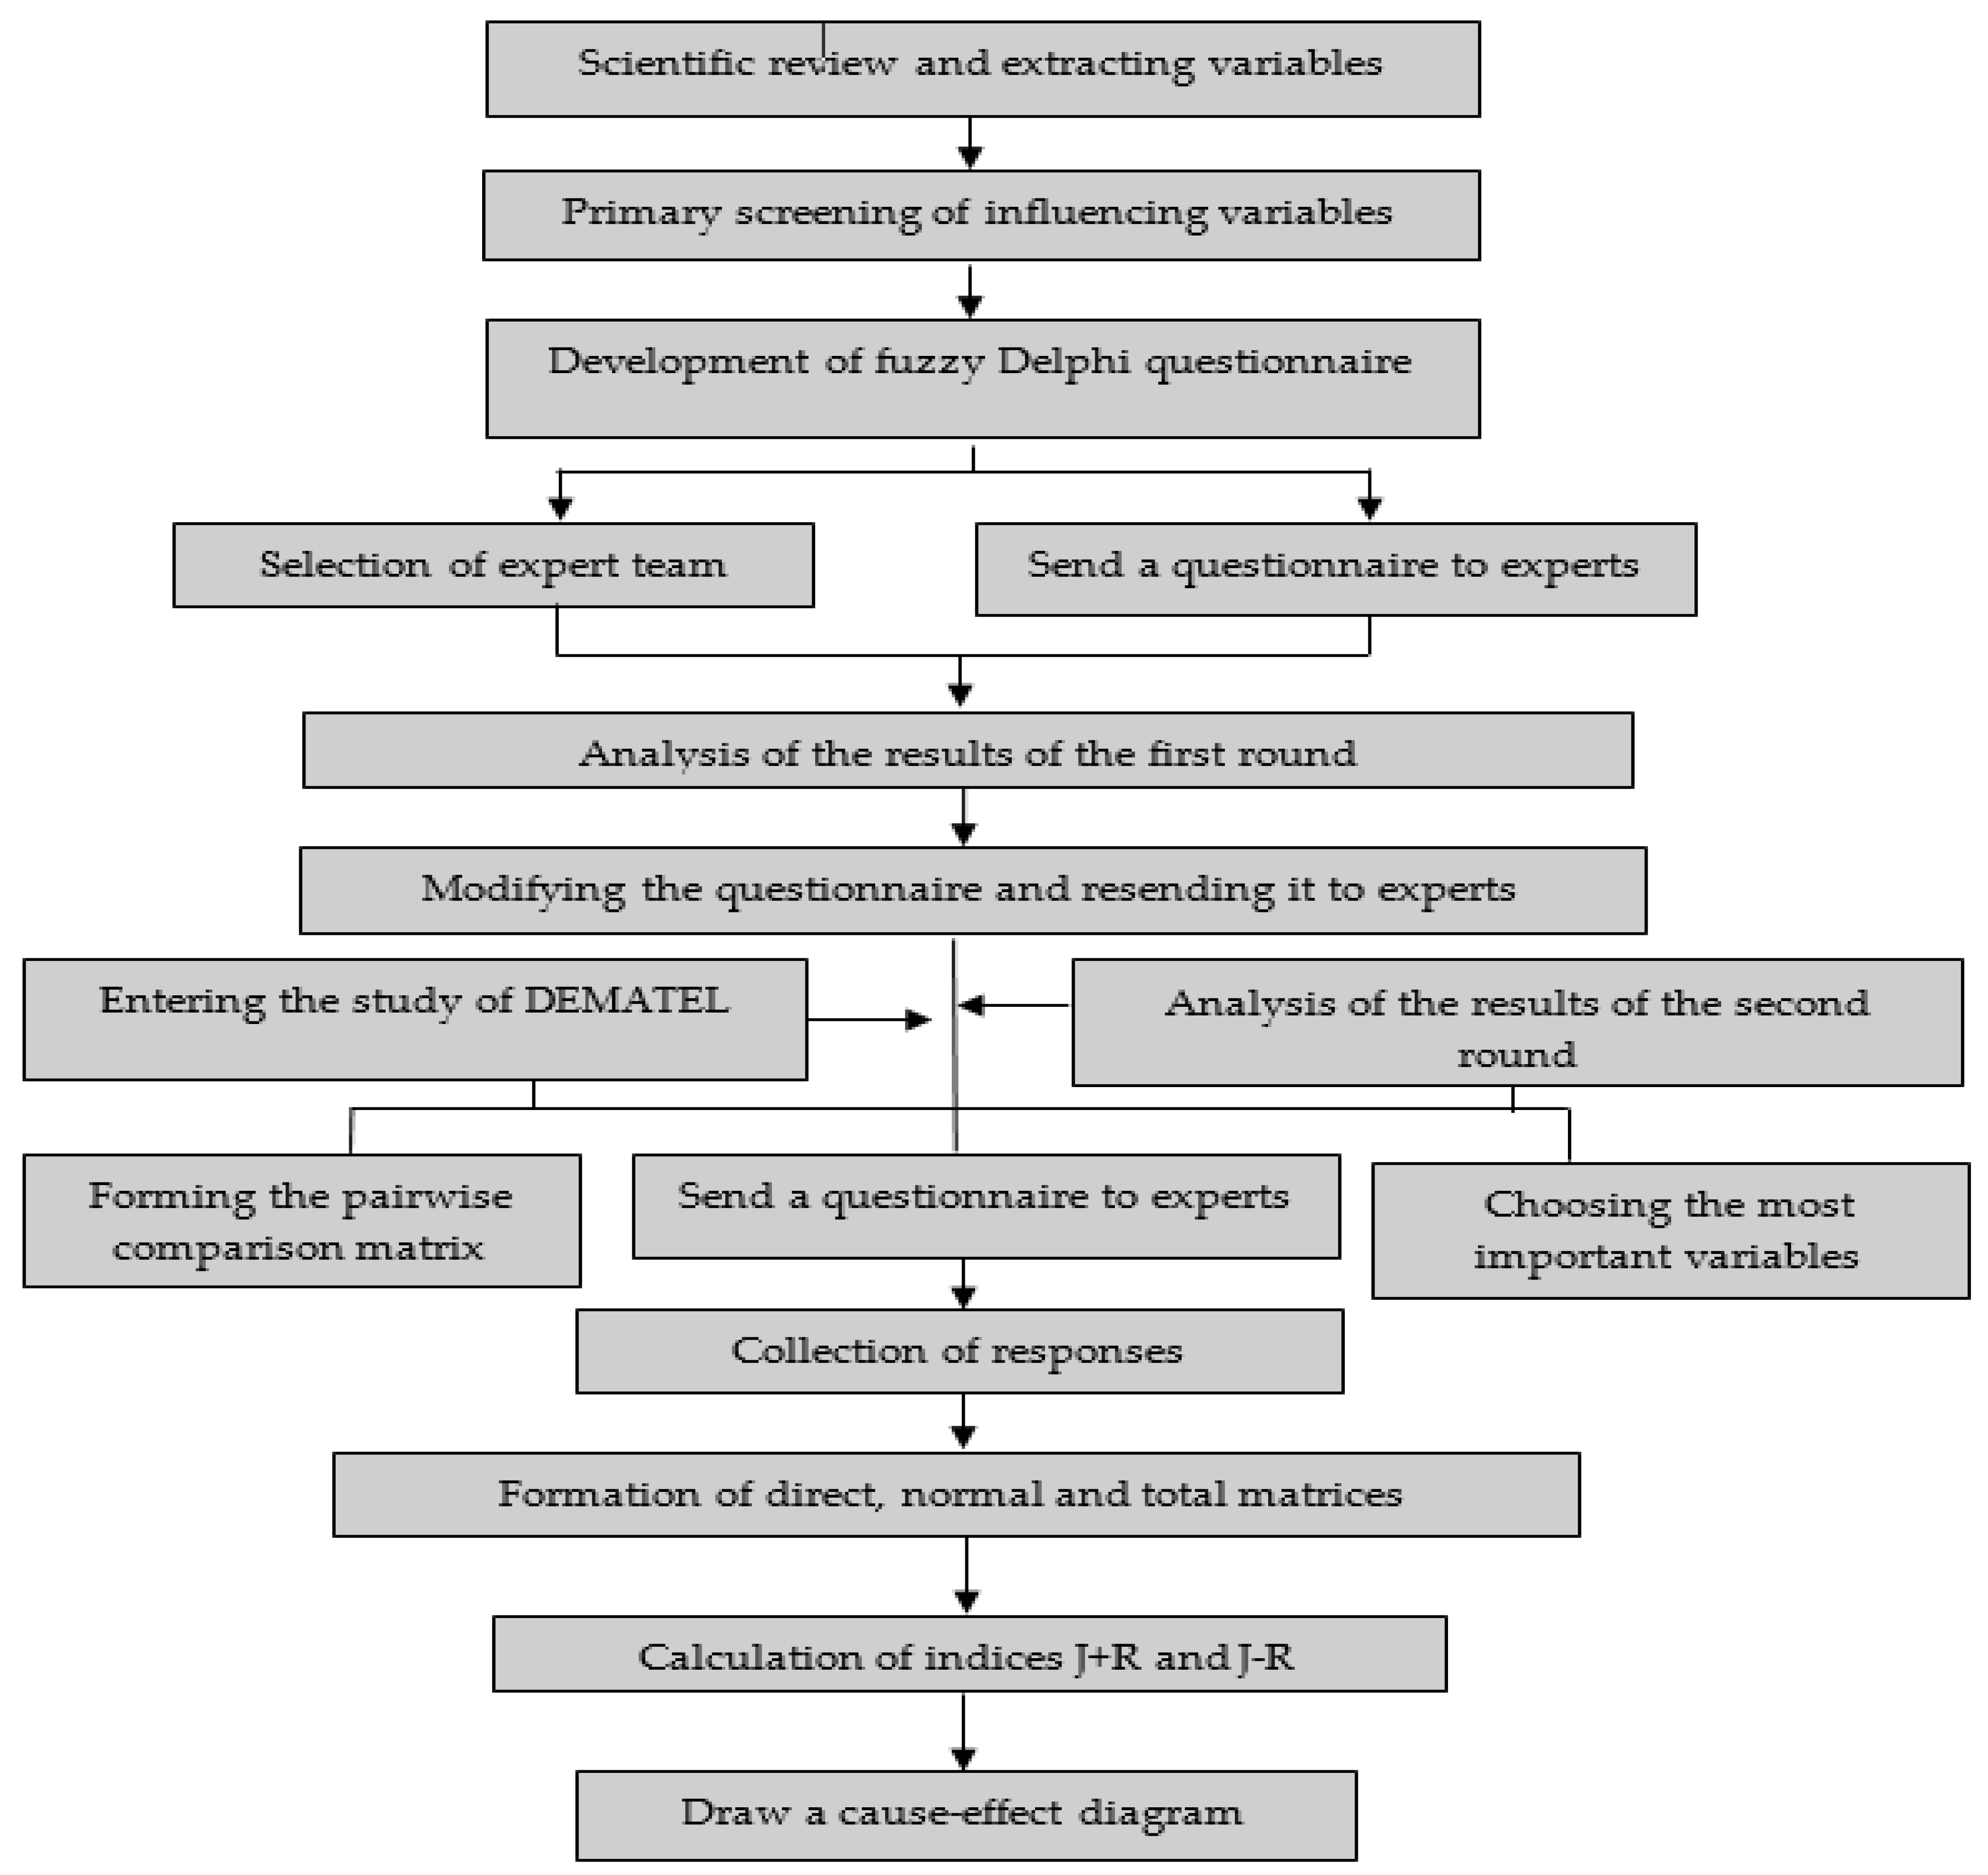
Figure 1. Roadmap and steps of conducting the study.
Sustainability 15 14277 g001
Figure 2. Triangular fuzzy number.
Sustainability 15 14277 g002
Figure 3. The Results of the Fuzzy Delphi Study Regarding the Rank of Variables Affecting RP.
Sustainability 15 14277 g003
Figure 4. Calculated R values for variables (influence index).
Sustainability 15 14277 g004
Figure 5. Calculated J values for variables (influence index).
Sustainability 15 14277 g005
Figure 6. R + J values, the amount of interaction of each variable with other variables.
Sustainability 15 14277 g006
Figure 7. R–J values, the degree of causality of each variable.
Sustainability 15 14277 g007
Figure 8. Cause–effect relationship of the most important variables affecting risk perception.
Sustainability 15 14277 g008
Table 1. TFN corresponds to linguistic terms [38].
Linguistic ExpressionsTriangular Fuzzy Numbers
No effect(1, 1, 2)
Extremely weak effect(1, 2, 3)
Weak effect(2, 3, 4)
Strong effect(3, 4, 5)
Extremely strong effect(4, 5, 5)
Table 2. Variables were selected from fuzzy Delphi to study cause-effect relationships.
Sub-GroupVariableIdentification CodeDe-Fuzzied Number
External variablesSupervision of legal organizationsSLO3.55
Organizational variablesSafety trainingST4.52
Safety management styleSM4.50
Safety cultureSC4.47
Advanced technology and equipmentATE3.98
Inspection by safety expertsISE3.93
Emergency response plansERP3.90
Operation team coordinationOTC3.89
Environmental variablesChemical pollutants (methane gas, etc.)CP3.94
LightingL3.93
NoiseS3.55
Task variablesTime pressureTP3.98
Procedures and instructionsPI3.93
Work pressureWP3.93
Individual variablesAccident experienceAE4.45
Mental healthMH4.09
TirednessT4.07
Safety attitudeSA4.04
Personal protective equipmentPPE4.02
Technical knowledgeTK4.01
Physical healthPH3.96
Job satisfactionJS3.90
Risk aversionRA3.55
Disclaimer/Publisher’s Note: The statements, opinions and data contained in all publications are solely those of the individual author(s) and contributor(s) and not of MDPI and/or the editor(s). MDPI and/or the editor(s) disclaim responsibility for any injury to people or property resulting from any ideas, methods, instructions or products referred to in the content.