Article

Different Responses of Soil Moisture to Different Artificial Forest Species on the Loess Plateau

1
State Key Laboratory of Loess and Quaternary Geology, Institute of Earth Environment, Chinese Academy of Sciences, Xi’an 710061, China
2
University of Chinese Academy of Sciences, Beijing 100049, China
3
Xi’an Institute for Innovative Earth Environment Research, Xi’an 710061, China
*
Author to whom correspondence should be addressed.
Sustainability 2023, 15(19), 14275; https://doi.org/10.3390/su151914275
Submission received: 14 August 2023 / Revised: 21 September 2023 / Accepted: 25 September 2023 / Published: 27 September 2023
(This article belongs to the Section Social Ecology and Sustainability)

Abstract

:
The Chinese Loess Plateau has undertaken a large-scale “Grain for Green” project since 1999. Understanding how reforestation affects soil moisture is crucial for ecological construction and the region’s revegetation. In this study, soil sensors were installed to monitor the soil moisture content (SMC) and soil desiccation intensity in a 0–200 cm soil profile online during the growing season, with farmland as a control and Robinia (R.) pseudoacacia L., Pinus (P.) tabulaeformis Carr., Populus (P.) alba L., and Ulmus (U.) pumila L. were selected. The results showed that the SMC increased with soil depth, and the soil moisture storage (SMS) in the 0–200 cm soil profile was ranked as R. pseudoacacia L. (424.3 mm) < farmland (479.8 mm) < U. pumila L. (569.8 mm) < P. alba L. (583.9 mm) < P. tabulaeformis Carr. (589.8 mm). Secondly, the percentages of inefficient water and gravimetric water in soil moisture were ranked as R. pseudoacacia L. (63%) > farmland (49%) > U. pumila L. (43%) > P. alba L. (17%) > P. tabulaeformis Carr. (11%). The soil desiccation intensity of artificial forests was heavy in June, light in April and July, and no desiccation in the other months. Moderate desiccation was discovered in the 0–40 cm soil layer and mild desiccation occurred in the 40–60 cm soil layer. Additionally, the representative soil layer for SMS in farmland for P. tabulaeformis Carr., U. pumila L., and R. pseudoacacia L. was the 90 cm soil layer, and the SMS representative soil layer for P. alba L. was the 70 cm soil layer. In brief, an SMS deficit occurred after the conversion of the farmland to R. pseudoacacia L., but there was an SMS surplus after the conversion of the farmland to P. alba L., U. pumila L., and P. tabulaeformis Carr. This suggests that the artificial forest species could be optimized by introducing P. tabulaeformis Carr. instead of R. pseudoacacia L., and the degradation of R. pseudoacacia L. could be suppressed by the application of a nitrogen fertilizer. Our research demonstrated that soil moisture depletion patterns were closely related to artificial forest species, and attention should be paid to the vegetation restoration and maintenance of afforestation achievements in water-constrained arid regions in the future.

1. Introduction

The Loess Plateau, located in the middle reaches of the Yellow River in northwest China, is known as one of the most severely eroded areas in the world due to its numerous gullies, thick but loose soil, exposed surfaces, and extreme climate with heavy rainfall [1,2,3]. As a major national soil and water conservation project, the “Grain for Green” project, dedicated to converting steeply sloping croplands into grasslands and forestlands, was launched in 1999 on the Loess Plateau, resulting in a significant increase in vegetation cover on the Loess Plateau from 40% in 2000 to 60% by 2020 [4]. However, the deep groundwater of the loess, coupled with the introduction of large-scale artificial vegetation planting, soil moisture supply, and demand imbalance, cannot meet the needs of both plant transpiration and soil evaporation. The soil’s long-term aridity further developed into a dried soil layer [5,6], which not only slows down the vertical transport of rainfall and groundwater, but also blocks the effective recharge of groundwater, leading to soil quality deterioration and vegetation degradation [7,8]. Increasing soil desiccation has become a scientific problem that needs to be addressed to maintain regional ecology, and it is critical to investigate how changes in artificial forest species affect soil moisture variability and depletion on the Loess Plateau [9,10].
Artificial forest species play a crucial role in regulating both the soil moisture content and transport, due to the differences in physiological characteristics such as root distribution, canopy interception, water consumption, and drought tolerance among different types of vegetation, all of which are closely related to soil moisture storage [11]. Soil desiccation is common in plantation forests introduced by large-scale afforestation on the Loess Plateau [12,13], and scholars have carried out a series of studies on the soil moisture dynamic changes and desiccation under different vegetation types. For example, Gou et al. [12] found that vegetation is the main influence factor of deep soil moisture, and the soil desiccation intensity under different vegetation types was ranked as P. simonii Carr. > R. pseudoacacia L. > H. rhamnoides L. > Armeniaca sibirica > P. tabulaeformis Carr. Liang et al. [5] found that the mean values of soil moisture depletion in R. pseudoacacia L., P. armeniaca L., C. korshinskii Kom., and H. rhamnoides L. forests were 409.96 mm, 302.06 mm, 497.62 mm, and 316.54 mm, respectively. Wang et al. [14] found that the average SMC showed a trend of farmland > grassland > shrubland > woodland, and the SMC under different woodland types was apple forest, P. tabulaeformis Carr. > A. senegal Linn., and P. orientalis. L. Zhao et al. [15] found that the average soil water storage of the five forest types was in the order of natural secondary forest land (338.68 mm) > artificial P. tabulaeformis Carr. (319.74 mm) > artificial P. orientalis L. (314.15 mm) > the mixed forest land (303.37 mm) > the R. pseudoacacia L. (292.03 mm). However, we found that most of the studies on the soil moisture characteristics of artificial forests focused on single tree species, and there were fewer studies on the soil desiccation and moisture restoration of different vegetation types in the whole region [16,17,18]. A comprehensive consideration of the soil water dynamic changes and deficit conditions of different artificial vegetation types is essential for clarifying the suitable tree species for afforestation and the rational layout of vegetation in the loess hilly areas.
Quantifying and evaluating the soil moisture depletion patterns of artificial forests is a prerequisite for sustainable vegetation restoration and rehabilitation on the Loess Plateau. Many scholars have used time domain reflectometry and frequency domain reflectometry positional monitoring, satellite remote sensing, geostatistics, and eco-hydrological modeling to accurately locate dynamic variations of soil moisture on the Loess Plateau at multiple scales (plots, fields, slopes, watersheds, regions, etc.) [19,20,21]. At the same time, various soil moisture constants serve as guidelines in vegetation restoration and reconstruction. For example, the soil moisture effectiveness criterion based on the effectiveness of soil moisture on plant growth is part of the evaluation guidelines, and the soil desiccation index is an important index for evaluating the intensity of soil desiccation. Furthermore, the soil water restoration index is an important index for evaluating the soil moisture resilience in the process of vegetation restoration, and the calculation of the soil water carrying capacity has also been a popular research topic in recent years. Studies have shown that vegetation restoration on the Loess Plateau is on the brink of the threshold of the vegetation carrying capacity for water resources, and there is only nearly a 10% enhancement space for vegetation cover [22]. In addition, the thickness of the easy water-efficient soil layer decreased with increasing forest age in plantation forests on the Loess Plateau, while the thickness of the medium, difficult and ineffective water-efficient soil layers increased. The soil desiccation intensity in plantation forests increased with forest age, and the time required and difficulty of soil moisture recovery also increased [5]. Therefore, the extensive use of soil moisture constants is helpful to scientifically assess the soil moisture depletion patterns of artificial forests on the Loess Plateau.
In relation to the difference of artificial vegetation types, soil moisture exhibits great spatial and temporal heterogeneity under the combined effects of climate, soil, topography, and vegetation [23]. Generally, at larger scales, climate and soil have a greater influence on soil moisture heterogeneity, while at smaller scales (watersheds and slopes), the influence of the vegetation type cannot be ignored [24,25]. However, a large number of studies on soil moisture in plantation forests have focused on a single tree species [14,15,16,26], and most of them have used a single evaluation method to assess soil desiccation. In addition, the conventional spatial alternative to the time approach has the drawbacks of discontinuous time series and even larger differences in years, ignoring the effects of soil properties and topography, etc., on soil moisture [27]. Therefore, four typical plantation forest species on the loess plateau were selected in this study, and multiple soil moisture constants were used to comprehensively evaluate the soil moisture depletion patterns of artificial forest species. The objectives of the study were: (1) to clarify the spatial and temporal trends of soil moisture and the soil moisture desiccation intensity of different plantation forests; (2) to reveal the soil moisture storage depletion patterns and the identification of the representative soil layer for different plantation forests; and (3) to explore the importance of soil factors and climatic factors on the differences in soil moisture among different forest types. Our study will contribute to the exploration of the interaction mechanism between vegetation types and soil moisture, providing management strategies for the optimization of plantation forests in the restoration and reconstruction of vegetation on the Loess Plateau.

2. Materials and Methods

2.1. Overview of Study Area

The study was conducted in the village of Nangou, Ansai District, Shaanxi Province, on the Loess Plateau of China (Figure 1). Ansai District belongs to Yan’an City, located in the hinterland of Loess Plateau, which is a hilly and gully area of Loess Plateau in northern Shaanxi (108°5′44″–109°26′18″ E, 36°30′45″–37°19′3″ N). The area is characterized by a complex landscape of gullies and ravines, with an altitude of 1068–1309 m and a total area of 2950 km2. It belongs to the mid-temperate continental semi-arid monsoon climate, with an annual average temperature of 8.8 °C and an annual average precipitation of 505.3 mm, which is mainly concentrated in June–September, accounting for 73.6% of the annual precipitation. Soil types in Yan’an include Cinnamon soils, Cultivated loessial soil, Red earths, Dark loessial soils, etc., among which, loessial soil is the most widely distributed. The terrestrial vegetation is warm temperate deciduous broad-leaved forest to dry grassland transition forest grassland area, the main establishment species are Quercus liaotungensis Koidz., Artemisia sacrorum Ledeb., Bothriochloa ischaemum L., Ostryopsis davidiana Decne., etc., to artificial vegetation types, such as R. pseudoacacia L., P. tabulaeformis Carr., P. alba L., Astragalus adsurgens Pall., Caragana korshinskii Kom., etc. With the introduction of “Grain for Green” project in the 1990s, most of the arable land in Yan’an has been converted into forest and grassland.

2.2. Experimental Design and Sampling

Adjacent cropland (farmland) was selected as a control in Nangou, Yan’an, and typical planted vegetation of R. pseudoacacia L., P. tabulaeformis Carr., P. alba L., and U. pumila L. under the same stand conditions were selected for the study, while a sample plot survey was conducted. The morphology of these four observed plantations is presented in Figure 1, and their basic information is shown in Table 1. A 20 × 20 m sample square was delineated in each plantation. Within each plot, soil temperature and moisture sensors (EC-5, Decagon Devices, Pullman, WA, USA) were installed at eight soil layers (10, 30, 50, 70, 90, 130, 170, 200 cm) along the vertical profile of 200 cm soil depth in April 2022. Each sensor was measured and recorded at 5 min intervals using a data collector during tree growing seasons (April to October) A meteorological tipping bucket rain gauge was installed in an open area near the sample plots for simultaneous meteorological monitoring (Figure 2).
At the same time, soil samples were collected in 8 soil layers (10, 30, 50, 70, 90, 130, 170, 200 cm) along 3 soil profiles of the rectangular soil pit, 120 ring knives and 120 aluminum cassettes were collected, soil bulk density was determined using the ring knife method for each vegetation type, aluminum cassettes were used to calibrate the soil moisture content, and the corresponding soil samples were brought back to the laboratory for the measurement of the soil physico-chemical properties. The 5 soil pits were backfilled after sensor installation and samples collection were completed.

2.3. Soil Desiccation Evaluation

The coefficient of variation (CV) characterizes the degree of dispersion of a random variable and is calculated as follows:
C V = s d S M C ¯ × 100 %
where sd represents standard deviation and S M C ¯ represents mean soil volume moisture content (%). CV ≤ 10% means weak variation, 10% < CV < 100% means moderate variation, and CV ≥ 100% means strong variation.
The soil desiccation index (SDI) is characterized as the proportion of the actual effective soil moisture content in a soil layer that is available for plant uptake to the soil moisture content of that layer and is calculated as follows:
S D I = θ θ w θ s θ w
where θ is the actual soil moisture content (%), θ w is the soil wilting moisture, θ s   and θ f   is soil stable moisture (%). Higher SDI values indicate that the effective soil moisture content available for plant uptake is also higher and the intensity of soil desiccation is lower. In this study, θ s was used as the arithmetic mean of θ w and θ f , θ w and θ f   were quoted from Zhang et al. [28], and the values were shown in Table 2.
Soil moisture storage (SMS) is calculated as follows:
S M S = S M C × B D ρ w × h
where BD is the soil bulk density (g/cm3), ρ w is the water density with a value of 1 g/cm3, and h is the soil depth (mm).
Soil moisture storage deficit (SMSD) is calculated by the following equation:
S M S D = i = 1 n S M S l i S M S c i S M S l i × 100 %
where S M S l i is the soil moisture storage of farmland and S M S c i is the soil moisture storage of 0-i cm soil layer in forest land, i = 10, 30, 50, 70, 90, 130, 170, 200 cm.

2.4. Soil Moisture Time Stability Analysis

The time stability analysis is usually analyzed by the relative difference analysis method. The mean relative difference indicates the concentration trend of SMS at the same measurement site at different monitoring times, and the closer the value is to 0, the more representative the SMS is of the average SMS at the sample site [29,30]. The standard deviation and mean relative difference are calculated as follows:
δ i ¯ = 1 m j = 1 m S M S i j S M S j ¯ S M S j ¯
σ ( δ i ) = 1 m 1 j = 1 m ( δ i j δ i ¯ ) 2
where S M S j ¯ is the average SMS at the same depth at time j, mm; m is the number of times the SMS is monitored during the monitoring period, taken as 7; δ i ¯ is the average of the relative difference of SMS at monitoring point i during the monitoring period; and σ δ i   is the standard deviation of the relative difference of SMS.
The highest Index of temporal-stability at depth ( I T S D i ) was identified by comparing the temporal stability index of different soil depths, which can represent the average soil moisture condition and is calculated as follows [31]:
I T S D i = δ i ¯ 2 + σ ( δ i ) 2
The Nash–Sutcliffe efficiency coefficient (NSE) is one of the methods used to evaluate whether the representative soil depth is representative of the soil moisture in this stand. The NSE takes values in the range of −∞ to 1. The closer the NSE tends to 1, the more representative it is and the more credible the results are. If the NSE tends to 0, it means that the results at the representative point which are close to the NSE tend to be close to 0, which means that the results of the representative points are close to the mean level of the observed values, i.e., the overall results are credible, but with large errors. If the NSE is much less than 0, this means that the results are not credible. The calculation formula is as follows:
N S E = 1 t 1 T ( S M S i j S M S ) 2 t 1 T ( S M S i j S M S i ¯ ) 2
where S M S i j refers to the soil moisture storage at moment j at i soil layer, mm; SMS refers to the soil moisture storage of the representative soil layer; and S M S i ¯ indicates the total average of the observed values.

2.5. Statistical Analyses

Data processing and descriptive statistics were performed by Excel 2016 software. One-way ANOVA module in SPSS 22.0 software was used to explore soil moisture storage differences in different soil layers, linear fitting module in SPSS 22.0 software was used for soil moisture and soil temperature fitting in different soil layers, and correlation and regression analysis module in SPSS 22.0 software was used for contribution analysis of soil moisture influencing factors. Graphing was performed by using OriginPro 9.1 software.

3. Results

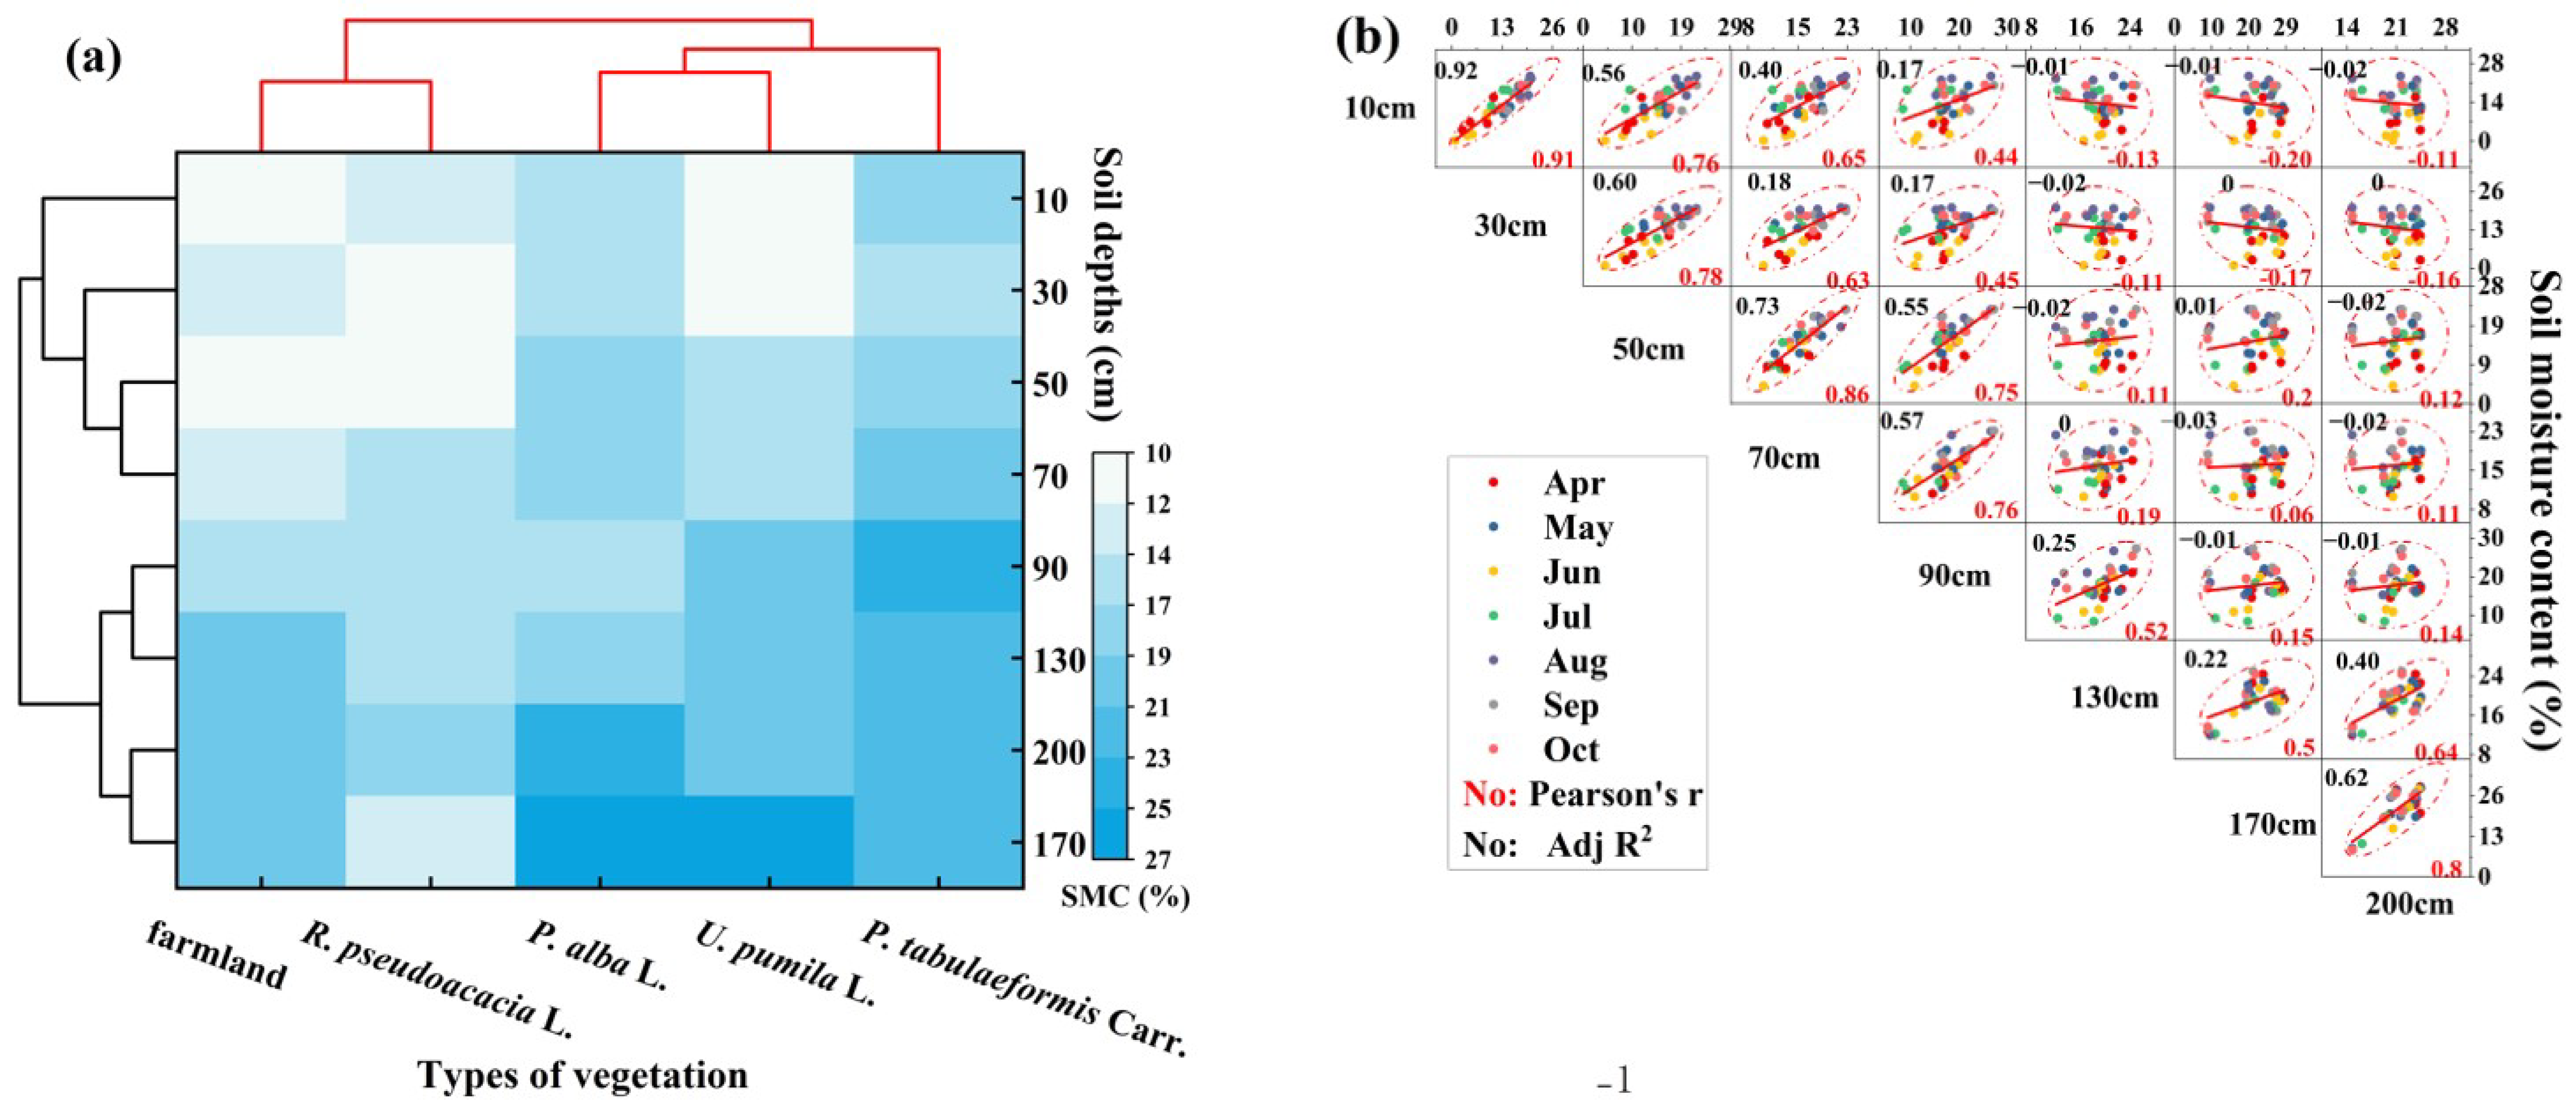
3.1. Spatial and Temporal Variation of Soil Moisture

The soil moisture content (SMC) increased with the soil depth and was significantly greater in the 100–200 cm soil layer than in the 0–80 cm soil layer (p < 0.05) (Figure 3a–g). In addition, we found that SMC decreased significantly along the soil profile at the beginning of the growing season (April–June), while there was little change at the end of the growing season. SMC in the growing season was the lowest in June and highest in August, and was significantly higher in August–October than in June–July (p < 0.05). During the growing season, the mean SMC of different vegetation types in April, May, August, and September was not significantly different (p < 0.05), ranked as P. tabulaeformis Carr. > P. alba L. > U. pumila L. > R. pseudoacacia L. > farmland. The mean SMC ranked as P. tabulaeformis Carr. > P. alba L. > U. pumila L. > farmland > R. pseudoacacia L. in June and October, and ranked as P. alba L. > P. tabulaeformis Carr. > U. pumila L. > farmland > R. pseudoacacia L. in July. The mean SMC of R. pseudoacacia L. and farmland was always lower than the other vegetation types, and the mean SMC of R. pseudoacacia L. was lower than that of farmland during the dry season. The CV values of SMC decreased with the increasing soil depth and were moderately variable in the order of June > April > July > September > October > August > May (Figure 3h). Additionally, the percentages of inefficient and gravimetric water in soil moisture were ranked as R. pseudoacacia L. (63%) > farmland (49%) > U. pumila L. (43%) > P. alba L. (17%) > P. tabulaeformis Carr. (11%). The vegetation type with the largest proportion of soil efficient and gravimetric water was P. tabulaeformis Carr., the largest proportion of medium-efficient water was P. alba L., and the vegetation type with the largest proportion of difficult and inefficient water was R. pseudoacacia L. (Figure 3a–g).
Depending on the desiccation classification criteria (Table 3), the degree of soil desiccation of artificial forests was heavy in June, light in April and July, and there was no desiccation in the remaining months. The soil desiccation index (SDI) decreased with the increasing soil depth, where the soil was moderately desiccated in the 0–40 cm layer, mildly desiccated in the 40–60 cm layer, and not desiccated in the deeper layers. The 0–40 cm soil layer of the P. alba L. was lightly desiccated, and the 0–20 cm soil layer of P. tabulaeformis Carr. was lightly desiccated. For farmland, the 0–20 cm and 40–60 cm soil layers of farmland were moderately desiccated, and the 20–40 cm and 60–80 cm soil layers were lightly desiccated. For R. pseudoacacia L., the 20–60 cm soil layer was heavily desiccated, the 0–20 cm and 160–180 cm soil layers were moderately desiccated, and the 60–160 cm soil layer was lightly desiccated. For U. pumila L., the 0–20 cm soil layer was strongly desiccated and the 20–40 cm soil layer was heavily desiccated (Figure 4). Temporal stability analyses showed that the 90 cm soil layer in the 200 cm soil profile in P. tabulaeformis Carr., U. pumila L., R. pseudoacacia L., and farmland had a mean relative difference (MRD) value closest to 0 and the smallest index of temporal stability at depth (ITSD) value, so the representative soil layer for SMS in farmland, P. tabulaeformis Carr., U. pumila L., and R. pseudoacacia L. was the 90 cm soil layer. Correspondingly, the SMS representative soil layer for P. alba L. is the 70 cm layer (Figure 5a). The results of fitting the representative soil layer and the mean soil storage showed that the coefficient of determination (R2) was ranked as P. tabulaeformis Carr. = U. pumila L. > farmland > P. alba L. > R. pseudoacacia L., with the best fit for the P. tabulaeformis Carr. and U. pumila L. and the average fit for the R. pseudoacacia L. due to its large standard deviation. The Nash coefficient (NSE) test showed that the NSE was ranked as P. tabulaeformis Carr. (−0.12) > R. pseudoacacia L. (−0.13) > U. pumila L. (−0.14) > farmland (−0.20) > P. alba L. (−0.28), and the values all converged to 0, implying that the SMS of the representative soil layer was close to the mean level of SMS, indicating that the overall results were reliable (Figure 5b).

3.2. Soil Moisture Depletion by Vegetation Type

The soil moisture storage (SMS) of typical vegetation differed from month to month during the growing season, ranked as May > September > August > October > April > July > June, but the differences were not significant (p < 0.05). SMS along the soil profile was characterized by an increasing pattern, with the SMS ranking being consistent between the different soil layers in April, June, and September, increasing layer by layer, and increasing roughly in the remaining months. The minimum SMS values for the 10 cm, 30 cm, and 50 cm soil layers occurred in June, the maximum values in August. The minimum values for the 90 cm and 130 cm soil layers were in July and the minimum values for the 70 cm soil layer were in July. The minimum value of SMS for the 70 cm soil layer occurred in September, the minimum value of SMS for the 190 cm soil layer occurred in August, and the maximum value of SMS for the 130 cm, 170 cm, and 190 cm soil layers occurred in April (Table 4).
SMS in different soil layers was clustered into shallow (0–90 cm) and deep (90–200 cm), the SMS in the 0–90 cm soil layer was not significantly different among vegetation types in the order of P. tabulaeformis Carr. (181.5 mm) > P. alba L. (165.0 mm) > U. pumila L. (140.2 mm) > farmland (132.0 mm) > R. pseudoacacia L. (128. 4 mm), and the SMS in the 90–200 cm soil layer was significantly different among vegetation types in the order of U. pumila L. (429.7 mm) > P. alba L. (418.9 mm) > P. tabulaeformis Carr. (408.3 mm), with insignificant differences between the P. tabulaeformis Carr., P. alba L., and U. pumila L. forests (p < 0.05) (Figure 6a). SMC in adjacent soil layers was significantly positively correlated and the linear fit was good. However, the SMC in the 0–90 cm and 90–200 cm soil layers were negatively correlated and the linear fit was poor, indicating that there was a barrier to the vertical transport of soil moisture in the 90 cm soil layer (Figure 6b). In addition, we found that SMS in the 90–200 cm soil layer was less fluctuating and more stable than that in the 0–90 cm soil layer. The temporal variation pattern of SMS in the 0–90 cm soil layer was consistent with the fluctuating trend of rainfall, with the lowest SMS in June. The temporal variation pattern of SMS in the 90–200 cm soil layer showed a trend of decreasing and then increasing, with the lowest SMS in July (Figure 7a). The soil moisture storage deficits (SMSD) were 3%, −37%, −6%, and −25% in the 0–90cm soil layer for R. pseudoacacia L., P. tabulaeformis Carr., U. pumila L., and P. alba L., respectively, with the maximum SMS in P. tabulaeformis Carr. being 1.37 times that of farmland. Correspondingly, SMSD were 15%, −17%, −24%, and −20% in the 90–200cm soil layer for R. pseudoacacia L., P. tabulaeformis Carr., U. pumila L., and P. alba L., respectively, with the maximum SMS in U. pumila L. being 1.24 times that of farmland. The R. pseudoacacia L. forest had SMSDs in the 30 cm, 50 cm, 130 cm, 170 cm, and 200 cm soil layers, the U. pumila L. forest had SMSDs in the 30 cm soil layer, and there were no SMSDs in the P. alba L. and P. tabulaeformis Carr. forests (Figure 7b).

3.3. Factors Influencing Soil Moisture

There was a clear second-order linear function between soil temperature and SMC, and the fitting coefficients R2 under different vegetations were all close to 1, which was an excellent fit. In addition, the slope was less than 0 except for the R. pseudoacacia L. forest, indicating that SMC decreased with the increasing soil temperature (Figure 8). The correlation analysis showed that SMC is closely related to soil properties and climatic factors. The importance of soil factors on SMC was ranked as P. tabulaeformis Carr. (75.04%) > R. pseudoacacia L. (72.45%) > farmland (70.42%) > P. alba L. (62.41%) > U. pumila L. (48.02%), and the importance of climatic factors on SMC was ranked as U. pumila L. (51.98%) > P. alba L. (37.59%) > farmland (29.58%) > R. pseudoacacia L. (27.55%) > P. tabulaeformis Carr. (25.96%). It can be seen that the SMC is more influenced by soil factors than climatic factors, except for U. pumila L. Among the climatic factors, SMC was significantly positively correlated with air moisture and relative humidity (RH), and negatively correlated with air temperature and wind speed. Among the soil factors, SMC in U. pumila L. is mainly influenced by NH4+-N, SMC in the P. tabulaeformis Carr. forest is mainly influenced by the available P, SMC in the R. pseudoacacia L. forest is mainly influenced by the available N, SMC in farmland is influenced by the combination of C, N, and P, and SMC in the P. alba L. forest is mainly influenced by the available N and P. The regression coefficients of soil factors on SMC were lower than those of climatic factors in P. alba L., U. pumila L., P. tabulaeformis Carr., and farmland, suggesting that changes of SMC were more easily explained by climatic factors in P. alba L., U. pumila L., P. tabulaeformis Carr., and farmland, whereas soil factors were more likely to explain changes of SMC in R. pseudoacacia L. (Figure 9).

4. Discussion

4.1. Soil Moisture Consumption Characteristics by Vegetation Type

The vertical distribution pattern of soil moisture along the soil profile is, to some extent, a reflection of soil moisture transport and its stability, while the CV is a reflection of the degree of soil moisture stability. In this study, the CV of soil moisture in the deeper layers was much lower than that in the shallow layers. This is due to the fact that the topsoil is usually susceptible to external environmental factors such as rainfall, snowmelt infiltration recharge, and evaporation, resulting in the high variability of soil moisture, which is consistent with the findings of Zhu et al. [32] who stated that the CV of moisture decreases with the increasing depth of soil layers. Secondly, there were temporal differences in SMC in different months of the growing season, which we attributed to sharp fluctuations in the soil moisture content due to rainfall duration, rainfall intensity, and precipitation and evaporation intensity [33]. Further, we found that the SMC in deeper soil layers of plantation forests is significantly higher than that in shallow soil layers, firstly because the SMC in the shallow soil layers was more likely to decline under the influence of wind, temperature, and solar radiation compared to the SMC in the deeper soil layers, and secondly because the plant root system was well-developed and the soil microbial environment was improved, forming a series of connected macropores in the soil during its root growth and forming a mid-loam flow during rainfall events, allowing water to accumulate in the deep soil [34].
Forests have important ecohydrological functions interacting with vegetation growth [35,36], and large-scale unreasonable afforestation has caused frequent soil desiccation on the Loess Plateau since the implementation of the “Grain for Green” project [20]. In this study, it was found that the SMC in R. pseudoacacia L. was lower than that in P. tabulaeformis Carr. under the same stand conditions due to the lower intensity of evapotranspiration and water consumption in P. tabulaeformis Carr., while R. pseudoacacia L. has a well-developed root system, high evapotranspiration, and is under long-term drought stress, which is consistent with previous studies [5,12,37]. In addition, we found that the difference in the SMC between P. alba L. and P. tabulaeformis Carr. was not significant, both being higher than that of R. pseudoacacia L. This finding is inconsistent with the conclusion of Han et al. [38] who stated that P. alba L. is a highly water-consuming plant, probably due to the shade-loving nature of P. alba L. in the study area, low solar radiation intensity, and thick deadfall layer, resulting in less soil moisture evaporation from P. alba L., and therefore, no significant decrease of the SMC. Further, we found that the vegetation with the largest proportion of soil easy water was P. tabulaeformis Carr., the largest proportion of moderate water in P. alba L., and the largest proportion of difficult and inefficient water was in R. pseudoacacia L., attributed to the fact that soil moisture effectiveness is closely related to irrigation, vegetation type, evapotranspiration, climate, and root distribution [16]. The differences in the root distribution and water consumption of different vegetation types in this study gave rise to differences in soil moisture effectiveness.

4.2. Soil Moisture Deficit after Reforestation

The soil moisture content of forests varies depending on plant canopy, root distribution, litter layer, topography, wind speed, and solar radiation [39,40]. In this study, we found that P. tabulaeformis Carr., P. alba L., and U. pumila L. had the highest SDI in the 40–60 cm soil layer, and R. pseudoacacia L. had the highest SDI in the 160–180 cm soil layer. This is attributed to the fact that R. pseudoacacia L. is a strong water-consuming species with great transpiration and a well-developed root system, which has a high utilization rate of deep soil moisture, resulting in a deep soil moisture deficit [5]. The root length and root weight density of P. tabulaeformis Carr., P. alba L., and U. pumila L. root systems in the 0–60 cm soil layer accounted for more than 70% of the total root density, so the soil moisture deficit was most severe in this soil layer. In addition, P. tabulaeformis Carr. can also enhance soil drought tolerance, which can further explain its higher soil moisture content than R. pseudoacacia L. [41].
The effect of vegetation on soil moisture storage is directly reflected in the differences in the transpiration rate, root distribution, and canopy width between different vegetation types, and indirectly in the improvement of soil physical and chemical properties, which can increase the soil moisture retention capacity [42,43,44]. Most of the stands can maintain the soil moisture balance and have a water surplus at the end of the growing season [45]. However, soil desiccation is increasingly threatening the normal growth of plantation forests on the Loess Plateau under the duress of global warming [7]. Numerous studies have shown that there are varying degrees of soil moisture deficiencies in plantation forests [10,41]. In this study, an SMS deficit was observed after fallowing to R. pseudoacacia L., and an SMS surplus was observed after fallowing to P. tabulaeformis Carr., P. alba L., and U. pumila L., which is due to the different physiological characteristics among tree species during vegetation construction that make the water consumption structure of different tree species different [43,44]. Compared with other land use types, R. pseudoacacia L. has deeper roots and a higher transpiration intensity [46], its stronger transpiration consumed a much deeper soil moisture, and rainfall cannot be supplied in a balanced manner, which resulted in a decrease in soil moisture storage within R. pseudoacacia L.

4.3. Implications for Afforestation Management

As a direct source of soil moisture recharge, rainfall is not only closely related to the soil moisture recharge capacity, but also directly affects vegetation growth [47], and rainfall events and the redistribution of rainwater in the soil can directly affect soil moisture recharge. In the study, the response of SMC to rainfall showed that the shallow SMC changed synchronously with rainfall and was responsive, while the response of deep SMC to rainfall had a lag and was not very variable, which is similar to the findings of Sun et al. [47] who stated that the rainfall volume and rainfall duration affect soil moisture mainly in the 0–50 cm soil layer, while rainfall intensity mainly affects the 0–30 cm soil layer, which is due to the fact that during rainfall, rainfall has to overcome both sorption and retention in the topsoil layer and restrain transpiration and water consumption by vegetation in order to recharge and infiltrate to the deeper soil layer, thus effectively increasing soil moisture replenishment [42]. Vegetation growth and development are closely linked to soil hydrothermal conditions, and soil moisture and soil temperature are important indicators of soil hydrothermal characteristics. Soil temperature not only affects the physiological activities of above-ground plant parts, but also influences underground root respiration, nutrient uptake, and other activities, and is closely related to plant growth and development [48]. The linear fit coefficients R2 for both soil temperature and moisture were close to 1, indicating the fit was excellent (Figure 8), which was consistent with the results of Liu et al.’s [49] study on the benign coupling of soil temperature and moisture. Furthermore, the decrease in SMC with the increasing soil temperature for all land use types, except R. pseudoacacia L., was inconsistent with the finding of Liu et al. [49] who stated that soil temperature and moisture were significantly and positively correlated, possibly due to differences in the influencing factors of soil temperature in different soil layers, which were monitored in this study for the 0–200 cm soil layer, while previous studies were conducted for the 0–30 cm topsoil layer. Furthermore, SMC is closely related to soil physicochemical properties and climatic environmental factors, and is more influenced by the combination of soil factors than climatic factors, except for U. pumila L., which we attribute to the fact that the U. pumila L. selected for the study are younger and have sparse canopies, and thus are susceptible to climatic factors [50]. The regression coefficients of soil factors on SMC in P. alba L., U. pumila L., P. tabulaeformis Carr., and farmland are lower than those of climatic factors, indicating that SMC in P. alba L., U. pumila L., and P. tabulaeformis Carr. is more susceptible to air humidity, which does not contradict the results of the correlation analysis because the possible existence of covariance in the soil factors was tested out in the regression analysis. In contrast, SMC in R. pseudoacacia L. was more easily explained by soil factors, mainly limited by the available N content [51,52,53].

5. Conclusions

In this study, we monitored the real-time soil moisture content of artificial forests on the Loess Plateau in a 200 cm soil profile during the growing season. The study found that there was a deficit in SMS in the 0–200 cm soil layer after the conversion of farmland to R. pseudoacacia L., mainly in the 30 cm, 50 cm, 130 cm, 170 cm, and 200 cm soil layers. There was a surplus of SMS after the conversion of farmland to P. alba L., P. tabulaeformis Carr., and U. pumila L. Secondly, the representative soil layer of SMS was 90 cm in R. pseudoacacia L., P. tabulaeformis Carr., U. pumila L., and farmland, and 70 cm in P. alba L. Additionally, it was found that a change of SMC in R. pseudoacacia L. is more easily explained by soil factors and is mainly limited by the available N content. In conclusion, our research explores the SMC deficit status of different plantation forests, optimizes the real-time monitoring method of SMC by fitting its representative soil layer, and finally, refines the influence factors of the SMC of different plantation forests, which provides a reference for the sustainable development of vegetation restoration and afforestation results on the Loess Plateau.

Author Contributions

Conceptualization, J.C. (Jing Cao) and Y.C.; methodology, J.C. (Jing Cao); software, J.C. (Jing Cao); investigation, J.C. (Jingshu Chen) and Y.Z.; writing—original draft preparation, J.C. (Jing Cao); writing—review and editing, J.C. (Jing Cao); visualization, J.W. and Y.J.; supervision, Y.C.; project administration, J.C. (Jing Cao); funding acquisition, Y.C. All authors have read and agreed to the published version of the manuscript.

Funding

This research was funded by the National Natural Science Foundation of China, grant number 42041005.

Institutional Review Board Statement

Not applicable.

Informed Consent Statement

Not applicable.

Data Availability Statement

The data presented in this study are available on request from the corresponding author. The data are not publicly available due to the manuscript containing a large amount of data, including some unpublished data.

Conflicts of Interest

The authors declare no conflict of interest.

References

  1. Fu, B.J.; Liu, Y.; Lv, Y.H.; He, C.S.; Zeng, Y.; Wu, B.F. Assessing the soil erosion control service of ecosystems change in the Loess Plateau of China. Ecol. Complex. 2011, 8, 284–293. [Google Scholar] [CrossRef]
  2. Jia, X.X.; Shao, M.A.; Wei, X.R.; Zhu, Y.J.; Wang, Y.Q.; Hu, W. Policy development for sustainable soil water use on China’s Loess Plateau. Sci. Bull. 2020, 65, 2053–2056. [Google Scholar] [CrossRef] [PubMed]
  3. He, L.; Guo, J.W.; Zhang, X.P.; Liu, B.Y.; Guzmán, G.; Gómeza, J.A. Vegetation restoration dominated the attenuated soil loss rate on the Loess Plateau, China over the last 50 years. Catena 2023, 228, 107149. [Google Scholar] [CrossRef]
  4. Zhao, J.; Feng, X.M.; Deng, L.; Yang, Y.Z.; Zhao, Z.; Zhao, P.X.; Peng, C.H.; Fu, B.J. Quantifying the effects of vegetation restorations on the soil erosion export and nutrient loss on the Loess Plateau. Front. Plant Sci. 2020, 11, 573126. [Google Scholar] [CrossRef]
  5. Liang, H.B.; Xue, Y.Y.; An, W.M.; Wang, S.; Li, Z.S.; Lv, Y.H. Effects of different revegetation types on soil desiccation in the Loess Plateau. Res. Soil Water Conserv. 2018, 25, 77–85. [Google Scholar]
  6. Liu, B.X.; Ren, J.; Shao, M.A.; Jia, X.X. The process of soil desiccation under artificial shrub and grass in northern Loess Plateau. Acta Ecol. Sin. 2020, 40, 3795–3803. [Google Scholar]
  7. Li, J.; Chen, B.; Li, X.F.; Zhao, Y.J.; Ciren, Y.J.; Jiang, B.; Hu, W.; Cheng, J.M.; Shao, M.A. Effects of deep soil desiccation on artificial forestlands in diferent vegetation zones on the Loess Plateau of China. J. Acta Ecol. Sin. 2008, 28, 1429–1445. [Google Scholar]
  8. Chen, H.S.; Shao, M.A.; Li, Y.Y. The characteristics of soil water cycle and water balance on steep grassland under natural and simulated rainfall conditions in the Loess Plateau of China. J. Hydrol. 2008, 360, 242–251. [Google Scholar] [CrossRef]
  9. Deng, L.; Yan, W.M.; Zhang, Y.W.; Shangguan, Z.P. Severe depletion of soil moisture following land-use changes for ecological restoration: Evidence from northern China. For. Ecol. Manag. 2016, 366, 1–10. [Google Scholar] [CrossRef]
  10. Shao, M.A.; Jia, X.X.; Wang, Y.Q.; Zhu, Y.J. A Review of studies on dried soil layers in the Loess Plateau. Adv. Earth Sci. 2016, 31, 14–22. [Google Scholar]
  11. Huang, Z.; Liu, Y.; Qiu, K.; López-Vicente, M.; Shen, W.; Wu, G.L. Soil water deficit in deep soil layers results from the planted forest in a semi-arid sandy land: Implications for sustainable agroforestry water management. Agric. Water Manag. 2021, 254, 106985. [Google Scholar] [CrossRef]
  12. Gou, Q.P.; Zhu, Q.K.; Li, Y.X.; Shen, M.S.; Liu, Y.Y.; Mei, X.M.; Wang, Y. Soil desiccation effects under different vegetation types in the Loess Region of Northern Shaanxi. Acta Ecol. Sin. 2019, 39, 7161–7168. [Google Scholar]
  13. Fang, L.D.; Ning, Q.R.; Guo, J.J.; Gong, X.W.; Hao, G.Y. Hydraulic limitation underlies the dieback of populus pseudo-simonii trees in water-limited areas of northern China. For. Ecol. Manag. 2020, 483, 118764. [Google Scholar] [CrossRef]
  14. Wang, G.L.; Liu, G.B.; Dang, X.H. Effects of land use on soil moisture in loess hilly and gully region of China. Trans. Chin. Soc. Agric. Eng. 2009, 25, 31–35. [Google Scholar]
  15. Zhao, D.Y.; Bi, H.X.; Hou, G.R.; Cui, Y.H.; Wang, N.; Wang, S.S.; Ma, X.Z.; Feng, X. Soil moisture dynamics of typical plantation in loess region of west Shanxi. J. Soil Water Conserv. 2021, 35, 181–187. [Google Scholar]
  16. Fan, J.W.; Zhu, G.Y.; Shangguan, Z.P.; Deng, L. Dynamics changes of soil aggregate stability and soil erodibility of Robinia pseudoacacia plantations in hilly region of the Loess Plateau. J. Soil Water Conserv. 2023, 37, 19–26. [Google Scholar]
  17. Wang, D.D.; Xu, H.C.; Dan, Z.J.; Qin, W. Effects of Robinia pseudoacacia litter cover and roots on soil erosion in the Loess Plateau, China. J. Soil Water Conserv. 2023, 37, 83–89. [Google Scholar]
  18. Zhao, M.; Ma, B.Y.; Zhao, J.P.; Chen, F.F.; Sun, Y.R.; Wang, Y.J.; Chen, Y.M. Characteristics of leaf nutrient resorption of Robinia pseudoacacia at different ages in hilly and gully regions. Chin. J. Appl. Environ. Biol. 2023, 29, 401–407. [Google Scholar]
  19. Yi, X.B.; Jia, X.X.; Shao, M.A.; Zhao, C.L. Regional spatial and seasonal characteristics of soil desiccation on the Loess Plateau. Adv. Water Sci. 2017, 28, 373–381. [Google Scholar]
  20. Jia, X.; Shao, M.; Zhu, Y.; Luo, Y. Soil moisture decline due to afforestation across the Loess Plateau, China. J. Hydrol. 2017, 546, 113–122. [Google Scholar] [CrossRef]
  21. Zhang, H.Y.; Sun, S.C.; Wu, Y.Z.; An, J.; Song, H.L. Distribution characteristics of soil water, carbon and nitrogen under different vegetation densities in Loess Plateau. Ecol. Environ. Sci. 2022, 31, 875–884. [Google Scholar]
  22. Gao, H.D.; Pang, G.W.; Li, Z.B.; Cheng, S.D. Evaluating the potential of vegetation restoration in the Loess Platea. Acta Geogr. Sin. 2017, 72, 863–874. [Google Scholar]
  23. Duan, G.X.; Jia, X.X.; Bai, X.; Wei, X.R. Application and progress of electrical resistivity tomography in pedohydrology-citespace-based quantitative analysis. Chin. J. Soil Sci. 2021, 52, 1447–1459. [Google Scholar]
  24. Yao, X.L.; Fu, B.J.; Lv, Y.H.; Chang, R.Y.; Wang, Y.F.; Su, C.H. The multi-scale spalial variance of soil moisture in the semi-arid Loess Plateau of China. J. Soils Sediments 2012, 12, 694–703. [Google Scholar] [CrossRef]
  25. An, W.M.; Han, X.Y.; Li, Z.S.; Wang, S.; Wu, X.; Lv, Y.H.; Liu, G.H.; Fu, B.J. Effects of different vegetation restoration types on the slope difference of soil water content in the Loess Plateau, China. Acta Ecol. Sin. 2018, 38, 4852–4860. [Google Scholar]
  26. Liang, X.; Xin, Z.; Shen, H.; Yan, T. Deep soil water deficit causes Populus simonii Carr degradation in the three north shelterbelt region of China. J. Hydrol. 2022, 612, 128201. [Google Scholar] [CrossRef]
  27. Chen, F.F.; Zhao, J.P.; Chen, Y.M. Characteristics of soil moisture in typical young plantations in Loess Hilly Region. Res. Soil Water Conserv. 2023, 30, 190–196. [Google Scholar]
  28. Zhang, Z.F.; Zhang, X.Z. Effects of vegetation restoration on soil physical parameters on the Loess Plateau: A meta-analysis based on published data. Prog. Geogr. 2021, 40, 1012–1025. [Google Scholar] [CrossRef]
  29. Bai, Y.R.; Shao, M.A. Temporal stability of soil water storage on slope in rain-fed region of Loess Plateau. Trans. Chin. Soc. Agric. Eng. 2011, 27, 45–50. [Google Scholar]
  30. Vachaud, G.A.; Silans, A.; Balabanis, P. Temporal stability of spatially measured soil water probability density function. Soil Sci. Soc. Am. J. 1985, 49, 822–828. [Google Scholar] [CrossRef]
  31. Chen, W.L.; Wang, S.X.; Qi, T.X.; Jiao, L.; Wang, C.; Maierdang, K.; Li, Z.S.; Fu, B.J. Spatiotemporal dynamics and temporal stability of soil moisture at black locust plantations with different restoration years on hilly region of the loess plateau, China. Acta Ecol. Sin. 2021, 41, 5643–5651. [Google Scholar]
  32. Zhu, H.; Hu, S.J.; Liu, X.; Li, H.; Li, Y.K. Spatio-temporal variations of soil moisture in the root zone of Haloxylon ammodendron at different life stages. Acta Ecol. Sin. 2017, 37, 860–867. [Google Scholar]
  33. Ren, J.Y.; Qiao, Y.N.; Yan, L.Y.; Chen, Y.M. Dynamic changes and influencing factors of soil moisture of main tree species in loess hilly region. Res. Soil Water Conserv. 2022, 29, 73–80+89. [Google Scholar]
  34. Zhao, Y.N.; Yu, L.; Zhou, Y.R.; Wang, H.M.; Ma, Q.H.; Lu, Q. Soil moisture dynamics and deficit of desert grassland with anthropogenic introduced shrub encroachment in the eastern Ningxia, China. Acta Ecol. Sin. 2020, 40, 1305–1315. [Google Scholar]
  35. He, Z.B.; Du, J.; Chen, L.F.; Zhu, X.; Zhao, M.M. Review on montane forest eco-hydrology in arid area. Adv. Earth Sci. 2016, 31, 1078–1089. [Google Scholar]
  36. Yu, X.X. A Review on forest eco-hydrology research progress and development tendency. J. Basic Sci. Eng. 2013, 21, 391–402. [Google Scholar]
  37. Han, R.L.; Liang, Z.S.; Hou, Q.C.; Zou, H.Y. Water consumption properties of adaptable nursery stocks on Loess Plateau. Chin. J. Appl. Ecol. 1996, 5, 210–213. [Google Scholar]
  38. Duan, C.Y. Effects of Vegetation on Soil Water Storage and Soil Dry Layer in the Loess Plateau; Northwest A&F University: Xianyang, China, 2017. [Google Scholar]
  39. Zhang, C.C.; Shao, M.A.; Wang, Y.Q.; Jia, X.X. Effects of gullies on the spatiotemporal variability of soil-water under different vegetation types on the Loess Plateau. Adv. Water Sci. 2016, 27, 679–686. [Google Scholar]
  40. Liu, G.; Niu, J.J.; Zhu, W.X.; Wang, L. Assessment on soil Water deficit under different artificial forestland in Loess Hilly Regions of Northwestern Shanxi Province. Bull. Soil Water Conserv. 2015, 35, 309–314. [Google Scholar]
  41. Wei, L.; Yang, M.; Li, Z.; Shao, J.; Li, L.; Chen, P.; Li, S.; Zhao, R. Experimental investigation of relationship between infiltration rate and soil moisture under rainfall conditions. Water 2022, 14, 1347. [Google Scholar] [CrossRef]
  42. Lin, S.; He, K.N.; Wang, L.; Li, Y.H.; Chen, Q.; Wang, Q.L.; Huang, S.H. Soil moisture surplus and loss of typical forestland in loess alpine area by the geostatistical analyst method. Acta Ecol. Sin. 2020, 40, 728–737. [Google Scholar]
  43. Qiu, Y.; Fu, B.J.; Wang, J.; Chen, L.D. Soil moisture variation in relation to topography and land use in a hillsope catchment of the Loess Plateau, China. J. Hydrol. 2001, 240, 243–263. [Google Scholar] [CrossRef]
  44. Gong, C.; Tan, Q.; Xu, M.; Liu, G. Mixed-species plantations can alleviate water stress on the Loess Plateau. For. Ecol. Manag. 2020, 458, 117767. [Google Scholar] [CrossRef]
  45. Song, Q.H. The Environmental Adaptability of Biomass Allocation and Root Functional Traits of Stipa Krylovii in Degraded Alpine Grassland; Northwest Normal University: Lanzhou, China, 2016. [Google Scholar]
  46. Sun, Y.R.; Chen, Y.M.; Wang, Y.J.; Liu, S.H.; Zhao, M.; Liu, L.; Lu, S.B. Dynamic variation characteristics of soil moisture in caragana korshinskii plantation in Loess Hilly area and the influence of rainfall characteristics on it. J. Soil Water Conserv. 2023, 37, 272–279. [Google Scholar]
  47. Tang, M.; Li, W.N.; Liu, R.; Gu, L.M.; Zhang, C. Soil water and heat characteristics of different land use patterns in Loess Hilly Region. China Resour. Compr. Util. 2022, 40, 17–19. [Google Scholar]
  48. Liu, Q.; Liu, X.D.; Wang, L.; Zhao, W.J.; Ma, J. Soil hydrothermal characteristics of alpine meadow in the middle Qilian Mountains and their responses to meteorological factors. J. Cent. South Univ. For. Technol. 2023, 43, 156–163. [Google Scholar] [CrossRef]
  49. Shao, Z.; Zhang, F.; Chen, J.; Zhang, B.L. Soil moisture changes for different land use types in Loess Plateau gully and hilly region of central Gansu. J. Arid. Land Resour. Environ. 2017, 31, 129–135. [Google Scholar]
  50. Yang, K.; Wang, K.; Zhang, X.; Chang, X.; Wu, G.L. Change in soil water deficit and soil organic matter consumption over time in rain-fed apricot orchards on the semiarid Loess plateau, China. Agric. Ecosyst. Environ. 2021, 314, 107381. [Google Scholar] [CrossRef]
  51. Isinkaralar, O. Bioclimatic comfort in urban planning and modeling spatial change during 2020–2100 according to climate change scenarios in Kocaeli, Türkiye. Int. J. Environ. Sci. Technol. 2023, 20, 7775–7786. [Google Scholar] [CrossRef]
  52. Isinkaralar, K. Atmospheric deposition of Pb and Cd in the Cedrus atlantica for environmental biomonitoring. Landsc. Ecol. Eng. 2022, 8, 341–350. [Google Scholar] [CrossRef]
  53. Isinkaralar, K. Temporal Variability of Trace Metal Evidence in Cupressus arizonica, Platanus orientalis, and Robinia pseudoacacia as Pollution-Resistant Species at an Industrial Site. Water Air Soil Pollut. 2022, 233, 250. [Google Scholar] [CrossRef]
Figure 1. Location of the study area and landscape photo of each stand.
Sustainability 15 14275 g001
Figure 2. Temporal variations of air temperature and precipitation during the growing season. Note: the line shows the daily trend in temperature over the growing season, and the bars show the daily and monthly trends in precipitation over the growing season.
Sustainability 15 14275 g002
Figure 3. Vertical distribution of soil moisture content and the CV of different vegetation types (ah). Note: the blue dotted line is the soil moisture effectiveness grading line.
Sustainability 15 14275 g003
Figure 4. Dynamic changes of soil desiccation index of different vegetation types. Note: the red dotted lines are the soil desiccation index grading line.
Sustainability 15 14275 g004
Figure 5. Temporal stability analysis (a) and Nash test (b) of soil moisture storage of different vegetation types.
Sustainability 15 14275 g005
Figure 6. Cluster analysis (a) and linear fitting and correlation (b) of SMC at different soil layers.
Sustainability 15 14275 g006
Figure 7. SMS (a) and SMSD (b) at different soil depths of different vegetation types. Note: the red line at the top of the 0–90 cm soil layer histogram shows the temporal trend of rainfall during the growing season, and the red line at the top of the 90–200 cm soil layer histogram represents the temporal trend of SMS. And different lower case letters indicate significant differences in SMS among different vegetation types.
Sustainability 15 14275 g007
Figure 8. Linear relationships of SMC with soil temperature (a) and precipitation (b) of different vegetation types.
Sustainability 15 14275 g008
Figure 9. Regression and correlation evaluation between SMC and the influencing factors of different vegetation types.
Sustainability 15 14275 g009
Table 1. Basic information of the observed plantations in the study area.
Plantation TypesSpeciesHeight/
m
Diameter/
cm
As/
m2
Canopy DensityPlanting Density/
ind.hm−2
ForestRobinia (R.) pseudoacacia L.13.5 ± 1.212 ± 115 ± 1.80.82000
Populus (P.) alba L.5 ± 0.87.5 ± 0.613.5 ± 1.10.751200
Pinus (P.) tabulaeformis Carr.2 ± 0.73.85 ± 0.54 ± 0.90.91500
Ulmus (U.) pumila L.4.2 ± 0.74.85 ± 0.65 ± 0.80.65800
FarmlandCorn/
Table 2. Determination of soil moisture parameters in the study area.
Land Use TypeFarmlandWoodlandOverall
Soil stable moisture25.3%22.6%25.3%
Wilting moisture9.1%9.7%9.4%
Table 3. Classification and evaluation criteria of soil moisture state on the Loess Plateau.
Evaluation IndicatorsEvaluation Criteria
Validity gradeGravity waterEasy waterModerate waterDifficult waterIneffective water-
SMC > θ f 80% θ f < S M C θ f 60% θ f < SMC ≤ 80% θ f θ w < SMC ≤ 60% θ f SMC ≤ θ w -
Degree of desiccationNo desiccationLight desiccationModerate desiccationSerious desiccationStrong desiccationSevere desiccation
SDI > 100%75% ≤ SDI < 100%50% ≤ SDI < 75%25% ≤ SDI < 50%0 ≤ SDI < 25%SDI ≤ 0
Note: θ w is soil wilting moisture, θ f is soil stable moisture.
Table 4. Analysis of soil moisture storage difference in different soil layers of typical plantation.
Soil Depth/cmFarmland/mmR. pseudoacacia L./mmP. tabulaeformis Carr./mmU. pumila L./mmP. alba L./mm
1013.5 ± 2.3 e17.1 ± 4 c25.8 ± 2.2 e16.2 ± 2.6 g22.4 ± 2.7 e
3043.6 ± 6.7 cd31 ± 7.2 bc46.2 ± 4.7 d34 ± 5.4 f44.2 ± 4.3 d
5036.1 ± 3.7 d34.5 ± 5.5 bc54.2 ± 4.6 cd42.3 ± 3.6 ef48.1 ± 3.1 d
7038.7 ± 1.8 cd45.6 ± 4.6 b55.1 ± 3.1 cd47.4 ± 3.1 de50.1 ± 1.5 d
9045.3 ± 2.3 c47.5 ± 4.7 b61.9 ± 3.5 c54.2 ± 2.5 d48.5 ± 0.5 d
130106 ± 2 a91.3 ± 9.8 a132.3 ± 4.6 a116.8 ± 3.6 b110.1 ± 2.5 b
170107.9 ± 1.4 a78.5 ± 11.4 a123.8 ± 3.1 a163.6 ± 2 a158 ± 3.3 a
19088.4 ± 0.7 b78.5 ± 7 a90.1 ± 1.2 b95.0 ± 0.5 c102.2 ± 0.6 c
Mean59.9 ± 4.6 B53 ± 4.1 B73.7 ± 4.9 A71.2 ± 6.3 A72.9 ± 5.8 A
Note: different lowercase letters indicate significant differences in SMS across soil layers, and different uppercase letters indicate significant differences in SMS across tree species.
Disclaimer/Publisher’s Note: The statements, opinions and data contained in all publications are solely those of the individual author(s) and contributor(s) and not of MDPI and/or the editor(s). MDPI and/or the editor(s) disclaim responsibility for any injury to people or property resulting from any ideas, methods, instructions or products referred to in the content.

