Article

Land Use Change and Landscape Ecological Risk Prediction in Urumqi under the Shared Socio-Economic Pathways and the Representative Concentration Pathways (SSP-RCP) Scenarios

1
School of Water Conservancy and Civil Engineering, Xinjiang Agricultural University, Urumqi 830052, China
2
Xinjiang Key Laboratory of Hydraulic Engineering Security and Water Disasters Prevention, Urumqi 830052, China
3
School of Public Management (Faculty of Law), Xinjiang Agricultural University, Urumqi 830052, China
4
Xinjiang Soil and Water Conservation Ecological Environment Monitoring Station, Urumqi 830099, China
*
Author to whom correspondence should be addressed.
These authors contributed equally to this work.
Sustainability 2023, 15(19), 14214; https://doi.org/10.3390/su151914214
Submission received: 15 August 2023 / Revised: 12 September 2023 / Accepted: 14 September 2023 / Published: 26 September 2023
(This article belongs to the Section Environmental Sustainability and Applications)

Abstract

:
Understanding land use/cover change (LUCC) and landscape ecological risk change in the context of future climate warming can help adjust socio-economic development policies, optimize regional ecological security patterns, and promote green and low-carbon development on the one hand and provide important supplements and improvements for research in related fields on the other. Taking Urumqi as the study area, based on the Coupled Model Intercomparison Project Phase 6 (CMIP6) multi-modal ensemble data, we used the coupled system dynamics (SD) model and patch-generation land use simulation (PLUS) model to simulate land use change under three SSP-RCP scenarios in 2020–2060, and we predicted trends of landscape ecological risk change in this 40-year period by using the landscape ecological risk index (LERI). The results indicate that woodland and grassland significantly increase under the SSP126 scenario. Unused land is larger in the SSP245 scenario. The expansion trend of construction land toward cultivated land is most obvious in the SSP585 scenario; additionally, the area of water increases more distinctly in this scenario. The overall landscape ecological risk under the three SSP-RCP scenarios is reduced to different degrees; in particular, the risk level of urban built-up areas and nature reserves decreases remarkably, and the area of the highest risk zones of unused land is also gradually narrowed. By 2060, the average LERI under the SSP126 scenario is the lowest. The study findings can help relevant departments formulate reasonable urban development plans, which are of great theoretical and practical significance for guaranteeing regional ecological security.

1. Introduction

Currently, the global environment is facing a number of threats, such as the atmosphere, oceans, freshwater, and land being subject to enormous pressures exerted by humans. Climate change is by far the greatest environmental threat, as it affects almost all other environmental threats to some extent. It is reported that the current global average temperature has risen by about 1 °C compared to the pre-industrial period [1], and if greenhouse gas (GHG) emissions are not substantially reduced in the coming decades, the global average temperature increase is expected to exceed 1.5 °C or 2 °C during the 21st century [2,3]. Climate warming can lead to frequent disasters such as floods [4], droughts [5], and heat waves [6], and it is a key factor in exacerbating the associated ecological risk. The aim of this paper is to explore the impacts of climate change on urban land use/cover change (LUCC) and landscape ecological risk change in arid zones.
Ecological risk is usually characterized as the negative ecological impacts that ecosystems and their components may suffer or are suffering due to exposure to one or more stressors [7,8]. Landscape ecological risk assessment is a branch of ecological risk assessment at the regional scale that assesses potential negative outcomes on ecosystems from multiple sources of risk, such as natural disturbances and human activities, by coupling landscape patterns and ecological processes [9,10]. Commonly used evaluation methods include the risk “source-sink” method and the landscape ecological risk index (LERI) method [11]. The former follows the inherent mode of traditional ecological risk assessment, which is “stressor identification–receptor analysis–exposure and ecological effect characterization”, and with it, it is hard to portray risk dynamics under multiple sources of stress [12]. The latter takes land use as a risk complex and its changes as risk triggers, which puts more emphasis on the spatio-temporal heterogeneity of risk and enables an integrated characterization of multiple sources of risk [9,13,14]. Therefore, the LERI method is the most widely used method at present. Extensive studies have also confirmed a tight link between LUCC and landscape ecological risk [15,16].
Previous studies on LUCC simulation have focused on scenarios of natural development, cultivated land protection, economic development, and eco-priority [17,18], mostly considering the orientation of different social policies, and the effects of climate change are not yet explicit. However, LUCC is not only influenced by socio-economic policies; the additional driving role of climate factors cannot be ignored [19]. The Coupled Model Intercomparison Project Phase 6 (CMIP6), which combines the shared socio-economic pathways (SSPs) and the representative concentration pathways (RCPs), provides researchers with a variety of more plausible scenarios for the future development of society in the context of global climate change [20,21,22]. SSP-RCP scenarios are increasingly being used in studies of future LUCC projections [23,24].
The following representative models are mainly used to simulate LUCC. These include the Markov model [25], system dynamics (SD) model [26], the artificial neural network (ANN) model [27], etc., for structural prediction, and the cellular automata (CA) model [28], the conversion of land use and its effects at small regional extent (CLUE-S) model [29], the future land use simulation (FLUS) model [30], the patch-generation land use simulation (PLUS) model [31], etc., for spatial distribution prediction. Among them, the SD model is a top–down improved model [20], which puts special focus on the explicit expression and simulation of nonlinear feedback mechanisms when solving complicated issues [32]. Many scholars consider that LUCC is caused by multiple feedback mechanisms of socio-economic and biophysical factors [32,33,34], and thus, the SD model is an excellent tool to simulate future land use demand. The PLUS model integrates a land expansion analysis strategy (LEAS) and a CA model based on multi-type random patch seeds (CARS) [31]. It effectively improves the information rule mining and landscape pattern simulation strategies [35], better reveals the intrinsic relationship of LUCC, more accurately simulates the spatial pattern of land use, and achieves higher simulation accuracy [31,36].
A review of previous studies showed that many scholars have assessed the landscape ecological risk based on LUCC using various modeling methods, but little attention has been paid to the distribution of urban land use patterns and the evolutionary characteristics of landscape ecological risk under the influence of climate change. This study can effectively fill the gap in research on the impacts of LUCC on landscape ecological risk under future climate change and is of great significance in helping the relevant administrative departments to adjust socio-economic development policies, optimize land use patterns, and seek an optimal sustainable development model for the region.
Urumqi is one of the farthest cities from the ocean in the world, a typical arid inland area. Climate warming has a particularly prominent impact on arid zones [37], with potentially devastating effects on local agriculture, water resources, and ecosystems [38]. As the bridgehead of China’s opening to the West, Urumqi has achieved leapfrog social and economic development, which has also had a non-negligible influence on the eco-environment. In the context of global climate change and accelerated urbanization, understanding how to promote socio-economic development on the basis of efficient resource use and green low-carbon development has become a major challenge for Urumqi. Therefore, we constructed a synthesized framework based on the SD model, the PLUS model, and the LERI to explore the impacts of LUCC on landscape ecological risk under the SSP126, SSP245, and SSP585 scenarios in Urumqi from 2020 to 2060. The specific objectives of this study were (1) to construct an SD model encompassing climate, economic, population, and land subsystems to predict the trajectory of land use demand changes under three SSP-RCP scenarios; (2) to simulate spatial distribution patterns of land use under different SSP-RCP scenarios by integrating with the PLUS model; and (3) to evaluate the landscape ecological risk of Urumqi under different SSP-RCP scenarios by using the LERI and describe its spatio-temporal evolution characteristics.

2. Materials and Methods
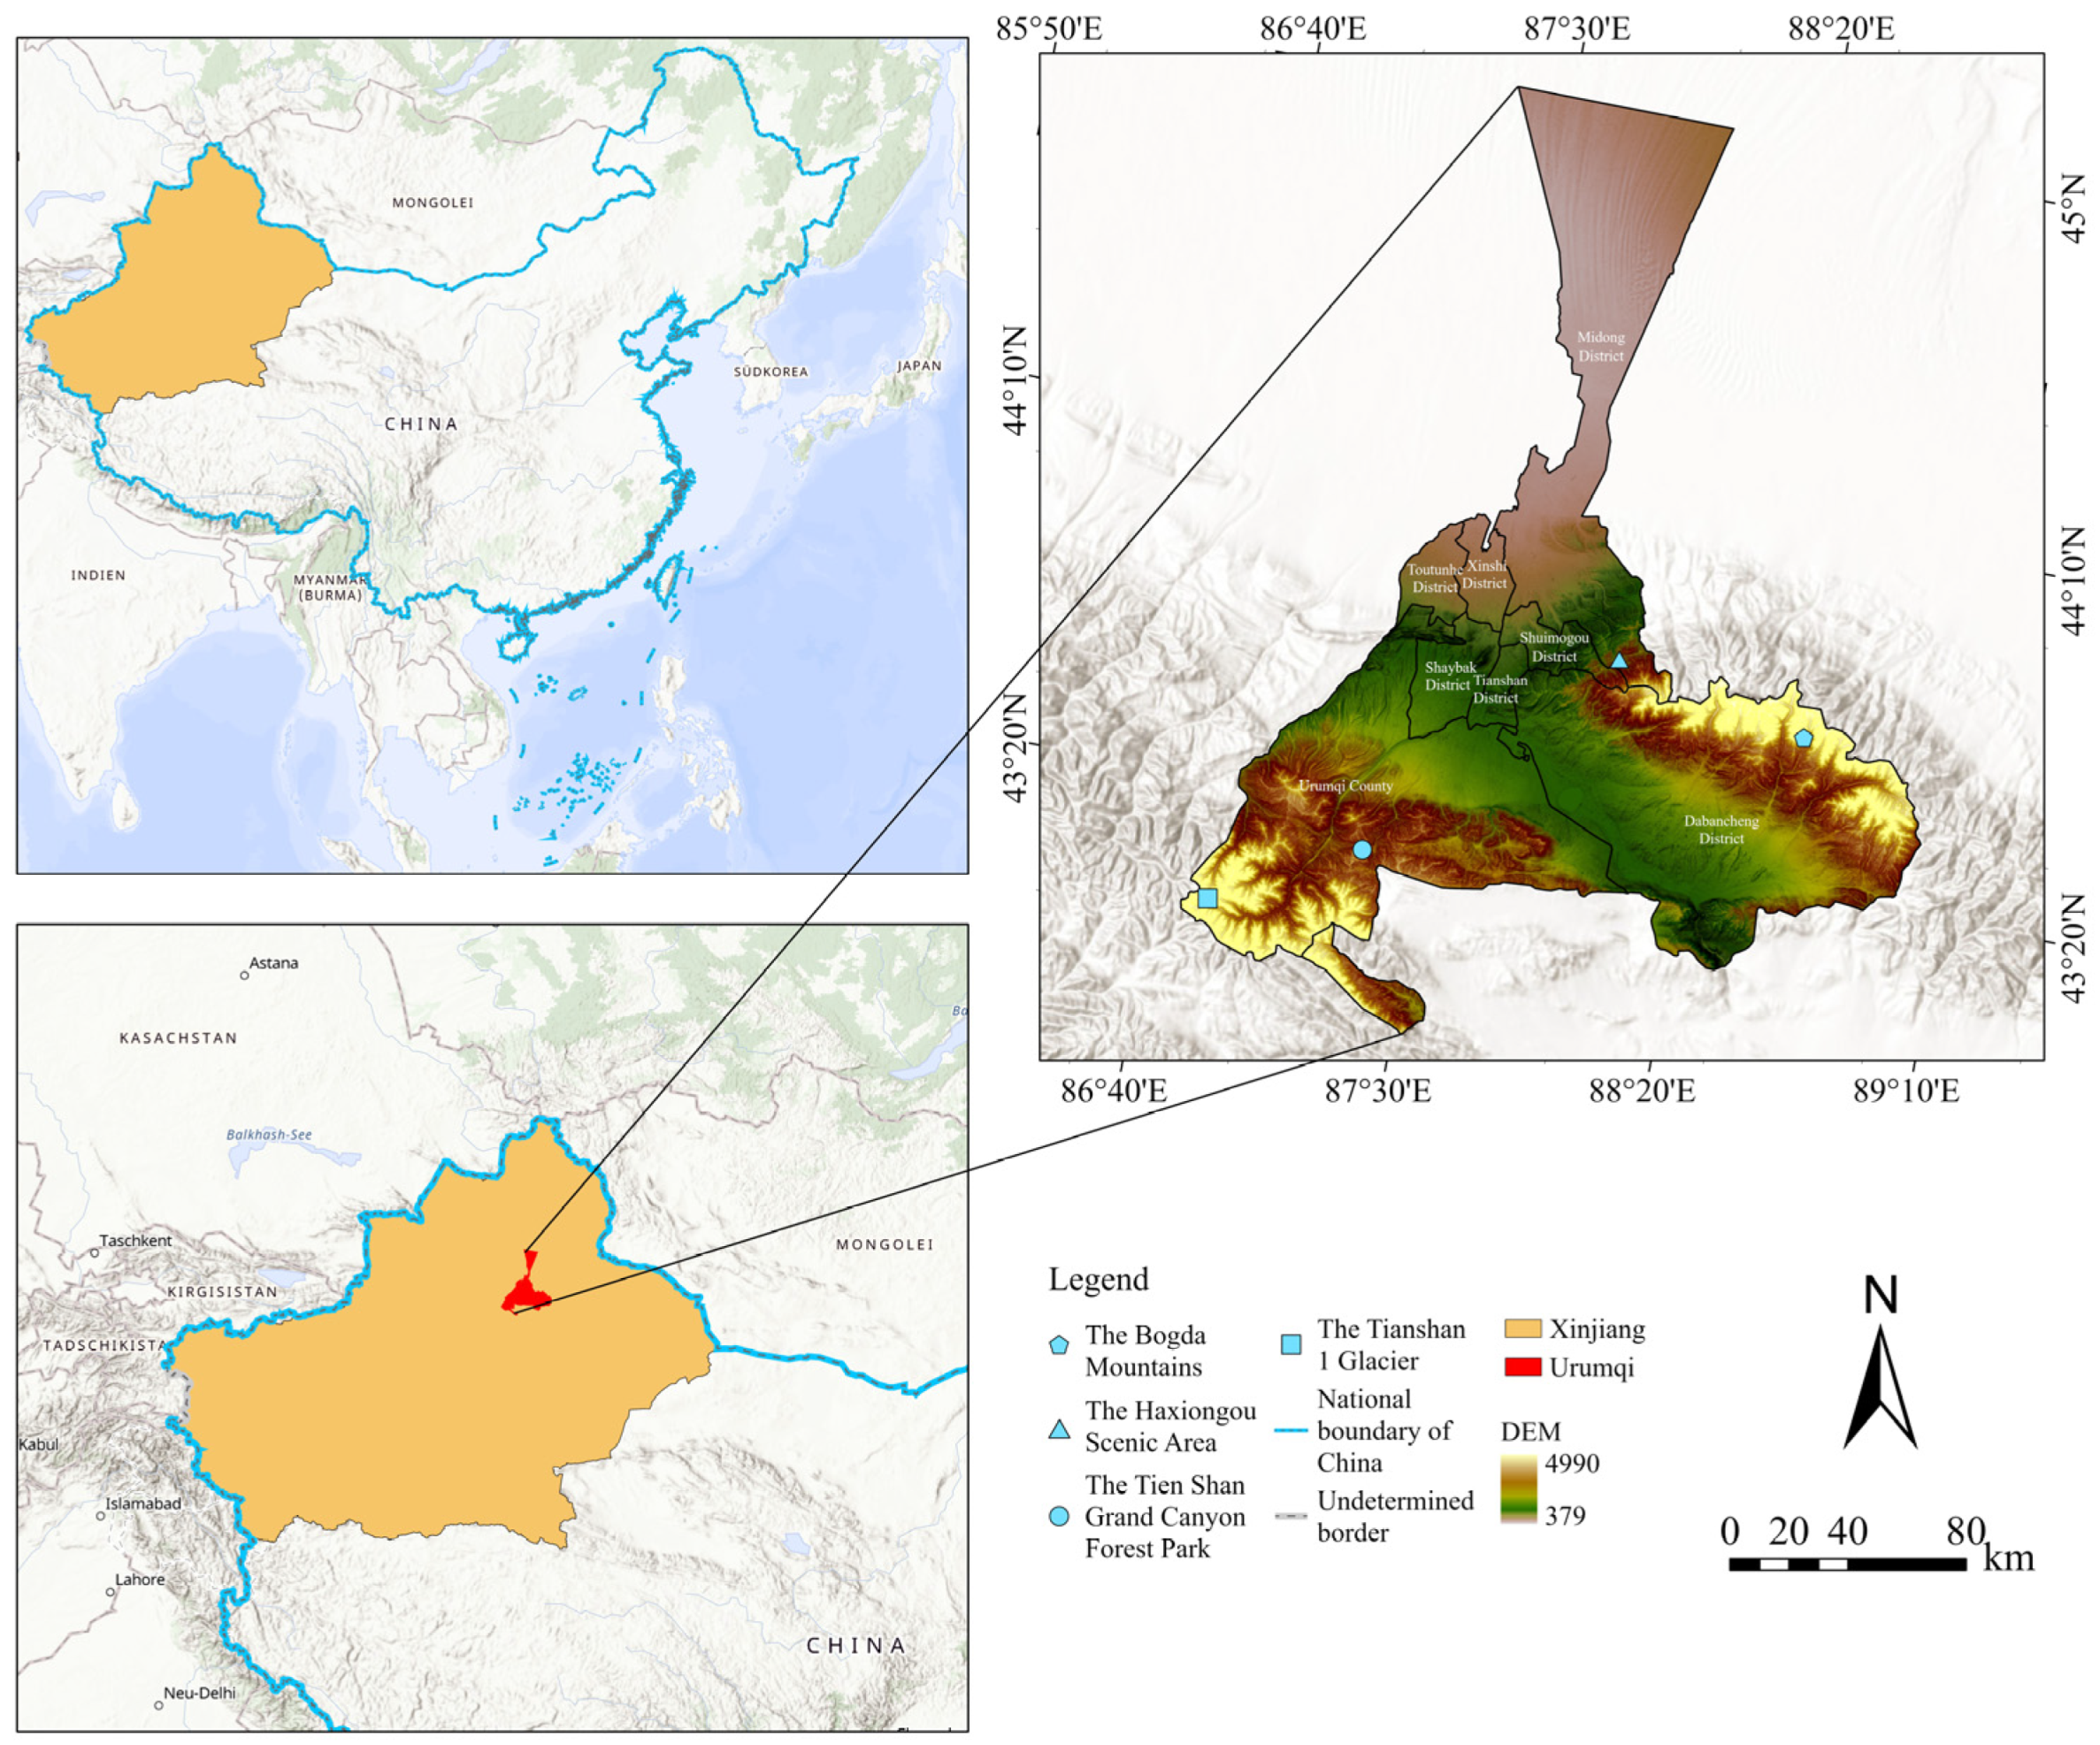
2.1. Study Area

Urumqi (86°37′–88°58′ E, 42°45′–45°00′ N) is located in the central part of Xinjiang, at the northern foothills of the middle part of the Tien Shan range, and at the southern edge of the Junggar Basin. It has seven districts and one county under its jurisdiction, with a total area of about 13,800 km2 (Figure 1). The city is surrounded by mountains on three sides, with open plains to the north. The terrain is undulating. It has a temperate continental arid climate with sparse rainfall and strong evaporation. Internally, Urumqi is the axis city of the Economic Belt on the north slope of Tien Shan and is the central city of Northwest China, shouldering the important responsibility of driving the development of Northwest China. Externally, Urumqi is an important city on the Second Asia–Europe Continental Bridge Economic Belt; a land node connecting central Asia, the Middle East, and Europe on the “The Belt and Road”; and a hub for east–west trade and commerce exchanges. In recent years, Urumqi has experienced rapid socio-economic development, realizing a gross regional product of CNY 389.322 billion in 2022. However, the long-term, large-scale, and disorderly exploitation of land resources has aggravated regional land desertification and water scarcity [39], decreased ecological carrying capacity, and increased the ecological deficit.

2.2. Data Source and Processing
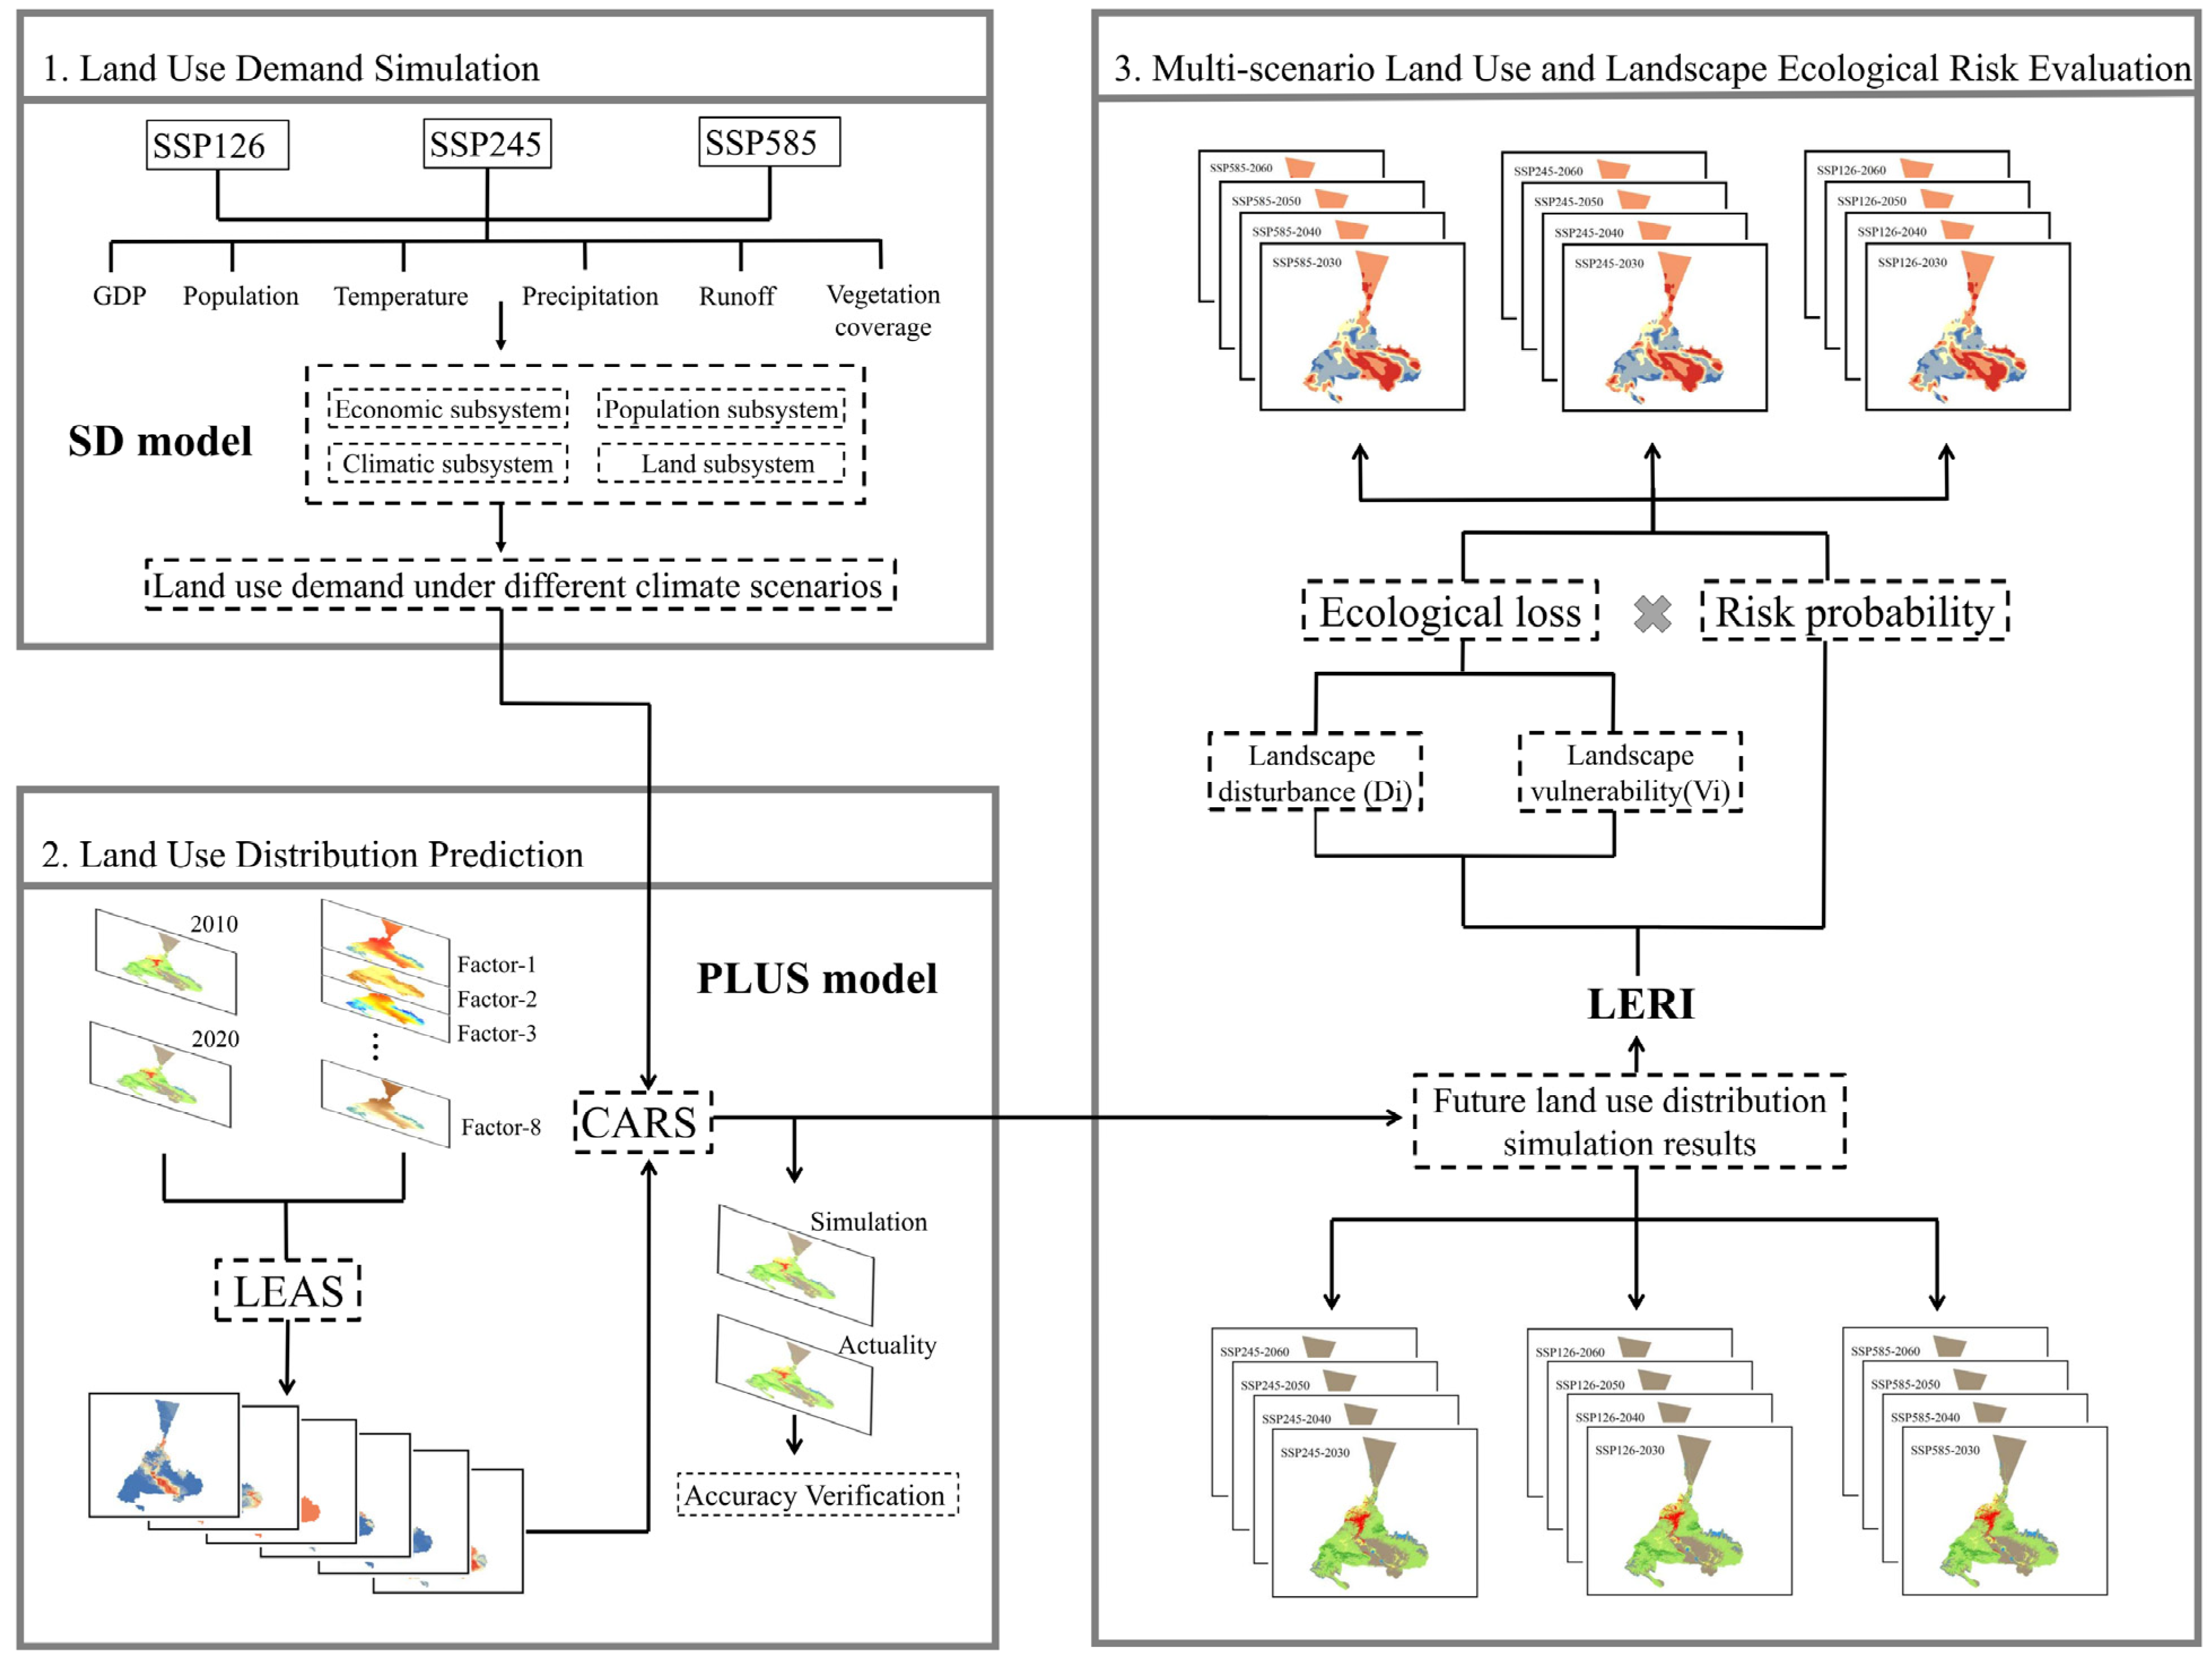
The basic data required for this study include land use data, natural factors data, socio-economic data, topographic data, and accessibility data.
Land use data from 2000 to 2020 were obtained from the annual China Land Cover Dataset (https://zenodo.org/record/4417810, accessed on 23 April 2023) constructed by Wuhan University, China, with a spatial resolution of 30 m. According to the classification standard of China’s land use status quo (GB/T21010-2017 [40]) and the actual situation, it is categorized into six landscape types: cultivated land, woodland, grassland, water, construction land, and unused land.
Data on natural factors include temperature, precipitation, vegetation coverage, and runoff. Temperature and precipitation data for 2000–2020 were obtained from the China Meteorological Data Service Center (http://data.cma.cn, accessed on 24 April 2023) with a temporal resolution of one year, vegetation coverage was obtained from the Resource and Environment Science and Data Center of the Chinese Academy of Sciences (http://www.resdc.cn, accessed on 24 April 2023) with a spatial resolution of 1 km, and runoff data were derived from the Urumqi Water Resources Bulletin with a temporal resolution of one year. The above data on natural factors for 2021–2060 were sourced from data of 11 global climate models (GCMs) under the CMIP6 dataset (https://esgf-node.llnl.gov/search/cmip6/, accessed on 26 April 2023). The selected climate scenarios are SSP126, SSP245, and SSP585. The variant label for all data is “r1i1p1f1”. The eleven models include ACCESS-CM2, ACCESS-ESM1-5, BCC-CSM2-MR, CAMS-CSM1-0, CanESM5, CMCC-ESM2, FGOALS-f3-L, GFDL-ESM4, INM-CM5-0, IPSL-CM6A-LR, KACE-1-0-G, KIOST-ESM, and MRI-ESM2-0.
The socio-economic data include population, gross domestic product (GDP), fixed assets investment, primary industry investment, secondary industry investment, tertiary industry investment, agriculture investment, forestry investment, animal husbandry investment, and fishery investment, which were obtained from the Xinjiang Statistical Yearbook, Urumqi Statistical Yearbook, and Urumqi Annual Statistical Bulletin of the National Economic and Social Development. Future population and GDP data for 2021–2060 were sourced from the gridded datasets for population and economy under Shared Socioeconomic Pathways (https://cstr.cn/31253.11.sciencedb.01683, accessed on 27 April 2023).
Topographic data include the digital elevation model (DEM) and slope. DEM data came from the Geospatial Data Cloud (http://www.gscloud.cn, accessed on 24 April 2023) with a spatial resolution of 30 m. Slope data were obtained using ArcGIS spatial analysis module.
Accessibility data include distance to the river and distance to settlement, which were obtained using ArcGIS Euclidean distance processing.

2.3. Methods

The research framework of this paper is illustrated in Figure 2. First, by constructing an SD model to quantify the complex causal relationships among the drivers, the natural factors data and socio-economic data under different SSP-RCP scenarios were used to set up simulation parameters and predict the future land use demand. Second, the PLUS model was coupled to assign land use demand to different spatial distributions. Finally, the LERI was used to assess the landscape ecological risk of Urumqi under the three SSP-RCP scenarios.

2.3.1. SSP-RCP Scenarios

SSPs represent the potential development of future society without considering the impacts of climate change. There are five pathways, namely SSP1, SSP2, SSP3, SSP4, and SSP5, which represent sustainable, moderate, partial, uneven, and conventional development [1]. RCPs represent different future GHG emissions and concentration levels. There are four typical emission pathways, namely RCP2.6, RCP4.5, RCP7.0, and RCP8.5, as well as four additional emission pathways, namely RCP1.9, RCP3.4, RCP3.4-OS, and RCP6.0, which fill the gaps between the typical pathways [23]. Referring to related studies [41], we selected three representative SSP-RCP scenarios, the meanings of which are summarized in Table 1.

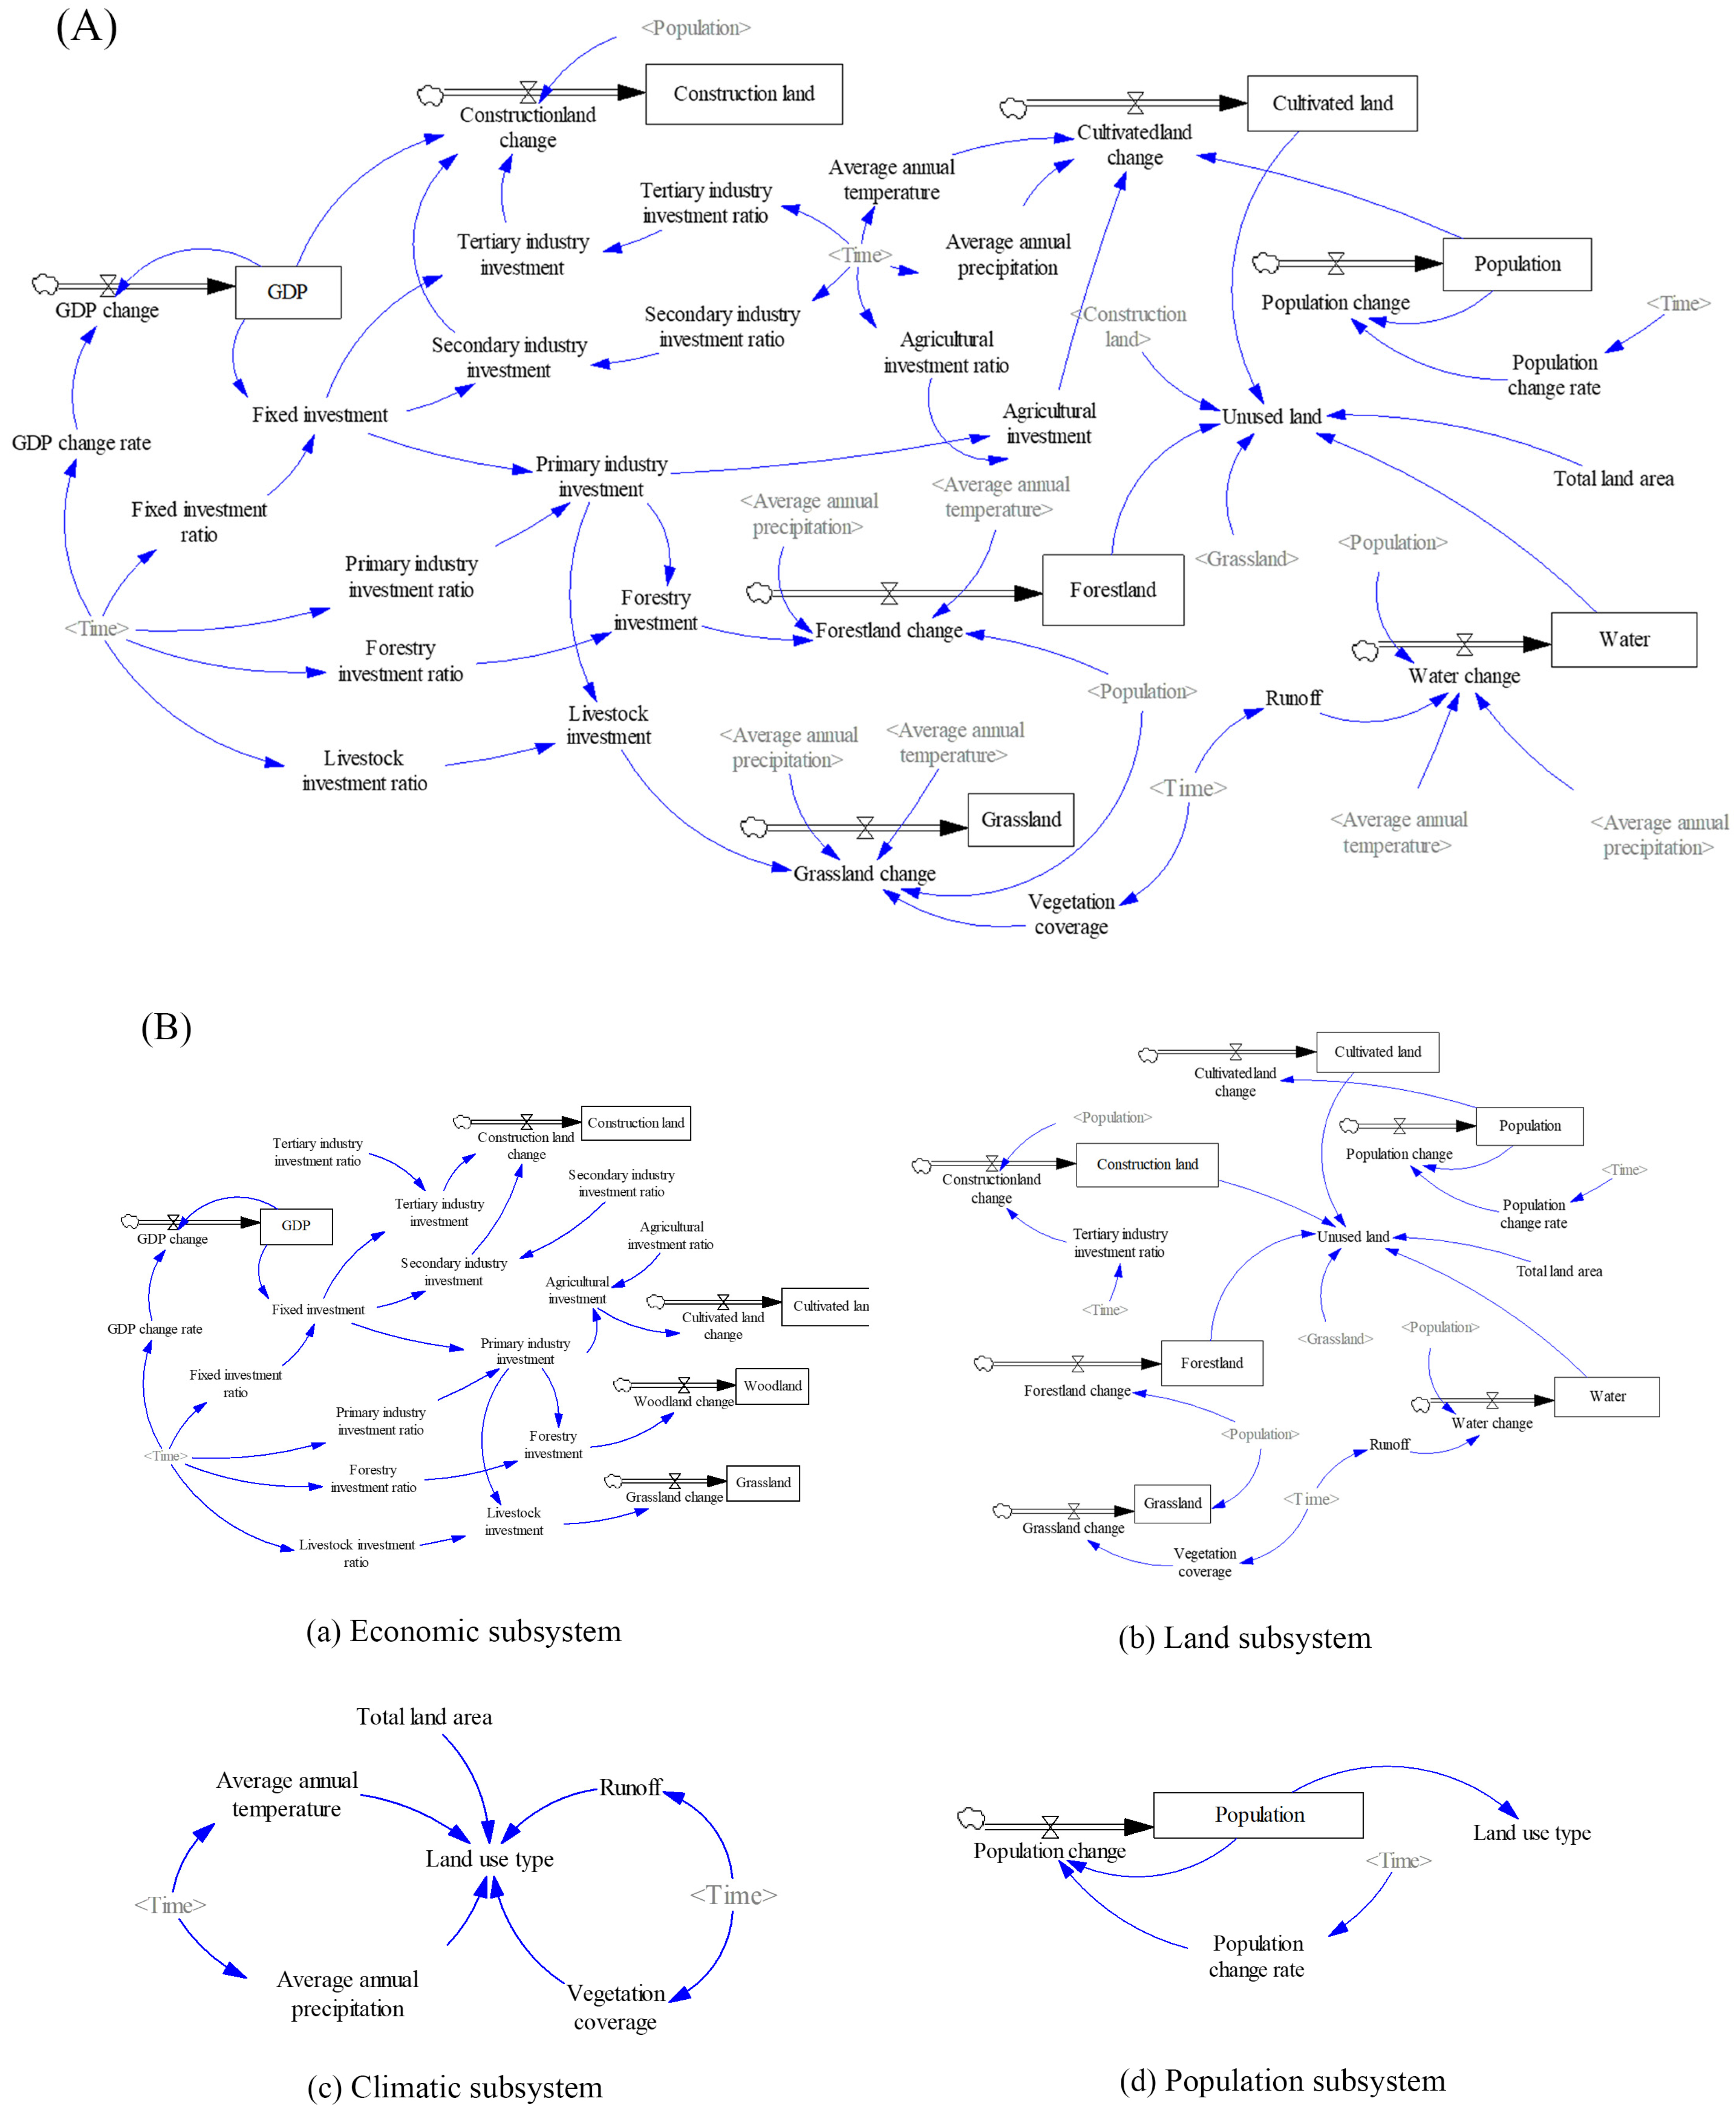
2.3.2. System Dynamics Model

After repeated debugging and continuous optimization, we used Vensim PLE software to construct an SD model of land use demand in Urumqi (Figure 3). This model includes four subsystems: climate, economy, population, and land. The quantitative relationships between climate, economy, population factors, and LUCC were determined through a table function and a regression function. In the climate subsystem, changes in temperature and precipitation affect the development of crops and vegetation and also alter the regional water cycle and spatial and temporal distribution, which in turn affect the transformation of cultivated land, woodland, grassland, and water. In the economic subsystem, economic growth promotes the urbanization process, resulting in the rapid spread of construction land and the non-agriculturalization of a large amount of cultivated land. However, the rise in people’s living standards also increases the demand for high-quality agricultural products. Therefore, changes in the amount of primary industry investment (agriculture, forestry, animal husbandry, and fishery), secondary industry investment, and tertiary industry investment lead to changes in the area of different land use types. In the population subsystem, growing populations and frequent human activities overload the carrying capacity of the land and cause climatic and socio-economic changes. Therefore, the impact of population change on various types of land is very significant. The land subsystem mainly deals with the transformation between different land use types.
This model simulated the period from 2000 to 2060 with a step size of one year. The historical simulation phase is 2000–2020. Taking 2000 as the starting year of forecasting, the model was used to predict land use demand from 2000 to 2020, and the simulated data in 2020 were compared and analyzed with the actual data. From Table 2, we observe that the relative errors for all types of land areas were less than 5%, which indicates that the model simulation was highly accurate. The simulation projection phase is 2020–2060. Data from different SSP-RCP scenarios (temperature, precipitation, vegetation coverage, runoff, population, and GDP) were input in this phase to project future land use demand. See Table 3 for specific parameter settings.

2.3.3. Patch-Generation Land Use Simulation Model

The PLUS model is used to predict spatial patterns of land use and is able to reveal different contributions of drivers to its changes. The model is primarily based on two modules—LEAS and CARS. First, we superimposed two phases of land use data as a transition analysis strategy for LEAS and extracted image elements in the areas where changes occurred for each land use type. Second, we entered the driver and land expansion trend maps into the LEAS module and utilized random forest classification to mine the intrinsic relationship between the expansion of each land use type and the driver individually, thus obtaining the probability of change and development potential maps of each land use type, as well as the contribution of the driver to each land use type [44]. Finally, the land use data of the predicted base year were entered into the CARS module along with the development potential map obtained in the previous step and the limiting factors. CARS was used to simulate localized land use competition and to make the total land use meet future demand on a macro scale based on adaptation coefficients, domain effects, and development probabilities. In this process, we needed to debug and input three simulation parameters, namely land use demand, the transfer matrix, and domain weights [45]. The land use demand was the predicted value under the different SSP-RCP scenarios detailed in Section 2.3.2, and the coupling of the SD model and PLUS model was realized here. The transfer matrix was used to indicate whether conversions could occur between different land types, which was determined based on actual conditions and constraints in the study area. Domain weights were determined based on the ratio of the extension area to the total extension area for each land use type.
From the perspectives of the natural environment, socio-economics, and accessibility, we selected eight factors (temperature, precipitation, DEM, slope, GDP, population, distance to river, and distance to settlement) that affect LUCC. The PLUS model was run to obtain the simulated distribution of land use in 2020 based on 2000 and 2010 land use data. By comparing this information with the actual distribution (Figure 4), we could see that there was no obvious difference between the two. Subsequently, we conducted the validation of model accuracy. The results showed that the Kappa coefficient was 0.926 and the FOM value was 0.172, which indicated that the model had a good simulation and was suitable for this study. With the feasible accuracy of the model, the spatial distribution pattern of land use under three SSP-RCP scenarios in Urumqi was simulated by inputting land use demand in 2030, 2040, 2050, and 2060.
The Kappa coefficient is calculated as follows [46]:
k = n i = 1 k p i i ( p i + p i ) n 2 ( p i + p i )
where n is the total number of rasters in Urumqi, p i i is the number of rasters in which the simulated value of the ith land use type is the same as the actual value, k is the number of land use types ( k = 6), p i is the number of actual rasters of the ith land use type, and p i is the number of simulated rasters of the i-th land use type.

2.3.4. Landscape Ecological Risk Assessment

We used a method of constructing the LERI based on landscape indicators to evaluate landscape ecological risk. The basic idea of this approach is to use the “ecological loss * risk probability” paradigm. Ecological loss consists of the degree of landscape disturbance and landscape vulnerability [47]. Risk probability is expressed through the proportion of each land use type, reflecting the extent to which different land use types contribute to the risk [48]. The LERI is calculated as follows [49]:
L E R I = i = 1 n A k i A k × ( D i × V i )
where A k i is the area of land use type i within the k-th risk unit, A k is the area of the k-th risk unit, n is the number of land use types, D i is the landscape disturbance, and V i is the landscape vulnerability. The specific index formulas and descriptions are shown in Table 4 [49,50,51].
To visually characterize the spatial heterogeneity of landscape ecological risk, we divided Urumqi into 1530 risk units with a granularity of 3 km × 3 km, calculated the LERI of each risk unit by combining it with Fragstats 4.2 software, and assigned the results to the centroid of the risk units by using kriging interpolation to obtain the spatial distribution of the landscape ecological risk in Urumqi.

3. Results

3.1. Land Use/Cover Change

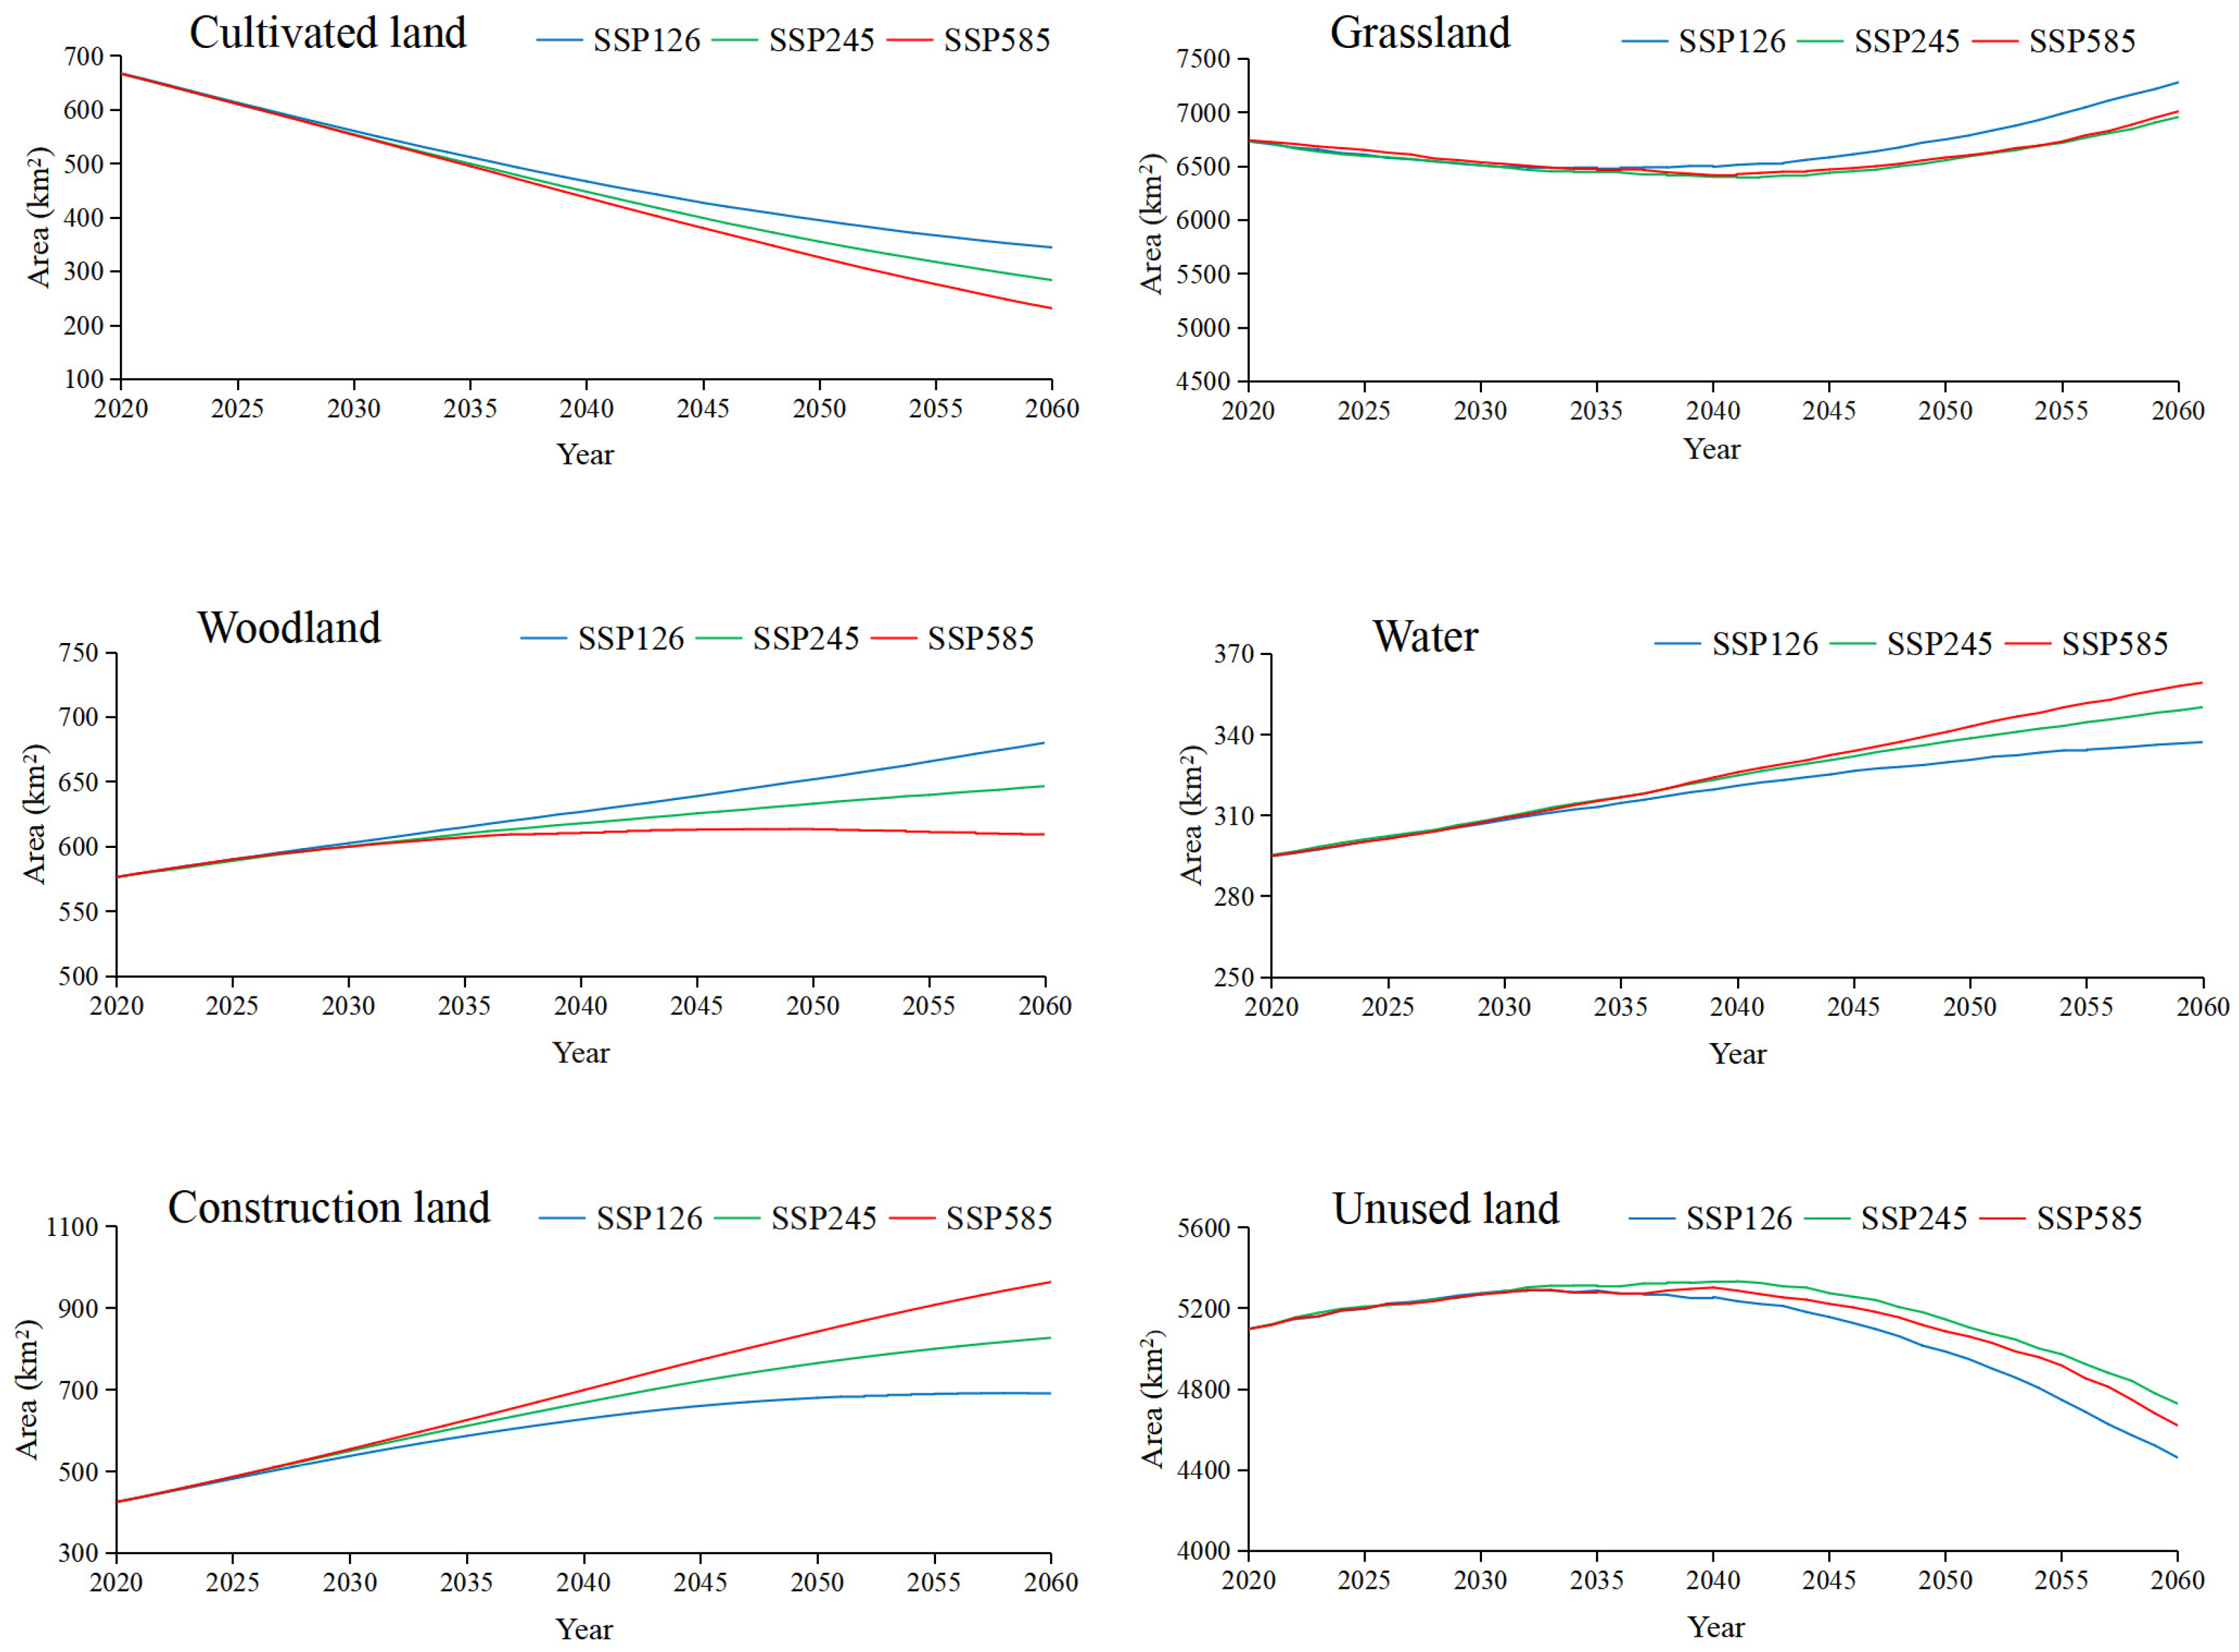
3.1.1. Land Use Demand Prediction

Based on the SD model, we obtained the land use demand of Urumqi under the SSP126, SSP245, and SSP585 scenarios (Figure 5, Table 5). The LUCCs under the three SSP-RCP scenarios from 2020 to 2060 were characterized by four increases and two decreases, and the area of each land use type began to show remarkable differences after 2030.
Under the SSP126 scenario, cultivated land continues to decrease while woodland, water, and construction land continue to increase. Of these, woodland maintains a relatively fast growth rate, with cultivated land, water, and construction land increasing at a flat rate after 2050. Grassland decreases in the first 20 years, then increases after 2040, and the rate of increase becomes progressively faster. Unused land increases slightly in the first 10 years and then declines substantially in the last 30 years. In particular, the decrease rate accelerates dramatically after 2040. Under the SSP245 scenario, unused land continuously increases until 2040, after which the rate of decline is minimal. Except for unused land, the change trends of other land use types are identical to those under the SSP126 scenario. However, the rates of change for cultivated land, water, and construction land are faster than those in the SSP126 scenario. The rates of change for woodland and grassland are slower than those in the SSP126 scenario, and woodland remains essentially unchanged after 2050. The SSP585 scenario shows that woodland starts to decrease after 2050. Other than that, the change trends of other land use types follow the same trends as in the SSP245 scenario. Within them, the rates of change for cultivated land, water, and construction land are notably higher than in the other two scenarios, and the magnitudes of change for grassland and unused land are marginally larger than in the SSP245 scenario.

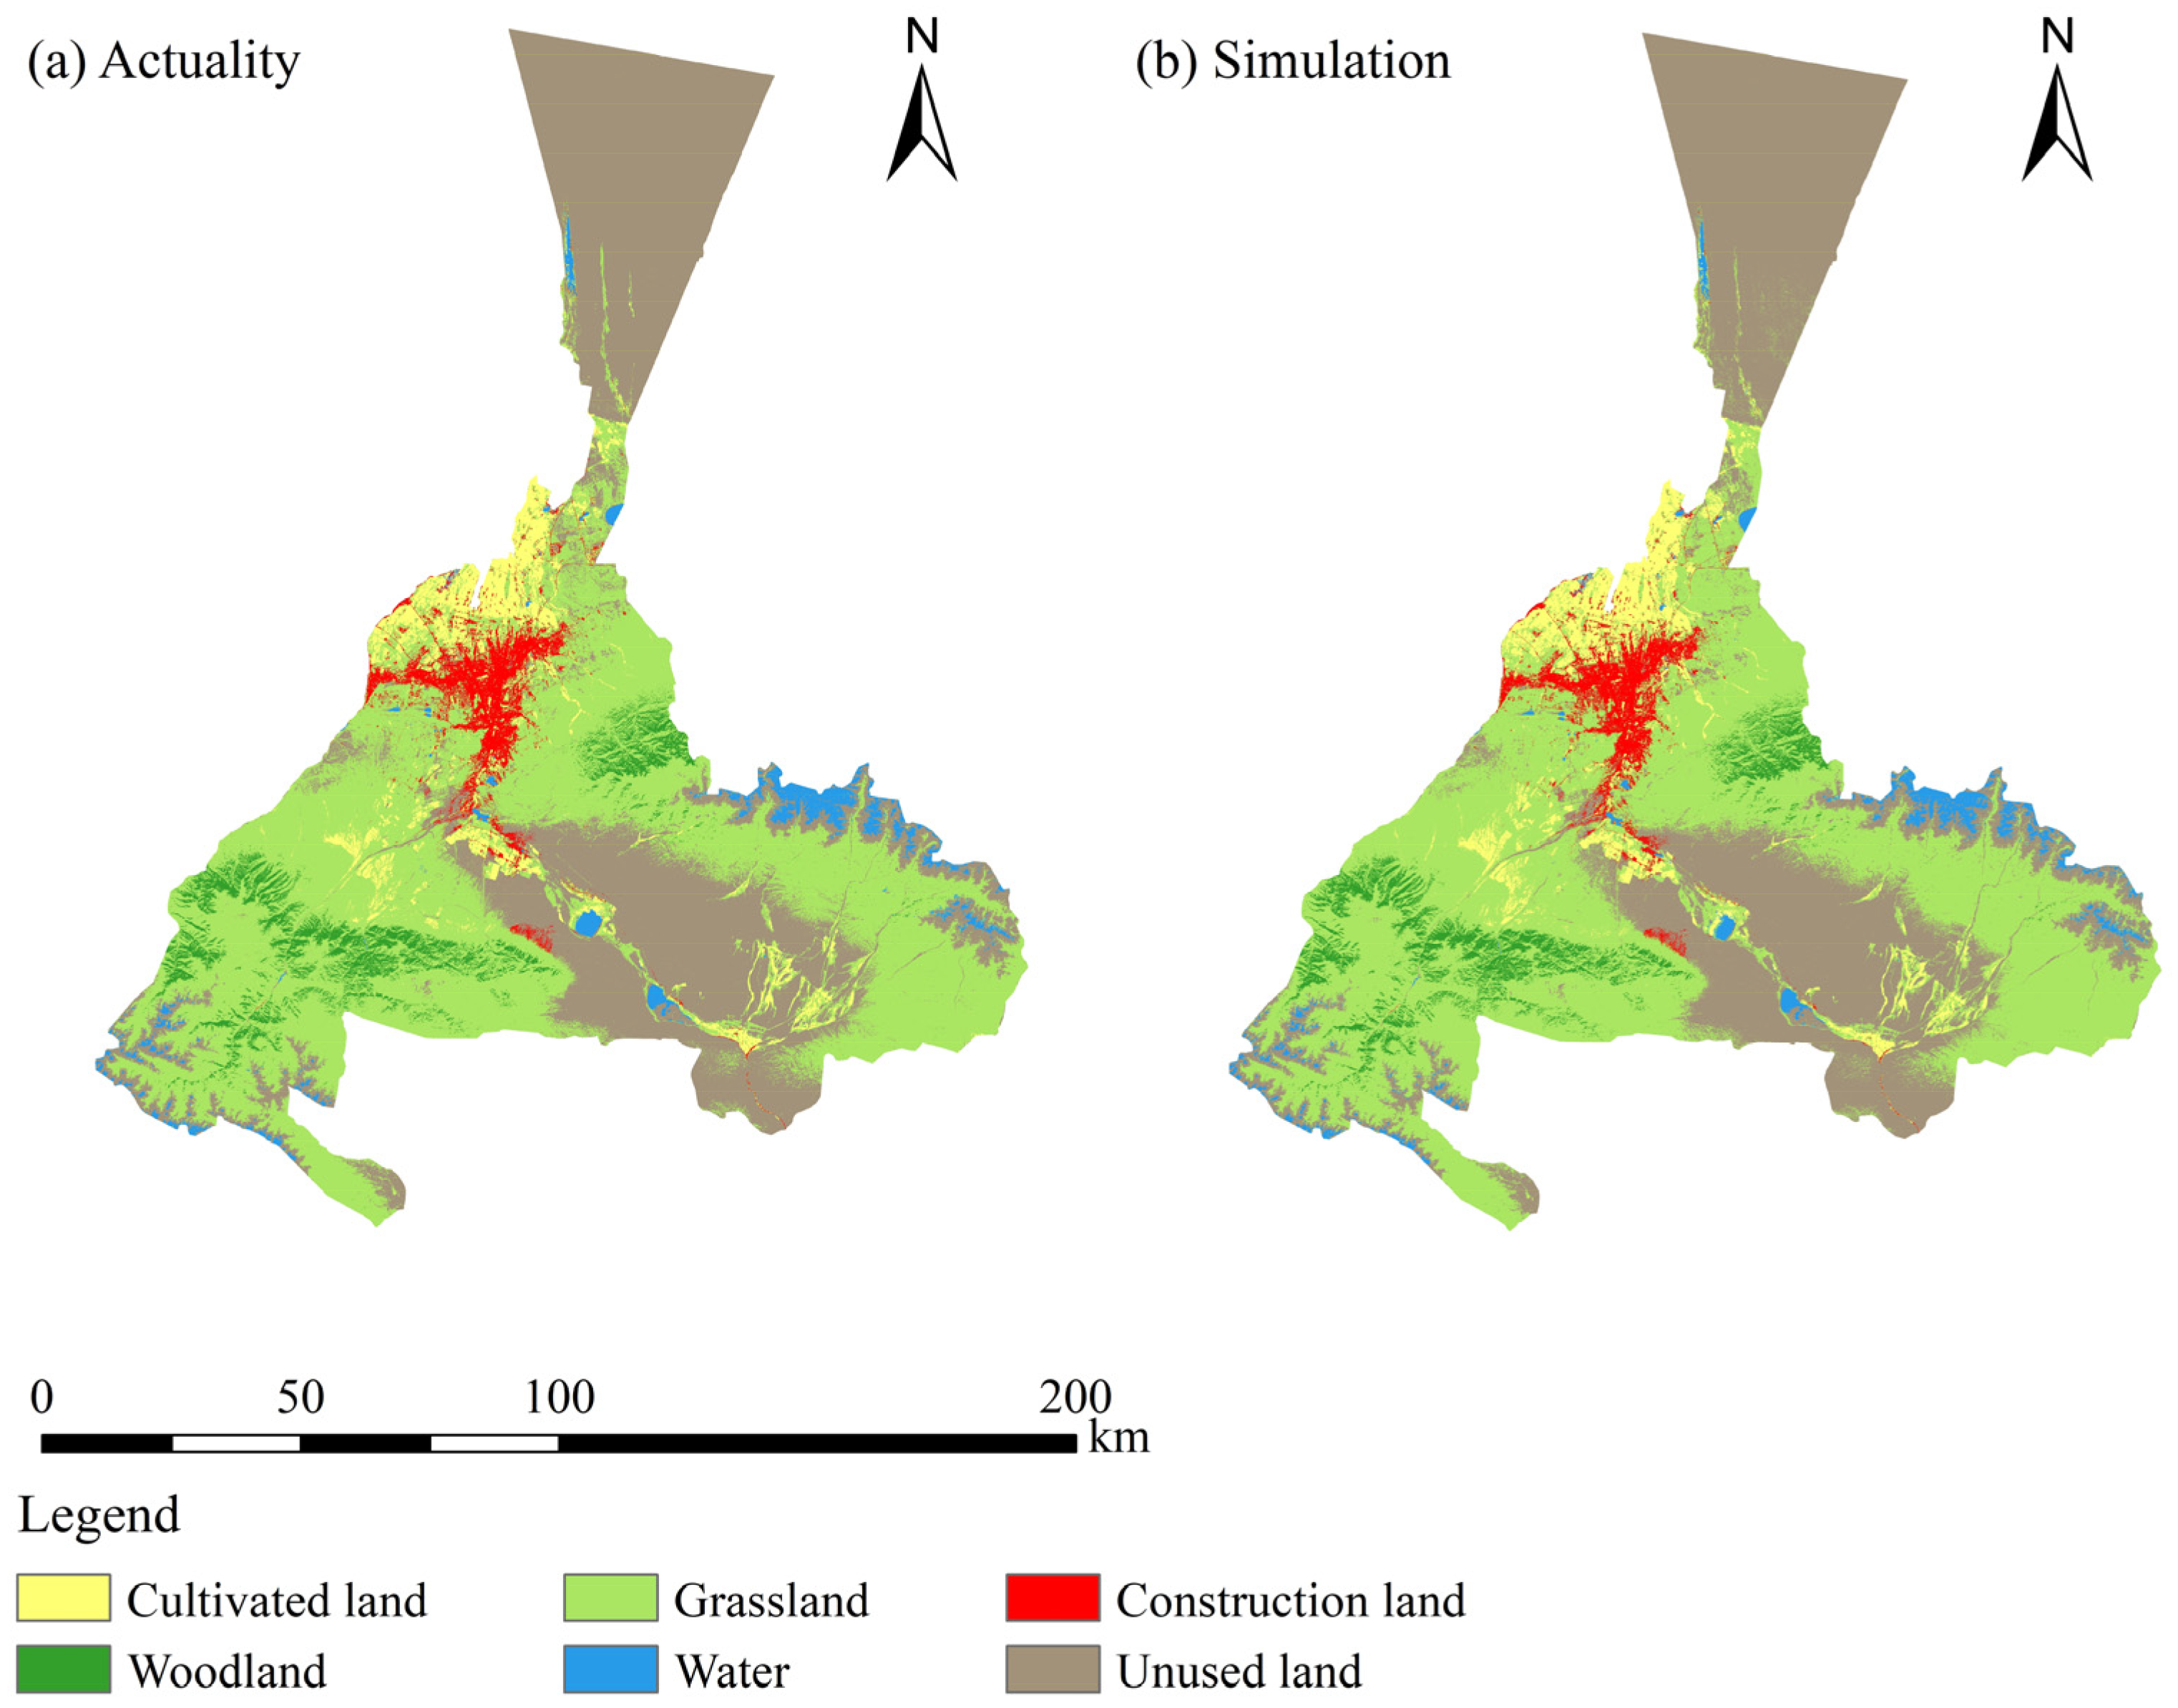
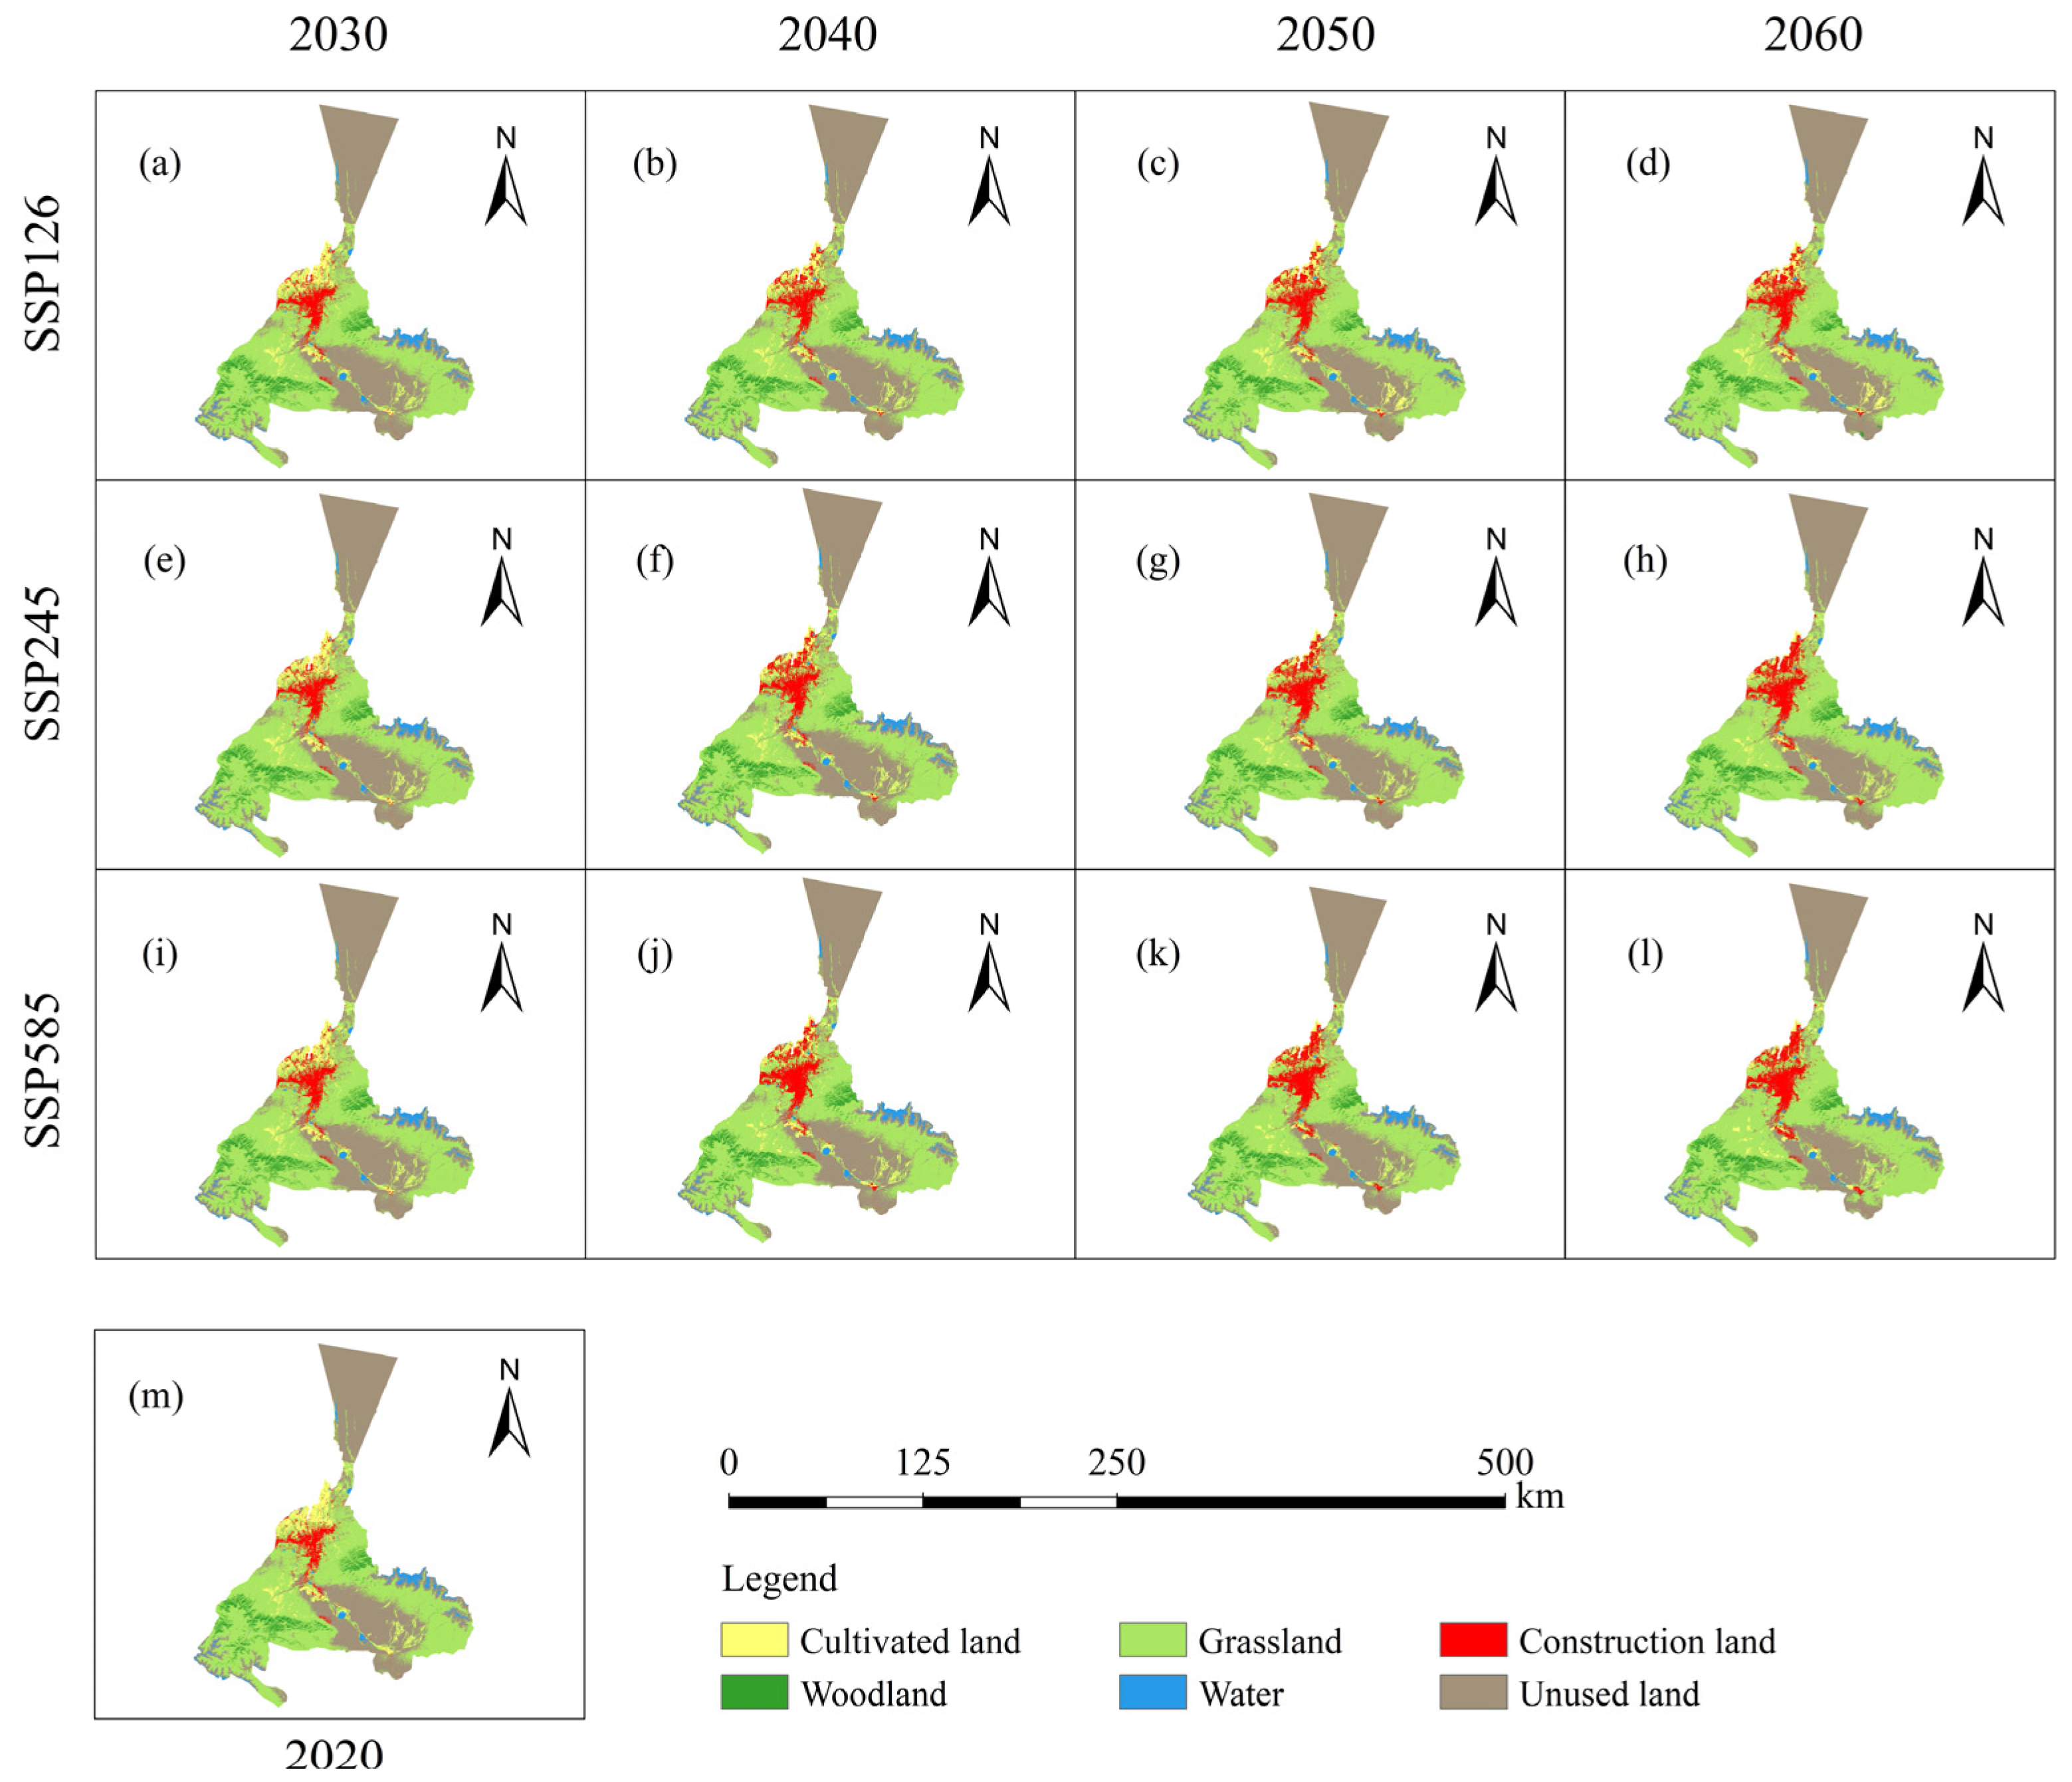
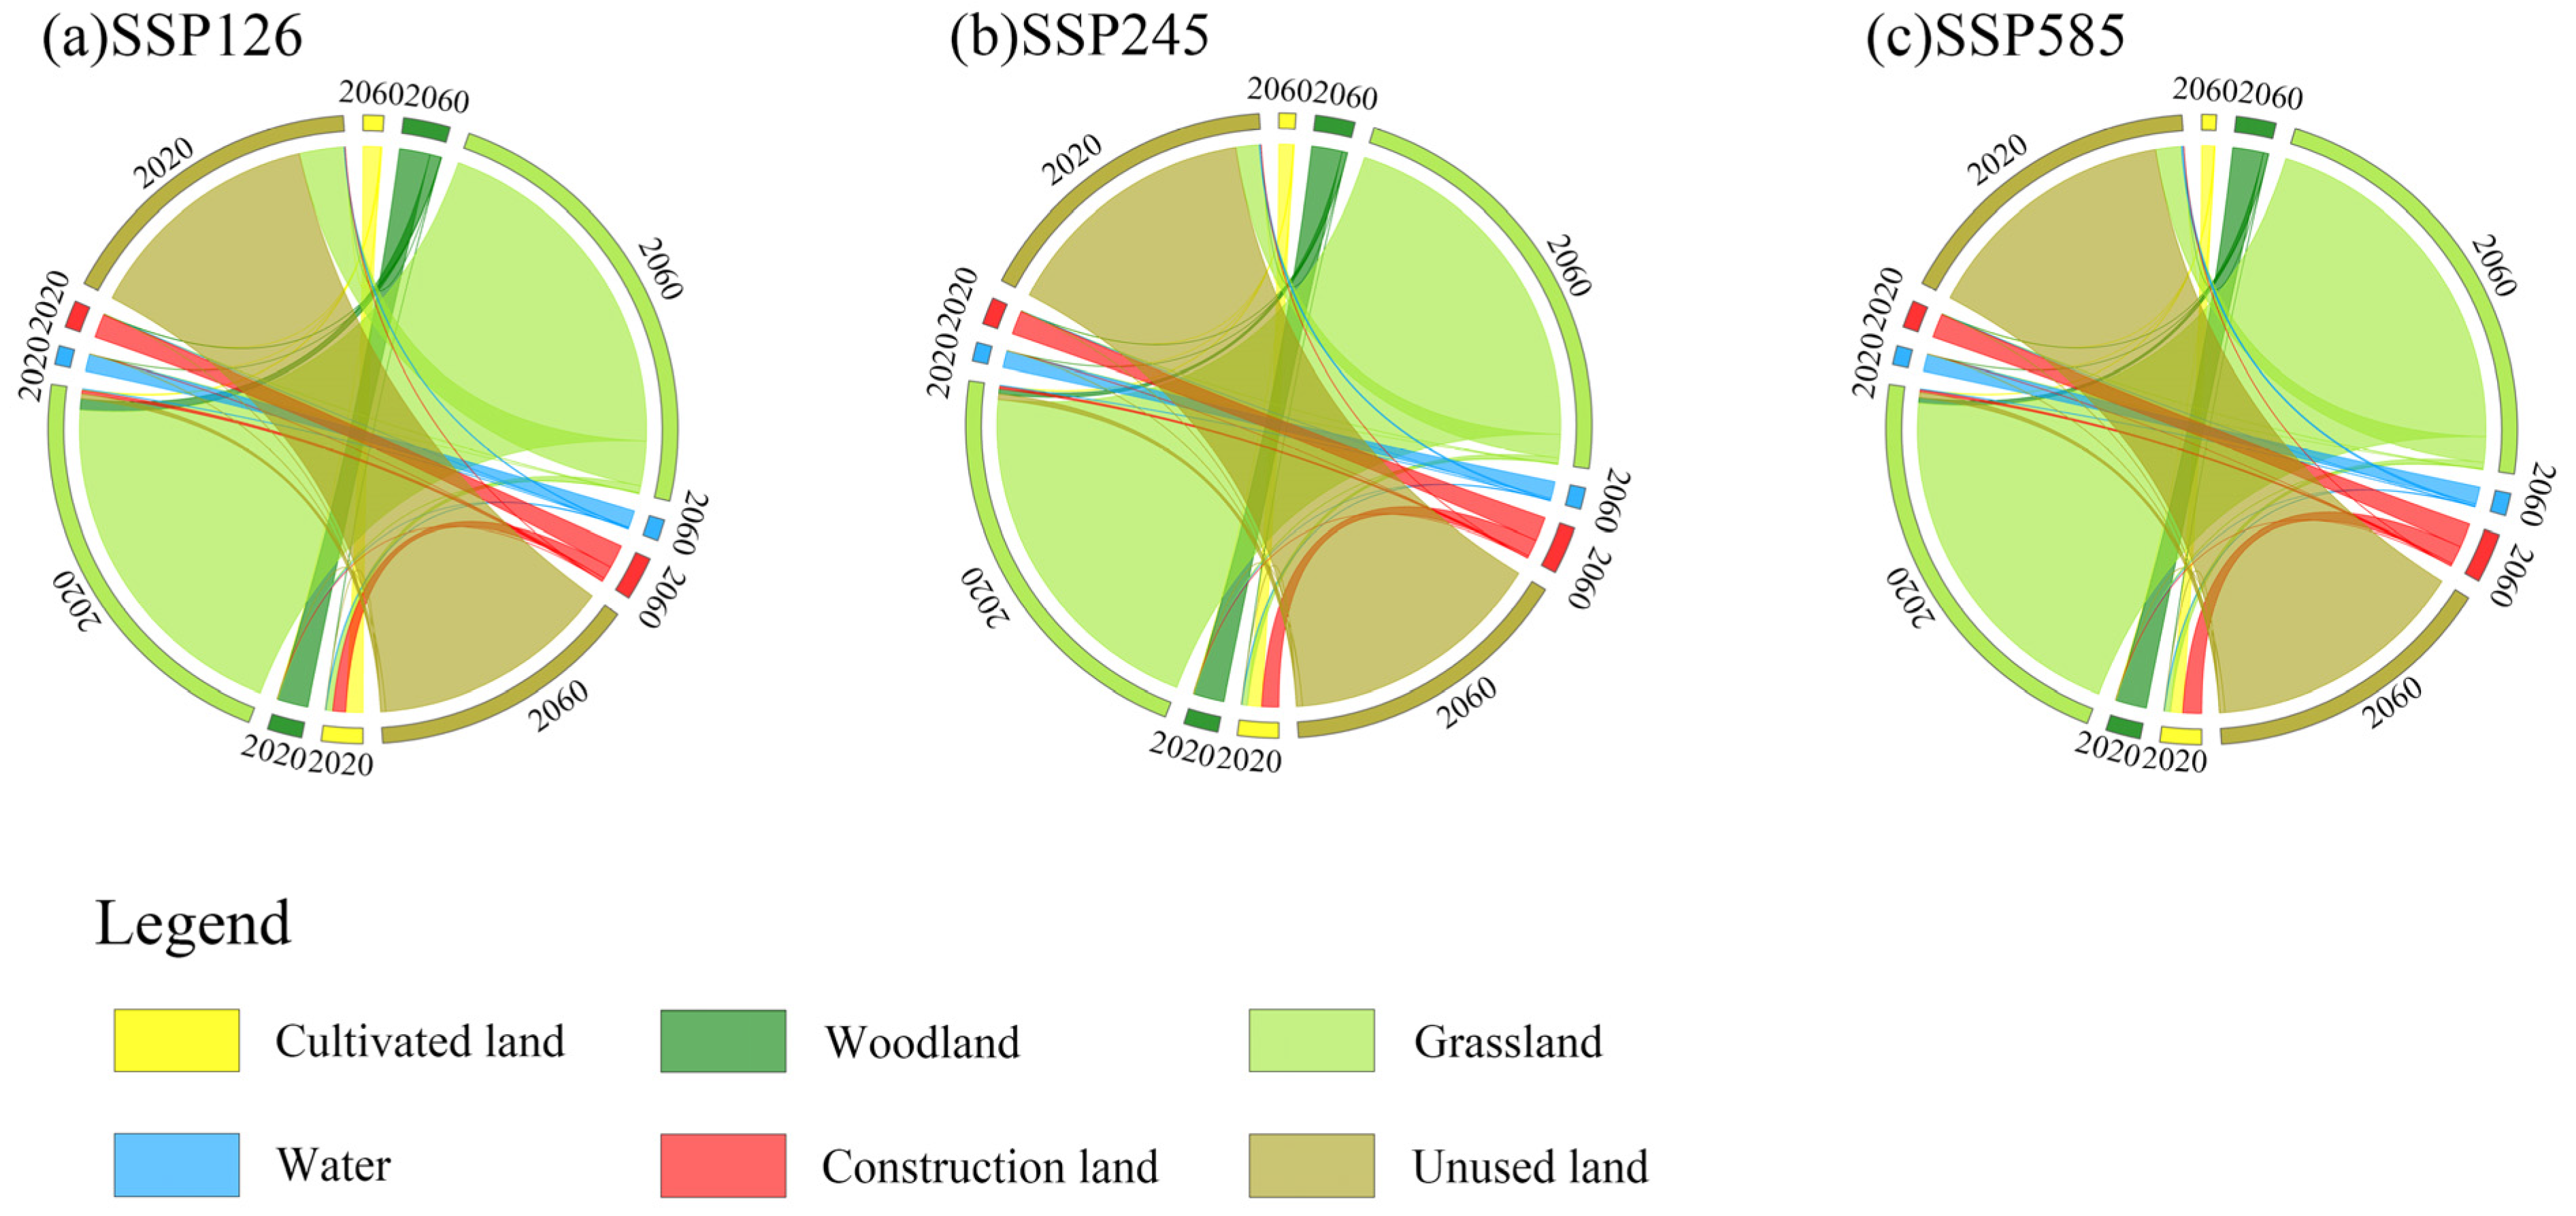
3.1.2. Land Use Spatial Distribution Simulation

According to the simulation results of the PLUS model on the spatial distribution pattern of land use in Urumqi (Figure 6), together with the transfer of land use types in 2020–2060 (Figure 7), we found that under three SSP-RCP scenarios, the construction land expands northward to varying degrees on the basis of the original built-up area, encroaching on a large area of arable land. The SSP585 scenario has the most prominent expansion trend in construction land, followed by the SSP245 and SSP126 scenarios. Compared to 2020, the area of construction land under the SSP585 scenario grows about 1.3-fold by 2060. Cultivated land changes opposite to construction land under each scenario. Woodland growth occurs in areas with a better ecological base, that is, the Haxiongou Scenic Area in the eastern part of Urumqi and the Tien Shan Grand Canyon Forest Park in the southern outskirts of the city. The increased area comes from the transformation of grasslands. The increase in grassland area originates from the conversion of a large amount of unused land with some cultivated land, primarily in the southern part of Urumqi. The SSP126 scenario has the highest increase in woodland and grassland. The SSP245 scenario, in comparison with the SSP585 scenario, has a smaller difference in the area of woodland and grassland. The SSP585 scenario shows a more noticeable increase in the area of water in the vicinity of the Tianshan 1 glacier in the southwestern part of Urumqi and the glaciers in the Bogda Mountains in the southeastern part of this city, which are mainly converted with the unused land. In summary, the SSP126 scenario has the smallest amount of unused land by 2060, while the SSP245 scenario has the largest amount.

3.2. Landscape Ecological Risk Change

According to the calculation results of the LERI, the landscape ecological risk of Urumqi was classified into five levels of lowest risk (LERI < 0.08), lower risk (0.08 < LERI < 0.01), medium risk (0.10 < LERI < 0.12), higher risk (0.12 < LERI < 0.15), and highest risk (LERI > 0.15) by using the natural breakpoint method [48,52].

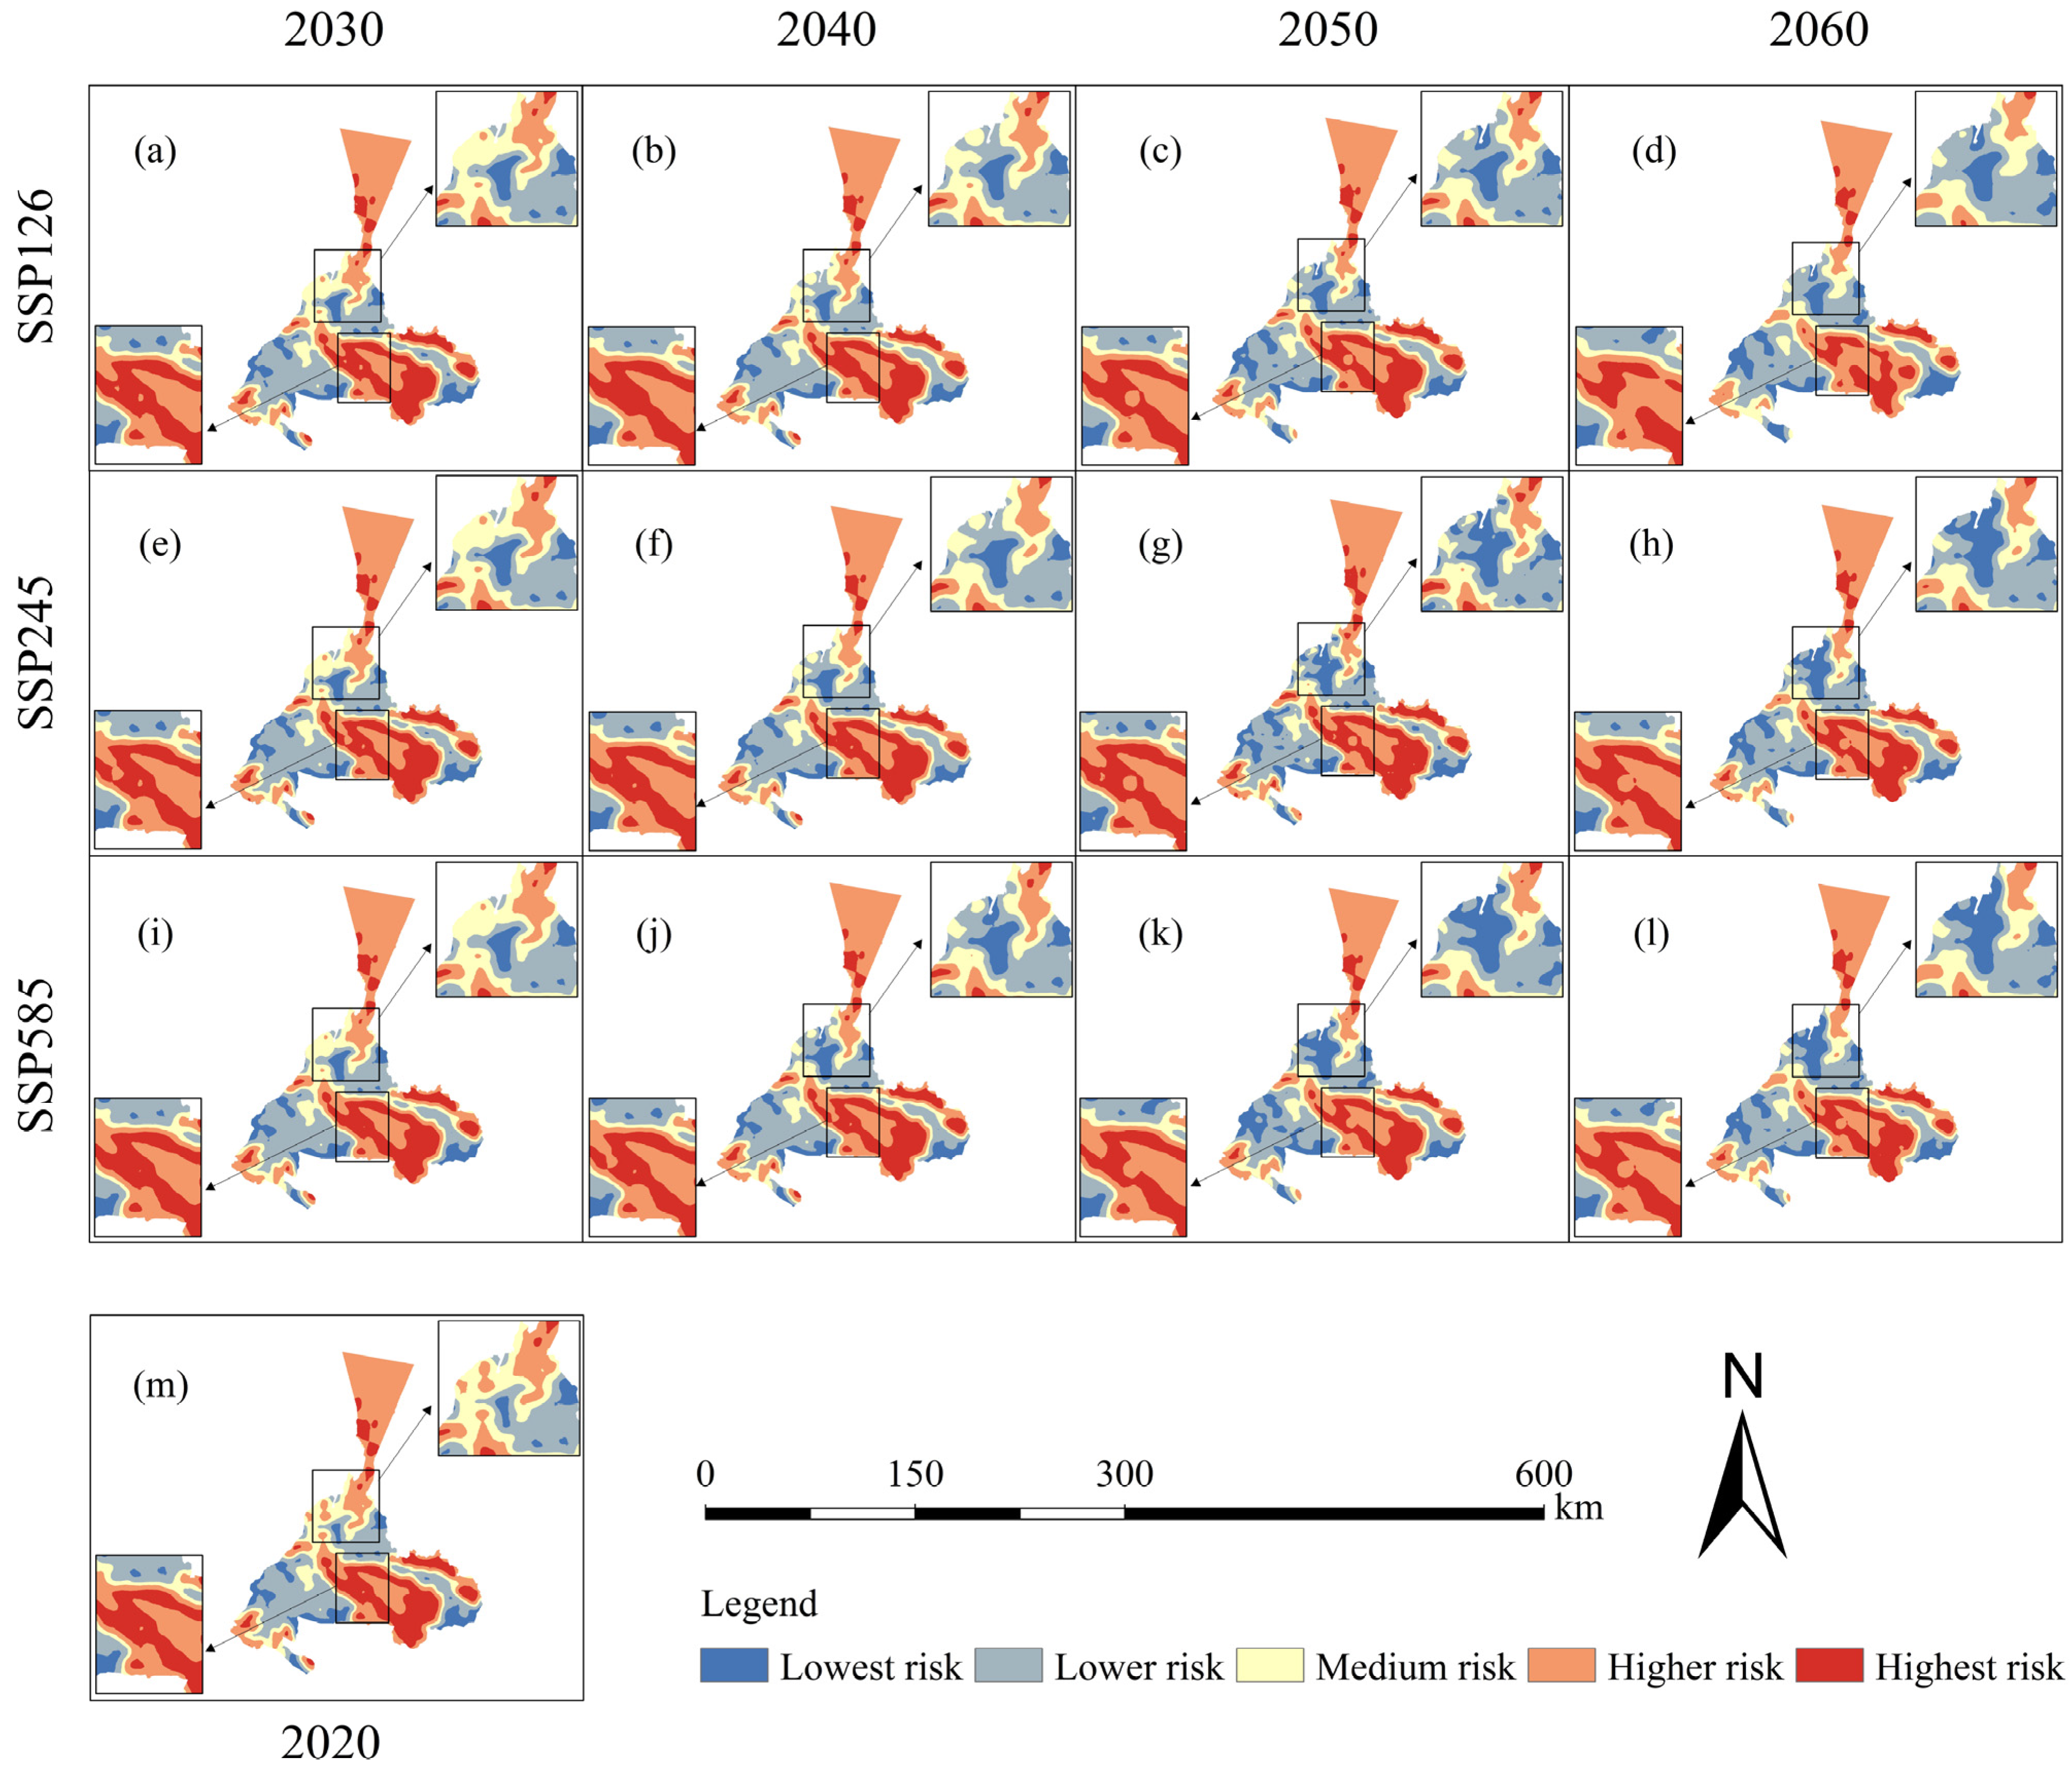
3.2.1. Spatial Distribution of Landscape Ecological Risk

The spatial distribution of landscape ecological risk is similar under the three SSP-RCP scenarios (Figure 8). The lowest-risk zones are located in the central built-up area of Urumqi and in the southern fringe of this city, where grassland is concentrated and contiguous. Usually, the possibility of being disturbed after the land is transferred to urban construction use is rare, and its own vulnerability is low. The fragmentation and separation degree of the concentrated grassland is low, and its resistance to disturbance is strong. Therefore, these areas have minimal ecological losses and the lowest risk. The lower-risk zones are primarily situated in the eastern and southwestern parts of Urumqi, where woodland and grassland growth is abundant. Most of the area belongs to the natural landscape protection area, where woodland and grassland are generally difficult to subject to anthropogenic disturbances, so the degree of landscape vulnerability is low. Although the two are intertwined and distributed, the landscape type is relatively homogeneous, the degree of patch fragmentation is not obvious, and the spatial stability is high. Consequently, the ecological loss is small and the risk is low. Medium-risk zones are situated in the transition zone between lower- and higher risk zones, mostly in landscapes of cultivated land and grassland in close proximity to human activities. With the impact of rapid urbanization, these lands could easily be transformed into development land. The higher-risk zones are scattered in the northern and southeastern portions of Urumqi, mainly consisting of large areas of unused land and its interspersed distribution with grassland. When disturbed by external factors, it is more difficult to recover and rebuild unused land, and it is prone to inducing disasters such as landslides and soil erosion, so unused land has the highest degree of vulnerability itself. Moreover, the interlaced distribution of unused land and grassland aggravates the degree of fragmentation and separation of landscape patches, with more complex changes in patch morphology and weaker resistance to disturbance. Accordingly, the ecological loss is more serious, and the risk is higher. The highest-risk zones are concentrated in the center of the higher-risk zones, with a rich variety of land types dominated by water. Water resources in arid zones are susceptible to climate change and anthropogenic disturbances and are vulnerable to damage. Also, water has a profound influence on human production and life, as well as vegetation growth and development. As a result, there are often intricate and complex diversified landscapes in the vicinity of water sources, which leads to poor connectivity and a high degree of separation of landscape patches, weak resistance to interference, and a poor internal stability of the landscape as a whole, resulting in the greatest ecological loss and the highest risk in this region.

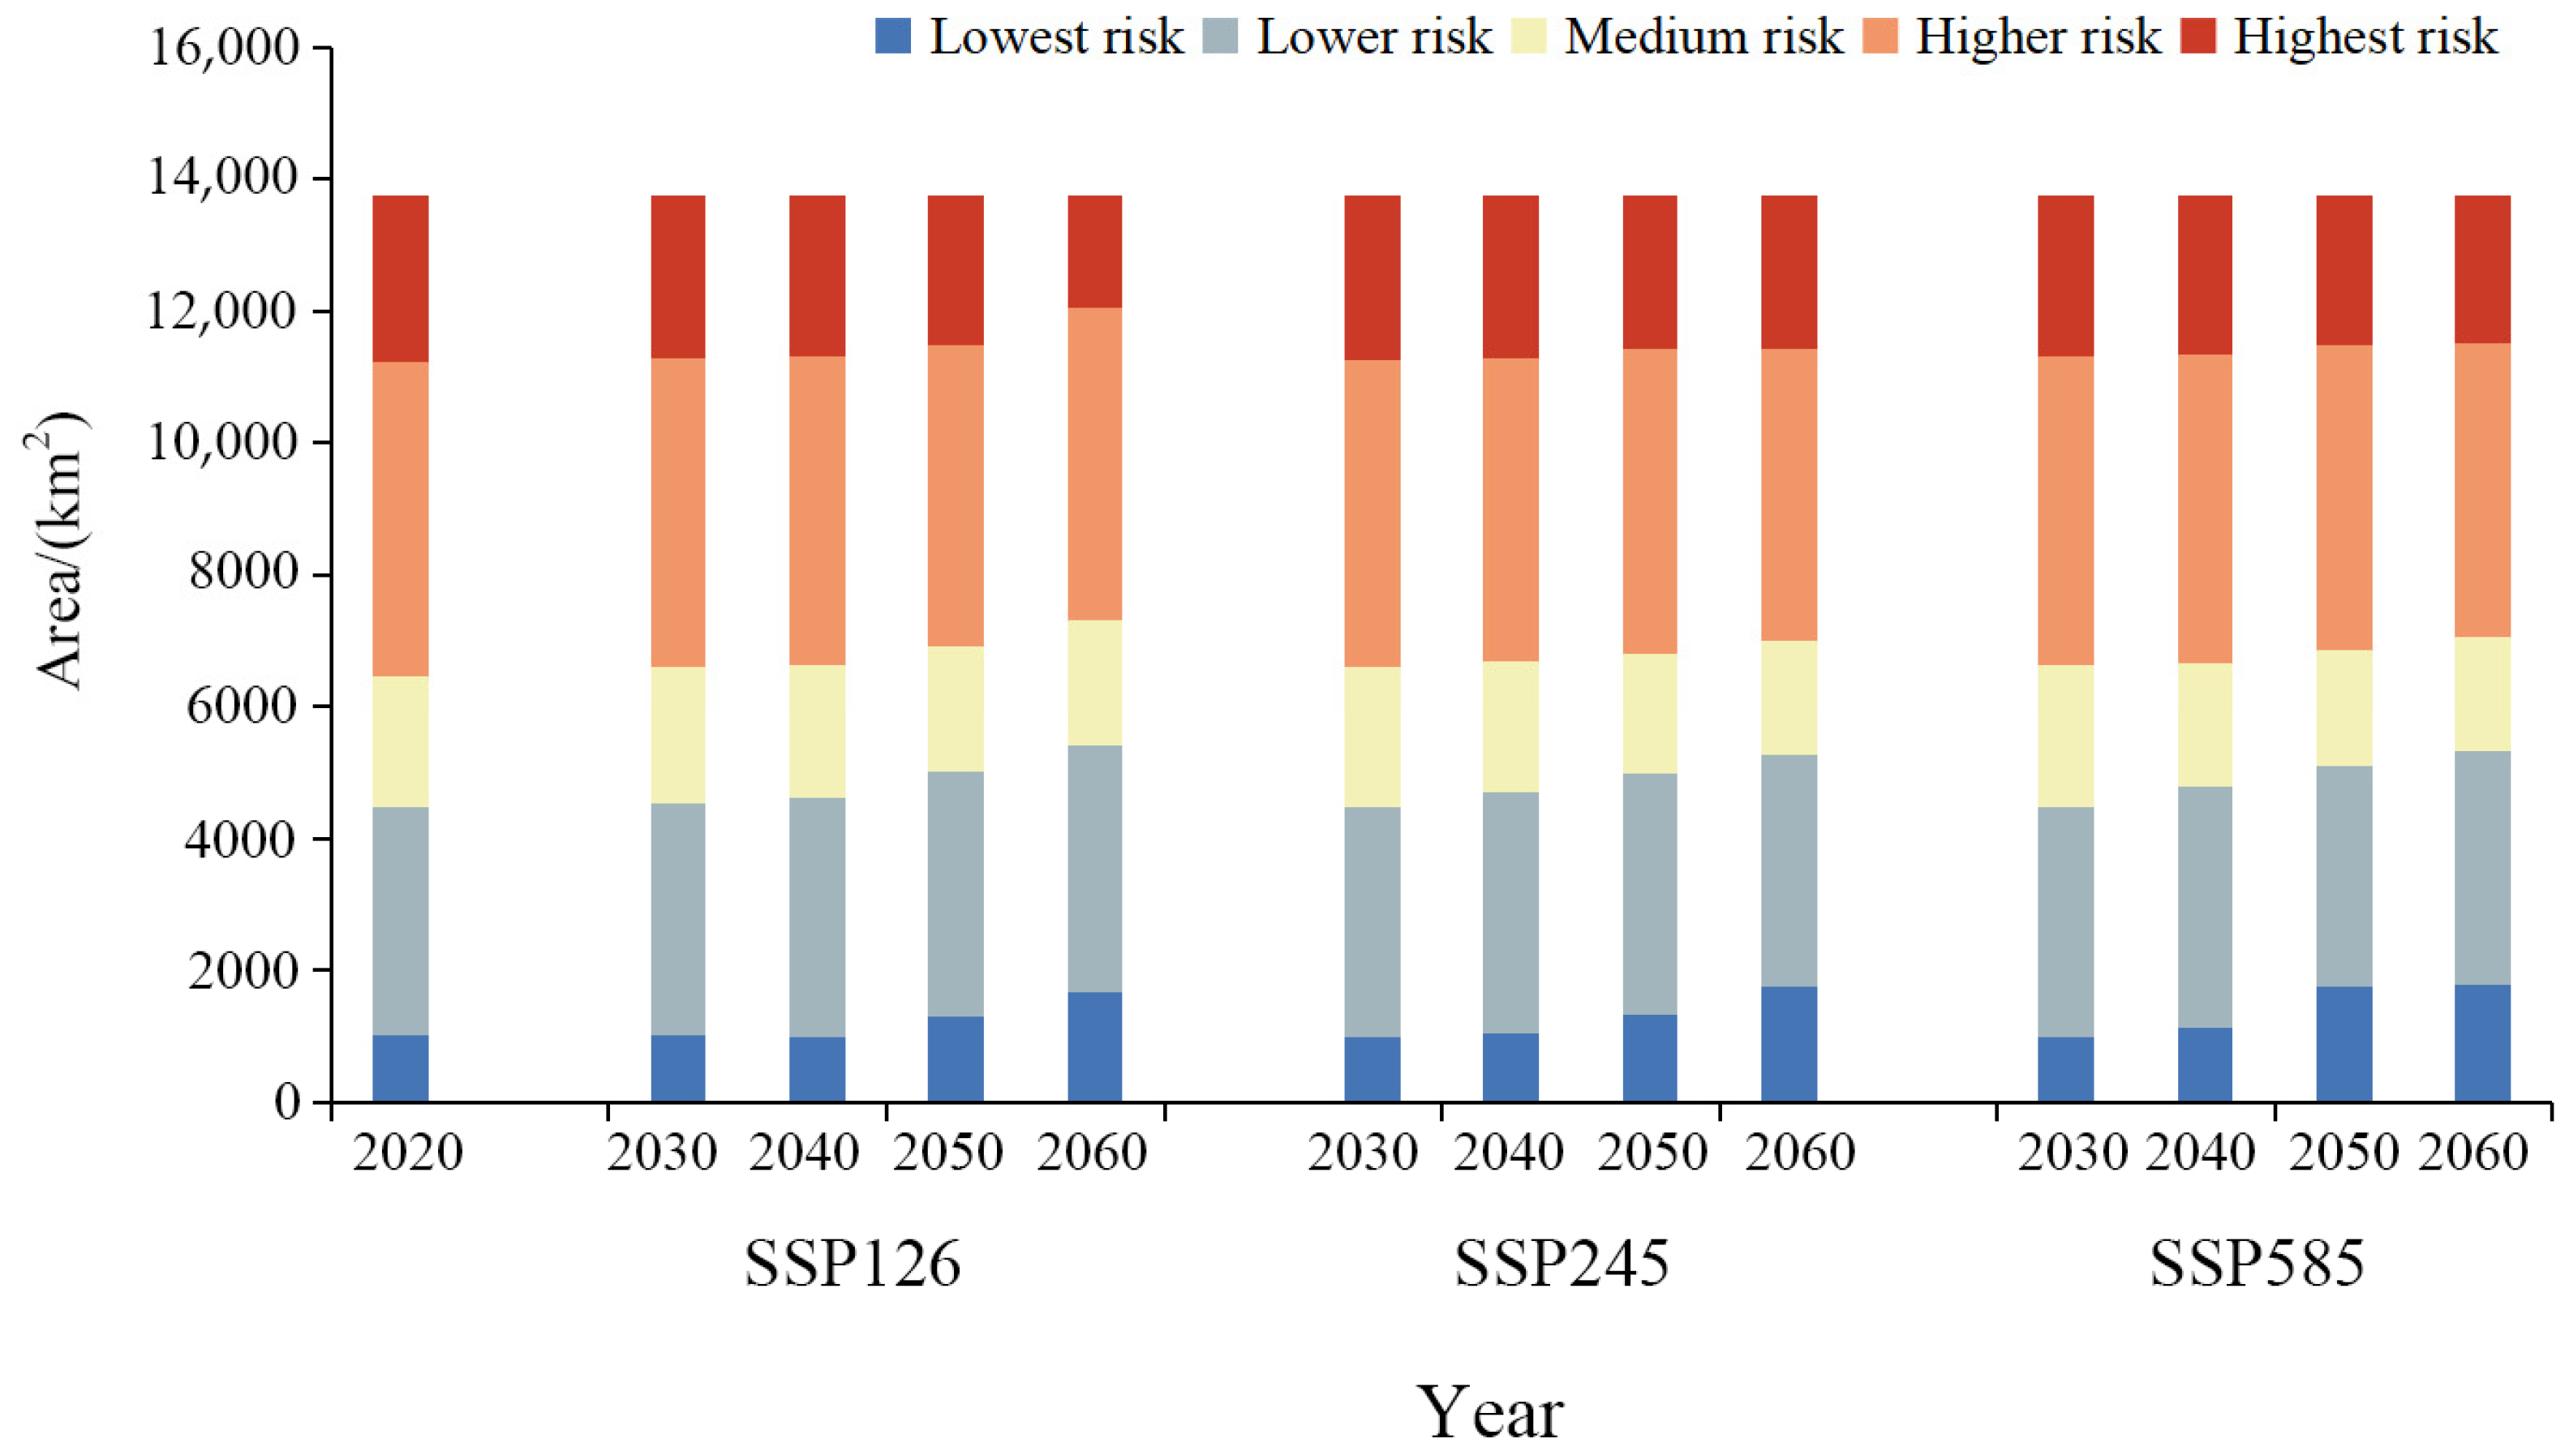
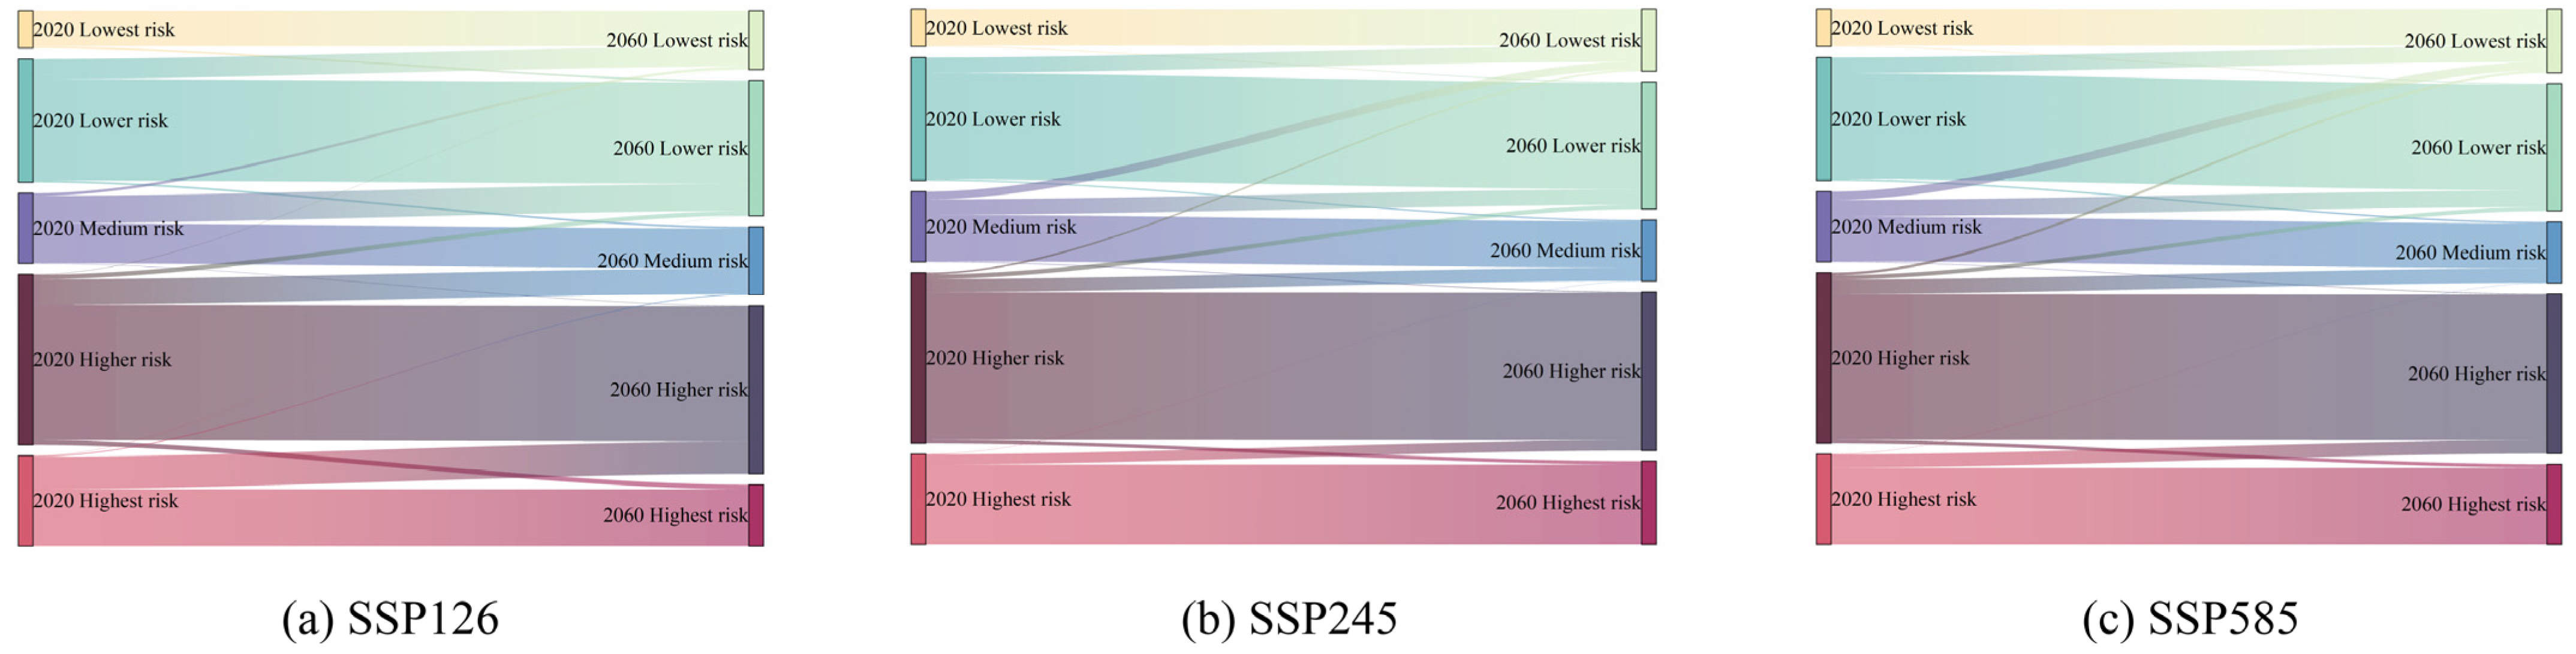
3.2.2. Changing Trends in Landscape Ecological Risk

Further comparing changes in the risk zones of each level under the three SSP-RCP scenarios (Figure 9), we noticed that the lowest-risk and the lower-risk zones all tended to increase in 2020–2060, whereas the medium-risk, higher-risk, and highest-risk zones all tended to decrease. However, there were differences in changes in the risk zones of each level under different scenarios.
The expansion of construction land into patches caused landscape types to converge, fragmentation to decrease, connectivity to increase, and stability to increase. Thus, the SSP585 scenario had the largest increase in the lowest-risk zones, followed by the SSP245 and SSP126 scenarios. The increased area mainly originated from the original lower-risk and medium-risk zones around the urban built-up areas. The lower-risk zones increased the most in the SSP126 scenario, while there was no apparent difference in the SSP245 and SSP585 scenarios. This was due to the fact that the growth of construction land was moderated in the SSP126 scenario, and different landscapes such as cultivated land and grassland were still available in the vicinity. As a result, most of the original medium-risk zones near construction land were downgraded to lower-risk zones, and a minority of them were directly converted to lowest-risk zones. Meanwhile, under the SSP126 scenario, the massive growth of vegetation enhanced ecosystem quality and diminished ecological sensitivity so that the regional lower-risk zones spread outward from their original bases, some of the highest-risk zones were downgraded to higher-risk zones, and the higher-risk zones were transformed into medium-risk zones. Under the SSP245 and SSP585 scenarios, a small amount of vegetation grew in the original unused land in the southern part of Urumqi, while the cultivated land was degraded. These changes complicated the landscape types and destabilized the interior of the unused land. Consequently, the highest-risk zones were larger. The transfer of different levels of risk zones is shown in Figure 10.
During the study period, the areas with reduced risk levels under scenarios SSP126, SSP245, and SSP585 were 3219.69 km2, 1953.59 km2, and 2144.41 km2, respectively, while the areas with increased risk levels were 248.84 km2, 178.16 km2, and 181.13 km2, respectively. The average ERI in 2020 was 0.1193. The average ERIs in the SSP126, SSP245, and SSP585 scenarios in 2060 were 0.1142, 0.1154, and 0.1149, respectively. This illustrates that the landscape ecological risk of Urumqi generally shows a decreasing trend over 40 years, and the SSP126 scenario has the lowest level of landscape ecological risk.

4. Discussion

4.1. Comprehensive Impacts on Landscape Ecological Risk

SSP126, as a sustainability scenario with low GHG emissions, is closer to a model that implements the concept of ecological priority and green development. This scenario has appropriate carbon dioxide emissions, which can effectively increase leaf area, reduce transpiration rate, improve water utilization in arid regions, and facilitate vegetation growth [53]. The continuous outward extension of woodland and grassland is conducive to the maintenance of biodiversity and ecological balance, reduces land vulnerability, and ultimately leads to a reduction in the landscape ecological risk of the region. Moreover, forest trees have a strong carbon-sequestration capacity, which can alleviate the pressure brought about by climate change. The growth of vegetation around the desert is also of vital significance to prevent soil erosion and strengthen desertification control. Additionally, this scenario emphasizes the harmonization of urban expansion with the preservation of arable land, and the situation of construction land wantonly encroaching on cultivated land is obviously less than that of the other two scenarios, which to a certain extent mitigates the double pressure on cultivated land brought about by “eating” and “ building”.
SSP245 is a moderate development scenario with medium GHG emissions, analogous to a development pattern that continues the historical development trend of the region [43]. SSP585 represents a development scenario with high GHG emissions, equivalent to a development pattern that is dominated by rapid economic growth and neglects ecological and environmental protection. In both scenarios, the high demand for urban buildings due to population growth and socio-economic development continues to drive the spread of construction land, and the same type of landscape patches are gradually clustered and become more regular and simple in shape, leading to strengthened landscape connectivity, increased internal stability, and continuously decreasing landscape ecological risk in the city center. However, the blind outward spread of built-up land will encroach on massive farmland and damage the ecological environment of cropland. High concentrations of carbon dioxide will lead to increased soil acidity and decreased land fertility [54]. The dual influence of climate change and socio-economic development will put enormous pressure on agricultural production. As the population keeps growing, the demand for food will increase accordingly, which does not match the large-scale reduction in farmland and will inevitably exacerbate the conflict between people and land. At the same time, excessive carbon dioxide concentrations will accelerate vegetation growth and shorten the vegetation life cycle [55], causing the area of forest and grass growth in the SSP585 and SSP245 scenarios to be noticeably smaller than that in the SSP126 scenario. Furthermore, rising temperatures will trigger the Tien Shan glacier to shrink and the vegetation at its end to change [56]. Glacier melting may cause natural disasters, including floods and glacial mudslides. Glacier runoff will continuously decrease, leading to a gradual scarcity of freshwater resources downstream, as well as diversified and fragmented development of land use types, and will increase the landscape ecological risk.

4.2. Recommendations for the Future Development of Urumqi

Although rapid urbanization can reduce the landscape ecological risk in the built-up area of the city center, the deepening process of industrialization and frequent human activities will change the regional landscape pattern to a certain extent and damage the ecological environment, which will keep the overall landscape ecological risk at a high level. In terms of this research, the SSP126 scenario is the optimal model for future sustainable development in Urumqi. In order to achieve this goal, the local government can try to achieve the following three aspects.
First, the supervision of urban construction land has been strengthened to guide the orderly expansion of cities and towns. Adhering to the principles of government-guided and market-led expansion, we should vigorously revitalize the urban land stock, cut down the occupation of cultivated land for all kinds of structures at the source, and curb the trend of rapidly diminishing arable land in the process of urbanization. Meanwhile, we should exploit reserve resources of cultivated land in accordance with the principle of land setting by water, transform medium- and low-yield farmland, organize idle and abandoned land, improve the integration of land types, and strengthen the ability of cultivated landscapes to resist disturbance.
Second, the protection of ecological land in suburban and mountainous areas is emphasized. It should divide prohibited development zones at water wetlands, strengthen water-quality monitoring and water-pollution prevention, make full use of reclaimed water for wetland replenishment, and make every effort to promote the protection and restoration of water wetlands. We should establish a scientific ecological protection mechanism, improve the order of ecotourism in natural scenic areas, systematically manage and protect wildlife and plants in nature reserves, ameliorate biodiversity, continuously enhance ecological quality and ecological functions, and reduce ecosystem vulnerability.
Third, a large number of emission reduction measures need to be taken in the future, and the promotion of new energy development should be given a more prominent position. It is necessary to vigorously develop wind power and photovoltaic power generation and minimize the use of traditional fossil fuels. We need to focus on promoting the green transformation of development patterns and steadily push forward carbon peaking and carbon neutrality, in order to address the damage that climate change poses to ecosystem security.

4.3. Strengths and Limitations

We used data from different SSP-RCP scenarios in the CMIP6 dataset to establish a comprehensive framework based on the SD model, th PLUS model, and the LERI to simulate future LUCC and predict landscape ecological risks, which fills the gap in research on the impacts of LUCC on landscape ecological risk under future climate change. Related studies showed [57,58] that multi-model ensemble average values were more representative of the actual observations than the values from a single model. Therefore, we calculated the average values of temperature and precipitation for 11 GCMs in order to achieve more accurate simulation results. In addition, some scholars used temperature, precipitation, population, and GDP data to set the future simulation parameters of the SD model [20,43,59]. For the sake of more accurately probing the quantitative relationship between climate, economy, population, and LUCC in this study area, after several experiments, we added vegetation coverage and runoff data to the above four types of data, which yielded powerful simulation results.
The accuracy of land use simulation results directly affects the evaluation results of landscape ecological risk. However, as a new model developed in recent years, PLUS is still in the primary stage of comprehension [36]. The optimal simulation results of this model are identified by repeatedly debugging the parameters, which is somewhat subjective. In future studies, further comparisons with other models should be conducted to increase credibility. The precision of the satellite data products themselves that are input into the model also affects LUCC simulations to some extent, and it is essential to explore higher-quality land-use products in the future [60]. Although the LERI method is favored by most scholars for its ability to measure both the vulnerability within the ecosystem and the degree of interference from external factors [61], it is only concerned with static landscape pattern characteristics and lacks the ecological connotation of ecological risk [51], which still needs to be continuously perfected for the actual situation in the future. In addition, this study only considered the impacts of LUCC on landscape ecological risk under three SSP-RCP scenarios, which is not comprehensive enough. In the future, we will further quantify the impacts of different types of strategies, resource limitations, and extensive management in land use demand forecasting to improve the accuracy of landscape ecological risk assessment.

5. Conclusions

In this study, we coupled the SD model with the PLUS model to simulate the land use demand of Urumqi under three SSP-RCP scenarios from 2020 to 2060, and we predicted landscape ecological risk changes in Urumqi based on the LERI. The study results indicate that the overall LUCC characteristics driven by different scenarios are similar, but the magnitude and rate of change differ in each land use type. The SSP126 scenario has low GHG emissions and suitable temperatures; therefore, the vegetation growth rate is faster, and there is a significant tendency for woodland and grassland to spread to unused land. Under the other two scenarios, especially the SSP585 scenario, rapid urban development pushes the construction land to increase continuously, and the neighboring cultivated land decreases speedily. Excessive GHG concentrations affect the normal growth of vegetation, and, thus, woodlands and grasslands increase to a lesser extent. Meanwhile, the area of water increases as rising temperatures trigger the melting of glaciers. In terms of the landscape ecological risk response, the risk level of urban construction areas and nature reserves with a favorable ecological foundation is relatively low, whereas the risk level of unused land with a poor ecological environment and water regions such as glaciers and lakes susceptible to disturbance by human and climatic factors is quite high. The rapid expansion of built-up land and massive vegetation growth are the dominant factors that cause a decrease in the overall risk level in Urumqi, and the disturbance and destabilization of water and unused land are crucial reasons for exacerbating the risk in localized areas. In summary, the SSP126 scenario has the lowest landscape ecological risk index. In the future, we should be aware of the need to rationalize land use planning, protect ecological land use, continuously promote green and low-carbon development, and maintain the stability of ecosystems in arid regions.

Author Contributions

Conceptualization, H.F. and Q.S.; methodology, H.F. and Q.S.; software, H.F.; validation, H.F. and G.L.; investigation, H.F. and Q.S.; resources, W.D. and X.L.; data curation, H.F. and Q.S.; writing—original draft preparation, Q.S.; writing—review and editing, H.F., Q.S. and X.L.; visualization, H.F. and Q.S.; supervision, X.L., W.D. and G.L.; funding acquisition, W.D. and X.L. All authors have read and agreed to the published version of the manuscript.

Funding

This research was funded by the National Natural Science Foundation of China, grant number 71663051, and the Graduate Innovation Project of Xinjiang, grant number XJ2023G136.

Data Availability Statement

In this study, land use data were provided by the annual China Land Cover Dataset from Wuhan University, China (https://zenodo.org/record/4417810, accessed on 23 April 2023); temperature and precipitation data from 2000 to 2020 were provided by the China Meteorological Data Service Center (http://data.cma.cn, accessed on 24 April 2023); vegetation coverage was provided by the Resource and Environment Science and Data Center of Chinese Academy of Sciences (http://www.resdc.cn, accessed on 24 April 2023); DEM data were obtained from the Geospatial Data Cloud (http://www.gscloud.cn, accessed on 24 April 2023); 2021–2060 climate data were provided by the CMIP6 dataset (https://esgf-node.llnl.gov/search/cmip6/, accessed on 26 April 2023); and 2021–2060 population and GDP data were provided by the gridded datasets for population and economy under Shared Socioeconomic Pathways (https://cstr.cn/31253.11.sciencedb.01683, accessed on 27 April 2023).

Acknowledgments

We sincerely thank the instructors, Xinjiang Agricultural University, the anonymous reviewers, and the editor for their comments and suggestions, which have contributed to the improvement of the original manuscript.

Conflicts of Interest

The authors declare no conflict of interest.

Abbreviations

The following are the abbreviations used in this article (Note: Listed in order of first appearance in the text):
LUCCLand use/cover change
CMIP6The Coupled Model Intercomparison Project Phase 6
SDSystem dynamics
PLUSPatch-generation land use simulation
LERILandscape ecological risk index
GHGGreenhouse gas
SSPsThe Shared Socioeconomic Pathways
RCPsThe Representative Concentration Pathways
ANNArtificial neural network
CACellular automata
CLUE-SConversion of land use and its effects at small regional extent
FLUSFuture land use simulation
LEASLand expansion analysis strategy
CARSCellular automata based on multi-type random patch seeds
GCMsGlobal climate models
GDPGross domestic product
DEMDigital elevation model
RGGAnnual rate of GDP growth
RPGAnnual rate of population growth
TCAnnual average surface temperature change
PCAnnual precipitation change
RCAnnual runoff change
VCAnnual average vegetation coverage change

References

  1. Su, B.; Huang, J.; Mondal, S.K.; Zhai, J.; Wang, Y.; Wen, S.; Gao, M.; Lv, Y.; Jiang, S.; Jiang, T. Insight from CMIP6 SSP-RCP scenarios for future drought characteristics in China. Atmos. Res. 2021, 250, 105375. [Google Scholar] [CrossRef]
  2. Chen, C.; Gan, R.; Feng, D.; Yang, F.; Zuo, Q. Quantifying the contribution of SWAT modeling and CMIP6 inputting to streamflow prediction uncertainty under climate change. J. Clean. Prod. 2022, 364, 132675. [Google Scholar] [CrossRef]
  3. Arias, P.; Bellouin, N.; Coppola, E.; Jones, R.; Krinner, G.; Marotzke, J.; Naik, V.; Palmer, M.; Plattner, G.-K.; Rogelj, J. Climate Change 2021: The Physical Science Basis. Contribution of Working Group I to the Sixth Assessment Report of the Intergovernmental Panel on Climate Change; Technical Summary. In Proceedings of the Intergovernmental Panel on Climate Change AR6, Oberpfaffenhofen, Germany, 26 July–7 August 2021. [Google Scholar]
  4. Chen, J.; Shi, X.; Gu, L.; Wu, G.; Su, T.; Wang, H.-M.; Kim, J.-S.; Zhang, L.; Xiong, L. Impacts of climate warming on global floods and their implication to current flood defense standards. J. Hydrol. 2023, 618, 129236. [Google Scholar] [CrossRef]
  5. Kogan, F.; Adamenko, T.; Guo, W. Global and regional drought dynamics in the climate warming era. Remote Sens. Lett. 2013, 4, 364–372. [Google Scholar] [CrossRef]
  6. Barriopedro, D.; González-Herrero, S.; Trigo, R.M.; López-Bustins, J.A.; Oliva, M. Climate warming amplified the 2020 record-breaking heatwave in the Antarctic Peninsula. Commun. Earth Environ. 2022, 3, 122. [Google Scholar]
  7. Forbes, V.E.; Galic, N. Next-generation ecological risk assessment: Predicting risk from molecular initiation to ecosystem service delivery. Environ. Int. 2016, 91, 215–219. [Google Scholar] [CrossRef]
  8. Depietri, Y. The social–ecological dimension of vulnerability and risk to natural hazards. Sustain. Sci. 2020, 15, 587–604. [Google Scholar] [CrossRef]
  9. Peng, J.; Dang, W.; Liu, Y.; Zong, M.; Hu, X. Review on landscape ecological risk assessment. Acta Geogr. Sin 2015, 70, 664–677. [Google Scholar]
  10. Ayre, K.K.; Landis, W.G. A Bayesian approach to landscape ecological risk assessment applied to the Upper Grande Ronde Watershed, Oregon. Hum. Ecol. Risk Assess. 2012, 18, 946–970. [Google Scholar] [CrossRef]
  11. Cui, L.; Zhao, Y.; Liu, J.; Han, L.; Ao, Y.; Yin, S. Landscape ecological risk assessment in Qinling Mountain. Geol. J. 2018, 53, 342–351. [Google Scholar] [CrossRef]
  12. Xu, W.; Wang, J.; Zhang, M.; Li, S. Construction of landscape ecological network based on landscape ecological risk assessment in a large-scale opencast coal mine area. J. Clean. Prod. 2021, 286, 125523. [Google Scholar] [CrossRef]
  13. La Rosa, D.; Martinico, F. Assessment of hazards and risks for landscape protection planning in Sicily. J. Environ. Manag. 2013, 127, S155–S167. [Google Scholar] [CrossRef]
  14. Lin, Y.; Hu, X.; Zheng, X.; Hou, X.; Zhang, Z.; Zhou, X.; Qiu, R.; Lin, J. Spatial variations in the relationships between road network and landscape ecological risks in the highest forest coverage region of China. Ecol. Indic. 2019, 96, 392–403. [Google Scholar] [CrossRef]
  15. Xie, H.; Wen, J.; Chen, Q.; Wu, Q. Evaluating the landscape ecological risk based on GIS: A case-study in the Poyang lake region of China. Land Degrad. Dev. 2021, 32, 2762–2774. [Google Scholar] [CrossRef]
  16. Landis, W.G. Twenty years before and hence: Ecological risk assessment at multiple scales with multiple stressors and multiple endpoints. Hum. Ecol. Risk Assess. Int. J. 2003, 9, 1317–1326. [Google Scholar] [CrossRef]
  17. Lin, X.; Wang, Z. Landscape ecological risk assessment and its driving factors of multi-mountainous city. Ecol. Indic. 2023, 146, 109823. [Google Scholar] [CrossRef]
  18. Han, N.; Yu, M.; Jia, P. Multi-scenario landscape ecological risk simulation for sustainable development goals: A case study on the central mountainous area of Hainan Island. Int. J. Environ. Res. Public Health 2022, 19, 4030. [Google Scholar] [CrossRef]
  19. Bürgi, M.; Bieling, C.; von Hackwitz, K.; Kizos, T.; Lieskovský, J.; Martín, M.G.; McCarthy, S.; Müller, M.; Palang, H.; Plieninger, T. Processes and driving forces in changing cultural landscapes across Europe. Landsc. Ecol. 2017, 32, 2097–2112. [Google Scholar] [CrossRef]
  20. Wang, Z.; Li, X.; Mao, Y.; Li, L.; Wang, X.; Lin, Q. Dynamic simulation of land use change and assessment of carbon storage based on climate change scenarios at the city level: A case study of Bortala, China. Ecol. Indic. 2022, 134, 108499. [Google Scholar] [CrossRef]
  21. Cook, B.I.; Mankin, J.S.; Marvel, K.; Williams, A.P.; Smerdon, J.E.; Anchukaitis, K.J. Twenty-first century drought projections in the CMIP6 forcing scenarios. Earth’s Future 2020, 8, e2019EF001461. [Google Scholar] [CrossRef]
  22. Eyring, V.; Bony, S.; Meehl, G.A.; Senior, C.A.; Stevens, B.; Stouffer, R.J.; Taylor, K.E. Overview of the Coupled Model Intercomparison Project Phase 6 (CMIP6) experimental design and organization. Geosci. Model Dev. 2016, 9, 1937–1958. [Google Scholar] [CrossRef]
  23. Liao, W.; Liu, X.; Xu, X.; Chen, G.; Liang, X.; Zhang, H.; Li, X. Projections of land use changes under the plant functional type classification in different SSP-RCP scenarios in China. Sci. Bull. 2020, 65, 1935–1947. [Google Scholar] [CrossRef] [PubMed]
  24. Dong, N.; You, L.; Cai, W.; Li, G.; Lin, H. Land use projections in China under global socioeconomic and emission scenarios: Utilizing a scenario-based land-use change assessment framework. Glob. Environ. Chang. 2018, 50, 164–177. [Google Scholar] [CrossRef]
  25. Nath, B.; Wang, Z.; Ge, Y.; Islam, K.; Singh, R.P.; Niu, Z. Land use and land cover change modeling and future potential landscape risk assessment using Markov-CA model and analytical hierarchy process. ISPRS Int. J. Geo-Inf. 2020, 9, 134. [Google Scholar] [CrossRef]
  26. Wu, M.; Ren, X.; Che, Y.; Yang, K. A coupled SD and CLUE-S model for exploring the impact of land use change on ecosystem service value: A case study in Baoshan District, Shanghai, China. Environ. Manag. 2015, 56, 402–419. [Google Scholar] [CrossRef]
  27. Islam, K.; Rahman, M.F.; Jashimuddin, M. Modeling land use change using cellular automata and artificial neural network: The case of Chunati Wildlife Sanctuary, Bangladesh. Ecol. Indic. 2018, 88, 439–453. [Google Scholar] [CrossRef]
  28. Feng, Y.; Tong, X. Dynamic land use change simulation using cellular automata with spatially nonstationary transition rules. GISci. Remote Sens. 2018, 55, 678–698. [Google Scholar] [CrossRef]
  29. Jiang, W.; Chen, Z.; Lei, X.; Jia, K.; Wu, Y. Simulating urban land use change by incorporating an autologistic regression model into a CLUE-S model. J. Geog. Sci. 2015, 25, 836–850. [Google Scholar] [CrossRef]
  30. Liu, X.; Liang, X.; Li, X.; Xu, X.; Ou, J.; Chen, Y.; Li, S.; Wang, S.; Pei, F. A future land use simulation model (FLUS) for simulating multiple land use scenarios by coupling human and natural effects. Landsc. Urban Plan. 2017, 168, 94–116. [Google Scholar] [CrossRef]
  31. Liang, X.; Guan, Q.; Clarke, K.C.; Liu, S.; Wang, B.; Yao, Y. Understanding the drivers of sustainable land expansion using a patch-generating land use simulation (PLUS) model: A case study in Wuhan, China. Comput. Environ. Urban Syst. 2021, 85, 101569. [Google Scholar] [CrossRef]
  32. Rasmussen, L.V.; Rasmussen, K.; Reenberg, A.; Proud, S. A system dynamics approach to land use changes in agro-pastoral systems on the desert margins of Sahel. Agric. Syst. 2012, 107, 56–64. [Google Scholar] [CrossRef]
  33. Turner, B.L.; Lambin, E.F.; Reenberg, A. The emergence of land change science for global environmental change and sustainability. Proc. Natl. Acad. Sci. USA 2007, 104, 20666–20671. [Google Scholar] [CrossRef] [PubMed]
  34. Verburg, P.H. Simulating feedbacks in land use and land cover change models. Landsc. Ecol. 2006, 21, 1171–1183. [Google Scholar] [CrossRef]
  35. Huang, X.; Liu, J.; Peng, S.; Huang, B. The impact of multi-scenario land use change on the water conservation in central Yunnan urban agglomeration, China. Ecol. Indic. 2023, 147, 109922. [Google Scholar] [CrossRef]
  36. Wang, J.; Zhang, J.; Xiong, N.; Liang, B.; Wang, Z.; Cressey, E.L. Spatial and temporal variation, simulation and prediction of land use in ecological conservation area of Western Beijing. Remote Sens. 2022, 14, 1452. [Google Scholar] [CrossRef]
  37. Yao, J.; Yang, Q.; Chen, Y.; Hu, W.; Liu, Z.; Zhao, L. Climate change in arid areas of Northwest China in past 50 years and its effects on the local ecological environment. Chin. J. Ecol. 2013, 32, 1283. [Google Scholar]
  38. Li, H.; Li, Z.; Chen, Y.; Xiang, Y.; Liu, Y.; Kayumba, P.M.; Li, X. Drylands face potential threat of robust drought in the CMIP6 SSPs scenarios. Environ. Res. Lett. 2021, 16, 114004. [Google Scholar] [CrossRef]
  39. Li, P.; Zhang, R.; Xu, L. Three-dimensional ecological footprint based on ecosystem service value and their drivers: A case study of Urumqi. Ecol. Indic. 2021, 131, 108117. [Google Scholar] [CrossRef]
  40. GB/T21010-2017; Current Land Use Classification. National Standards of People’s Republic of China: Beijing, China, 2017.
  41. Li, M.; Luo, H.; Qin, Z.; Tong, Y. Spatial-Temporal Simulation of Carbon Storage Based on Land Use in Yangtze River Delta under SSP-RCP Scenarios. Land 2023, 12, 399. [Google Scholar] [CrossRef]
  42. Zhang, L.; Chen, X.; Xin, X. Short commentary on CMIP6 scenario model intercomparison project (ScenarioMIP). Adv. Clim. Chang. Res. 2019, 15, 519. [Google Scholar]
  43. Fan, M. Simulation of land cover change in Beijing-Tianjin-Hebei region based on different scenarios of SSP-RCP. Acta Geogr. 2022, 77, 228–244. [Google Scholar]
  44. Guo, H.; Cai, Y.; Li, B.; Tang, Y.; Qi, Z.; Huang, Y.; Yang, Z. An integrated modeling approach for ecological risks assessment under multiple scenarios in Guangzhou, China. Ecol. Indic. 2022, 142, 109270. [Google Scholar] [CrossRef]
  45. Men, D.; Pan, J. Ecological network identification and connectivity robustness evaluation in the Yellow River Basin under a multi-scenario simulation. Ecol. Model. 2023, 482, 110384. [Google Scholar] [CrossRef]
  46. Li, D.; Chang, Y.; Simayi, Z.; Yang, S. Multi-Scenario dynamic simulation of urban agglomeration development on the Northern Slope of the Tianshan Mountains in Xinjiang, China, with the goal of high-quality urban construction. Sustainability 2022, 14, 6862. [Google Scholar] [CrossRef]
  47. Mo, W.; Wang, Y.; Zhang, Y.; Zhuang, D. Impacts of road network expansion on landscape ecological risk in a megacity, China: A case study of Beijing. Sci. Total Environ. 2017, 574, 1000–1011. [Google Scholar] [CrossRef] [PubMed]
  48. Ran, P.; Hu, S.; Frazier, A.E.; Qu, S.; Yu, D.; Tong, L. Exploring changes in landscape ecological risk in the Yangtze River Economic Belt from a spatiotemporal perspective. Ecol. Indic. 2022, 137, 108744. [Google Scholar] [CrossRef]
  49. Zhao, Y.; Kasimu, A.; Liang, H.; Reheman, R. Construction and restoration of landscape ecological network in Urumqi city based on landscape ecological risk assessment. Sustainability 2022, 14, 8154. [Google Scholar] [CrossRef]
  50. Zhang, W.; Chang, W.J.; Zhu, Z.C.; Hui, Z. Landscape ecological risk assessment of Chinese coastal cities based on land use change. Appl. Geogr. 2020, 117, 102174. [Google Scholar] [CrossRef]
  51. Wang, H.; Liu, X.; Zhao, C.; Chang, Y.; Liu, Y.; Zang, F. Spatial-temporal pattern analysis of landscape ecological risk assessment based on land use/land cover change in Baishuijiang National nature reserve in Gansu Province, China. Ecol. Indic. 2021, 124, 107454. [Google Scholar] [CrossRef]
  52. Liu, Y.; Liu, Y.; Li, J.; Lu, W.; Wei, X.; Sun, C. Evolution of landscape ecological risk at the optimal scale: A case study of the open coastal wetlands in Jiangsu, China. Int. J. Environ. Res. Public Health 2018, 15, 1691. [Google Scholar] [CrossRef]
  53. Lockwood, J. Is potential evapotranspiration and its relationship with actual evapotranspiration sensitive to elevated atmospheric CO2 levels? Clim. Chang. 1999, 41, 193–212. [Google Scholar] [CrossRef]
  54. Mondal, S. Impact of climate change on soil fertility. In Climate Change and the Microbiome: Sustenance of the Ecosphere; Springer: Cham, Switzerland, 2021; pp. 551–569. [Google Scholar]
  55. Cassia, R.; Nocioni, M.; Correa-Aragunde, N.; Lamattina, L. Climate change and the impact of greenhouse gasses: CO2 and NO, friends and foes of plant oxidative stress. Front. Plant Sci. 2018, 9, 273. [Google Scholar] [CrossRef] [PubMed]
  56. Wei, T.; Shangguan, D.; Yi, S.; Ding, Y. Characteristics and controls of vegetation and diversity changes monitored with an unmanned aerial vehicle (UAV) in the foreland of the Urumqi Glacier No. 1, Tianshan, China. Sci. Total Environ. 2021, 771, 145433. [Google Scholar] [CrossRef]
  57. Ma, Z.; Sun, P.; Zhang, Q.; Zou, Y.; Lv, Y.; Li, H.; Chen, D. The characteristics and evaluation of future droughts across China through the CMIP6 multi-model ensemble. Remote Sens. 2022, 14, 1097. [Google Scholar] [CrossRef]
  58. Fan, X.; Duan, Q.; Shen, C.; Wu, Y.; Xing, C. Global surface air temperatures in CMIP6: Historical performance and future changes. Environ. Res. Lett. 2020, 15, 104056. [Google Scholar] [CrossRef]
  59. Sun, L.; Yu, H.; Sun, M.; Wang, Y. Coupled impacts of climate and land use changes on regional ecosystem services. J. Environ. Manag. 2023, 326, 116753. [Google Scholar] [CrossRef] [PubMed]
  60. Liu, H.; Liu, Y.; Wang, C.; Zhao, W.; Liu, S. Landscape pattern change simulations in Tibet based on the combination of the SSP-RCP scenarios. J. Environ. Manag. 2021, 292, 112783. [Google Scholar] [CrossRef]
  61. Li, W.; Wang, Y.; Xie, S.; Sun, R.; Cheng, X. Impacts of landscape multifunctionality change on landscape ecological risk in a megacity, China: A case study of Beijing. Ecol. Indic. 2020, 117, 106681. [Google Scholar] [CrossRef]
Figure 1. Overview of the study area.
Sustainability 15 14214 g001
Figure 2. Research framework.
Sustainability 15 14214 g002
Figure 3. SD model of land use demand in Urumqi and its subsystem division. (A) SD model. (B) SD model subsystem: (a) economic subsystem; (b) land subsystem; (c) climate subsystem; (d) population subsystem.
Sustainability 15 14214 g003
Figure 4. Actual and simulated spatial distribution results of land use in Urumqi City in 2020.
Sustainability 15 14214 g004
Figure 5. Change trajectories of land use demand under three SSP-RCP scenarios in Urumqi.
Sustainability 15 14214 g005
Figure 6. Spatial distribution patterns of land use under three SSP-RCP scenarios in Urumqi. (a) SSP126-2030; (b) SSP126-2040; (c) SSP126-2050; (d) SSP126-2060; (e) SSP245-2030; (f) SSP245-2040; (g) SSP245-2050; (h) SSP245-2060; (i) SSP585-2030; (j) SSP585-2040; (k) SSP585-2050; (l) SSP585-2060; (m) 2020.
Sustainability 15 14214 g006
Figure 7. Transfers of land use types under three SSP-RCP scenarios in Urumqi. Note: Different colors in the outermost circle correspond to different land use types, and the inner color shifts reflect the transfer of each land use type.
Sustainability 15 14214 g007
Figure 8. Spatial distribution of landscape ecological risk under three SSP-RCP scenarios in Urumqi. (a) SSP126-2030; (b) SSP126-2040; (c) SSP126-2050; (d) SSP126-2060; (e) SSP245-2030; (f) SSP245-2040; (g) SSP245-2050; (h) SSP245-2060; (i) SSP585-2030; (j) SSP585-2040; (k) SSP585-2050; (l) SSP585-2060; (m) 2020.
Sustainability 15 14214 g008
Figure 9. Area of risk zones at different levels under three SSP-RCP scenarios in Urumqi.
Sustainability 15 14214 g009
Figure 10. Landscape ecological risk transfer under three SSP-RCP scenarios in Urumqi.
Sustainability 15 14214 g010
Table 1. Scenarios description.
ScenariosDescription
SSP126This scenario is a combination of SSP1 and RCP2.6 and represents a low-GHG-emitting sustainable development scenario with significant land use change [42]. In it, the global average temperature in 2100 will not increase by more than 2 °C relative to pre-industrial levels, and the radiative forcing will stabilize at 2.6 W/m2.
SSP245This scenario is a combination of SSP2 and RCP4.5 and represents a medium development scenario with moderate GHG emissions, which is representative of maintaining the current rate of socio-economic development and level of scientific and technological development [43]. It shows a global average temperature increase of 2–3 °C in 2100 relative to pre-industrial levels and a stable radiative forcing of 4.5 W/m2.
SSP585This scenario is a combination of SSP5 and RCP8.5 and indicates a fast-track development scenario with high GHG emissions (large-scale use of conventional fossil fuels). Under this scenario, the global average temperature in 2100 will rise by more than 4 °C relative to pre-industrial levels, and the radiative forcing will be as high as 8.5 W/m2. SSP5 is the only shared socio-economic pathway that enables radiative forcing up to 8.5 W/m2 [42].
Table 2. SD model accuracy test.
Land Use TypeSimulated Value in 2020 (km2)Actual Value in 2020 (km2)Relative Error (%)
Cultivated land668.10641.554.14%
Woodland574.10560.802.37%
Grassland6776.006875.58−1.45%
Water293.40288.051.86%
Construction land413.70421.24−1.79%
Unused land5069.005007.301.23%
Note: The relative error is calculated as relative error = (simulated value − actual value)/actual value.
Table 3. Parameter settings for different SSP-RCP scenarios.
Parameter TypeRGG (%)RPG (%)TC (°C)PC (mm)RV (mm)VC (%)
2020–2030SSP12644.866.10.59−14.23−1.140.002
SSP24541.468.310.48−6.157.390.050
SSP58545.96.890.715.067.74−0.006
2030–2040SSP12639.044.630.38−2.05−10.180.001
SSP24537.996.790.8319.7712.1−0.053
SSP58544.255.510.93−12.45−6.40.000
2040–2050SSP12629.682.70.43−5.418.290.000
SSP24535.425.710.46−1.67−16.04−0.039
SSP58538.523.530.843.0420.020.000
2050–2060SSP12617.210.850.1415.110.24−0.001
SSP24521.964.470.62−8.36−2.88−0.046
SSP58528.051.740.668.35−14.550.000
Note: RGG: annual rate of GDP growth; RPG: annual rate of population growth; TC: annual average surface temperature change; PC: annual precipitation change; RC: annual runoff change; VC: annual average vegetation coverage change.
Table 4. Calculation formulas and significance of landscape indexes.
IndexFormulaMeaning of Formulas and Description of Parameters
Landscape fragmentation ( F i ) F i = N i A i Indicates the fragmentation and instability of landscape patches in a certain space–time, where N i is the number of patches of a landscape type and A i is the total area of a landscape type.
Landscape Separation ( S i ) S i = 1 2 × N i A × A A i Reflects the individual dispersion of landscape patches, where A is the total area of the region.
Landscape fractal dimension ( F D i ) F D i = 2 ln ( P i 4 ) ln A i Measures the complexity of morphological changes when landscape patches are disturbed, where Q i is the number of samples in which patch i occurs/total number of samples, M i is the number of patch i/total number of patches, and L i is the area of patch i/total area of samples.
Landscape disturbance ( D i ) D i = a F i + b S i + c F D i Reflects the resistance of the landscape to the disturbance of external factors, where a , b , and c are the weights of F i , S i , and F D i , respectively, based on previous studies and expert opinions [52], and a , b , and c are set to 0.5, 0.3, and 0.2, respectively.
Landscape vulnerability ( V i )Set up according to actual situation of the local landscape.Reflects the sensitivity and vulnerability of the landscape to the disturbance of external factors. Referring to related studies and combining with the actual situation of Urumqi [50], the values of unused land, water, cultivated land, grassland, woodland, and construction land are given, respectively, as 6, 5, 4, 3, 2, and 1, and normalized.
Table 5. Areas of land use demand under three SSP-RCP scenarios in Urumqi.
Land Use Type2020SSP126SSP245SSP585
203020402050206020302040205020602030204020502060
Cultivated land (km2)641.6560.7467.2395.1344.5554.2447.8355.2283.7552.9436.8326.3231.5
Woodland (km2)560.8602.8626.9652.4680.3600.3618.1633.2646.8600.6610.9613.5609.1
Grassland (km2)6875.66509.16495.46750.67280.36509.16402.26556.46958.16537.56417.26582.67010.3
Water (km2)288.1308.4321.1330.7337.3309.5324.9338.7350.3309.2326.1343.1359.4
Construction land (km2)421.2538.2628.6680.6690.6550.6668.9765.7827.7555.8699.6842.8964.4
Unused land (km2)5007.35275.35256.44986.14461.35270.15332.1514547285240.55303.75086.24620.1
Disclaimer/Publisher’s Note: The statements, opinions and data contained in all publications are solely those of the individual author(s) and contributor(s) and not of MDPI and/or the editor(s). MDPI and/or the editor(s) disclaim responsibility for any injury to people or property resulting from any ideas, methods, instructions or products referred to in the content.

