Article

Dry Sanitation Technologies: Developing a Simplified Multi-Criteria Decision Analysis Tool

by
Margarida Fidélis Santos
1,*,
Carolina Pires Castro
1,
Rita Ventura Matos
2,
Liliana Alves
1,3 and
José Saldanha Matos
1,2
1
Civil Engineering Research and Innovation for Sustainability (CERIS), Instituto Superior Técnico, Universidade de Lisboa, Av. Rovisco Pais 1, 1049-001 Lisboa, Portugal
2
Hidra, Hidráulica e Ambiente, Av. Defensores de Chaves, 31–1° Esq., 1000-111 Lisboa, Portugal
3
National Water Directorate (DNA) of Angola, Condominium Dolce Vita, Building 1D, 6th Floor, Luanda, Angola
*
Author to whom correspondence should be addressed.
Sustainability 2023, 15(19), 14155; https://doi.org/10.3390/su151914155
Submission received: 29 July 2023 / Revised: 14 September 2023 / Accepted: 19 September 2023 / Published: 25 September 2023
(This article belongs to the Section Sustainable Urban and Rural Development)

Abstract

:
Safely managed sanitation is indispensable for societies to ensure public health, environmental protection, and economic and social development. This could be achieved, in large areas of the world, through dry sanitation systems. Dry sanitation systems are especially used in water-scarce regions and low-income households. In dense peri-urban areas, the achievement of safe sanitation necessitates a comprehensive fecal sludge management (FSM) service chain, surpassing the mere provision of latrines. This research introduces an automatic Multi-Criteria Decision Analysis (MCDA) approach, which focuses on the particular interface/storage stage of the FSM service chain. The tool aims to support the decision-making process and may be especially useful in the early stages of sanitation planning as it compares different technologies with potential application in low-income countries. It includes different criteria and parameters for the Social, Economic, Technical, and Environmental dimensions of dry sanitation options (SETEds), being adaptable to different contexts and to different priorities. The main key strengths of the tool were found to be its minimal data requirements and ability to customize operation and maintenance cost parameters. These features are particularly relevant in data-scarce contexts, where traditional models may lead to unreliable recommendations or lack of solution ownership by users. The tool was applied to the Ambriz case study, a coastal town in Northern Angola, in West Africa. The obtained results are analyzed and show the tool’s application provides technology recommendations aligned with the site and community characteristics.

1. Introduction

1.1. General Aspects

Improved sanitation facilities are defined as systems that hygienically separate excreta from human contact. Safely managed sanitation implies improved facilities that are not shared, and where excreta is safely disposed of in situ or removed and treated elsewhere [1]. By 2020, 54% of the world’s population had access to safely managed sanitation services, yet 6% still practiced open defecation, a behavior explicitly targeted for eradication under the scope of the Sustainable Development Goal 6, Sanitation and water for all. The highest incidence of open defecation is in sub-Saharan Africa and in South and Central Asia [1]. Although these numbers represent progress consistent with previous years, they also highlight the need for a wider and faster expansion of safely managed sanitation services.
The year of 2020 was the first year that the percentage of the world population served by onsite systems was higher than the percentage of population served by sewered sanitation, with the onsite services growth coming mostly from rural areas. From 2000 to 2020, the rate of sewered solutions increased 0.51% per year, while onsite sanitation rate (measured by the sum of the individual increasing rates of septic tanks (0.46%) and improved latrines (0.25%)) increased by 0.71%. Additionally in 2020, 34% of the people with access to safely managed sanitation services had it through sewered sanitation, while 20% had it through on-site sanitation [1].
However, focusing on the particular situation of Sub-Saharan Africa, Central and Southern Asia, and Oceania, onsite sanitation is more common than sewered sanitation, even in urban areas. In urban areas, septic tanks are increasing at a rate of 0.24% per year and dry pit latrines by 0.06%, while sewers are increasing by 0.14% [1].
This paper presents a decision support tool entitled SETEds, standing for Social, Economic, Technical, and Environmental dimensions of dry sanitation (ds) solutions. The primary purpose of the tool is to assist in infrastructure planning by offering a systematic comparison of various sanitation technologies tailored to different areas within the city. This is particularly relevant since low-income urban and peri-urban areas often exhibit considerable variations in factors such as per capita water consumption, population density, financial resources, energy availability, communication infrastructure, road quality, and accessibility. SETEds is specifically designed to aid in the selection of technologies for the user interface and containment both within and during the pre-treatment stages of the fecal sludge management service chain. Nonetheless, it is important to keep in mind that in most urban situations, only a complete service chain can provide safely managed sanitation, i.e., the full sequence of the chain, namely user interface, containment and pre-treatment, emptying and transport, and treatment and reuse/disposal. To ensure an optimal functionality of the service chain and avoid health problems, it is important that the connections between the several stages are robust and well managed. Examples of poor connection problems are pit emptying fees that are unaffordable or misadjusted to the community’s willingness to pay, failing to avoid unsafe emptying practices by the user, or the existence of emptying services but not of a treatment station, leaving sludge to be unsafely discharged into the environment [2,3]. To illustrate the functioning of the SETEds tool and to create a basis for discussion, the Ambriz case study results, a coastal village of Northern Angola, are presented and discussed.
The economic dimension of the different options is of the utmost importance for decision making. In fact, the highest incidence of open defecation and lack of safely managed sanitation is in low-income and lower-middle-income countries, making costs a tipping point for the sustainability of the solution. In this context, particular importance is given to investment and operation and maintenance (O&M) costs of different available dry-sanitation technologies.

1.2. Decision Support Tools and Investments and O&M Costs

In this section, existing decision support tools for sanitation systems are briefly described. eCompendium, by Emersan, is an online decision support tool that aims to provide a systematic compilation of all relevant sanitation technologies with the objective of supporting the sanitary response to emergency situations [4]. Several filters are available for the user to screen the technologies. Then, a list is provided of those that comply with the context described through the filters. It considers both dry and water-based systems and has a total of 61 technologies distributed by the five steps of the sanitation service chain. The output is a set of five lists with possible suitable technologies, one for each step of the service chain. Creating a viable sequence is left to the user [4].
Spuhler et al. [5] developed a software named Santiago (sanitation systems alternative generator), whose main output is a set of sanitation system options that are locally appropriate [5]. The appropriateness of each sanitation system is classified from 0 to 100%. It aims to ease the comparison between the very large number of combinations that are possible between the different technologies for each step of the service chain. Its algorithm firstly selects a set of appropriate sanitation technologies from the database, according to a list of criteria meant to be defined in workshops with the local stakeholders of each project. The database is an editable table that is directly read by the algorithm, so that any new technology can be added to it, to respond to the fast emerging of new sanitation technologies. Secondly, the algorithm creates possible and viable combinations of sanitation technologies to create conceivable sanitation service chains. Then, it selects the desired number of alternatives and quantifies resource recovery potentials and nutrient, organics, energy, and water emissions. According to [5], Santiago’s outputs provide decision makers with a reliable and manageable number of options to decide from, eventually facilitating the multi-criteria analysis process.
Bouhabid and Louis [6] developed a decision tool in Microsoft Access software that can be used for water supply, sanitation, or municipal solid waste systems. The user is asked input questions regarding institutional, technical, environmental, economic, energy, and human resources characteristics to allow the algorithm to determine the Community Capacity Level (CCL), the metric that assesses a community’s system management ability, and the Regional Specificities (RS)—which are the natural characteristics of the region. The tool has a database of technologies based on reference success cases which are classified according to the Required management Capacity Level (CRL) that a particular technology requires from a community. The algorithm compares the CCL with the CRL, and the technologies that verify the condition CCL higher than CRL are eligible as recommendations. After the comparison of CCL with CRL, the algorithm checks the RS of the potential solutions (CCL higher than CRL) to select only those that match the RS. The final output of Bouhabid and Louis’ tool [6] is a set of technology options that are suitable to the community and to the region. It is the decision-makers’ responsibility to compare them and make the final selection.
FSMtoolbox is an online available decision support tool funded by the Bill and Melinda Gates Foundation and developed in a partnership between the Asian institute of technology and Vienna university [7]. FSMtoolbox provides two types of decision support: assessment and planning. The assessment tool creates a picture of the city to identify the main issues; it starts with a detailed questionnaire to be filled with data regarding how fecal sludge is being dealt within the city. The questionnaire includes questions about the city service delivery. The user is asked to classify the toilets, emptying and transport, and treatment and reuse, with 0, 0.5, or 1 quotation regarding enabling, developing, and sustainable factors. With the collected information, a graphic visualization of the state of FSM in the city is created, assigning red, yellow, or green to each of the topics. The tool presents three options: Stakeholder engagement plan, Infrastructure planning (citywide or regional), and Business model selection. Only Infrastructure planning will be further described since the other planning tools are outside the scope of this paper. In another questionnaire, questions are presented about the city’s demography (namely total population, number of households, population growth rate, men and women ratio) and environmental characteristics, such as flood risk, type of soil, groundwater table depth, existing sanitation infrastructures, type of desludging methods, and existence of treatment plants, among others. The outputs show the user which technology is recommended, how many are needed and, with an integrated GIS analysis, where they should be located in the city map [7].
The SETEds tool was derived from SETA, a decision support tool described in Matos et al. [8] for the selection of the type of wastewater treatment plant, fecal sludge treatment plant, and/or co-treatment plant, to treat both wastewater and fecal sludge. SETA considers different treatment alternatives, e.g., sequences of unit operations and processes capable of accomplishing full treatment, by carrying on a multicriteria decision analysis. SETA takes into consideration criteria from the Social (S), Economic (E), Technical (T), and Environmental (A, Ambiental, in Portuguese) dimensions, whose weights are adapted to the user/decision maker’s priorities. SETA first applies exclusion criteria to shorten the possible treatment alternatives list to the ones that are suitable to the context (according to user objective, e.g., wastewater treatment plant (WWTP) or fecal sludge treatment plant (FSTP), compliance of treatment efficiencies with legal discharge requirements, suitability to population size and design flows, among others. Following this first selection step, it performs an evaluation of each suitable treatment alternative, scoring each one in each criterion of the four dimensions. Subsequently, it calculates a weighted average of the criteria scores for each treatment alternative that results in a final score. The treatment alternative with the higher final score is recommended. SETEds follows a similar approach.
SETEds is a simplified tool that requires relatively little data and provides automatic multi-criteria dimensional analysis for different dry sanitation technologies. The tool compares the different options, highlighting a recommended one among a list of possibilities. A final score ranks each of the possible technologies and allows the user to have a concise picture of its performance. As SETA does, the tool considers the following dry sanitation containment options: Improved Single Pit (ISP), Single Ventilated Improved Pit (SVIP), Double Ventilated Improved Pit (DVIP), Fossa Alterna (FA), and Container-Based Toilet (CBT). Examples of Single VIPs are presented in Figure 1.
Detailed explanations of the different dry sanitation options can be found in references [2,9,10,11]. Nonetheless, a brief description for each alternative considered in SETEds is presented, based on the findings of those authors. An improved single pit is a pit dug on the ground for the excreta to fall in after the toilet is used. It must have a proper slab to ensures separation of excreta from human contact.
VIP stands for Ventilated Improved Pit, which is an improvement comparing to the Improved single pit as it works in the same way, but in the case of the single VIP, there is a specific ventilation channel for the odors and flies to escape the pit. The Double VIP is, as the name implies, a technology constituted by two ventilated improved pits. The superstructure where the user interface is placed changes from one pit to the other, staying in the pit that is filling while the filled pit is draining, degrading, and reducing volume.
The Fossa Alterna technology consists of a double pit with alternating use. When one pit is filling, the other is full, and the excreta is degrading, which can then be removed manually, just like in the Double VIP technology. The difference between the Double VIP and Fossa Alterna is that the Fossa Alterna is designed to produce compost/ecohumus, while the main purpose of the Double VIP is to collect the excreta and, only if possible, reuse the content after it has rested in the full pit. The Fossa Alterna pits are shallow pits with around 1.5 m depth.
The Fec is a toilet, most of the time urine-diverting, that stores the excreta in containers that are sealable and removable on a regular basis. The containers are above ground, one for the urine and another for the feces, both inside the structure of the toilet. It requires a collection team that goes door to door, swapping the full containers for empty ones.
Advantages and setbacks of SETEds will be highlighted across the paper and analyzed with more detail in the discussion section.

1.3. Investment and Operation and Maintenance Costs

In this section, a framing of available references for investment, and operation and maintenance costs are analyzed. Rosling et al. [12] and The World Bank divide countries into four income levels: low-income countries, lower-middle income countries, upper-middle income countries, and high-income countries. It is in low-income and lower-middle-income countries (respectively, less than 1.085 and less than 4.255 USD/day/person, for 2022–2023 [13]), mostly located in sub-Saharan Africa, that a major lack in safely managed sanitation and higher incidences of open defecation take place [2,9]. This is where adequate dry sanitation technologies can yield more benefit, as they will remain serving millions of people in water-scarce and low-income regions, at least in the short and medium term.
The primary source of funding for sanitation services comes mostly from households. From 18 countries analyzed in the State of the World Sanitation Report [14] regarding investment in sanitation, on average, households were the main source, through tariffs and self-supply expenditures on own facilities. Households provided 68% of the funding, followed by governments with 19%. Around 80% of the countries did not have enough funding to meet the national targets on sanitation.
The World Health Organization (WHO) recently released the Water Global Analysis and Assessment of Sanitation and Drinking-Water (GLAAS) Report [15], which includes data from 121 countries. The report aims to provide critical evidence on the status of Water, Sanitation, and Hygiene (WASH) systems worldwide, including financial expenditures. Of the surveyed countries, the lowest WASH budgets per capita are found in Nigeria, Ethiopia, and Indonesia, with less than USD 3 per capita. On the other end of the range, the countries with higher WASH budgets per capita are Kuwait (USD 386), Croatia (USD 149) and Uruguay (USD 144). Out of the 44 African countries surveyed, Comoros and Tunisia were the only ones to report having over 75% of the necessary financial resources to achieve their sanitation targets, encompassing both urban and rural areas. On the other hand, Cape Verde, Malawi, Nigeria, and Senegal indicated possessing between 50 and 75% of the required financial resources for both urban and rural sanitation. However, most of the surveyed African countries had less than 50% of the necessary funding allocated for improving sanitation in both urban and rural regions [16].
In addition, despite many countries indicating that tariff reviews are performed every 1–2 years, and with most reviews being performed at least once every 5 years, less than half of responding countries indicated that user tariffs are sufficient to recover at least 80% of O&M costs.
In financing sanitation services, there are three mainly known sources, collectively referred to as “the 3Ts”: taxes, transfers and tariffs. Taxes allow governments to allocate money for sanitation investments; transfers come from external donors, and tariffs are the price (fees) the user pays for the sanitation service. It is a relevant practice to set tariffs high enough to cover at least the O&M costs, but low enough to be affordable and aligned with people’s willingness to pay [3,5].
Therefore, to allow for better planning, more and better organized information about dry sanitation costs and its impacts, from the perspective of the user, is needed. The sources found, as well as the mentioned values for costs, are presented in Table 1, in USD and in prices referring to the year of reference. It is important to note that these prices are not yet updated to the year of 2022, considering the respective cumulative inflations. This will be presented further in the paper.

2. Materials and Methods

2.1. Overview of the SETEds Tool

The SETEds tool starts with an initial form to be filled in by the user, where relevant environmental and socio-economic characteristics of the local context are provided by the user, as well as the weights of the tool’s dimensions, according to the priorities of the user. The code is divided in three sections. First, the exclusion criteria are applied to create a selection of eligible technologies. Eligible technologies are those which installation is viable and functional, according to defined criteria. Second, the evaluation criteria are applied to the remaining options. The evaluation purpose is to compare the technologies among the eligible ones, to find the one that better suits the community. The evaluation criteria are organized into four groups: Social, Economic, Technical, and Environmental. The Social dimension may be especially important since public health is the main priority of safe sanitation. In addition, cultural aspects should be considered while planning, otherwise there is the risk of failure due to lack of use of the infrastructures. Regarding the economic dimension, both investment costs and long-term costs with O&M are crucial to the project’s sustainability. Technical dimension is indispensable to ensure viability and proper operation of the sanitation technology. Similarly, the Environmental dimension aims to ensure protection of receiving bodies, being soil or water, right from the planning stage. Each technology is scored in each evaluation criterion, from one to five. Some criteria have fixed scores for each specific technology if the technology’s performance depends only on its own nature and not on the local context. Other criteria have variable scores, if the technology’s performance depends on the verification of certain conditions that, in turn, depend on the user inputs about the local context. Third, the tool computes, for each technology, the mean scores across each SETEds group of criteria, thereby generating a score for each of the four dimensions. The tool calculates a weighted average for each technology using the scores and user-provided weights. Subsequently, the technology with the highest score among the eligible options is recommended as the most suitable choice by the SETEds tool.

2.2. SETEds Input Form

The input form requires the user to provide information about the community, including cultural perspectives regarding biosolids reuse, the local environment, and the SETEds weights. SETEds weights refer to the importance of each dimension in the decision-making process. These weights are then reflected in the coefficients assigned to the scores of each dimension when calculating the weighted average for the final score of each technology. Default values are suggested for some parameters, such as investment and O&M costs of each technology, which are of course allowed to be changed by the user. The purpose of the input form is to gather information from the local context, in order to allow for a personalized analysis. This is essential, since different communities have different socio-economic characteristics and different receptivity to sanitation technologies or to biosolids reuse methods. These factors will impact market demand, which, in turn, plays a vital role in income generation and the financial sustainability of the sanitation services. Furthermore, it is important to take into account all the site physical characteristics, as well as the stakeholders and decision-makers’ priorities, which may vary across different communities, regions, and throughout the infrastructure’s lifespan.

2.3. SETEds Exclusion Criteria

The exclusion criteria considered by the SETEds tool are the following:
C1—Groundwater table depth—technologies that require deep excavation (all of them except Container-Based Toilets) are excluded when the vertical distance to the water table is lower than 3 m, in any period of the year. Under those circumstances, there exists a tangible risk to public health, leading to potential disease outbreaks through the contamination of drinking water sources [23]. Additionally, environmental health may also be at risk [24,25]. This criterion aims to account for minimizing those unwanted situations (Table 2).
C2—Flooding risk—evaluated through the flood return period. This criterion leads to the exclusion of all technologies except CBT when the return period of floods at the selected site is equal to or less than 7 years, to minimize the risks of the fecal sludge overflows from existing sanitation solutions, which would lead to the dissemination of pathogens and pose serious public health risks (Table 3).
C3—Space availability—which excludes technologies that require implementation areas larger than the available space (Table 4).
C4—Low population density—FA and DVIP options are excluded when population density is less than 30 inhabitants per hectare. In the case of low population densities, typically rural areas, there is, in general, enough space available to excavate new pit latrines when the ones in use become full. Since single pit latrines are more economical than double latrines, such as FA or DVIP, it is not a current practice to use the more expensive options in areas with a very low population density. This criterion also excludes ISP from areas with more than 30 inhabitants per hectare (Table 5).
C5—Feasibility of sludge emptying and transportation—its applicability depends either on the user’s preference for on-site or off-site management, and the characteristics of the local context, namely the distance to the closest Fecal Sludge Transfer Station (FSTS) or FSTP. This criterion results in the possible exclusion of technologies that require collection, transport, and further offsite treatment of fecal sludge, namely CBT, and, in some circumstances, SVIP. In the latter case, it should be excluded only if population density is higher than 30 inhabitants per hectare, because otherwise emptying and transportation services would be not required. In densely populated areas that sludge transport vehicles cannot access, alternatives to technologies that rely on offsite management include FA and DVIP, since those require emptying only when the sludge is partially sanitized and therefore posing less risk (Table 6).
The thresholds set in the criteria were derived either from international references or from co-authors experience gathering in sanitation projects for African countries, with the adopted criteria discussed with local stakeholders. The value 3 m in C1 was adopted from [26]. The value 500 m in C5 and the minimum areas for implementation in C3 were derived from [9]. The values 7 years in C2, 30 inhabitants/ha in C4, and 3000 m in T1 were the result of the co-authors’ experience in developing sanitation projects in Sub-Saharan Africa [24,25,27,28].

2.4. SETEds Evaluation Criteria

The scoring of technologies is performed through one of two possible paths. In certain criteria, where the score depends solely on the inherent characteristics of the technology, fixed scores are assigned. For instance, concerning criterion S1, which assesses odor potential, ISP will lead to more issues and risks of offensive odors release compared to CBT, just due to the nature of the solution. Consequently, the ISP score is 1 while the CBT score is 5, independently of the context. On the other hand, for other criteria, like A1, evaluating groundwater contamination risk, scores are dependent on the verification of specific conditions, which vary with the user inputs. A1 depends on soil type and groundwater table depth. For all criteria, the respective solutions and fixed scores are presented in Table 7, Table 8, Table 9, Table 10, Table 11, Table 12 and Table 13.
The tool proposed evaluation criteria are as follows:
For the social dimension:
S1—Odor potential
S2.1—Health risks: safe self-emptying (risk of contact between feces and personnel)
S2.2—Health risks: flies and mosquito potential
S3—Potential for entrepreneurship and employment (through biosolids reuse)
Table 7. Assigned scores in criterion S2.1.
Technology Score in Criterion S2.1
Improved Single Pit; Single VIPPopulation density > 30 inhab/ha1
Population density < 30 inhab/ha5
Double VIP 3
Fossa Alterna;
Container-Based Toilet
4
For the economic dimension:
E1—Investment costs (based on the tool default values or the ones provided by the user)
E2—O&M costs (based on the tool default values or the ones provided by the user)
E3—Potential economic benefits: Income with sub-products (e.g., urine or biosolids)
Table 8. Assigned scores in criteria S3, E3, and A3 (for these three criteria the value tree is similar).
Technology Score in Criteria S3, E3 and A3
Improved Single Pit; Single VIP 1
Double VIPNo compost reuse acceptance 1
Compost reuse acceptance 2
Fossa AlternaNo compost reuse acceptance 1
Compost reuse acceptance 3
Container-Based
Toilet
Compost reuse acceptanceurine reuse acceptance5
no urine reuse acceptance4
No compost reuse acceptanceurine reuse acceptance4
no urine reuse acceptance1
For the technical dimension:
T1—Vicinity to the FSTS or to an FSTP
T2—Complexity and difficulties of construction
T3—Complexity of O&M activities
Table 9. Assigned scores in criterion T1.
Technology Score in Criterion T1
Improved Single Pit;
Single VIP
Population density
> 30 inhab/ha
Manual transportCloser to 500 m to the FSTS/FSTPCloser to 1
Closer to 0 m to the FSTS/FSTPCloser to 5
Mechanical transportCloser to 3000 m to the FSTS/FSTPCloser to 1
Closer to 0 m to the FSTS/FSTPCloser to 5
Population density
< 30 inhab/ha
5
Double VIP;
Fossa Alterna
5
Container-Based Toilet Manual transportCloser to 500 m to the FSTS/FSTPCloser to 1
Closer to 0 m to the FSTS/FSTPCloser to 5
Mechanical transportCloser to 3000 m to the FSTS/FSTPCloser to 1
Closer to 0 m to the FSTS/FSTPCloser to 5
Table 10. Assigned scores in criterion T2.
Technology Score for the Variable Parcel for Criterion T2
Improved Single Pit; Single VIP;
Double VIP;
Fossa Alterna
Soil5
Soft rock3
Hard rock1
Container-Based Toilet -
Table 11. Assigned scores in criterion T3.
Technology Score for the Variable Parcel for Criterion T3
Double VIPConstant sources of cover material5
No constant sources of cover material2
Fossa Alterna;
Container-Based Toilet
Constant sources of cover material5
No constant sources of cover material1
Improved Single Pit;
Single VIP
1
For environmental dimension:
A1—Risk of groundwater contamination
A2—Risk of soil contamination
A3—Potential for safe resource recovery
Table 12. Assigned scores in criteria A1 and A2.
TechnologyPermeabilityScore for the Criteria A1 and A2
Improved Single Pit; Single VIP;
Double VIP;
Fossa Alterna
Gravel (K > 10−3 m/s)1
Sand (10−5 m/s < K < 10−3 m/s)2
Silt (10−9 m/s < K < 10−5 m/s)3
Clay (K < 10−9 m/s)4
Container-Based Toilet 5
Regarding fixed values for criteria S1, S2.2, T2, and T3, they are presented on Table 13 and its classification is detailed next. For criterion S1 (Odor potential), ISP receives the lowest score since no cover material is added after each use and no ventilation equipment exists to reduce odors. FA also does not have ventilation equipment, but odors are reduced through the addition of cover material after each use. DVIP and SVIP receive the highest scores due to the existence of ventilation and of CBT, since the collection frequency is much higher, reducing the presence of odors. For criteria S2.2 (Health risks: flies and mosquito potential), the classification follows the same logic: ventilated solutions, as well as CBT, due to the isolation of the fecal sludge, receive the highest score and the remaining solutions receive the lowest score.
For criterion T2 (Complexity and difficulties of construction), DVIP receives the lowest score since it requires a more complex construction, with a superstructure and a ventilation pipe as well as two pits. FA also requires the construction of two pits, receiving the second lowest score. SVIP has a similar construction to DVIP, but only requires building one pit. ISP does not require a superstructure, simplifying the construction process. CBT has an industrialized construction, not implying complexity in the construction process for its users, therefore receiving the highest score.
For criterion T3 (Complexity of O&M activities), SVIP and DVIP have the lowest score due to the necessity of maintaining the superstructure in a dark environment and the ventilation pipe requiring cleaning in order to avoid flies, mosquitoes, and odors. CBT receives a classification of 3 due to the need for a more frequent collection of fecal sludge compared with the other solutions. FA and ISP practically do not require any maintenance, apart from the moment of collection, receiving the highest score.
Table 13. Fixed values for the several criteria.
TechnologyScore
S1S2.2T2
(Fixed Parcel)
T3
(Fixed Parcel)
Improved Single Pit1144
Single VIP4532
Double VIP4512
Fossa Alterna2124
Container-Based Toilet4553
Numeric inputs should be subject to scale normalization. In the case of criteria where higher performance corresponds to a lower value—for example, with investment costs—the normalization is performed through Equation (1), adapted from [8].
( r e f e r e n c e   c o s t   v a l u e V m a x ) ( V m i n V m a x ) + 1 = s c o r e

2.5. Economic Dimension

A comprehensive analysis of various options was conducted for the economic dimension, aiming to determine the default investment and O&M costs for tool application.
Costs shown in Table 1 constitute a readily accessible reference for comparing different on-site dry sanitation technologies costs, as all values were normalized to USD in 2022 prices, except for the value of [17]. The normalization of the costs for 2022 was completed by applying the cumulative inflation from the year of the reference to 2022. Table S4 in the Supplementary Material shows the yearly inflation data sourced from the World Bank [29] and the results of the iterative calculations for the yearly intervals. The conversion from local currency units to USD was completed using the 2022 average exchange rates, also sourced from the World Bank [30]. Once normalized to USD 2022 prices, averages between the values of the different references per type of technology were calculated, reaching one single value of investment cost and one single value of O&M cost for each technology. Every cost was normalized to USD per household per year, simply assuming that households in low-income contexts are constituted, on average, by six members [12,13].
As default information for the tool, a long-term cost analysis was carried out, considering the investments but also the O&M costs for a 10-year span. The net present value of the total cost was computed for each technology, with a discount rate of 5%, as shown in Table 14. The fact that the investment in Container-Based Toilets is null is because the investment is fractioned in monthly fees paid by the subscribers of the service, increasing the O&M costs.

2.6. Determination of the Recommended Option

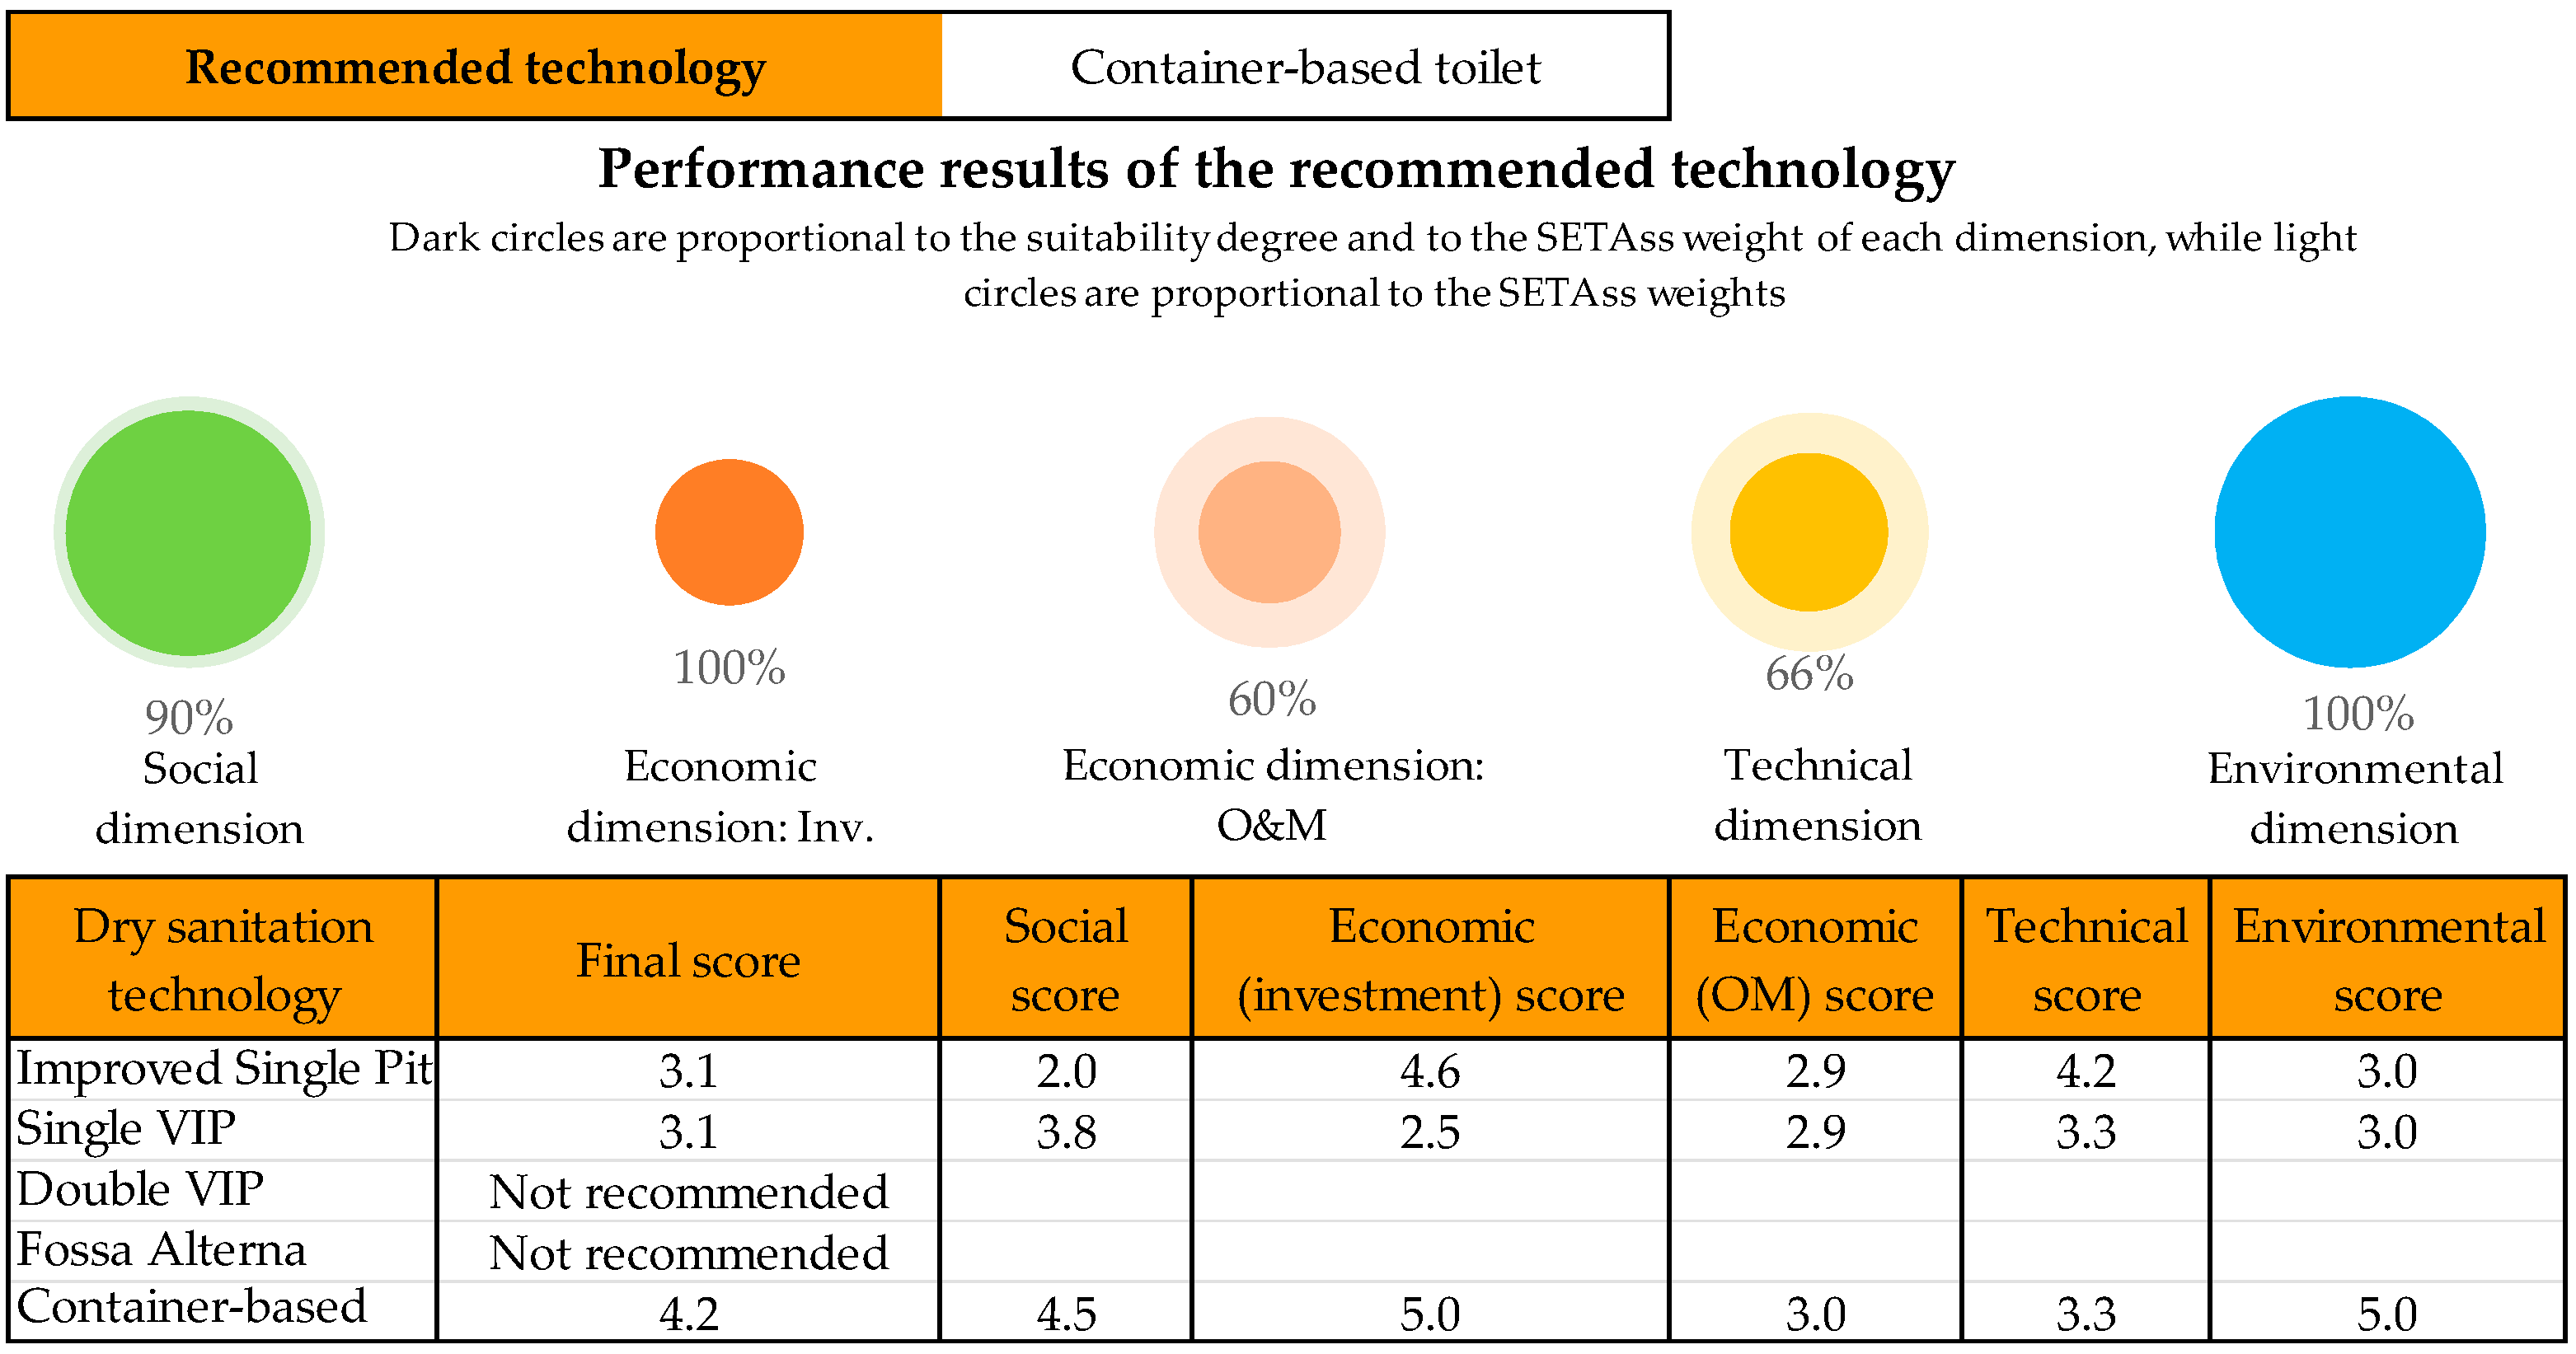
To compute the final score, the SETEds tool considers the user-provided weights, along with the average score in the social, economic, technical, and environmental dimensions for calculating an overall aggregated score for each technology. In the output sheet, Figure 2, the technologies that are excluded are labeled as not recommended, while for the eligible options the scores in each SETEds dimension are presented, as well as the final score. The technology with the higher final score is highlighted as Recommend technology.

3. Case Study

3.1. Brief Description of Ambriz

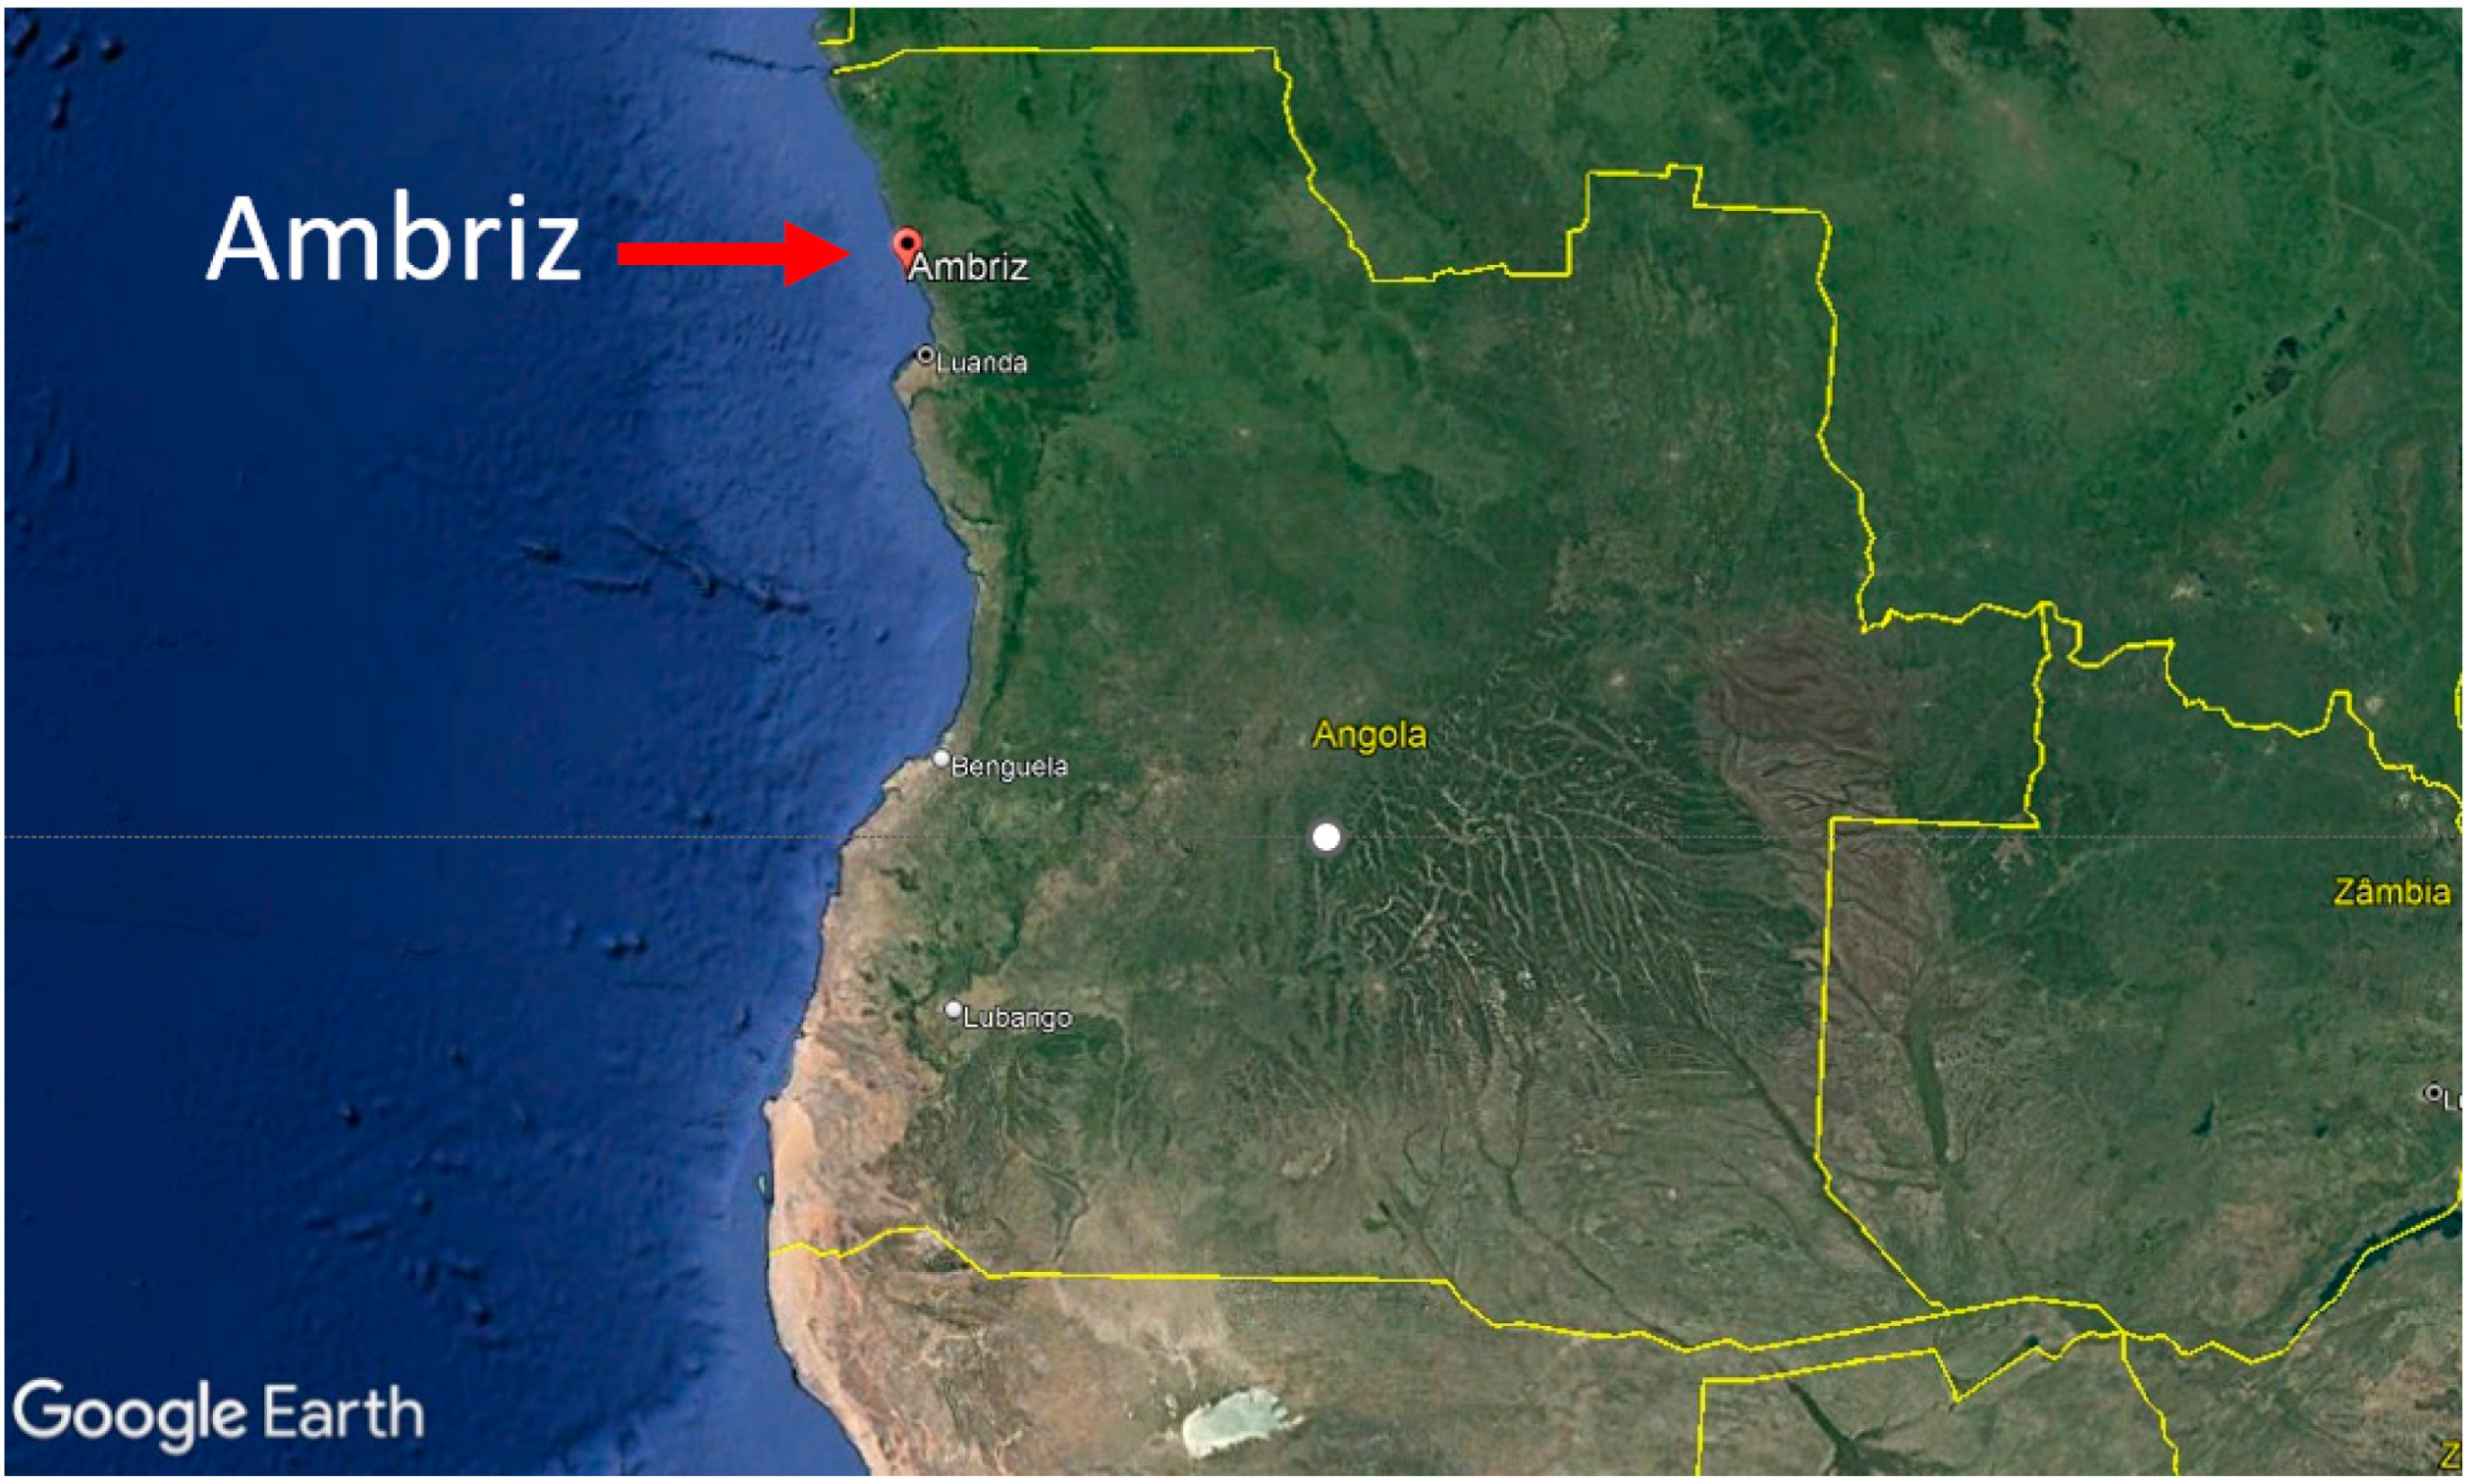
To illustrate the practical application of the SETEds tool and facilitate further discussion, the city of Ambriz is used as a case study, presented in Figure 3 and Figure 4. The information about Ambriz is sourced from a sanitation project conducted by Hidra et al. [31], which also involved the participation of this paper’s co-authors. Interaction with the community involved multiple meetings, enquiries, and two workshops with local stakeholders, encompassing national and regional wastewater service decision makers, sanitation experts, and local communities, within the scope of the sanitation project conducted by Hidra et al. [31]. Workshops dealt with (a) the existing situation and sanitation challenges and (b) planning criteria and feasibility options. Overall, 339 people were involved in the participatory processes.
Ambriz is a city in the coastline of northern Angola, with elevations between 15 m and 35 m above the average sea level. In the area of study, there are mainly Brown Tropical Arid soils and Brown Limestone soils, which have, respectively, similar characteristics to clay soils, and median textures. Ambriz is above the Coastal Aquifers of Angola, which are characterized by low water depths, ranging from 5 to 30 m [31]. The average annual precipitation is 520 mm, and the rainy season is between November and April [31]. The brooks in Ambriz have typically no flow in the dry period, between May and September, apart from Loge River, serving as the drainage system for the runoff of surface waters. According to the interviewed residents, despite the natural conditions being favorable to the water runoff, some drains and channels are obstructed with sediment and solid waste and cause the presence of stagnant water bodies in some flat and impervious areas when there is a heavy rain. However, there is no record of a flood in Ambriz between 1976 and 2013 (from 2013 onwards there is no available information), which means the flood return period is not low (probably over 10 years). Regarding resource circularity, residents show acceptance to the reuse of the end products of the fecal sludge treatment, which poses an opportunity for social and environmental benefits [31].
The main economic activity of the city is related to the operation of an oil company, Petromar, located near the coast. Currently, it employs around 170 workers that live mostly in the city. Other small industrial units are present in the city, including one bakery, five mills, six carpentries, three metal workshops, two salt pans, and one mineral water factory [31].
According to the last Census (2014), the population in the urban and peri-urban area of Ambriz was of 11,640 inhabitants that year, with projected growths to 14,460 inhabitants in 2020 and 27,330 inhabitants in 2040 [31].
Ambriz currently lacks a sewage system, wastewater treatment plant, or proper drainage systems for handling wastewater. Nevertheless, a sanitation project was carried out by a consortium of engineering design companies (Engidro, Hydroplan, VistaWater, Hidra) [31] for the implementation of a sanitation system. The project proposes implementing sewers on the densely populated part of the city and establishing an FSM service chain in the remaining area. It includes the construction of a wastewater treatment plant with co-treatment of fecal sludge, located in the south of Musseque Sul [31]. In Ambriz, according to the survey for the project, 80% of the population owns sanitary facilities, 5% relies on their neighbors’ facilities, and 15% practice open defecation.

3.2. Aplication of SETEds to Ambriz

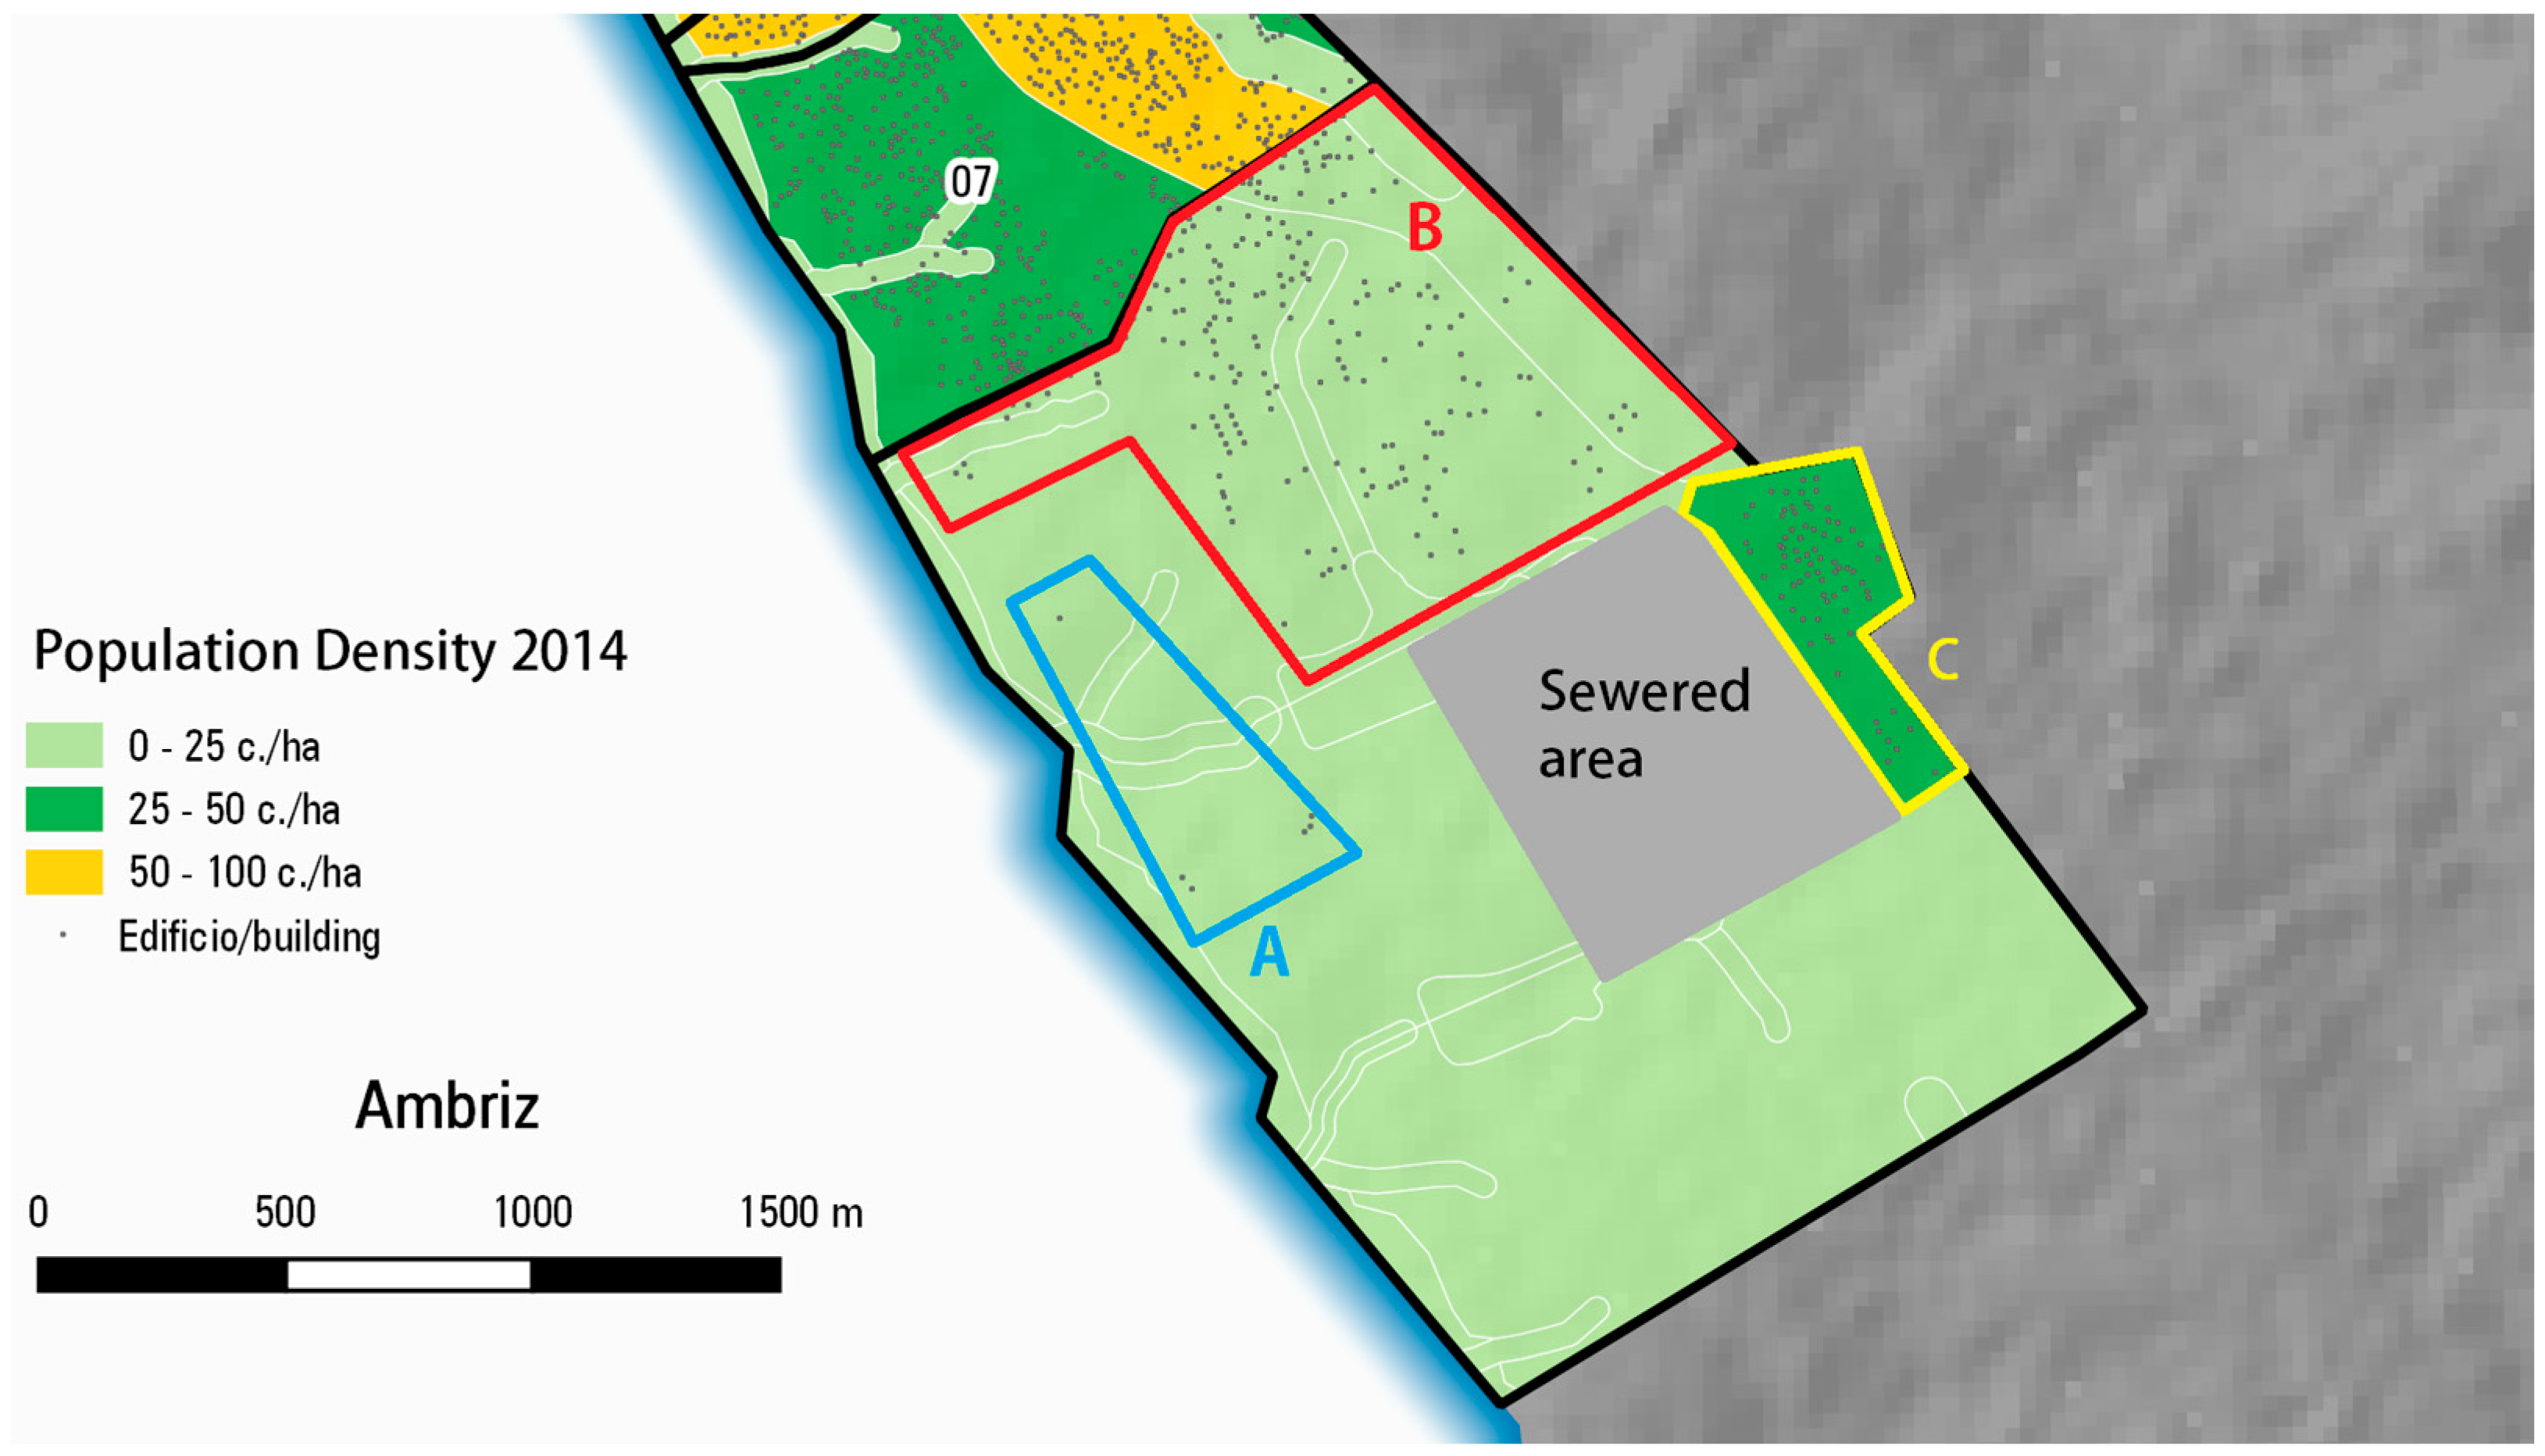
For the application of the SETEds tool, different areas of the city of Ambriz were delimited according to its characteristics. As such, three zones were identified, as follows:
Zone A, characterized by brown limestone soils, a distance to the (future) FSTP of 1500 m, and a population density of 15 inhabitants/hectare by the end of the design period. Because Zone A has a very low population density with isolated households, far from the rest of the households in Ambriz, it is less viable to reach for fecal sludge collection teams. This means that technologies that do not need off-site management are easier to operate in this area. For that reason, the option avoid off-site management is selected for the simulations performed with SETEds for zone A.
Zone B, that has Brown Tropical Arid soils, is located at a 2000 m distance from the FSTP and has a population density of 149 inhabitants/hectare in the project horizon.
Zone C, also characterized by Brown Tropical Arid soils, is at a distance of 1000 m from the FSTP and has a population density of 446 inhabitants/hectare by the end of the design period.
The three zones are identified in Figure 5.
Regarding the remaining parameters to be selected in the input form, all the three zones have similar inputs as all of them share the same characteristics. The inputs for the simulation are shown in the Supplementary Material Section.
To illustrate how the tool adapts to different priorities of the stakeholders, three scenarios were created, resorting to different weights. In Scenario 1, which emphasizes the economic dimension, the following selected weights were chosen: 35% O&M costs, 35% investment costs, and 10% for each of the other dimensions—Social, Environmental, and Technical. In Scenario 2, the environmental dimension takes the forefront with a weight of 70%. The other dimensions, including O&M costs, Investment costs, Technical dimension, and Social dimension, each carry a weight of 7.5%. The third and last scenario, Scenario 3, emphasizes the social dimension. The assigned weights were 70% for social dimension and 7.5% for each of the others.

4. Results

4.1. Investment and O&M Costs

Results shown in Table 14 (results of cost systematization) are in agreeance with the expectations, since the more complex the technology, the higher the investment cost. ISPs have a very simple technology, while SVIPs require a specific superstructure, designed to promote ventilation. The superstructure must be strong enough to support a ventilation pipe, and light-tight enough to prevent too much light from getting in (which would be counter-productive in repelling insects). This justifies the increased investment when compared to an ISP. The DVIP is less than double the cost of an SVIP, but more expensive than an SVIP. This makes sense, since in a DVIP there is the need for only one superstructure; therefore, the added costs are to build the second pit, which is cheaper than a pit plus a ventilated superstructure.
The lower cost of an FA is justified by the pit’s lower depth and can be compared to two ISPs instead of one DVIP, despite their similar way of operation. FA pits are supposed to be shallow, no more than 1.5 m deep [9,18]. DVIPs are at least 3 m deep [9]. Deeper pits are more expensive to dig, and that is one of the reasons why an FA is much cheaper than an SVIP and DVIP. In addition, its superstructure is expected to be a simple one, not always including ventilation, according to the descriptions in the WashCost [18] and ATC [20] documents.
CBT investment costs are null, since the investment is fractioned in the monthly fees paid by the subscribers of the service. This business model, despite creating higher O&M costs, is favorable to the households for whom it is difficult to save larger amounts of money. This way, no initial investment is needed, only the allocation of a much smaller amount of money every month.
In what concerns the O&M costs, all values fit the expectations. Considering peri-urban or urban contexts that are densely populated, SVIP must be mechanically emptied, which implies paying vacuum truck operators. In DVIP and FA, the material has time to dry and degrade, which enables safe self-emptying with a shovel, potentially avoiding payments to emptying services. CBT requires frequent visits from the collection team, which is labor-intensive. In addition, in the case of CBTs, the company usually covers the full FSM service chain. SOIL Ekolakay in Haiti and Sanivation in Kenya are examples of this business model [10]. These companies provide the toilet and manage the collection team and the treatment plants. In the case of SOIL, Ekolakay treated sludge is reused for producing compost, whereas in the case of Sanivation, it is used for briquettes production. Despite offsetting some costs with the sales of these products, it is natural that the costs of managing a whole FSM chain are higher than those of individual stages of the chain, such as the function of a vacuum truck operator, whose role is limited to emptying the pits and discharging the sludge at the treatment plant. ISP presents no O&M costs because it is only eligible to areas with low population density, where emptying is not needed, and therefore costs of emptying and transport are avoided. When the pit is full, another one is dug next to it.
Considering a 10-year design period, ISP is the technology with the lowest cost, followed in ascending order by CBT, FA, SVIP, and DVIP.

4.2. SETEds Tool Applied to Ambriz

Table 15 shows the results of the application of the SETEds tool to Ambriz.
In scenario 1, with emphasis in the economic dimension, the recommended technologies were ISP for zone A and FA for zone B and C. For scenario 2, with emphasis in the environmental dimension, no changes are observed in comparison to scenario 1. For an area with low population density and no possibility of offsite management, like zone A, the technologies that are eligible are ISP and SVIP. Since SVIP is similar to ISP regarding environmental performance, but much more expensive, it makes sense that ISP is the recommended technology. FA is simultaneously a technology that has benefits from an environmental perspective (especially because it allows for reuse) and that has a lower cost compared to other technologies, which explains why the tool selected it both in scenario 1 and 2. ISP is only eligible for areas with low population density, and CBT implies transport to an FSTS or an FSTP. In the multicriteria analysis, the need for transport scores proportionally to the distance to the transfer station, being the higher the distance the lower the score, which in this case lowered the score of CBT and made FA the technology with the higher score. DVIP would be suitable too, but since costs are significantly higher than those for FA, despite the economic dimension not being the one emphasized, FA scored higher. In scenario 3, where the social dimension is emphasized, ISP changed for SVIP and FA for DVIP, compared to scenario 2. SVIP and DVIP are the equivalent, respectively, to ISP and FA, but with ventilation, minimizing the potential for flies and mosquitos, an important factor at a social level as those insects are related to disease transmission.
It is important to note that the SETEds tool applies a multicriteria analysis, taking into consideration many more variables than those mentioned in the former paragraphs. Those explanations are a simplification, a linear way of expressing the core of the tool’s rationale in each case, to demonstrate the potential of its use.

5. General Discussion

5.1. Perspectives on Container-Based Toilet Costs

In parallel to the results obtained through the methodology herein presented, an EY study [32] from 2020 on Container-Based Sanitation (CBS) economics highlights CBS as the least expensive method for providing safely managed sanitation. In detail, the study entails that most of the CBTs were least expensive of the pit latrine cases analyzed. The main cause identified in that study for the lower costs of CBT, when compared to the other forms of sanitation, is that with scale, its prices reduce. It is mentioned that, with scale, assuming that management capacity and sales accompany the growth in customer numbers, every additional 100 toilets reduce the annual cost of CBS per household by 3–12% of total yearly household costs. It also points out that even if pit latrines can constitute a form of safely managed sanitation, they are more likely to not be operated the right way and, therefore, do not constitute safely managed sanitation. This reduces the number of cases where pit latrines are considered for costs comparison, increasing the percentage of CBTs providing safely managed sanitation. In the present work, a correct management of the pit latrines was assumed, and so they were considered on the same level of safely managed sanitation as CBS. Currently, the present model does not consider the effect of scale or data of actual forms of management and the consequent results in the quality degree of the sanitation service, explaining why results are different.
Nonetheless, the results and information gathered about sanitation costs in this work can still be a valuable reference, especially for other sanitation technologies rather than the CBT, since there are very few organized data sets and comparable costs regarding those technologies.

5.2. Perspectives on the SETEds Tool

The fact that the SETEds decision tool only considers five possible dry sanitation technologies can be viewed both as an advantage and as a potential for expansion. First, it reduces complexity and eliminates redundancy. For example, some other potential options could be Elevated Fossa Alterna, Elevated Double VIP, or Ecological Latrine. Elevated Fossa Alterna or Elevated Double VIP would have the advantage of providing more options for flood-prone areas, but would, otherwise, have the exact same characteristics as FA or DVIP, and for a floodable area there is CBT. An Ecological Latrine would not have the strong need of offsite management but would be very similar to CBT, and be more expensive, which is not a strong point in a low-income context. On the other hand, being able to expand the tool to consider other existing or future options might be an advantage in certain contexts, where multiple operators and business models are present, and services are well established. When a user is presented with a limited pre-selection, the decision support approach is only as good as the alternatives, as also discussed in [5]. However, there are potential drawbacks, including a risk of biases due to insufficient knowledge and data, opaque pre-selection processes influenced by experts’ personal preferences, and limited local ownership [5,6]. Adding future options to the tool would be possible, but with increased usage complexity, which defeats its simplicity goal.
The work focuses on the second step of the fecal sludge management service chain, the containment/storage phase, arguably the most critical, prioritizing simplification of the decision tool. It can mislead the reader, giving the idea that deciding which technology to implement is everything needed for improving public health through investment in sanitation. However, the existence of a complete service chain for the management of fecal sludge from dry sanitation technologies is crucial. It is, additionally, a good starting point for the creation of a multi-criteria decision support tool that contemplates the whole fecal sludge management service and that quantifies environmental and economic benefits of reuse products and of future costs.
Despite not having an extensive number of criteria, SETEds offers advantages in decision-aiding processes, in limited-data and -know-how contexts. Nonetheless, some of the defined criteria are qualitative and could potentially yield more precise results if converted into quantitative measures, such as S3 (Social benefits of reuse), E3 (Economic benefits of reuse), and A3 (Environmental benefits of reuse). Notwithstanding, the working rational of the tool is already implemented and adding more criteria would be simple, in a programming perspective. The real challenge lies in determining which criteria are meaningful, without overloading it with inputs unattainable in practice.
Existing models for sanitation technology selection, such as eCompendium, Santiago, or FSM Toolbox, for example, while providing valuable contributions to the sector, often suffer from drawbacks, such as limited adaptability to data-scarce environments, inflexible cost assumptions, dependence on Internet connectivity, or the need for users with advanced expertise in sanitation.
Ecompendium by Emersan requires numerous inputs, which implies low adaptability to data-scarce environments. It provides the user with possible technologies for each step of the service chain, but it does not provide a comparative analysis between the outputs.
Santiago’s inputs are meant to be obtained in workshops with the communities. Santiago has an editable database, so it can include new technologies as they arise. It provides some options of full sanitation service chain viable sequences, which the decision makers then decide from. SETEds focuses only on one step of the service chain, but, on the other hand, it does not require the user to make a comparative analysis from its outputs. It provides a small amount (5 or less) of technologies suitable for the context, rated from 1 to 5, with a clear vision of which technology the tool determined as the most suitable and in which order the others follow.
The tool by Bouhabid and Louis and the FSMToolbox are very adaptable and complete but require heavy data input. In addition, the first only determines possible solutions, not ranking them or selecting the most suitable, while the latter requires the user to create an account in the platform and Internet connection.
SETEds attempts to address critical gaps prevalent in current sanitation technology selection tools. First, one of its key strengths is its minimal data requirements from the user concerning local conditions. This characteristic is particularly valuable in the context of low-income countries where access to comprehensive and up-to-date information is oftentimes very limited or even unavailable. Traditional models may often struggle with data scarcity, leading to unreliable recommendations or lack of solution ownership by users. SETEds aims to overcome this limitation by reducing the burden on users to provide extensive data inputs.
SETEds empowers users by allowing them to customize investment and operation and maintenance cost parameters. This feature facilitates precise and adaptable planning of sanitation systems, aligning the available financial resources and income levels of the communities they serve, as well as a better understanding of how model results are influenced by changing those parameters. In contrast, models that employ fixed cost assumptions can lead to unrealistic or impractical recommendations in the face of budget constraints, commonly encountered in low-income settings.
In addition, SETEds sets itself apart by its minimal technological requirements, as it operates efficiently with just a standard computer device and basic computational skills, utilizing Microsoft Excel as its platform, not requiring Internet access. This accessibility ensures that the tool can be employed even in areas with limited digital infrastructure, expanding its usability to a broader user base.
While SETEds presents numerous advantages, it is important to acknowledge that there may be certain setbacks and limitations associated with its usage, due to the assumptions and simplifications used in its formulation, the fact that it focuses solely on one step of the sanitation chain, or the number of solutions to choose from.
Nonetheless, despite the simplifications and assumptions made in the SETEds tool, the Ambriz case study demonstrated its effectiveness. It produced sensible results that showed flexibility of application to different locations and contexts, while simultaneously being aligned with the priorities of different decision-makers. The process was carried out in an automatic, systematic, replicable, and straightforward manner. Furthermore, it is swift and easy to use, and in a familiar software, Microsoft Excel 2308, making it intuitive.

6. Conclusions

Regarding the review and systematization of costs, the results of the work carried out make a valuable contribution to the existing, albeit limited, pool of comparable references concerning the costs of dry sanitation technologies. The case study showed the SETEds tool has potential for application by recommending technologies that simultaneously meet local requirements and the decision-makers’ priorities. However, future research could focus on extending the scope of the tool to include the whole FSM service, starting from the user interface and continuing to the steps downstream the management chain. Incorporation of a cost analysis capable of quantifying environmental and economic benefits of reuse products would be an asset.
The SETEds tool simplifies a very complex decision process by systematizing and automatizing the comparison between different dry sanitation options, making it simpler for decision makers to apply the same framework. The SETEds tool may be especially useful to be applied in the preliminary stages of the sanitation planning at peri-urban areas of low-income countries’ cities, where a significant portion of the population lack access to public water supply and dry sanitation emerges as a viable and practical solution. As such, the tool’s features align with the specific needs and challenges of these contexts, making it highly relevant and valuable in facilitating better sanitation planning.

Supplementary Materials

The following supporting information can be downloaded at: https://www.mdpi.com/article/10.3390/su151914155/s1.

Author Contributions

Conceptualization, M.F.S., C.P.C., R.V.M., L.A. and J.S.M.; methodology, M.F.S. and C.P.C.; supervision, J.S.M., R.V.M. and L.A.; visualization and writing—original draft preparation, M.F.S. and C.P.C.; writing—review and editing, R.V.M., L.A. and J.S.M. All authors have read and agreed to the published version of the manuscript.

Funding

This research received no external funding.

Institutional Review Board Statement

Not applicable.

Informed Consent Statement

Not applicable.

Data Availability Statement

The results data presented in this work are available on request from the corresponding author if no sensible data are involved regarding the real case study.

Acknowledgments

The authors acknowledge the support from the National Water Directorate of Angola (DNA) for providing data and studies of sanitation in Angola.

Conflicts of Interest

The authors declare no conflict of interest.

Abbreviations

CBSContainer-Based Sanitation
CBTContainer-Based Toilet
CCLCommunity Capacity Level
CRLRequired management Capacity Level
DVIPDouble Ventilated Improved Pit
FAFossa Alterna
FSMFecal Sludge Management
FSTPFecal Sludge Treatment Plant
FSTSFecal Sludge Treatment Station
GLASSWater Global Analysis and Assessment of Sanitation and Drinking Water Report
ISPImproved Single Pit
MCDAMulti-Criteria Decision Analysis
RSRegional Specificities
SVIPSingle Ventilated Improved Pit
SETEdsSocial, Economic, Technical and Environmental dimensions of dry sanitation options
O&MOperation and Maintenance
WASHWater, Sanitation, and Hygiene
WHOWorld Health Organization
WWTPWastewater Treatment Plant

References

  1. WHO; UNICEF. Progress on Household Drinking Water, Sanitation and Hygiene 2000–2020 Five Years into the SDGs; WHO: Geneva, Switzerland; UNICEF: New York City, NY, USA, 2021. [Google Scholar]
  2. Strande, L.; Ronteltap, M.; Brdjanovic, D. Faecal Sludge Management—Systems Approach for Implementation and Operation; IWAPublishing: London, UK, 2014. [Google Scholar]
  3. Perard, E. Economic and Financial Aspects of the Sanitation Challenge: A Practitioner Approach. Util. Policy 2018, 52, 22–26. [Google Scholar] [CrossRef]
  4. Emersan. Available online: http://www.emersan-compendium.org/ (accessed on 27 July 2023).
  5. Spuhler, D.; Germann, V.; Kassa, K.; Ketema, A.; Manandhar Sherpa, A.; Sherpa, M.G.; Maurer, M.; Lüthi, C.; Langergraber, G. Developing sanitation planning options: A tool for systematic consideration of novel technologies and systems. J. Environ. Manag. 2020, 271, 111004. [Google Scholar] [CrossRef] [PubMed]
  6. Bouabid, A.; Louis, G. Decision support system for selection of appropriate water supply and sanitation technologies in developing countries. J. Water Sanit. Hyg. Dev. 2021, 11, 208–221. [Google Scholar] [CrossRef]
  7. Asian Institute of Technology, CEPT University, CSTEP e University of Natural Resources and Life Sciences. Toolbox by FSMA. Available online: www.fsmtoolbox.com (accessed on 27 July 2023).
  8. Matos, R.V.; Ferreira, F.; Alves, L.; Ramos, E.; Costa, L.; Matos, J.S. Multi-Criteria Framework for Selection of City-Wide Sanitation Solutions in Coastal Towns in Northern Angola. Sustainability 2021, 13, 5627. [Google Scholar] [CrossRef]
  9. Tilley, E.; Ulrich, L.; Lüthi, C.; Reymond, P.; Zurbrügg, C. Compendium of Sanitation Systems and Technologies, 2nd ed.; Swiss Federal Institute of Aquatic Science and Technology (Eawag): Dübendorf, Switzerland, 2014. [Google Scholar]
  10. Remington, C.; Cherrak, M.; Preneta, N.; Kramer, S.; Mesa, B. A Social Business Model for the Provision of Household Ecological Sanitation Services in Urban Haiti. In Ensuring Availability and Sustainable Management of Water and Sanitation for All: Proceedings of the 39th WEDC International Conference, Kumasi, Ghana, 11–15 July 2016; Shaw, R.J., Ed.; Briefing Paper 2529; Loughborough University: Loughborough, UK, 2016; 6p. [Google Scholar]
  11. Russel, K.; Montgomery, I. Container Based Sanitation Implementation Guide, 1st ed.; Container-Based Sanitation Alliance: London, UK, 2020. [Google Scholar]
  12. Rosling, H.; Roonlund, A.R.; Rosling, O. Factfulness: Ten Reasons We’re Wrong About the World—And Why Things Are Better Than You Think; Sceptre: London, UK, 2018. [Google Scholar]
  13. The World Bank. World Bank Country and Lending Groups. Available online: https://datahelpdesk.worldbank.org/knowledgebase/articles/906519-world-bank-country-and-lending-groups (accessed on 27 July 2023).
  14. WHO; UNICEF. State of the World Sanitation: An Urgent Call to Transform Sanitation for Better Health, Environments, Economies and Societies; WHO: Geneva, Switzerland; UNICEF: New York City, NY, USA, 2020. [Google Scholar]
  15. WHO. Strong Systems and Sound Investments: Evidence on and Key Insights into Accelerating Progress on Sanitation, Drinking-Water and Hygiene. In UN-Water Global Analysis and Assessment of Sanitation and Drinking-Water Report (GLAAS); WHO: Geneva, Switzerland, 2022. [Google Scholar]
  16. UNICEF. Bottleneck Analysis of the WASH Sector in Angola—From a Public Finance Perspective; UNICEF: New York City, NY, USA, 2023. [Google Scholar]
  17. Ministry of Energy and Water of Angola (MINEA). Consulting Services for the Development of Faecal Sludge Management Guidelines, Capacity Building and IRSEA Institution Development in Regulation of Sanitation Services; Inception Report; Ministry of Energy and Water of Angola: Luanda, Angola, 2023. [Google Scholar]
  18. WashCost. Providing a Basic Level of Water and Sanitation Services that Last: Cost Benchmarks; IRC: The Hague, The Netherlands, 2012; Volume 1. [Google Scholar]
  19. DWAF. Sanitation Technology Options; Department Water Affairs and Forestry (DWAF): Cape Town, South Africa, 2007. [Google Scholar]
  20. ATC. Ecological Sanitation: Construction Cost Analysis and Users Experience of Fossa Alterna Latrine; Executive Printers: Kampala, Uganda, 2013. [Google Scholar]
  21. Menter, U. New Sanitation Techniques in the Development Procuration: An Economical Reflection. Master’s Thesis, Hafencity University of Hamburg, Hamburg, Germany, 2016. [Google Scholar]
  22. Bill and Melinda Gates Foundation. Case Studies in Gender Integration: Sanitation Process and Service Delivery in Kenya; Bill and Melinda Gates Foundation: Seattle, WA, USA, 2018. [Google Scholar]
  23. Peal, A.; Evans, B.; Ahilan, S.; Ban, R.; Blackett, I.; Hawkins, P.; Schoebitz, L.; Scott, R.; Sleigh, A.; Strande, L.; et al. Estimating Safely Managed Sanitation in Urban Areas; Lessons Learned from a Global Implementation of Excreta-Flow Diagrams. Front. Environ. Sci. 2020, 8, 1. [Google Scholar] [CrossRef]
  24. Direção Nacional de Águas de Angola (DNA). Coastal Towns Wastewater Management Study for Landana, N’zeto, Cabinda and Soyo Towns, Feasibility Studies; Direção Nacional de Águas de Angola (DNA): Luanda, Angola, 2020. [Google Scholar]
  25. Direção Nacional de Águas de Angola (DNA). Coastal Towns Wastewater Management Study for Landana, N’zeto, Cabinda and Soyo Towns, Soyo Detailed Project; Direção Nacional de Águas de Angola (DNA): Luanda, Angola, 2021. [Google Scholar]
  26. Pinto, M. Sistemas Locais de Saneamento de Baixo Custo. Master’s Thesis, IST-UL, Lisbon, Portugal, November 2013. [Google Scholar]
  27. Direção Nacional de Águas de Angola (DNA). Consultancy Services for Coastal Towns Wastewater Management Study for Ambriz, Porto Amboim, Moçâmedes and Tômbwa; Moçâmedes Detailed Project; Direção Nacional de Águas de Angola (DNA): Luanda, Angola, 2022. [Google Scholar]
  28. Direção Nacional de Abastecimento de Água e Saneamento de Moçambique (DNAAS). Infule Co-treatment WWTP; Vflow.Ges; Direção Nacional de Abastecimento de Água e Saneamento de Moçambique (DNAAS): Luanda, Angola, 2019. [Google Scholar]
  29. The World Bank. Inflation, Consumer Prices (Annual %). Available online: https://data.worldbank.org/indicator/FP.CPI.TOTL.ZG (accessed on 27 July 2023).
  30. The World Bank. Official Exchange Rate (LCU per US$, Period Average). Available online: https://data.worldbank.org/indicator/PA.NUS.FCRF (accessed on 27 July 2023).
  31. Hidra, H.; Vista Water, E. Environmental and Social Impact Study for the Wastewater and Faecal Sludge Management Preliminary Project Report for the City of Ambriz; Direção Nacional de Águas de Angola (DNA): Luanda, Angola, 2022. [Google Scholar]
  32. Gray, J.; Coates, J. How Cost Analysis Dispels Myths about Container-Based Sanitation. Available online: https://www.ey.com/en_gl/corporate-responsibility/how-cost-analysis-dispels-myths-about-container-based-sanitation (accessed on 27 July 2023).
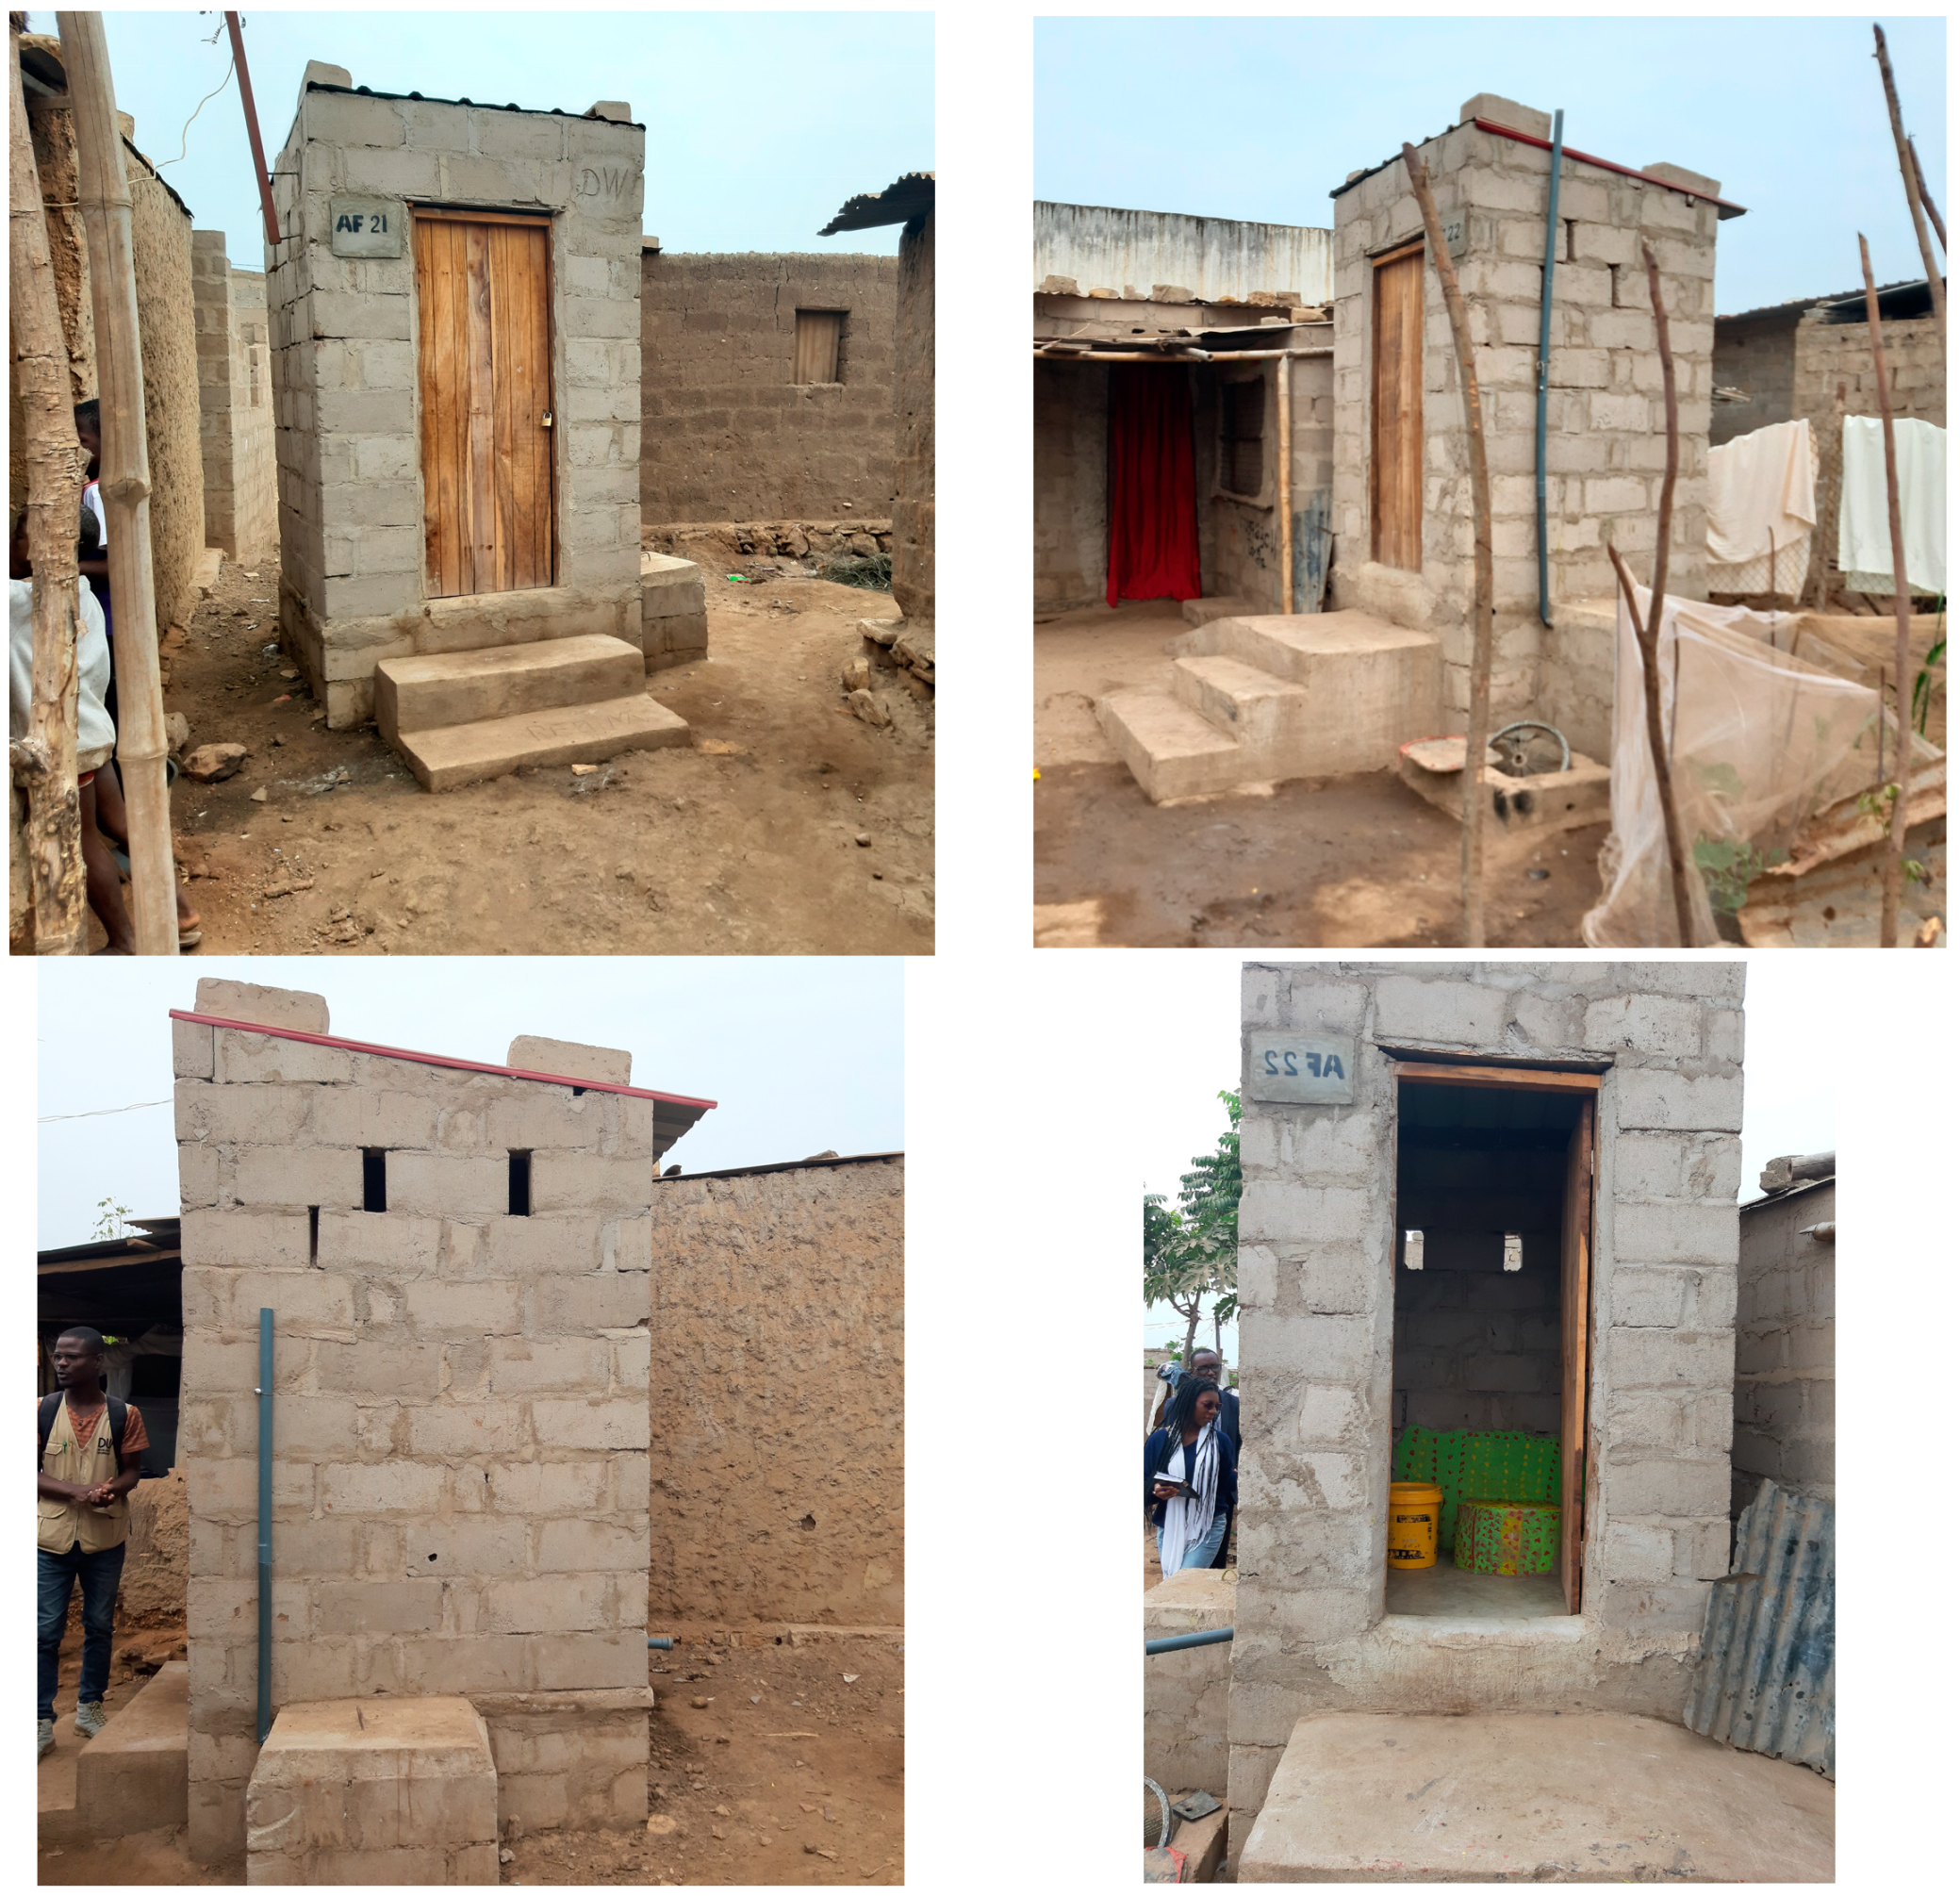
Figure 1. Observation of different angles of a single VIP in Sumbe, Angola (Photos: José Saldanha Matos).
Sustainability 15 14155 g001
Figure 2. Example of an output sheet of the SETEds tool. In this case, the recommended option is a CBT.
Sustainability 15 14155 g002
Figure 3. Location of the coastal town of Ambriz. The town is located in Angola, in Central Africa.
Sustainability 15 14155 g003
Figure 4. Promedial house in Ambriz [31].
Sustainability 15 14155 g004
Figure 5. Case study areas. Adapted from [31].
Sustainability 15 14155 g005
Table 1. Dry sanitation technologies investment and O&M costs.
TechnologySourceCountryYearMinimum
Investment
Maximum
Investment
Investment
Currency
O&M
Minimum
Costs
O&M
MAXIMUM
Costs
O&M
Currency
Improved Single PitMINEA [17]Angola2023NA70USDNANANA
Single VIPWashCost [18]Mozambique201136358USD2.58.5USD/inhab/year
DWAF [19]South Africa2007426639USD9.222.9USD/year
Double VIPDWAF [17]South Africa2007497852USD5.019.2USD/year
Fossa
Alterna
WashCost [18]Uganda201198NAUSDNANANA
ATC [20]Uganda2013187198USDNANANA
Menter [21]Ethiopia2016 0.140.14USD/inhab/year
Container-
-based
toilet
Remington et al., 2016 [10]Haiti201600USD810USD/inhab/year
Bill and Melinda Gates Foundation [22]Kenya201800NA3.953.95USD/inhab/year
Russel et al., 2019 [11]Ghana, Haiti, and Peru201900NA6.4224USD/inhab/year
NA Not applicable.
Table 2. Exclusion conditions for criterion C1.
Possible Technologies
C1Groundwater table depth < 3 mImproved Single Pit; Single VIP;
Double VIP;
Fossa Alterna;
Container-Based Toilet
Groundwater table depth < 3 mContainer-Based Toilet
Table 3. Exclusion conditions for criterion C2.
Possible Technologies
C2Flood return period < 7 yearsImproved Single Pit; Single VIP;
Double VIP;
Fossa Alterna;
Container-Based Toilet
Flood return period > 7 yearsContainer-Based Toilet
Table 4. Exclusion conditions for criterion C3.
TechnologiesMinimum Area for Implementation (m2)
Improved Single Pit4
Single VIP4
Double VIP8
Fossa Alterna8
Container-Based Toilet1
Table 5. Exclusion conditions for criterion C4.
Possible Technologies
C4Population density < 30 inhab/haImproved Single Pit; Single VIP;
Container-Based Toilet
Population density > 30 inhab/haSingle VIP;
Double VIP;
Fossa Alterna;
Container-Based Toilet
Table 6. Exclusion conditions for criterion C5.
C5 Possible Technique
Avoid off-site
management
Population density
> 30 inhab/ha
Fossa Alterna;
Double VIP
Population density
< 30 inhab/ha
Improved Single Pit;
Single VIP;
Fossa Alterna;
Double VIP
Do not avoid off-site
management
Manual transport<500 m to the FSTS/FSTP Improved Single Pit;
Single VIP;
Fossa Alterna;
Double VIP;
Container-Based Toilet
>500 m to the FSTS/FSTPPopulation density
> 30 inhab/ha
Fossa Alterna;
Double VIP
Population density
< 30 inhab/ha
Improved Single Pit;
Single VIP;
Fossa Alterna;
Double VIP
Mechanical transport Improved Single Pit;
Single VIP;
Fossa Alterna;
Double VIP;
Container-Based Toilet
Table 14. Results of the costs systematization.
TechnologyAverage Investment Per Technology
(USD 2022)
Average O&M Costs, Per Technology (USD 2022)Total Costs
(Investment + 10 Years O&M)
Improved Single Pit70070
Single VIP57010644
Double VIP7002715
Fossa Alterna2501257
Container-Based Toilet030221
Table 15. Results of the application of SETEds to Ambriz.
Scenario 1
Economic Emphasis
Scenario 2
Environmental Emphasis
Scenario 3
Social Emphasis
Ambriz zone AImproved Single PitImproved Single PitSingle VIP
Ambriz zone BFossa AlternaFossa AlternaDouble VIP
Ambriz zone CFossa AlternaFossa AlternaDouble VIP
Disclaimer/Publisher’s Note: The statements, opinions and data contained in all publications are solely those of the individual author(s) and contributor(s) and not of MDPI and/or the editor(s). MDPI and/or the editor(s) disclaim responsibility for any injury to people or property resulting from any ideas, methods, instructions or products referred to in the content.