
Threshold Effect of Manufacturing Agglomeration on Eco-Efficiency in the Yellow River Basin of China

Abstract
:1. Introduction
2. Impact Mechanisms of Industrial Agglomeration on Eco-Efficiency
2.1. “Positive Externality”: The Positive Effect Mechanism of Industrial Agglomeration on Eco-Efficiency
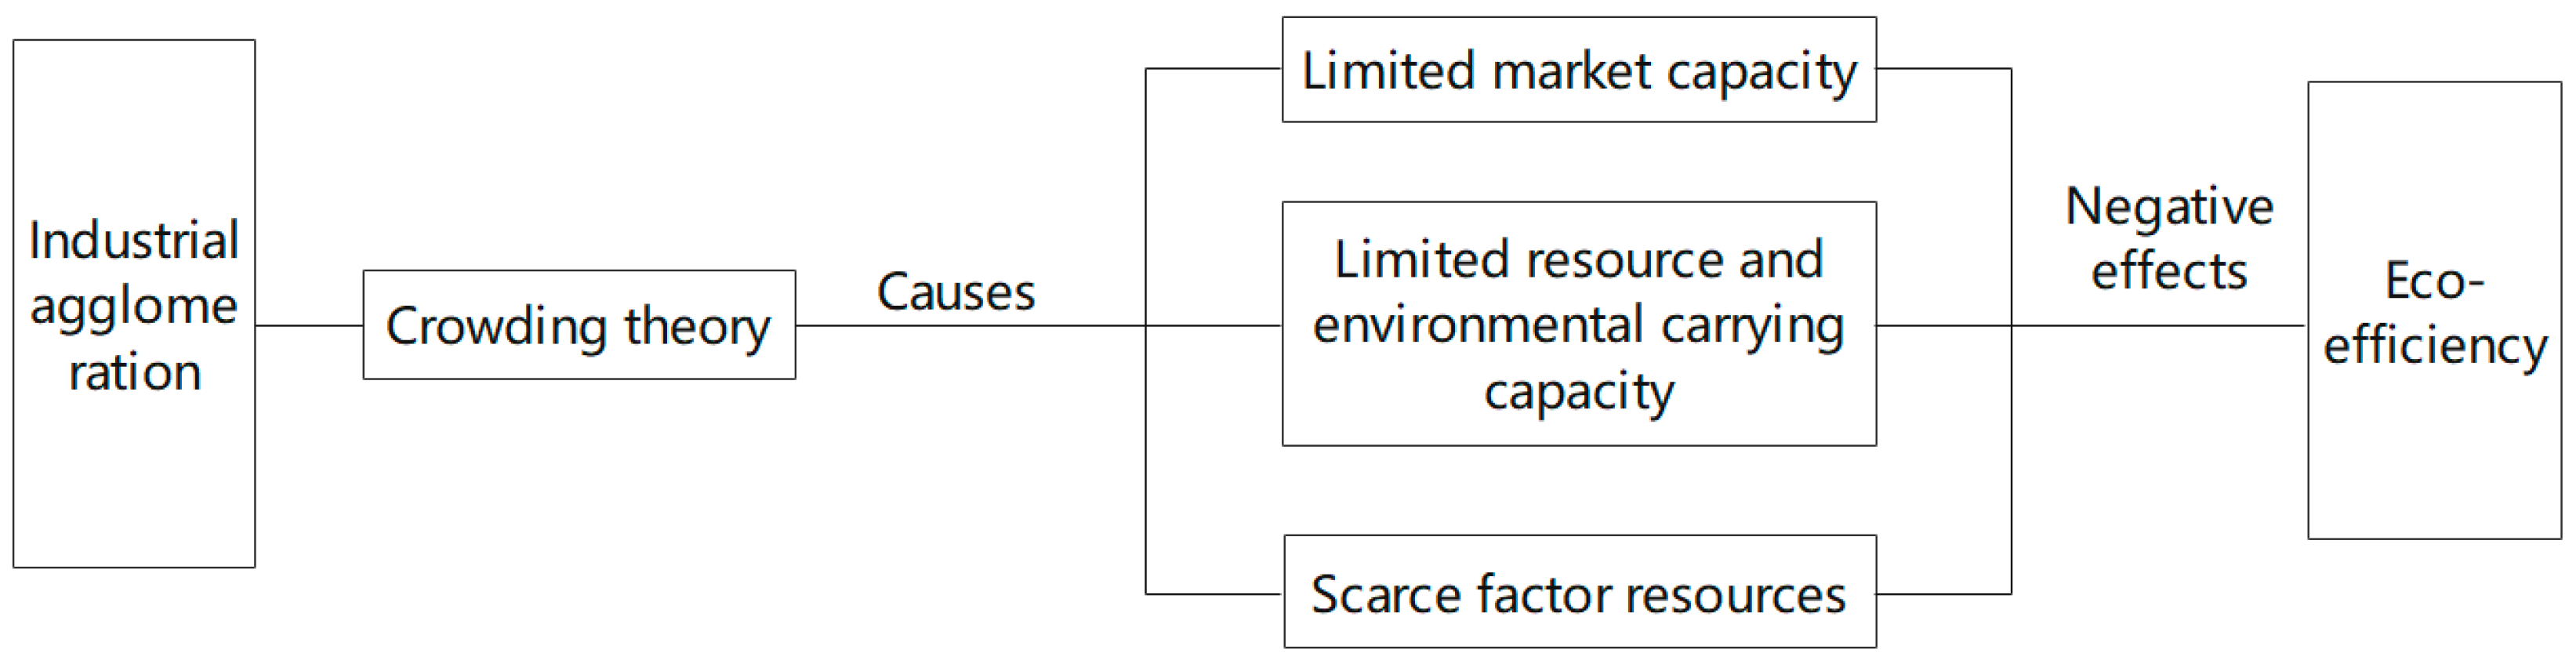
2.2. ”Negative Externality”: The Negative Effect Mechanism of Industrial Agglomeration on Eco-Efficiency
3. Equations and Mathematical Expressions
3.1. Construction of Threshold Effect Model of Manufacturing Industry on Eco-Efficiency
3.2. Data Description
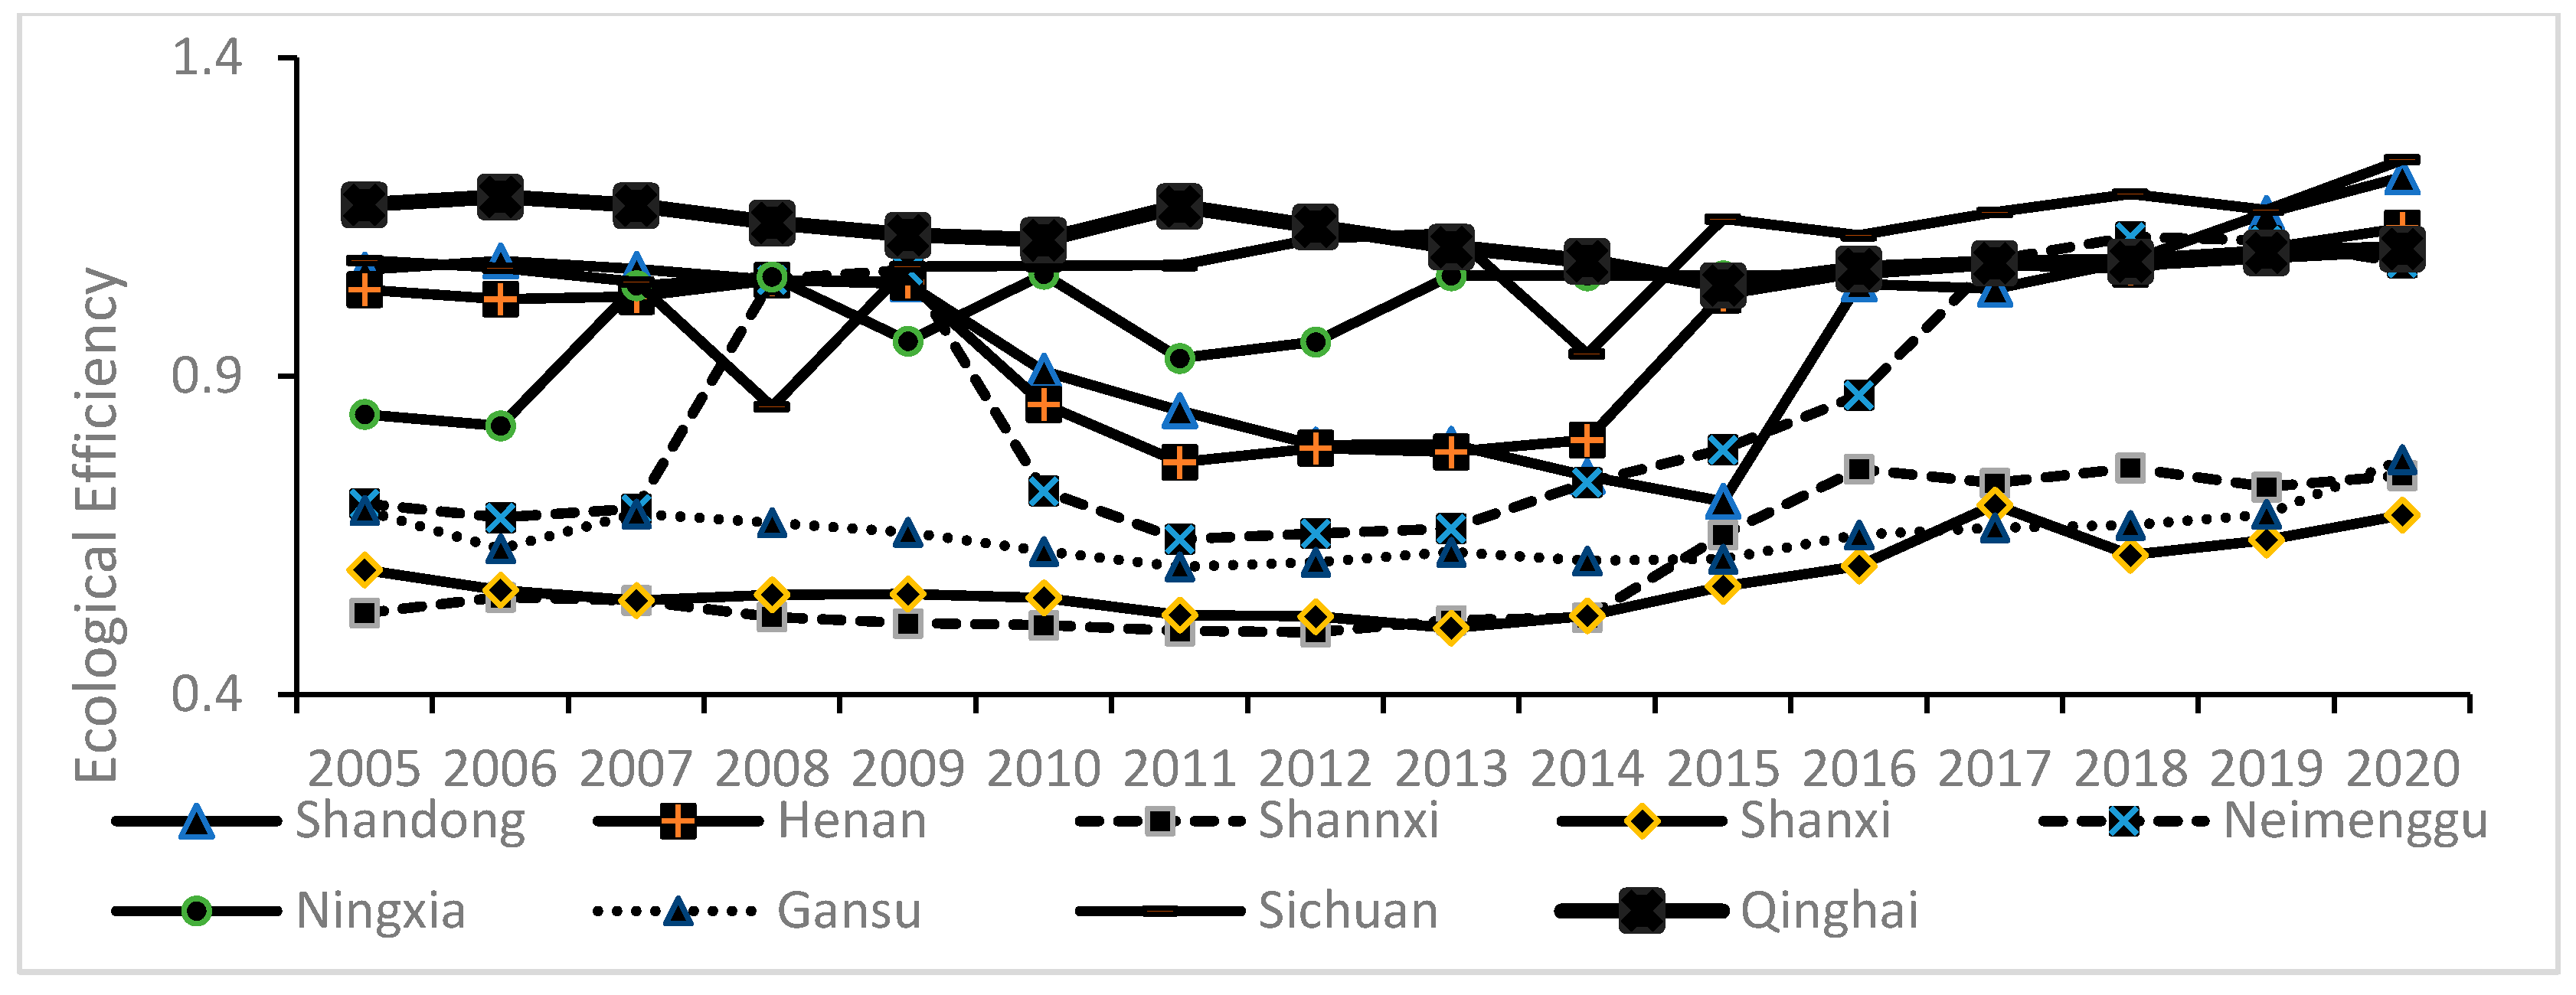
3.2.1. Explained Variable
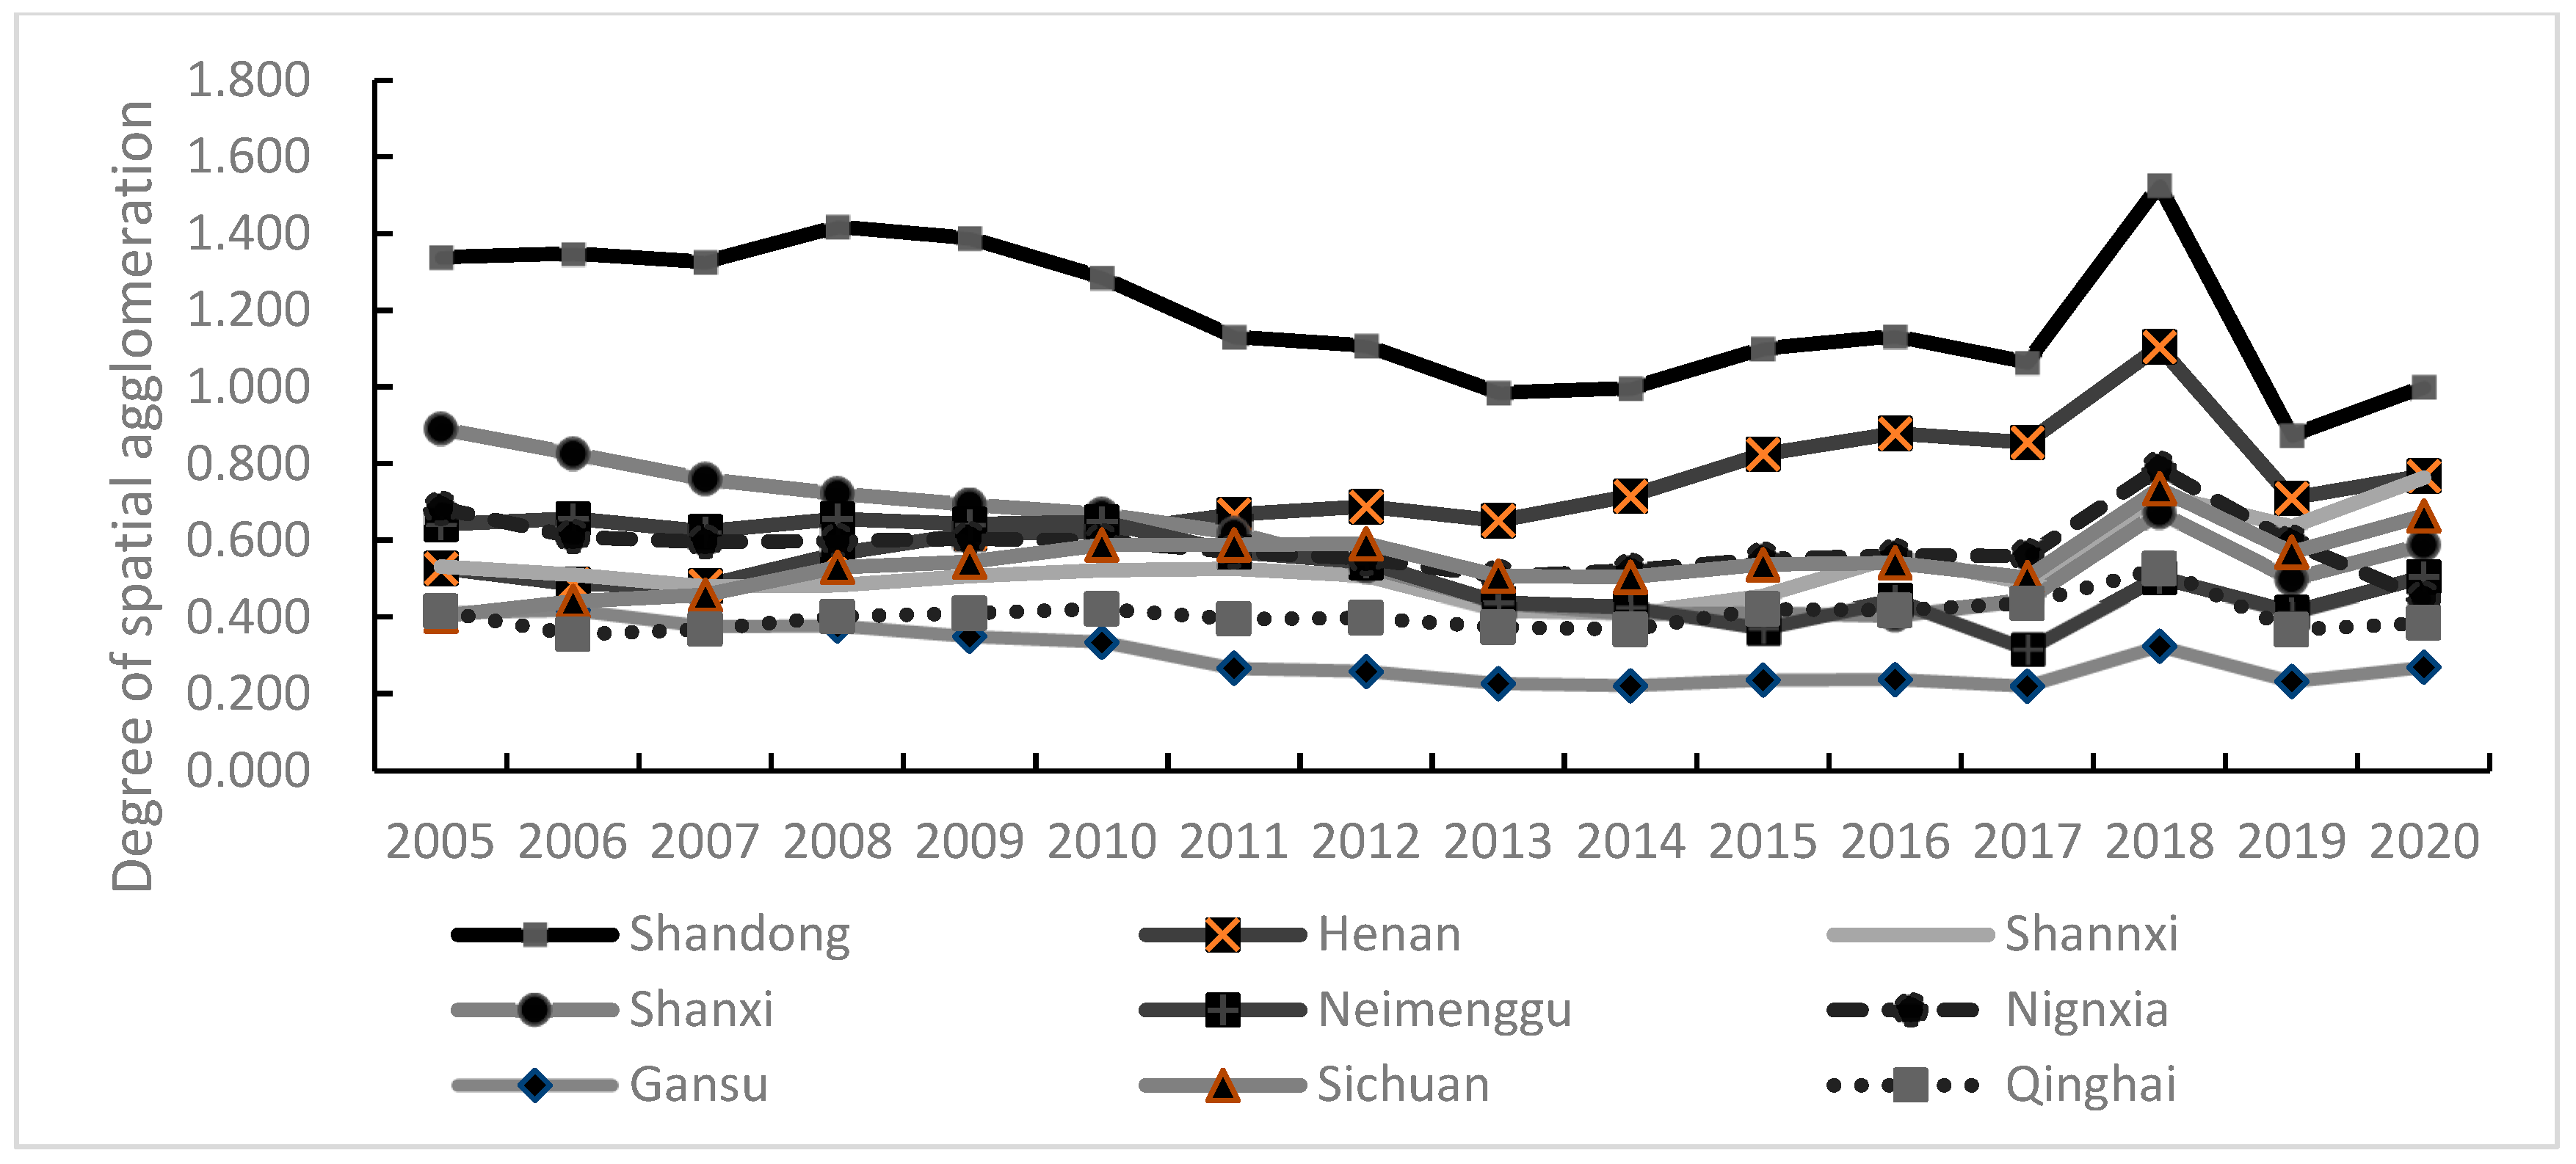
3.2.2. Core Explanatory Variable
3.2.3. Controlled Variables
- (1)
- Human capital: According to the practice of most scholars, the published average years of schooling for each province were used to represent their levels of human capital.
- (2)
- Industrial structure: Referring to the research conclusions of Gu (2020), the share of secondary sector output in total output was used to represent the province’s industrial structure [25].
- (3)
- Degree of import and export dependence: Imports and exports have a direct impact on the overall development process, thus affecting the level of domestic eco-efficiency. This study used each province’s total imports and exports as a proportion of its GDP to measure its degree of dependence on imports and exports.
- (4)
- Economic growth level: The layout of industries affects the level of economic growth, which in turn directly influences the eco-efficiency of a region. Based on the combined empirical research experience of domestic and foreign scholars, the logarithm of GDP was chosen to represent the level of economic development of the region. To exclude the effects of factors such as inflation on the results, this paper used GDP in 2005 as the base period for deflating.
- (5)
- Urbanization rate: Luo et al. (2013) concluded that the urbanization level and regional eco-efficiency are significantly correlated in China [26]. Therefore, the urbanization rate was used as a control variable in the research model, and the urbanization rate was treated logarithmically.
- (6)
- FDI level: According to the study conducted by Yang et al. (2015) on the impact of FDI on eco-efficiency, the level of FDI in each province in this study was reflected by the logarithm of the total amount of foreign investment [27].
3.3. Test of Correlation Variables
4. Empirical Analysis
4.1. Existence Test for Threshold of Industry Agglomeration Level
4.2. Threshold Effect of Manufacturing Agglomeration on Eco-Efficiency
4.3. Model Estimation Heterogeneity of the Threshold Effect of Manufacturing on Eco-Efficiency
4.3.1. Identification of the Threshold Effect of the High-Energy-Consuming Industry as Well as the Medium- and Low-Energy-Consuming Manufacturing Industry on Eco-Efficiency
4.3.2. Regression Result Analysis of Threshold Model
5. Conclusions and Recommendations
5.1. Conclusions
5.2. Policy Recommendations
5.3. Deficiencies and Prospects
Author Contributions
Funding
Institutional Review Board Statement
Informed Consent Statement
Data Availability Statement
Conflicts of Interest
References
- Cleveland, C.J.; Costanza, R.; Hall, C.A.; Kaufmann, R. Energy and the U.S. economy: A biophysical perspective. Science 1984, 225, 890–897. [Google Scholar] [CrossRef] [PubMed]
- Frank, A.; Moussiopoulos, N.; Sahm, P.; Bartonova, A. Urban air quality in larger conurbations in the European Union. Environ. Model. Softw. 2001, 16, 399–414. [Google Scholar]
- Verhoef, E.T.; Nijkamp, P. Externalities in urban sustainability environmental versus localization-type agglomeration externalities in a general spatial equilibrium model of a Single sector monocentric industrial city. Ecol. Econ. 2002, 40, 157–179. [Google Scholar] [CrossRef]
- Ehrenfeld, J. Putting a spotlight on metaphors and analogies in industrial ecology. Energy Econ. 2003, 7, 1–4. [Google Scholar] [CrossRef]
- Wang, M.; Webber, M.; Finlayson, B.; Barnett, J. Rural industries and water pollution in China. J. Environ. Manag. 2008, 86, 648–659. [Google Scholar] [CrossRef] [PubMed]
- Shapiro, J.S.; Walker, R. Why is pollution from us manufacturing declining? The roles of environmental regulation, productivity, and trade. Am. Econ. Rev. 2018, 108, 3814–3854. [Google Scholar] [CrossRef]
- Qin, B.; Wu, J. Does urban concentration mitigate CO2 emissions? Evidence from China 1998–2008. China Econ. Rev. 2015, 35, 220–231. [Google Scholar] [CrossRef]
- Wang, Y.; Wang, J. Does industrial agglomeration facilitate environmental performance: New evidence from urban China? J. Environ. Manag. 2019, 248, 109244. [Google Scholar] [CrossRef]
- Miao, J.J.; Guo, H.J. The mechanism of influence of industrial synergistic agglomeration on environmental pollution—An empirical study based on panel data of Yangtze River Delta city cluster. Manag. Mod. 2019, 39, 70–76. [Google Scholar]
- Andersson, M.; Lööf, H. Agglomeration and productivity: Evidence from firm-level data. Ann. Reg. Sci. 2011, 46, 601–620. [Google Scholar] [CrossRef]
- Chen, C.F.; Sun, Y.W.; Lan, Q.X.; Jiang, F. Impacts of industrial agglomeration on pollution and eco-efficiency—A spatial econometric analysis based on a big panel dataset of China’s 259 cities. J. Clean. Prod. 2020, 258, 120721. [Google Scholar] [CrossRef]
- Du, L.; Zhao, H.; Tang, H.; Jiang, P.; Ma, W. Analysis of the synergistic effects of air pollutant emission reduction and carbon emissions at coal-fired power plants in China. Environ. Prog. Sustain. Energy 2021, 40, e13630. [Google Scholar] [CrossRef]
- Lucas, R.E. On the mechanics of economic development. J. Monet. Econ. 1988, 22, 3–42. [Google Scholar] [CrossRef]
- Zeng, D.Z.; Zhao, L. Pollution havens and industrial agglomeration. J. Environ. Econ. Manag. 2009, 58, 141–153. [Google Scholar] [CrossRef]
- He, J. Pollution haven hypothesis and environmental impacts of foreign direct investment: The case of industrial emission of sulfur dioxide (SO2) in Chinese provinces. Ecol. Econ. 2006, 60, 228–245. [Google Scholar] [CrossRef]
- Deng, Y.P.; Xu, H.L. Foreign direct investment, agglomeration externalities and environmental pollution. Stat. Res. 2016, 33, 47–54. [Google Scholar]
- Yuan, H.X.; Feng, Y.D.; Lee, C.C.; Cen, Y. How does manufacturing agglomeration affect green economic efficiency. Energy Econ. 2020, 92, 104944. [Google Scholar] [CrossRef]
- Xie, W.C.; Li, X. Can Industrial agglomeration facilitate green development? Evidence from China. Front. Environ. Sci. 2021, 9, 15–24. [Google Scholar] [CrossRef]
- Zheng, Q.; Lin, B. Impact of industrial agglomeration on energy efficiency in China’s paper industry. J. Clean. Prod. 2018, 184, 1072–1080. [Google Scholar] [CrossRef]
- Song, Y.; Zhu, J.; Yue, Q.; Zhang, M.; Wang, L.K. Industrial agglomeration, technological innovation and air pollution: Empirical evidence from 277 prefecture-level cities in China. Struct. Change Econ. Dyn. 2023, 66, 240–252. [Google Scholar] [CrossRef]
- Ren, B.P.; Du, Y.X. The coupling and synergy of economic growth-industrial development-ecological environment in the Yellow River Basin. Chin. J. Popul. Resour. Environ. 2021, 31, 119–129. [Google Scholar]
- Qin, X.L.; Yu, W.C. Bootstrap ARDL test of the relationship between economic growth, industrial agglomeration and water pollution—Based on the empirical investigation of the Yangtze River Economic Belt. Macroeconomics 2016, 6, 127–134+151. [Google Scholar]
- Gong, X.S.; Wang, M.Z.; Hang, Z.H. FDI, market segmentation and regional eco-efficiency: Direct effects and spillovers. China Popul. Resour. Environ. 2018, 28, 95–104. [Google Scholar]
- Wang, C.H.; Gong, W.F.; Zhao, M.Z.; Zhou, Y.L.; Zhao, Y. Spatio-temporal evolution characteristics of eco-efficiency in the Yellow River Basin of China based on the super-efficient SBM model. Environ. Sci. Pollut. Res. 2023, 30, 72236–72247. [Google Scholar] [CrossRef]
- Gu, D.; Xu, X.J. The influence of industrial structure optimization and upgrading on ecological efficiency in China. Ecol. Econ. 2020, 36, 58–67. [Google Scholar]
- Luo, N.S.; Li, J.J.; Luo, F.Z. An empirical study on the relationship between urbanization and regional eco-efficiency in China. China Popul. Resour. Environ. 2013, 23, 53–60. [Google Scholar]
- Yang, R.F. Industrial agglomeration, foreign direct investment and environmental pollution. Bus. Manag. J. 2015, 37, 11–19. [Google Scholar]
- Wang, Q.Y. Fixed-effect panel threshold model using Stata. Stata J. 2015, 15, 121–134. [Google Scholar] [CrossRef]
- Xu, H.L.; Deng, Y.P. Does foreign direct investment cause environmental pollution in China?—A spatial econometric study based on inter-provincial panel data in China. Manag. World 2012, 02, 30–43. [Google Scholar]
- Zhao, K.; Zhang, R.; Liu, H.; Wang, G.Y.; Sun, X.L. Resource endowment, industrial structure, and green development of the Yellow River Basin. Sustainability 2021, 13, 4530. [Google Scholar] [CrossRef]


| CHI-SQ.DF | CHI-SQ. STATISTIC | PROB | |
|---|---|---|---|
| Hausmann test | 7 | 33.30 | 0.0000 |
| Identification Models | F-Statistic | p-Value | Bootstrap Sampling Numbers | Critical Value | ||
|---|---|---|---|---|---|---|
| 10% | 5% | 1% | ||||
| Single Threshold | 36.11 *** | 0.002 | 500 | 14.65 | 17.29 | 23.96 |
| Double Threshold | 33.38 *** | 0.0001 | 500 | 12.90 | 17.73 | 25.16 |
| Three Threshold | 22.94 | 0.176 | 500 | 36.42 | 49.82 | 97.42 |
| Independent Variable | Threshold Variable | Threshold | Estimated Value | 95% Confidence Interval |
|---|---|---|---|---|
| 0.3667 | [0.3545, 0.3674] | |||
| 0.3978 | [0.3949, 0.4013] |
| Identification Models | F-Statistic | p-Value | Bootstrap Sampling Numbers | Critical Values | ||
|---|---|---|---|---|---|---|
| 10% | 5% | 1% | ||||
| Single Threshold | 28.82 * | 0.058 | 500 | 22.53 | 28.17 | 36.19 |
| Double Thresholds | 29.14 ** | 0.020 | 500 | 17.78 | 20.10 | 30.24 |
| Three Thresholds | 19.07 | 0.565 | 500 | 44.85 | 52.14 | 71.82 |
| Independent Variable | Threshold Variable | Threshold | Estimated Value | 95% Confidence Interval |
|---|---|---|---|---|
| 7.0098 | [6.9250, 7.0853] | |||
| 7.9864 | [7.9280, 8.0089] |
| Identification Models | F-Statistic | p-Value | Bootstrap Sampling Numbers | Critical Value | ||
|---|---|---|---|---|---|---|
| 10% | 5% | 1% | ||||
| Single Threshold | 50.75 *** | 0.004 | 500 | 21.91 | 26.79 | 43.67 |
| Double Thresholds | 8.51 | 0.334 | 500 | 16.87 | 21.42 | 33.21 |
| Three Thresholds | 17.09 | 0.078 | 500 | 14.02 | 21.44 | 135.27 |
| Independent Variable | Threshold Variable | Threshold | Estimated Value |
|---|---|---|---|
| 0.0005 |
| Model (1) | Model (2) | Model (3) | |||
|---|---|---|---|---|---|
| 0.0010 | −2.6449 * | −8.7257 *** | |||
| (0.00) | (−1.75) | (−6.26) | |||
| 2.8713 * | −2.5228 * | −0.5785 | |||
| (1.80) | (−1.69) | (−0.71) | |||
| −1.5263 * | −2.9342 * | ||||
| (−1.71) | (−1.96) | ||||
| 5.1340 | 5.6169 * | 5.4346 * | |||
| (1.60) | (1.89) | (1.86) | |||
| 1.0242 *** | 0.4805 | 0.2017 | |||
| (3.06) | (1.49) | (0.59) | |||
| 1.1885 | 1.4372 | 1.5932 | |||
| (1.12) | (1.48) | (1.63) | |||
| −0.7371 | −0.2304 | −0.4318 | |||
| (−0.25) | (−0.08) | (−0.16) | |||
| −2.6494 | −3.0518 ** | ||||
| (2.28) | (−2.04) | ||||
| 0.0555 | 0.0238 | ||||
| (1.22) | (0.55) | ||||
| N | 135 | N | 135 | N | 135 |
| R2 | 0.2292 | R2 | 0.3106 | R2 | 0.3331 |
| F | 3.8648 | F | 6.6446 | F | 8.4901 |
| Variable | Model (1) | Variable | Model (2) |
|---|---|---|---|
| 0.5946 | 1.2814 *** | ||
| (0.29) | (6.37) | ||
| 3.3923 ** | −0.4578 *** | ||
| (2.19) | (−4.07) | ||
| −1.0640 | |||
| (−1.30) | |||
| 5.6803 * | −2.1586 *** | ||
| (1.76) | (−8.27) | ||
| 0.9664 *** | −0.0317 | ||
| (2.90) | (−1.05) | ||
| 5.1519 | −0.5966 * | ||
| (0.50) | (−1.89) | ||
| −1.4235 | 0.4736 ** | ||
| (−0.49) | (2.19) | ||
| −1.8108 * | −0.0180 | ||
| (−1.89) | (−1.35) | ||
| 0.0434 | −0.0045 | ||
| (0.96) | (−0.72) |
| Industry Category | Identification Model | F-Statistic | p-Value | Sample | Critical Value | ||
|---|---|---|---|---|---|---|---|
| 10% | 5% | 1% | |||||
| High energy consumption industry | Single threshold | 21.90 ** | 0.034 | 500 | 16.32 | 20.12 | 41.36 |
| Double threshold | 17.57 ** | 0.048 | 500 | 14.05 | 17.51 | 27.03 | |
| Triple threshold | 5.70 | 0.744 | 500 | 45.81 | 52.39 | 66.00 | |
| Medium and low energy consumption industry | Single threshold | 33.40 ** | 0.028 | 500 | 21.28 | 27.17 | 39.13 |
| Double threshold | 14.37 | 0.268 | 500 | 22.29 | 30.49 | 36.00 | |
| Triple threshold | 6.71 | 0.894 | 500 | 97.29 | 121.55 | 166.64 | |
| Industry Category | Independent Variable | Threshold Variable | Threshold | Estimates | 95% Confidence Interval |
|---|---|---|---|---|---|
| High-energy- consumption industry | 0.5190 | [0.4984, 0.5280] | |||
| 0.5495 | [0.4491, 0.5958] | ||||
| Medium- and low- energy-consumption industry | 0.1647 | [0.1605, 0.1671] |
| High-Energy-Consuming Manufacturing Industry | Medium-and Low-Energy Consumption Manufacturing Industry | ||
|---|---|---|---|
| −4.8110 *** | −0.6428 | ||
| (−3.42) | (−0.92) | ||
| −1.7689 *** | 9.8657 *** | ||
| (−2.73) | (3.42) | ||
| −1.1305 *** | |||
| (−2.69) | |||
| 6.4738 ** | 1.5354 | ||
| (2.00) | (0.46) | ||
| 1.0359 *** | 0.9963 *** | ||
| (3.09) | (2.98) | ||
| 4.8491 | 1.3112 | ||
| (0.47) | (1.19) | ||
| −1.9544 | 0.5816 | ||
| (−0.66) | (0.18) | ||
| −1.8392 | −2.3503 | ||
| (−1.14) | (−1.40) | ||
| 0.0881 * | 0.0520 | ||
| (1.88) | (1.15) | ||
Disclaimer/Publisher’s Note: The statements, opinions and data contained in all publications are solely those of the individual author(s) and contributor(s) and not of MDPI and/or the editor(s). MDPI and/or the editor(s) disclaim responsibility for any injury to people or property resulting from any ideas, methods, instructions or products referred to in the content. |
© 2023 by the authors. Licensee MDPI, Basel, Switzerland. This article is an open access article distributed under the terms and conditions of the Creative Commons Attribution (CC BY) license (https://creativecommons.org/licenses/by/4.0/).
Share and Cite
Wang, C.; Han, A.; Gong, W.; Zhao, M.; Li, W. Threshold Effect of Manufacturing Agglomeration on Eco-Efficiency in the Yellow River Basin of China. Sustainability 2023, 15, 14151. https://doi.org/10.3390/su151914151
Wang C, Han A, Gong W, Zhao M, Li W. Threshold Effect of Manufacturing Agglomeration on Eco-Efficiency in the Yellow River Basin of China. Sustainability. 2023; 15(19):14151. https://doi.org/10.3390/su151914151
Chicago/Turabian StyleWang, Chuanhui, Asong Han, Weifeng Gong, Mengzhen Zhao, and Wenwen Li. 2023. "Threshold Effect of Manufacturing Agglomeration on Eco-Efficiency in the Yellow River Basin of China" Sustainability 15, no. 19: 14151. https://doi.org/10.3390/su151914151
APA StyleWang, C., Han, A., Gong, W., Zhao, M., & Li, W. (2023). Threshold Effect of Manufacturing Agglomeration on Eco-Efficiency in the Yellow River Basin of China. Sustainability, 15(19), 14151. https://doi.org/10.3390/su151914151