Spatio–Temporal Evolutionary Features and Drivers of Green Competitiveness of Cities Surrounding the Yellow River

Abstract
:1. Introduction
2. Literature Review
- (1)
- On the meaning of green competitiveness. Most scholars believe that regional green competitiveness, referring to green development as the main task, with the goal of achieving a harmonious symbiotic effect between human development and nature, to create an environmentally friendly and green eco-type region with a unique green competitive advantage [3], is a synthesis involving various aspects such as resource environment, society, and economy [4]. Enhancing regional green competitiveness not only emphasizes the green transformation of traditional industries, but also the innovative development of green industries [5]. Strengthening the level of ecological protection is a prerequisite for enhancing regional green competitive advantages [6], while regional economic growth and equitable distribution should also be considered [7,8].
- (2)
- On green competitiveness indicator systems. Advances have been made in the construction of an index system of green competitiveness: Some scholars have established a green competitiveness index evaluation system at the national level based on the three dimensions of green nature, green economy, and green society [9]; some scholars have also constructed a provincial green competitiveness index system comprising the six aspects of environmental protection factor, ecological factor, recycling factor, low-carbon factor, health factor, and sustaining factor [10] or the five aspects of green high-quality growth competitiveness, resource saving and emission reduction competitiveness, city ecological and environmental quality competitiveness, green lifestyle competitiveness, and green investment competitiveness [11]. Other scholars have evaluated the development level of the green competitiveness of municipalities based on four dimensions [12], namely economic green development, social green development, resource green development, and environmental green development, or three dimensions [13], namely green economy, green investment, green utilization, and green security. In addition, Wang et al. (2022) constructed a comprehensive evaluation index system for green competitiveness in rural China based on the “green growth—green wealth—green welfare” framework [14].
- (3)
- On the spatio–temporal patterns of green competitiveness. There is extensive research on the spatio–temporal pattern of regional green competitiveness, with numerous research methods such as the coefficient of variation [1], the Thiel index [15,16], the Dagum Gini coefficient (DGC) [11], the convergence model [1], the spatial exploratory model [17], and the coupling and coordination model [18], which have been widely used. Studies show that China’s regional green competitiveness continues to improve, with the green competitiveness of the eastern region being much higher than that of the other regions, and the regional differences are characterized first by an increase and then a decrease; the coupling coordination degree of China’s regional green competitiveness system exhibits significant spatial dependence, forming a high-coupling coordination degree agglomeration with Shanghai as the center spreading to the south and a low-coupling coordination degree agglomeration with Qinghai as the center spreading to the east [11]. Wang et al. (2022) analyzed the spatial and temporal characteristics and drivers of China’s rural green competitiveness through spatial autocorrelation (SA) analysis and GeoDetector and found that China’s rural green development presents a spatial differentiation feature that is high in the eastern region and low in the central and western regions [14]. Ma et al. (2023) analyzed regional differences in China’s green competitiveness through methods such as coefficient of variation analysis and found that the coefficient of variation in green competitiveness of China’s 30 provinces and the eastern, central, and western regions show an inverted U-shape trend of first increasing and then decreasing [19]. Li et al. (2022) explored the changing characteristics of the green development level in Hunan Province based on the DPSIR model and proposed that there are significant spatial differences in the level of green development in counties in Hunan Province, showing a pattern of “strong in the east and weak in the central and western parts of the country” [20].
- (4)
- On factors influencing green competitiveness. FDI [21], transport systems [22], finance [23,24,25], green innovation, environmental regulation [26,27,28], green logistics [29], and environmental innovation strategies [30] are widely recognized by academics as key elements influencing green competitiveness. Some studies also suggest that the circular economy constrains the creation of green competitiveness of enterprises [31], and at the same time, the circular economy and the core competitiveness of enterprises form a connecting link between the preceding and the following [32], which can help to promote the green innovation of enterprises, optimize the strategic layout of their development, and improve their green competitiveness and digital transformation as a new form of economic development. Furthermore, it can improve the green competitiveness of enterprises by increasing the production of green products, enhancing the level of technological innovation and promoting green investment, although this effect is subject to the constraints of environmental uncertainty [33]. A few other scholars believe that to enhance industrial competitiveness, it is necessary to improve the rationality and sophistication of the industrial structure [34,35], to construct an institutional system to match the regional green development, and to provide an institutional environment for green innovation of the industry [36]. Meanwhile, regional green competitiveness is affected by factors such as the digital economy [37], industrial agglomeration [38,39,40], public pressure [41], human capital [42], the environmental management system [43], technological innovation [44], urbanization [45], and environmental policy [46]. At the same time, the factors affecting regional green competitiveness exhibit spatial variations and peculiarities [47].
3. Materials and Methods
3.1. Research Area
3.2. Indicator System
3.3. Research Methodology
3.3.1. Entropy Weighting Method
- (1)
- Standardization of indicators. The formula is as follows:where xθij is the initial value of the indicator, Xθij is the standardized value of the indicator, min(xθij) is the minimum value of the indicator, max(xθij) is the minimum value of the indicator, n is the number of cities, m is the number of indicators, and r is the total number of study years.
- (2)
- For calculating the proportion of the region i-th under indicator j in year θ-th of the indicator, the following formula is used:
- (3)
- For calculating the indicator of entropy, the following formula is used:where ej denotes the indicator entropy value and the value range of ej is [0,1]; k = 1/ln(rn).
- (4)
- For calculating the weights of the wj indicators within the city green competitiveness system and the three major subsystems, the formula is as follows:
- (5)
- For calculating the level of city green competitiveness and the combined development of green economic competitiveness, green social competitiveness, and green environmental competitiveness, the formula is as follows:where Uθi is the city green competitiveness and the comprehensive evaluation index of the three major subsystems.
3.3.2. Kernel Density Estimation (KDE)
3.3.3. Dagum Gini Coefficient
3.3.4. Spatial Autocorrelation
3.3.5. GeoDetector
3.4. Data Sources
4. Results
4.1. Temporal Evolutionary Features
4.2. Spatial Evolutionary Features
4.2.1. Three Regional Levels
4.2.2. City Level
4.3. Spatial Differences
4.4. Spatial Autocorrelation
4.4.1. Global SA Analysis
4.4.2. Local SA Analysis
4.5. Driver Selection and Analysis
5. Conclusions and Recommendations
5.1. Conclusions
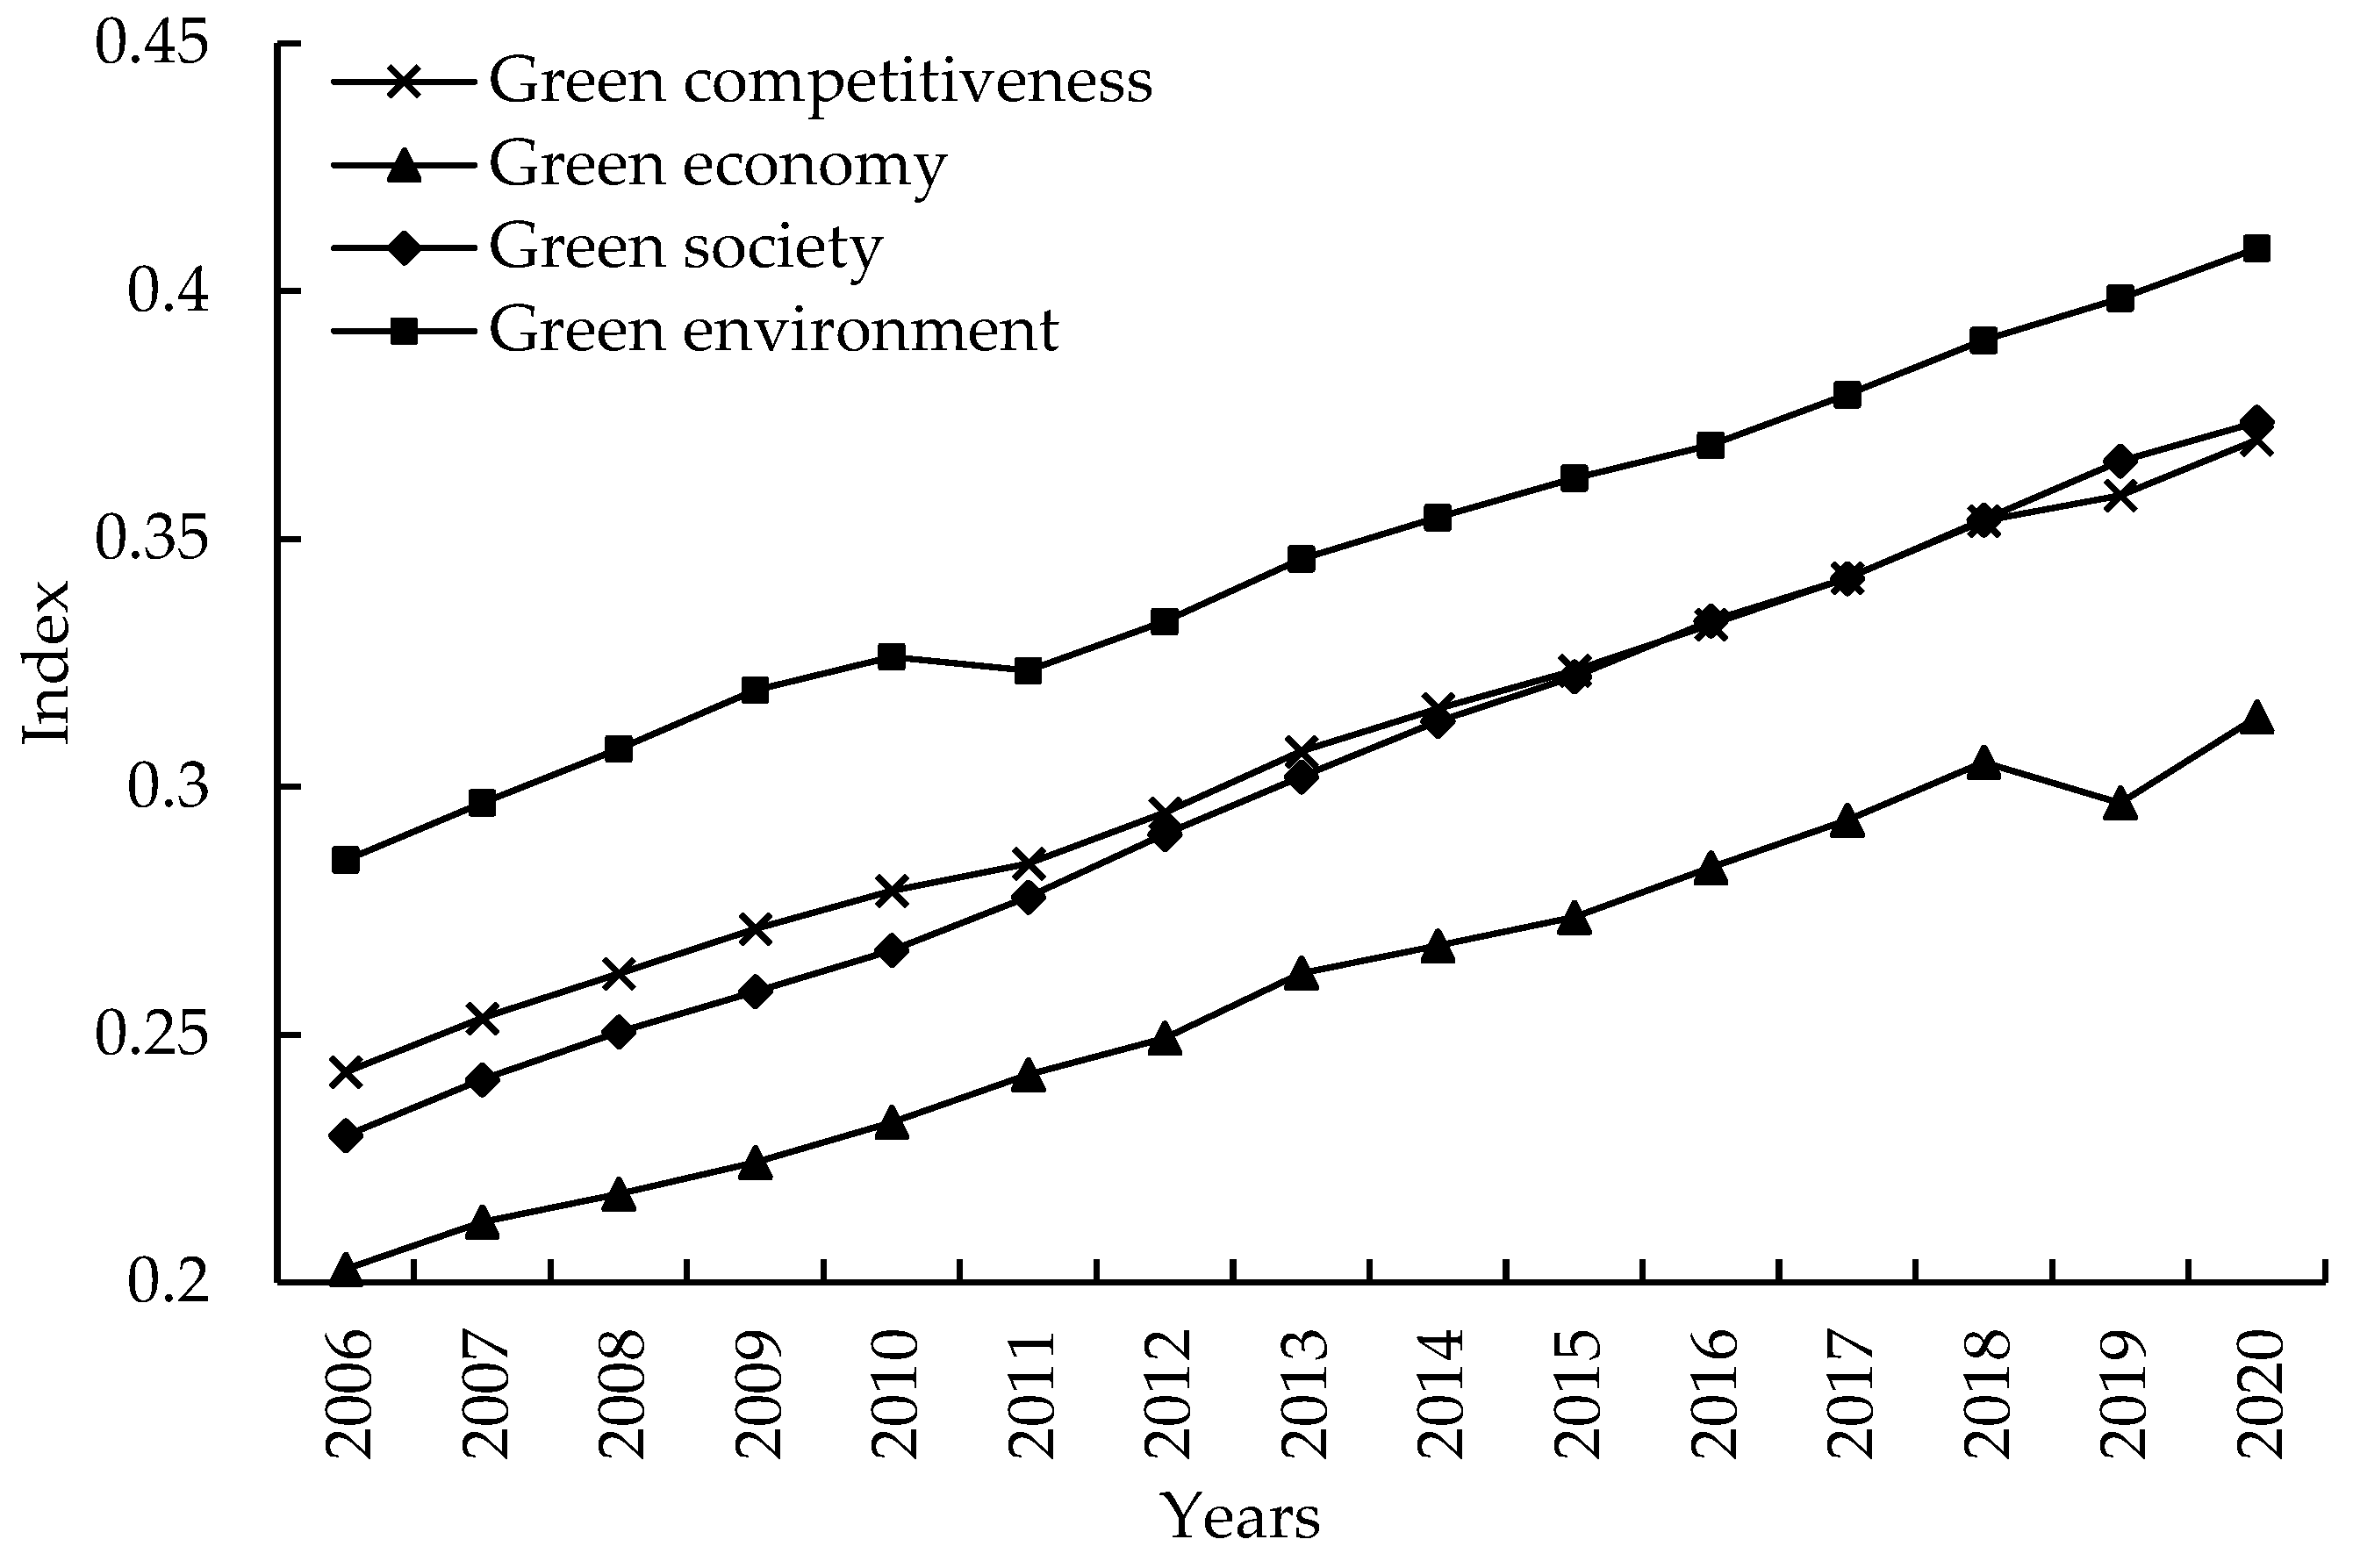
- (1)
- From a temporal perspective, the green competitiveness of cities surrounding the YR has grown steadily, and the relationship between the city’s economy, society, and environment continues to be optimized. The growth rate of the green competitiveness of these cities was slower from 2006 to 2011 and faster from 2011 to 2020, which indicates that the policies promulgated by the government, such as the “Ten Rules on Atmosphere”, have played an obvious role in improving the ecological environment of the YRB. In addition, the G-EC-I, G-SO-I, and G-EN-I all maintained an upward trend in the system, and the growth rates of the three were ranked as G-SO-I > G-EC-I > G-EN-I. The lagging development of the green economy and green society was the main reason for the lower green competitiveness, which indicates that there is an imbalance between ecological environmental protection and high-quality economic and social development in the YRB, and that there is a heavy load and a long road to achieve the coordinated development of high-quality development and ecological protection in the YRB.
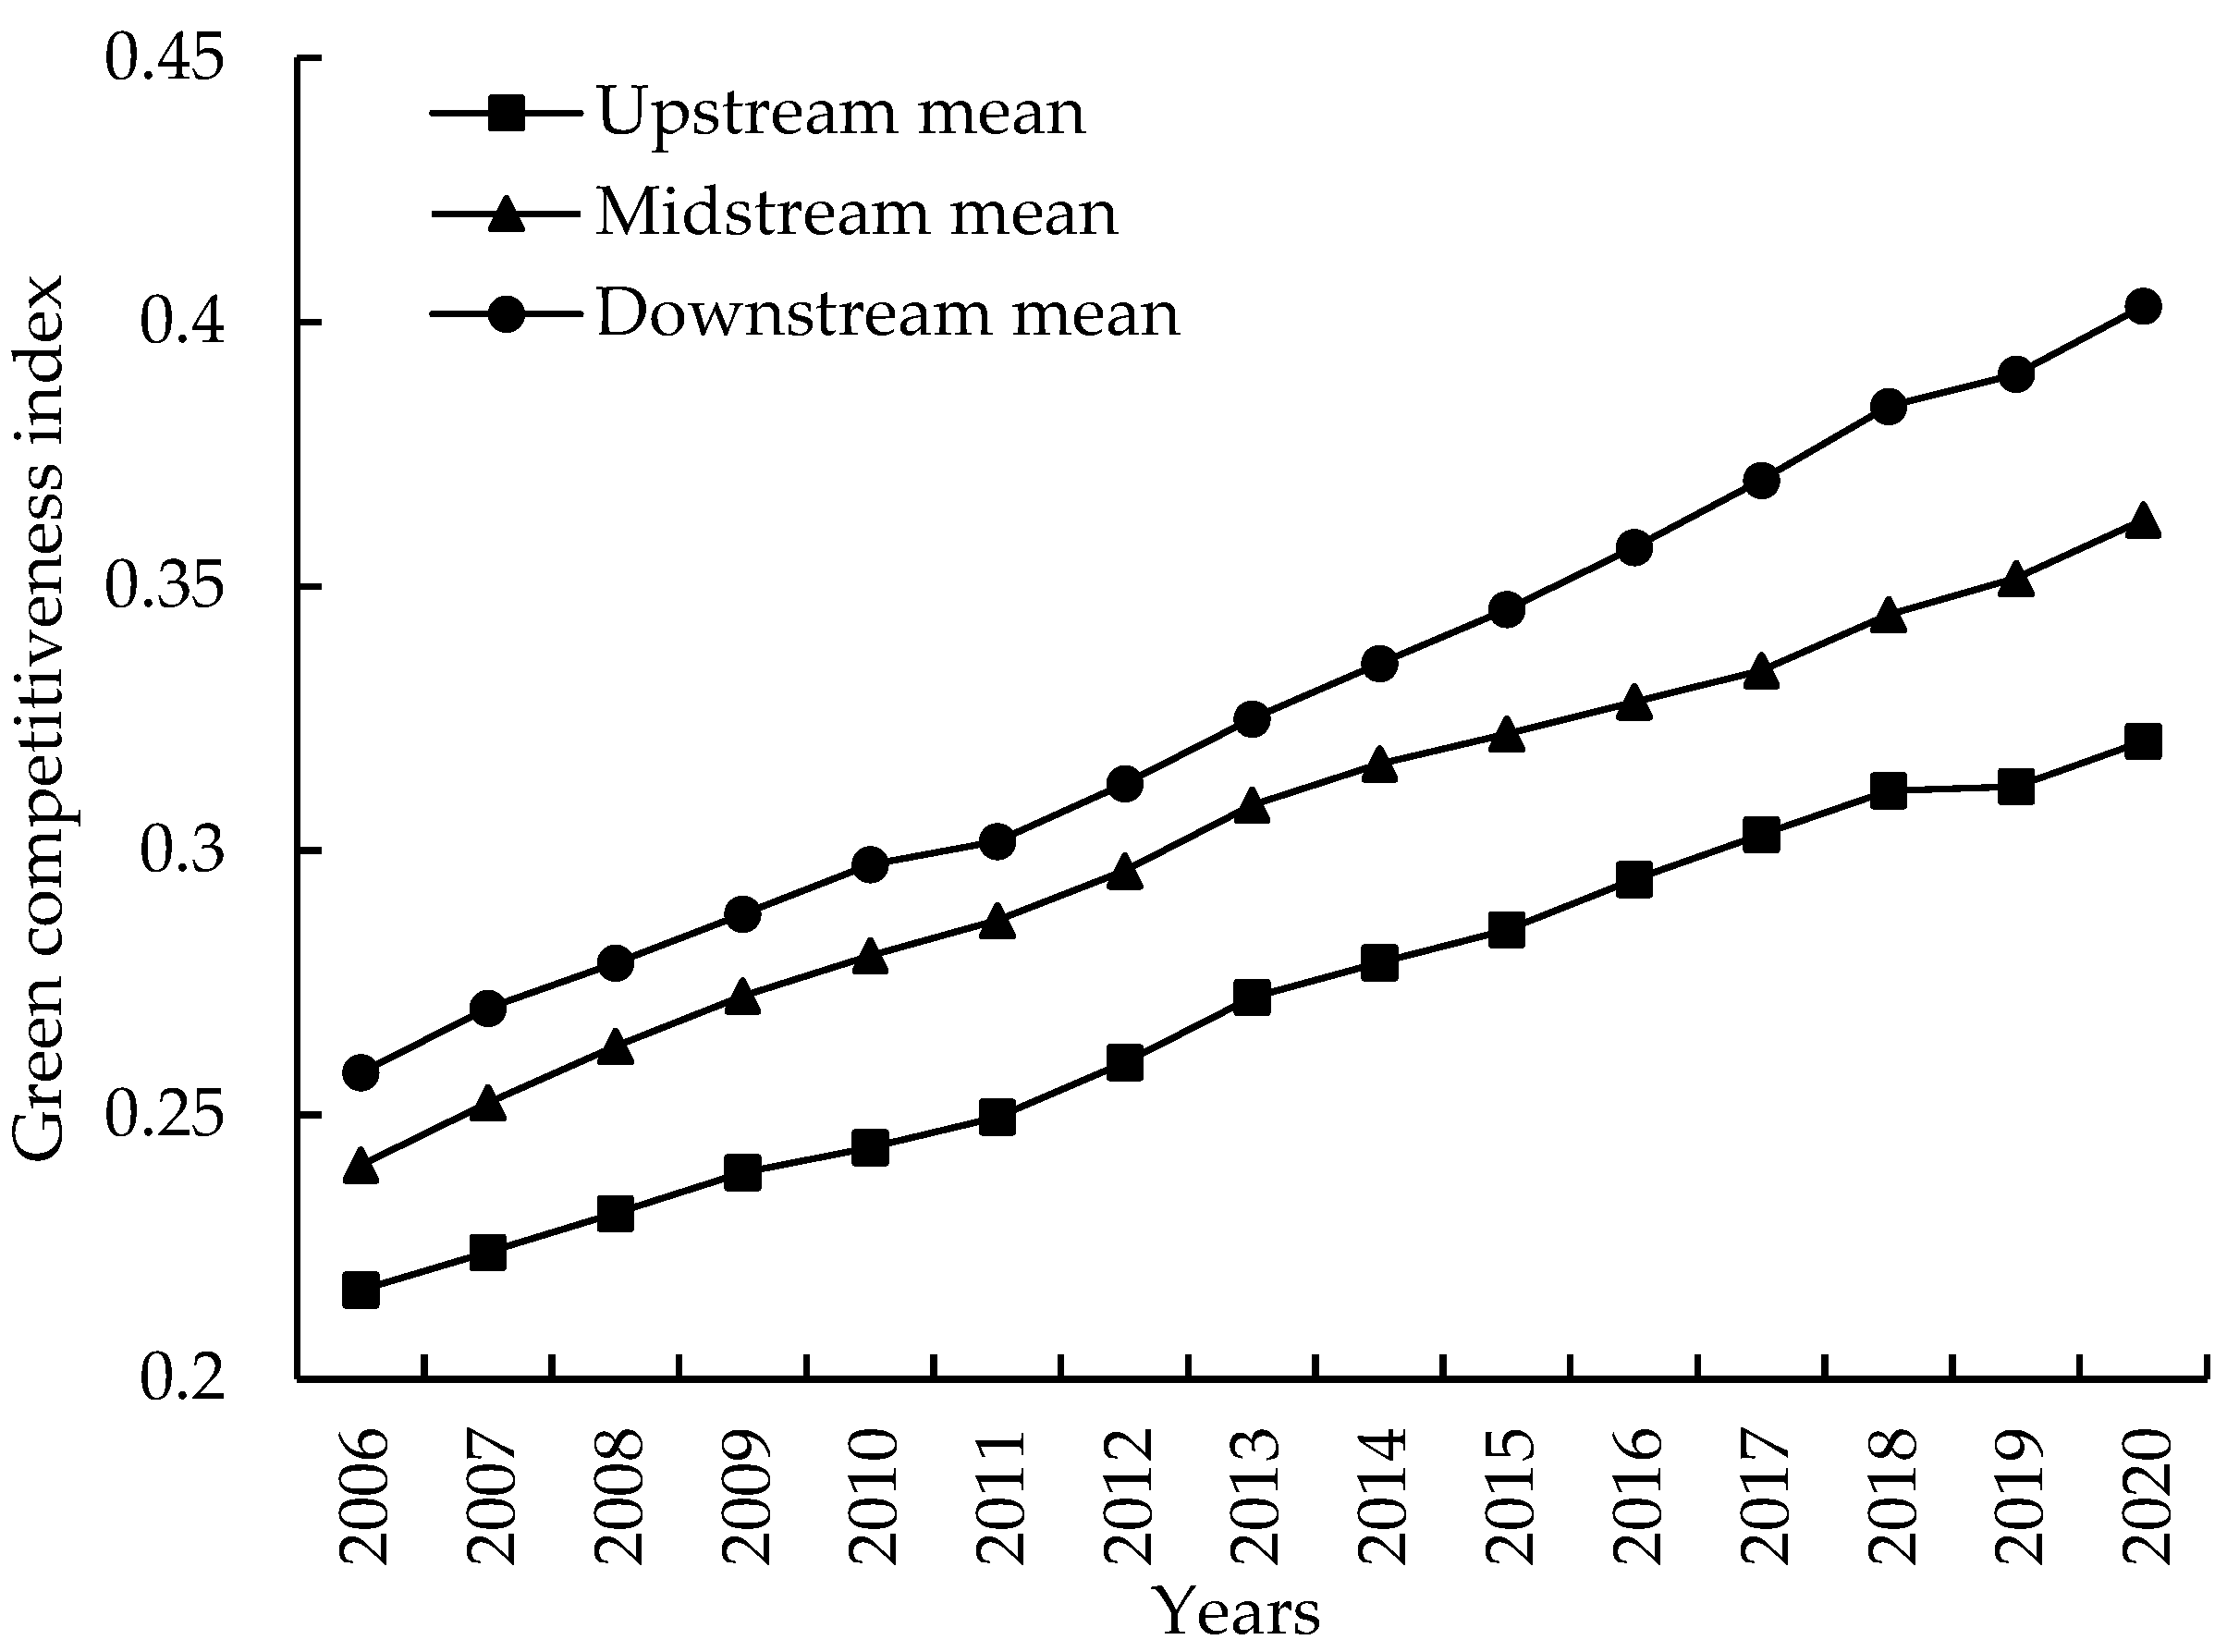
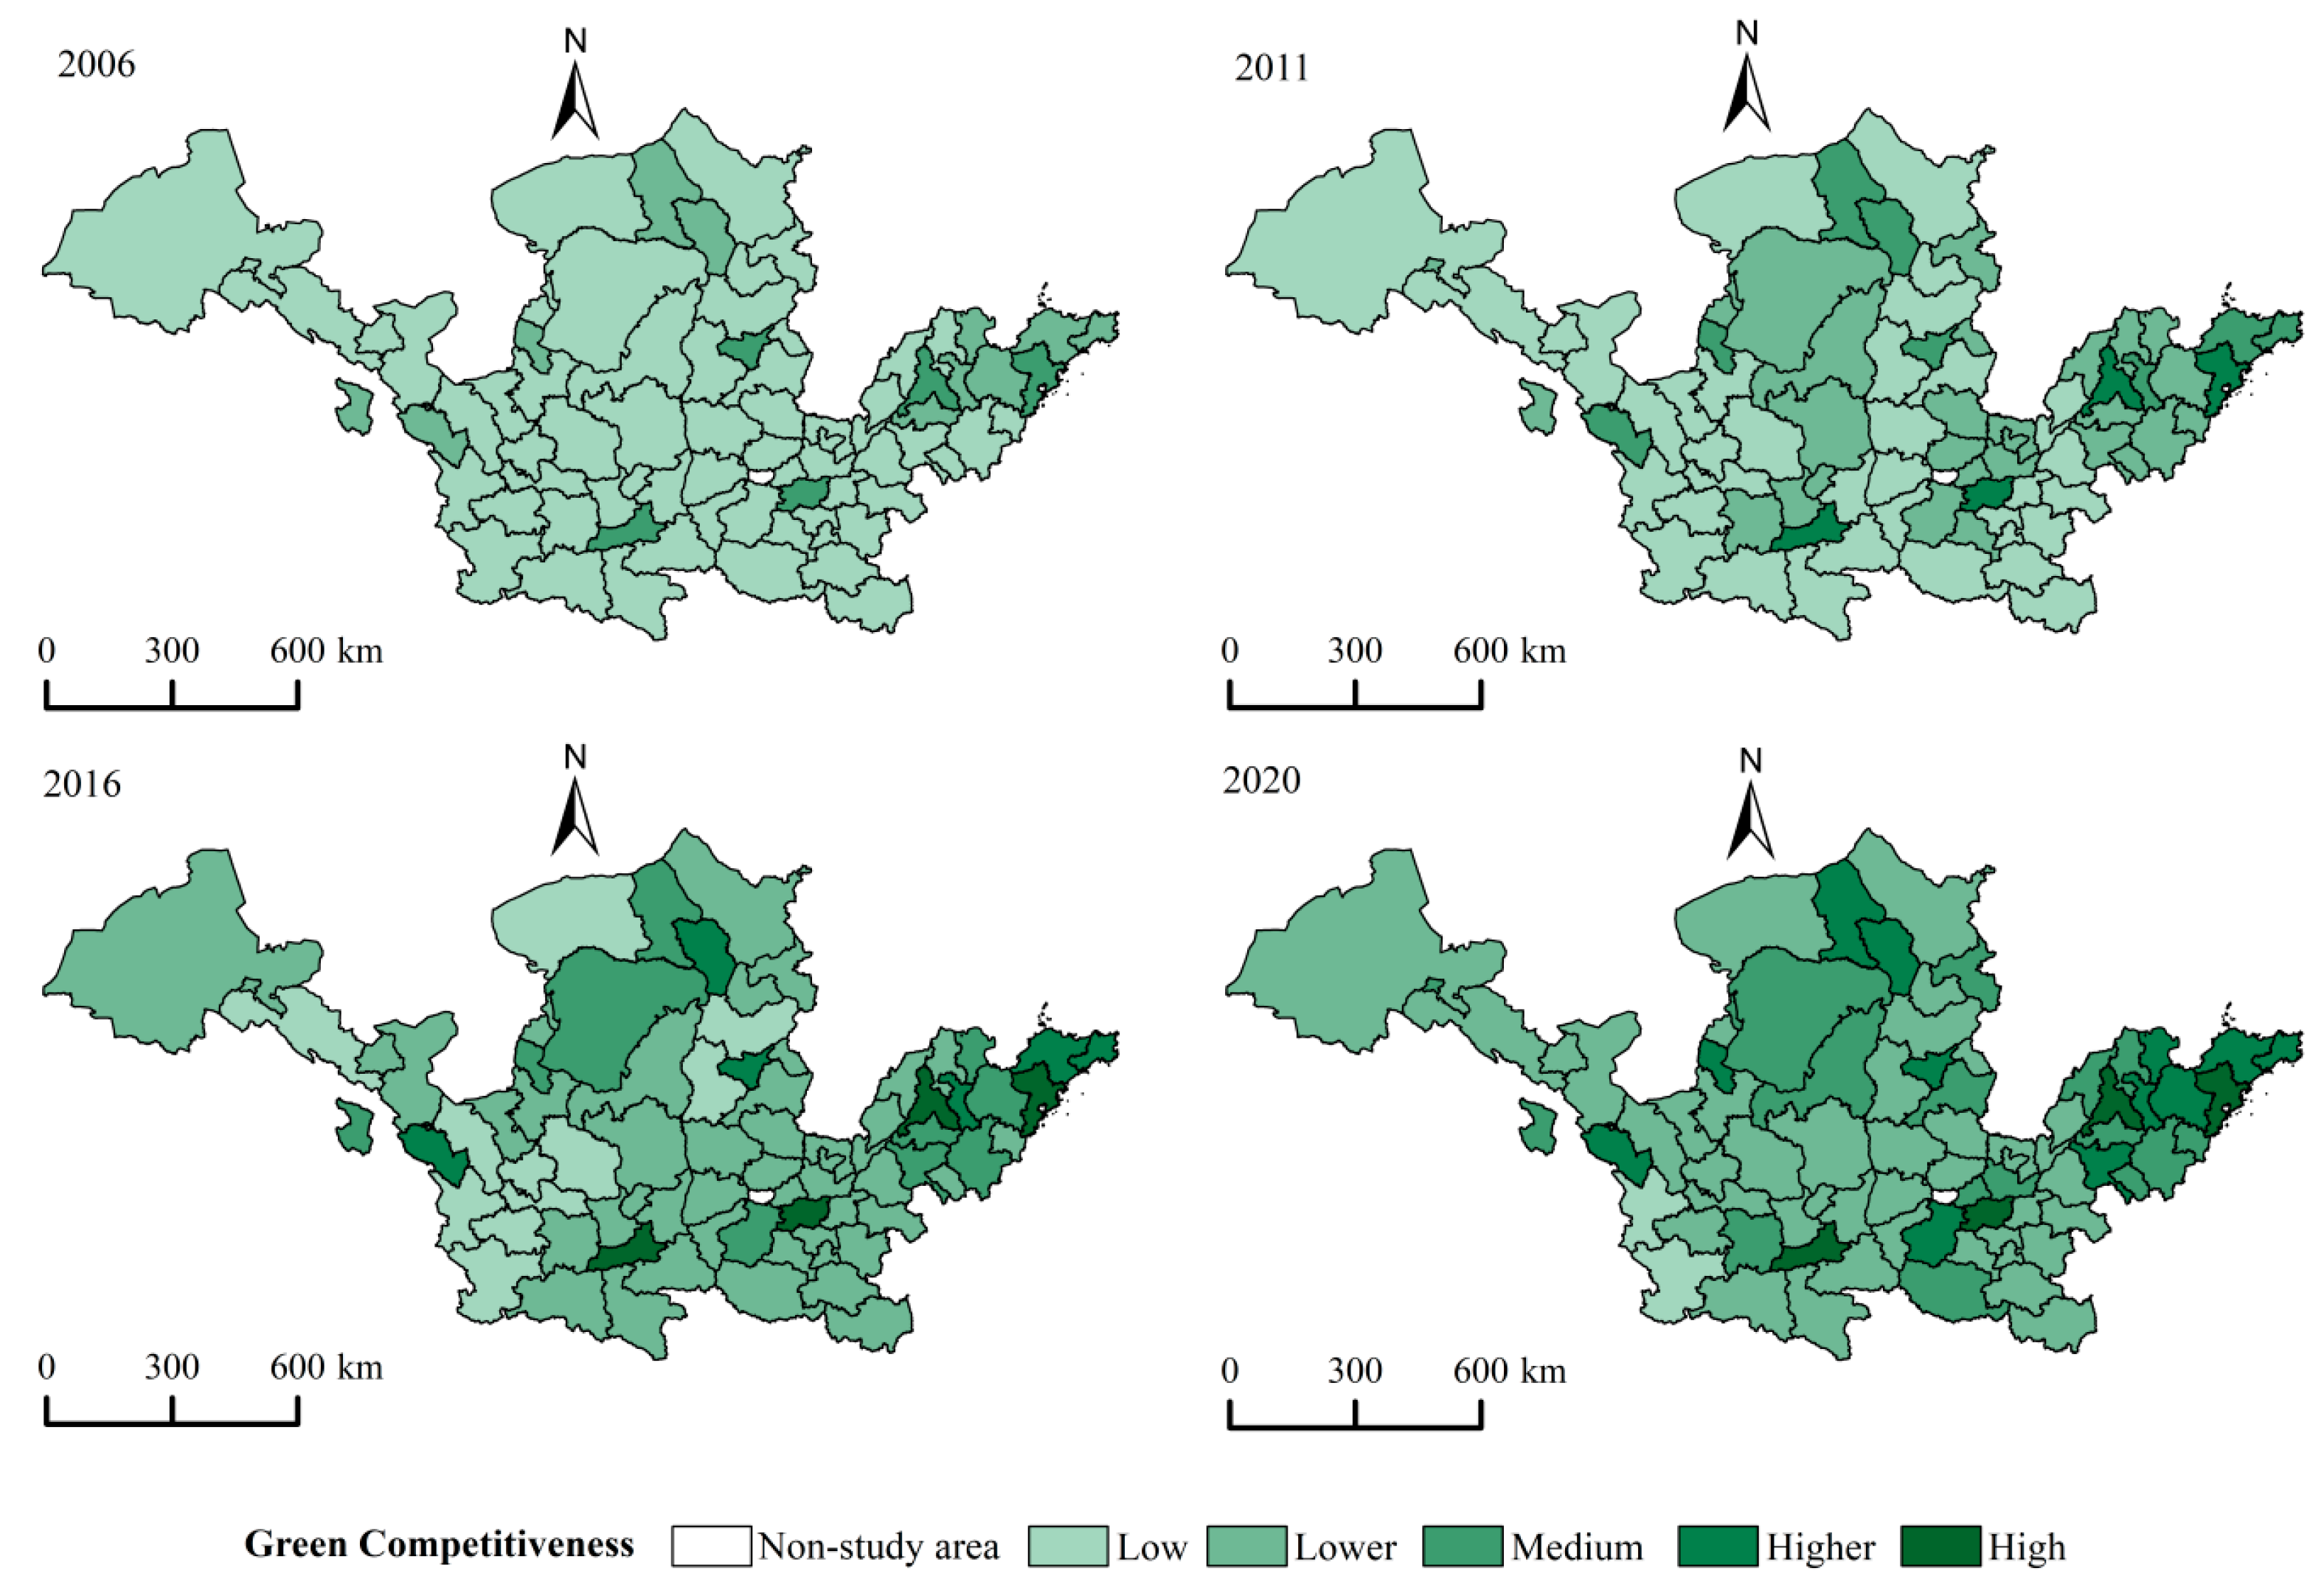
- (2)
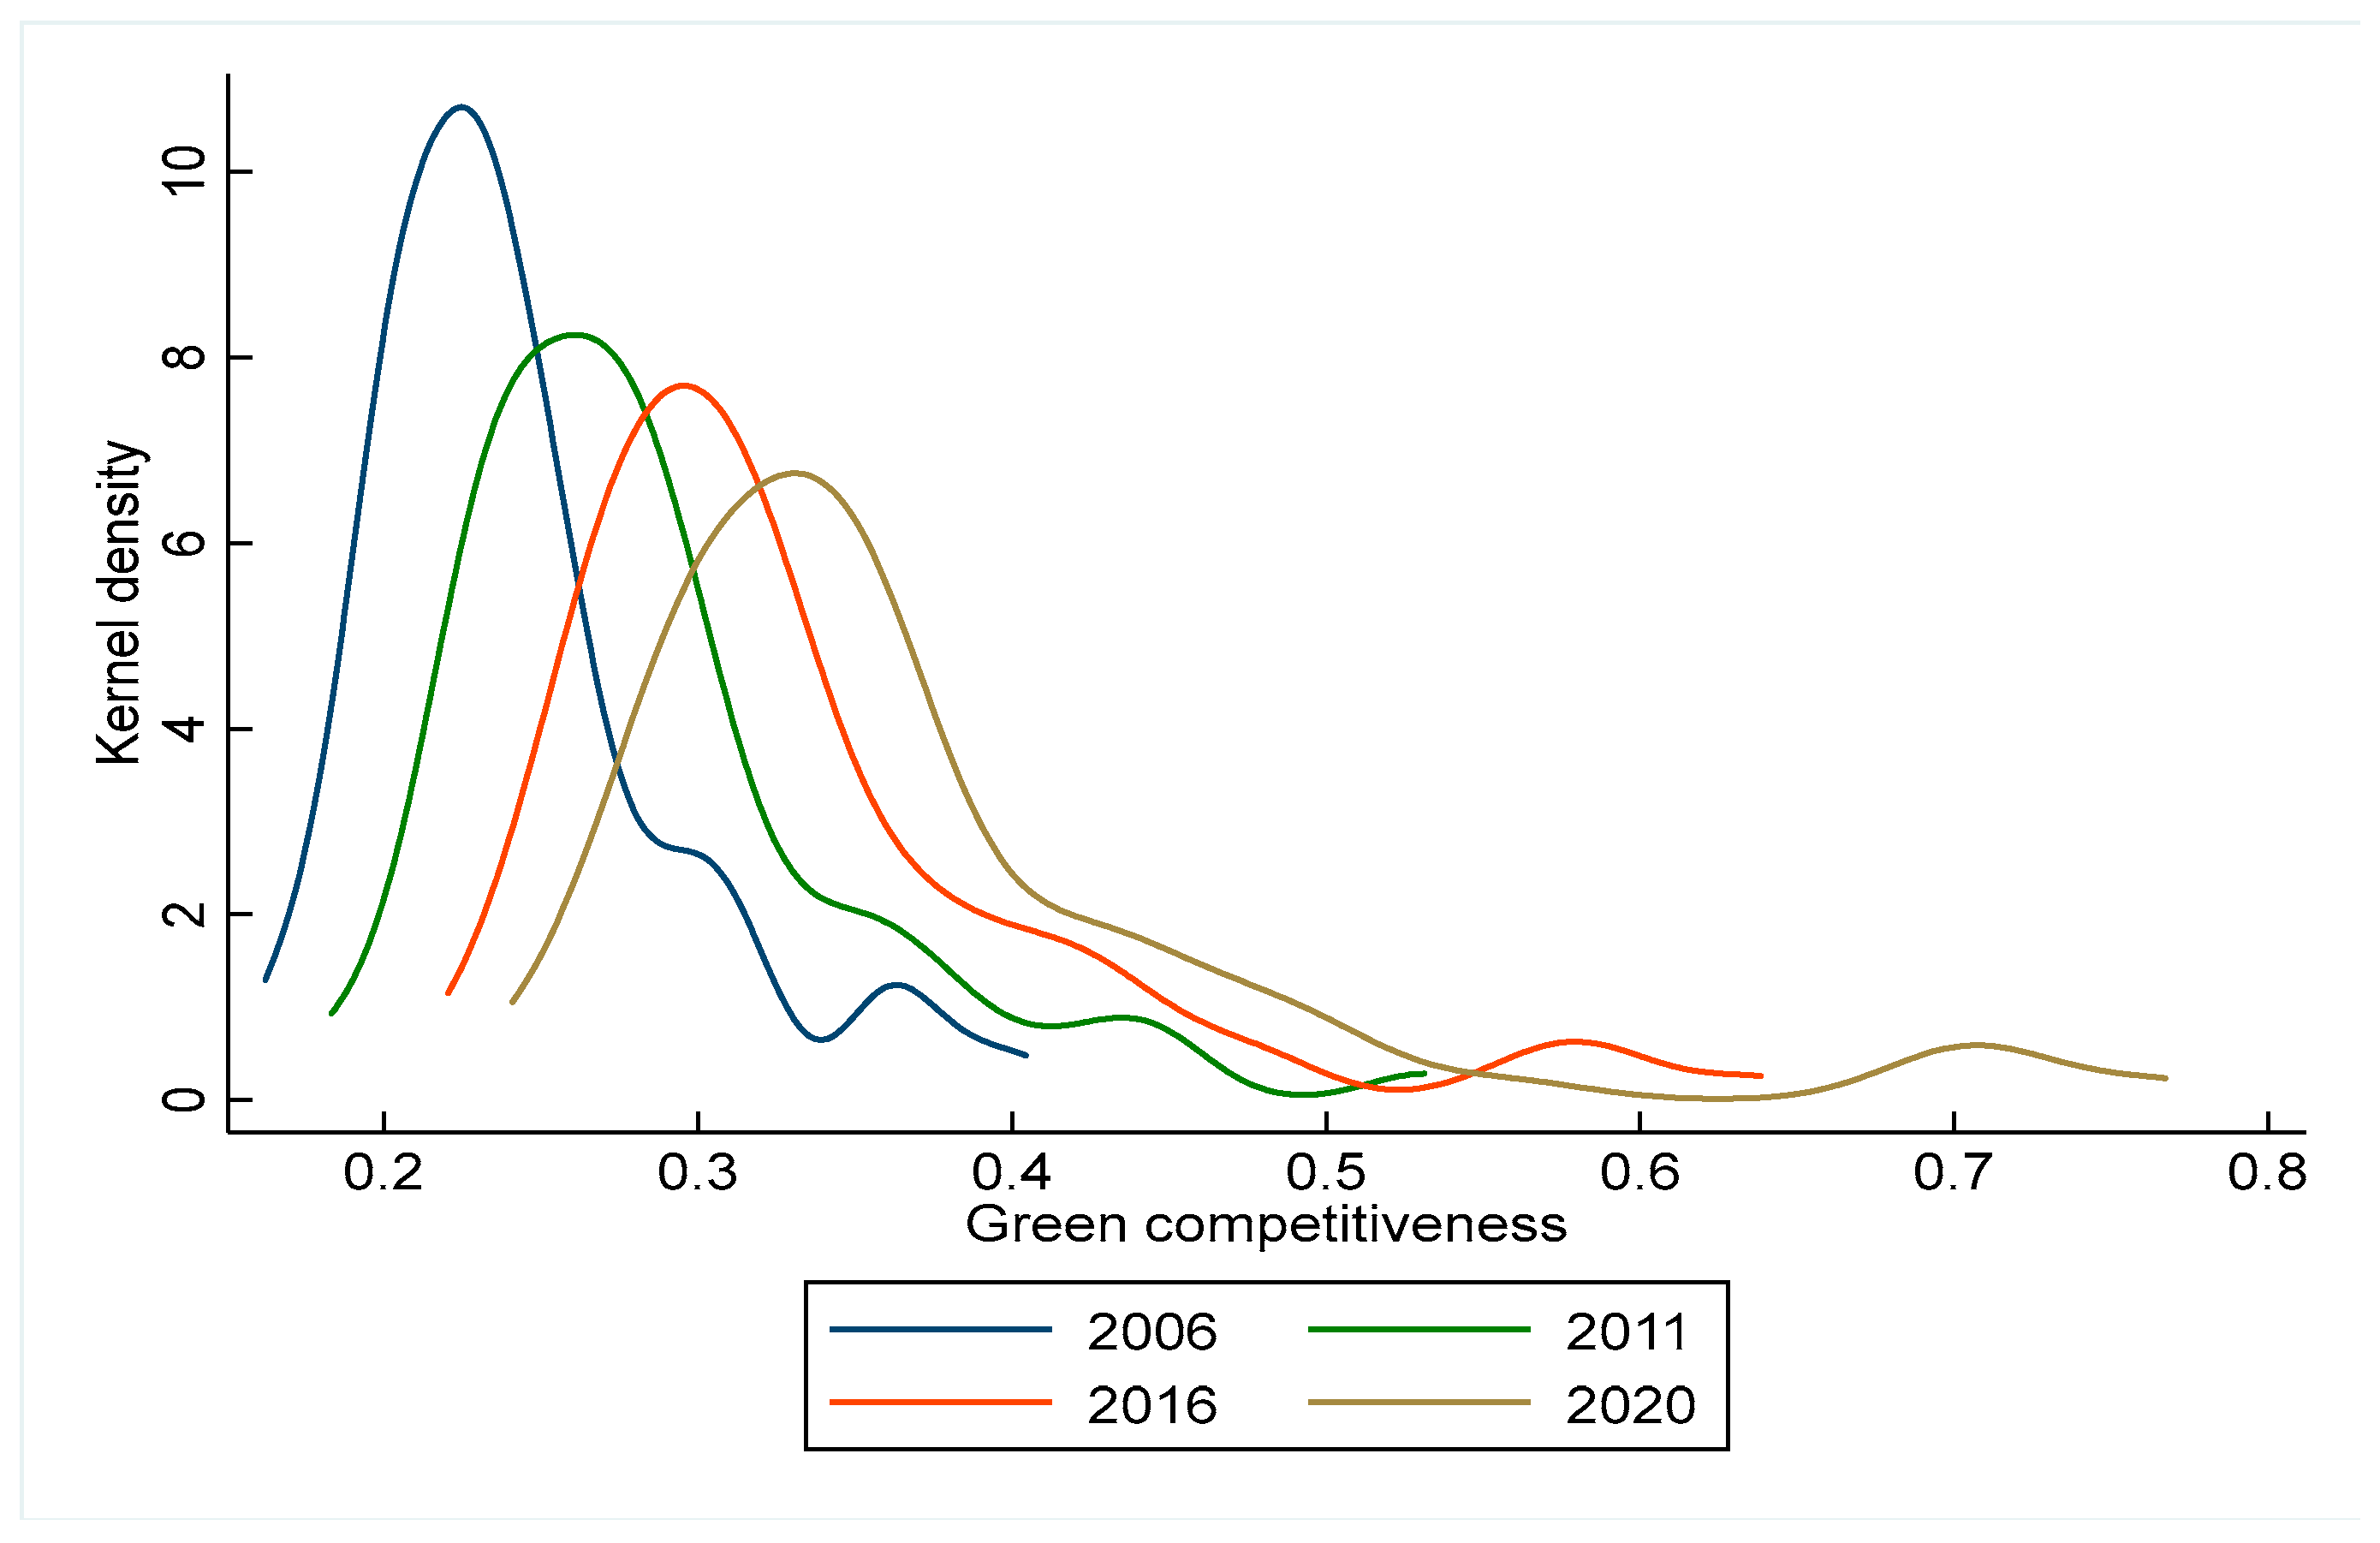
- From a spatial perspective, the spatial features of the green competitiveness of cities surrounding the YR were notably unbalanced, with a spatial distribution of downstream > midstream > upstream. Provincial capitals and sub-provincial cities such as Qingdao, Jinan, Xi’an, and Zhengzhou had higher green competitiveness, while most other cities were relatively less competitive. This is due to the obvious differences in resource endowment, geographical location, and other conditions in different regions and cities. In addition, both the absolute and relative differences in green competitiveness among cities showed a continuously widening trend, and overall differences stemmed mainly from the difference in hypervariable density between regions, which indicates that there is a lack of well-developed coordination and complementary mechanisms between upstream, midstream, and downstream areas, and between provincial capitals and other cities.
- (3)
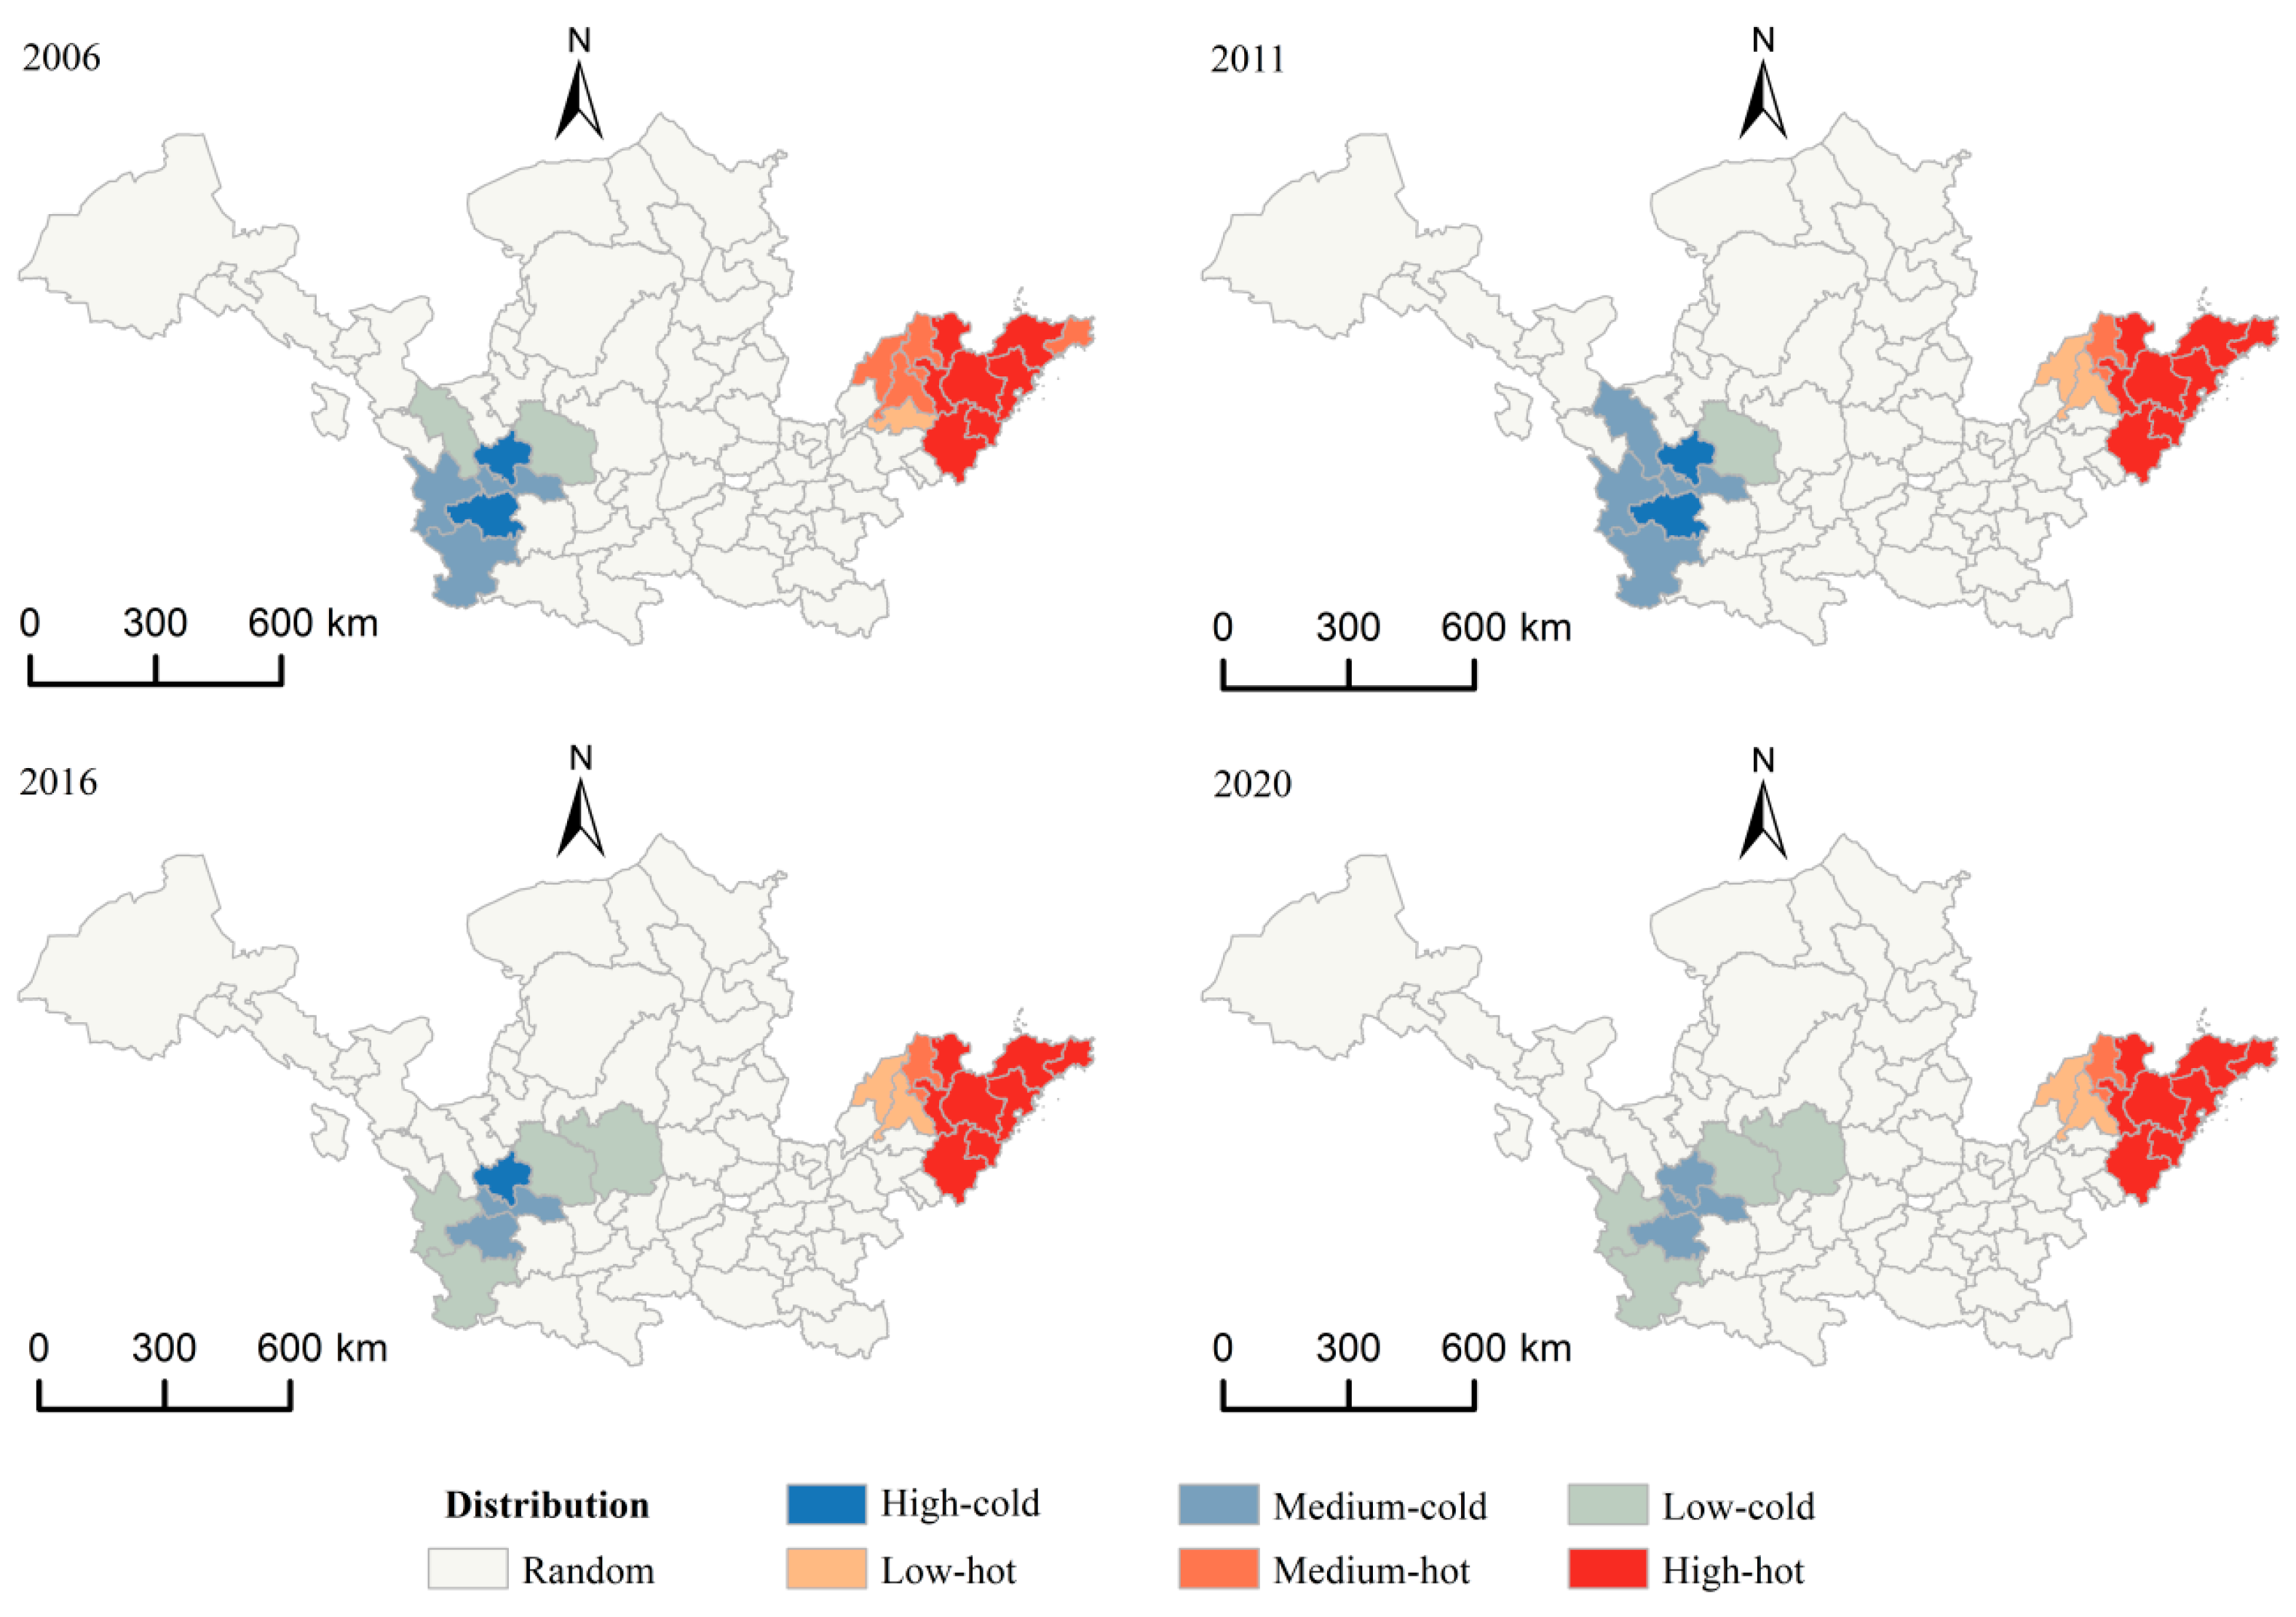
- In terms of correlation features, the green competitiveness of cities surrounding the YR was above 0 during the study period and passed the significance test. This indicates that the green competitiveness of these cities had a positive SC, but the correlation was continuously decreasing; in other words, cities with similar levels of green competitiveness are spatially clustered, but this phenomenon has changed as China’s transport infrastructure, such as roads, railways, and airways, as well as information network infrastructure, such as 5G base stations, has become increasingly sophisticated. The spatial clustering features of green competitiveness were mainly in the “cold-spot area” in southeastern Gansu and the “hot-spot area” in the Shandong Peninsula city cluster, and the area of both the cold spots and the hot spots is shrinking. The distribution of hot spots and cold spots indicates that coastal cities have greater advantages over inland cities in terms of economic development, policy benefits, openness, and communication, and are able to efficiently aggregate key elements for developing green competitiveness.
- (4)
- In terms of the drivers, the factor detection showed that the level of city infrastructure construction, the level of urbanization, and S&T innovation were the most significant drivers of the green competitiveness of cities surrounding the YR. Apart from the level of city infrastructure construction and the level of urbanization, the other factors differed to a certain extent in their effects on green competitiveness in different periods, indicating that the enhancement of the green competitiveness of cities surrounding the YR depends largely on economic and social foundations, and that cities with good foundations are more likely to enhance their green competitiveness, while those with weak foundations find it difficult to catch up through later efforts. This also confirms the importance of preemptive action to gain first-mover advantages in the face of fierce competition. The interaction of the driving factors included two types of non-linear enhancement and two-factor linear enhancement, and the interaction between different driving factors was stronger than the effect of individual factors, indicating that the driving mechanism of green competitiveness of cities surrounding the YR is complex in nature.
5.2. Recommendations
- (1)
- The coordination of the developmental relationship between the economy, society, and environment is of paramount importance in bolstering the green competitiveness of the city. Firstly, it pertains to enhancing the city’s green economic competitiveness and effectively improving the ecological sustainability of economic growth. Enterprises, for instance, ought to cultivate a subjective consciousness regarding green innovation, augment investments in R&D, and enhance the input–output ratio. This necessitates a constant optimization of the industrial structure, with a particular focus on the degree of greening in technology R&D. Therefore, economic growth can be propelled by technological progress and product differentiation. The government, on the other hand, should introduce corresponding policies that incentivize and subsidize green technological innovation. Enterprises that demonstrate a commitment to green technological innovation should be granted certain incentives and financial subsidies. This will stimulate the vibrancy of green technology innovation and alleviate the burden on corporate R&D. Simultaneously, the government should create a conducive research and innovation environment for scientific research institutes at the forefront of scientific R&D. This will help overcome the bottleneck of green technology and rectify the current situation where China’s green technology innovation is predominantly focused on traditional end-of-pipe treatment. Secondly, it is crucial to enhance the city’s green social competitiveness and promote new urbanization with green development concepts. This can be achieved through the scientific planning of the spatial layout of industrial, commercial, agricultural, residential, transportation, and ecological areas within the city. Such planning will enhance the effectiveness of multifunctional mixed land use, thereby improving the operational efficiency of city production and life while simultaneously reducing resource and energy consumption as well as carbon emissions. Additionally, an assessment of the city’s natural conditions should be conducted, and ecological parks with city-specific ecological features should be established accordingly to increase green carbon sinks. Moreover, abandoned construction land surrounding the city should be ecologically restored and transformed to facilitate soil carbon sinks. Finally, it is crucial to enhance the city’s green environmental competitiveness and strengthen green infrastructure. This involves the development of ecological landscapes, green space systems, and ecological corridors to expand the leisure space available to residents and enhance their quality of life. Concurrently, traditional infrastructure and technical equipment should be upgraded and transformed. High-emission and energy-consuming production processes and equipment should be transitioned towards greener alternatives. Advanced green technological achievements should be applied to the green transformation of infrastructure, facilitated by the national comprehensive service platform for the transformation of ecological and environmental R&D achievements. This will expedite the process of infrastructure greening.
- (2)
- Promotion of synergistic city development and the reduction of regional gaps in city green competitiveness are of paramount importance. Firstly, it is necessary to acknowledge the significant spatial differences in the green competitiveness of cities surrounding the YR. Therefore, it is necessary to foster exchanges and cooperation in green initiatives among cities and regions. Emphasizing the leadership role of the downstream region, particularly the Shandong Peninsular city cluster, in propelling the midstream and upstream regions is crucial. Additionally, bolstering the supportive role of the midstream region in facilitating green development across the basin and enhancing the capacity of the upstream regions to learn and emulate are essential. Simultaneously, harnessing the synergistic driving force of city clusters and metropolitan areas, accurately positioning city functions, and harnessing the radiating effect of central cities such as Qingdao, Jinan, Zhengzhou, and Xi’an are necessitated. By expanding knowledge and technology spillovers, the aim is to narrow the regional gaps in city green competitiveness. Secondly, it is critical to align with the economic and social development realities and natural resource conditions of each region. This can be achieved by implementing localized and time-sensitive measures to address shortcomings, for instance, enhancing the R&D capacity of green core technologies in downstream regions to elevate the upper limit of city green competitiveness. Moreover, transitioning the economic development model of midstream regions from resource-intensive industries to innovation-driven and eco-friendly industries is vital. Thus, accordingly, optimizing the industrial structure of upstream regions, increasing the proportion of tertiary industries, and vigorously promoting the development of eco-tourism and other lifestyle services are key steps towards transforming ecological advantages into economic advantages.
Author Contributions
Funding
Institutional Review Board Statement
Informed Consent Statement
Data Availability Statement
Conflicts of Interest
References
- Li, C.; Song, L. Regional differences and spatial convergence of green development in China. Sustainability 2022, 14, 8511. [Google Scholar] [CrossRef]
- Xi, J. Speech at the symposium on ecological protection and high-quality development of the Yellow River Basin. Seeking Truth 2019, 4–6. Available online: http://www.qstheory.cn/dukan/qs/2019-10/15/c_1125102357.htm (accessed on 18 August 2023).
- Cheng, X.; Long, R.; Chen, H. Obstacle diagnosis of green competition promotion: A case study of provinces in China based on catastrophe progression and fuzzy rough set methods. Environ. Sci. Pollut. Res. 2018, 25, 4344–4360. [Google Scholar] [CrossRef]
- Jiang, X.; Zhou, Y. Establishment of competitiveness evaluation index system of manufacturing enterprises based on the circular economy. Sci. Technol. Manag. Res. 2012, 32, 84–87. [Google Scholar]
- Yuan, Q.; Yang, D.; Yang, F.; Luken, R.; Saieed, A.; Wang, K. Green industry development in China: An index based assessment from perspectives of both current performance and historical effort. J. Clean Prod. 2020, 250, 119457. [Google Scholar] [CrossRef]
- Cheng, X.; Long, R.; Chen, H.; Li, W. Green competitiveness evaluation of provinces in China based on correlation analysis and fuzzy rough set. Ecol. Indic. 2018, 85, 841–852. [Google Scholar] [CrossRef]
- Zhao, D.; Wang, Q. System dynamics simulation and prediction of regional economy green competitiveness in Gansu province. Sci. Technol. Manag. Res. 2020, 40, 206–215. [Google Scholar]
- Huang, M.; Yang, X. Evaluation of the competitiveness of the global green economy and the path to enhance it—The G20 as an example. Rev. Econ. Res. 2016, 27–36. [Google Scholar] [CrossRef]
- Xue, H.; Lan, X.; Zhang, Q.; Liang, H.; He, Z. Assessment of the green development level for participating countries in the Belt and Road initiative. Ann. Oper. Res. 2023, 326, 125. [Google Scholar] [CrossRef]
- Chen, Y.; Song, X.; Huang, X.; Zhang, K. Study on evaluation index system of provincial green competitiveness. J. Jiangxi Norm. Univ. Philos. Soc. Sci. Ed. 2016, 49, 57–65. [Google Scholar]
- Zhang, H.; Geng, Z.; Yin, R.; Zhang, W. Regional differences and convergence tendency of green development competitiveness in China. J. Clean Prod. 2020, 254, 119922. [Google Scholar] [CrossRef]
- Long, R.; Li, H.; Wu, M.; Li, W. Dynamic evaluation of the green development level of China’s coal-resource-based cities using the TOPSIS method. Resour. Policy 2021, 74, 102415. [Google Scholar] [CrossRef]
- Tao, Z.; Xiang, G. Empirical measurement and evaluation of rural green development: Take Hunan Province, China as an example. Environ. Earth Sci. 2022, 81, 1–9. [Google Scholar] [CrossRef]
- Wang, X.; Zhao, G.; Xiong, H. The temporal-spatial evolution and driving mechanism of rural green development in China. Pol. J. Environ. Stud. 2022, 31, 5313–5327. [Google Scholar] [CrossRef] [PubMed]
- Wang, Y.; Hu, H.; Dai, W.; Burns, K. Evaluation of industrial green development and industrial green competitiveness: Evidence from Chinese urban agglomerations. Ecol. Indic. 2021, 124, 107371. [Google Scholar] [CrossRef]
- Liang, K.; Luo, L. Measurement of China’s green development level and its spatial differentiation in the context of carbon neutrality. PLoS ONE 2023, 18, e284207. [Google Scholar] [CrossRef] [PubMed]
- Li, J.; Li, Y.; Zhang, J. Measurement and evolution analysis of green competitiveness index of three major urban agglomerations. Stat. Decis. 2022, 38, 93–97. [Google Scholar]
- Cheng, X.; Long, R.; Chen, H.; Li, Q. Coupling coordination degree and spatial dynamic evolution of a regional green competitiveness system—A case study from China. Ecol. Indic. 2019, 104, 489–500. [Google Scholar] [CrossRef]
- Ma, X.; Zhang, R.; Ruan, Y. How to evaluate the level of green development based on entropy weight TOPSIS: Evidence from China. Int. J. Environ. Res. Public Health 2023, 20, 1707. [Google Scholar] [CrossRef]
- Li, Z.; Zheng, K.; Zhong, Q. Comprehensive evaluation and spatial-temporal pattern of green development in Hunan province, China. Sustainability 2022, 14, 6819. [Google Scholar] [CrossRef]
- Liu, X.; Zhang, W.; Liu, X.; Li, H. The impact assessment of FDI on industrial green competitiveness in China: Based on the perspective of FDI heterogeneity. Environ. Impact Assess. Rev. 2022, 93, 106720. [Google Scholar] [CrossRef]
- Lee, J. International comparison of Korea’s competitiveness for green transportation. J. Transport Res. 2009, 16, 51–66. [Google Scholar]
- Zhang, J.; Li, F.; Ding, X. Will green finance promote green development: Based on the threshold effect of R&D investment. Environ. Sci. Pollut. Res. 2022, 29, 60232–60243. [Google Scholar]
- Ye, T.; Xiang, X.; Ge, X.; Yang, K. Research on green finance and green development based eco-efficiency and spatial econometric analysis. Sustainability 2022, 14, 2825. [Google Scholar] [CrossRef]
- Xu, G.; Chang, H.; Yang, H.; Schwarz, P. The influence of finance on China’s green development: An empirical study based on quantile regression with province-level panel data. Environ. Sci. Pollut. Res. 2022, 29, 71033–71046. [Google Scholar] [CrossRef] [PubMed]
- Chen, C.; Han, J.; Fan, P. Measuring the level of industrial green development and exploring its influencing factors: Empirical evidence from China’s 30 provinces. Sustainability 2016, 8, 153. [Google Scholar] [CrossRef]
- Feng, Z.; Chen, W. Environmental regulation, green innovation, and industrial green development: An empirical analysis based on the Spatial Durbin Model. Sustainability 2018, 10, 223. [Google Scholar] [CrossRef]
- Liao, B.; Li, L. Spatial division of labor, specialization of green technology innovation process and urban coordinated green development: Evidence from China. Sustain. Cities Soc. 2022, 80, 103778. [Google Scholar] [CrossRef]
- Agyabeng-Mensahy, Y.; Tang, L. The relationship among green human capital, green logistics practices, green competitiveness, social performance and financial performance. J. Manuf. Technol. Manag. 2021, 32, 1377–1398. [Google Scholar] [CrossRef]
- Wang, N.; Zhang, S.J.; Wang, W. Impact of environmental innovation strategy on green competitiveness: Evidence from China. Int. J. Environ. Res. Public Health 2022, 19, 5879. [Google Scholar] [CrossRef]
- Guan, W. Research on the evaluation of enterprises’ green competitiveness from the perspective of circular economy: Based on the empirical analysis of 16 manufacturing enterprises in Huaibei city. Enterp. Econ. 2012, 31, 24–27. [Google Scholar]
- Ye, J. On the circular economy model and the cultivation of the core competitiveness of agricultural enterprises. Rural. Econ. 2006, 104–106. [Google Scholar] [CrossRef]
- Chen, S.; Yang, Y.; Wu, T. Research on the impact of digital transformation on green development of manufacturing enterprises. Front. Energy Res. 2022, 10. [Google Scholar] [CrossRef]
- Zhu, B.; Zhang, M.; Zhou, Y.; Wang, P.; Sheng, J.; He, K.; Wei, Y.; Xie, R. Exploring the effect of industrial structure adjustment on interprovincial green development efficiency in China: A novel integrated approach. Energy Policy 2019, 134, 110946. [Google Scholar] [CrossRef]
- Chen, B.; Xu, X.; Zhang, Y.; Wang, J. The temporal and spatial patterns and contributing factors of green development in the Chinese service industry. Front. Environ. Sci. 2022, 10, 1049827. [Google Scholar] [CrossRef]
- Xiao, C.; Sun, J. Institutional governance influence mechanism and model of regional green development in China. Sci. Program. 2022, 2022, 2169684. [Google Scholar] [CrossRef]
- Feng, Z.; Cheng, S.; Qu, G.; Cui, Y.; Ye, J. Research on theoretical mechanism and promotion path of digital economy driving China’s green development under “Double Carbon” background. Int. J. Environ. Res. Public Health 2023, 20, 437. [Google Scholar] [CrossRef] [PubMed]
- Yuan, H.; Zou, L.; Feng, Y.; Huang, L. Does manufacturing agglomeration promote or hinder green development efficiency? Evidence from Yangtze River Economic Belt, China. Environ. Sci. Pollut. Res. 2022, 30, 81801–81822. [Google Scholar] [CrossRef] [PubMed]
- Guo, Y.; Tong, L.; Mei, L. The effect of industrial agglomeration on green development efficiency in Northeast China since the revitalization. J. Clean Prod. 2020, 258, 120584. [Google Scholar] [CrossRef]
- Li, W.; Zhang, Y.; Yang, C.; Gong, W.; Wang, C.; Zhang, R. Does producer services agglomeration improve urban green development performance of the Yangtze River Economic Belt in China? Ecol. Indic. 2022, 145, 109581. [Google Scholar] [CrossRef]
- Li, Z.; Hou, Y.; Cao, J.; Ding, Y.; Yuan, X. What drives green development in China: Public pressure or the willingness of local government? Environ. Sci. Pollut. Res. 2022, 29, 5454–5468. [Google Scholar] [CrossRef] [PubMed]
- Song, J.; Zhou, H.; Gao, Y.; Guan, Y. Digital inclusive finance, human capital and inclusive green development—Evidence from China. Sustainability 2022, 14, 9922. [Google Scholar] [CrossRef]
- Zou, X.; Lei, C.; Gao, K.; Hu, C. Impact of environmental decentralization on regional green development. J. Environ. Dev. 2019, 28, 412–441. [Google Scholar] [CrossRef]
- Hu, S.; Zeng, G.; Cao, X.; Yuan, H.; Chen, B. Does technological innovation promote green development? A case study of the Yangtze River Economic Belt in China. Int. J. Environ. Res. Public Health 2021, 18, 6111. [Google Scholar] [CrossRef] [PubMed]
- Cui, H.; Liu, Z. Spatial-temporal pattern and influencing factors of the urban green development efficiency in Jing-Jin-Ji region of China. Pol. J. Environ. Stud. 2021, 30, 1079–1093. [Google Scholar] [CrossRef]
- Shang, Y.; Lyu, G.; Mi, Z. Green technology transfer, environmental regulation, and regional green development chasm: Based on the empirical evidence from Yangtze River Delta. Int. J. Environ. Res. Public Health 2022, 19, 13925. [Google Scholar] [CrossRef]
- Yuan, K.; Hu, B.; Niu, T.; Zhu, B.; Zhang, L.; Guan, Y.; Xunjie, G.; Gou, X. Competitiveness evaluation and obstacle factor analysis of urban green and low-carbon development in Beijing-Tianjin-Hebei cities. Math. Probl. Eng. 2022, 2022, 1–15. [Google Scholar] [CrossRef]
- Xu, Z.; Ci, F. Spatial-temporal characteristics and driving factors of coupling coordination between the digital economy and low-carbon development in the Yellow River Basin. Sustainability 2023, 15, 2731. [Google Scholar] [CrossRef]
- Dagum, C. A new approach to the decomposition of the Gini Income Inequality Ratio. Empir. Econ. 1997, 22, 515–531. [Google Scholar] [CrossRef]
- Chen, H.; Zhang, X.; Wu, R.; Cai, T. Revisiting the environmental Kuznets curve for city-level CO2 emissions: Based on corrected NPP-VIIRS nighttime light data in China. J. Clean Prod. 2020, 268, 121575. [Google Scholar] [CrossRef]
- Shi, D.; Li, S. Emissions trading system and energy use efficiency--Measurements and empirical evidence for cities at and above the prefecture level. China Ind. Econ. 2020, 4, 5–23. [Google Scholar]
- Song, M.; Hao, X.; Liu, J. Study on the spatial and temporal evolutionary characteristics of carbon balance and the decoupling effect of economic growth in the Yellow River Basin. Urban Probl. 2021, 312, 91–103. [Google Scholar]
- Li, S.; Liang, W.; Lv, Y.; Ji, Q.; Yan, J.; Lan, Z. Decoupling relationship and driving effect between economic development and eco-environmental pressure in the Yellow River Basin. Acta Ecologica Sinica 2023, 15, 9385. [Google Scholar]

| Target Level | System Level | Guideline Level | Indicator Name |
|---|---|---|---|
| Green competitiveness | Economic system | Economic foundation | GDP per head (RMB 10,000/person) |
| Percentage of production value in the secondary and tertiary sectors (%) | |||
| Regional fiscal revenue per head (RMB) | |||
| Investment in fixed assets (RMB 10,000) | |||
| Science and technology expenditure as a percentage of public finance expenditure (%) | |||
| The amount of people employed in science and technology and services (persons) | |||
| Number of green patents granted per million population (cases/million people) | |||
| Economic efficiency | Industrial wastewater emissions per unit GDP (tons/RMB 10,000) | ||
| Domestic waste generation per unit GDP (tons/RMB 10,000) | |||
| Energy consumption per unit GDP (10,000 tons of standard coal/RMB 10,000) | |||
| CO2 emissions per unit GDP (tons/RMB 10,000) | |||
| Industrial sulfur dioxide emissions per unit GDP (tons/ RMB 10,000) | |||
| Water consumption per unit GDP (tons/ RMB 10,000) | |||
| Land use per unit GDP (tons/ RMB 10,000) | |||
| Social system | Social foundation | Length of natural gas supply pipeline (km) | |
| Number of buses per 10,000 people (standard units) | |||
| Number of hospital beds (beds) | |||
| Public library collections (10,000 volumes) | |||
| Number of university students per 10,000 population (persons) | |||
| City road area (10,000 m2) | |||
| Social efficiency | City disposable income per head (RMB 10,000) | ||
| City registered unemployment rate (%) | |||
| Urbanization rate (%) | |||
| Carbon emissions per head (tons/person) | |||
| Gas penetration rate (%) | |||
| Engel coefficient (/) | |||
| Variations in income levels between city and rural areas (/) | |||
| Environmental system | Environmental foundation | Forest coverage (%) | |
| Greening coverage of built-up areas (%) | |||
| City green space (hectares) | |||
| Length of city drainage pipes (km) | |||
| Public toilets (seats) | |||
| Total number of vehicles and equipment dedicated to amenities and sanitation (units) | |||
| Environmental efficiency | Annual percentage of days with air quality at level 2 and above (%) | ||
| Share of clean energy in energy consumption (%) | |||
| Industrial water reuse rate (%) | |||
| The integrated utilization rate of industrial solid waste (%) | |||
| City domestic wastewater treatment rate (%) | |||
| City waste disposal rate (%) | |||
| City road sweeping and cleaning area (m2) |
| Year | 2006 | 2011 | 2016 | 2020 | Average Value | |
|---|---|---|---|---|---|---|
| Overall differences | 0.106 | 0.115 | 0.123 | 0.132 | 0.119 | |
| Intra-regional differences | Upstream | 0.103 | 0.110 | 0.111 | 0.103 | 0.109 |
| Midstream | 0.102 | 0.112 | 0.116 | 0.125 | 0.113 | |
| Downstream | 0.088 | 0.097 | 0.113 | 0.126 | 0.105 | |
| Inter-regional differences | Midstream/upstream | 0.108 | 0.119 | 0.119 | 0.121 | 0.118 |
| Midstream/downstream | 0.097 | 0.106 | 0.118 | 0.130 | 0.112 | |
| Upstream/downstream | 0.107 | 0.116 | 0.126 | 0.134 | 0.121 | |
| Differential contribution rate | Intra-regional | 31.89% | 32.32% | 33.03% | 33.35% | 32.55% |
| Inter-regional | 32.96% | 31.39% | 31.92% | 35.47% | 32.47% | |
| Hypervariable density | 35.15% | 36.30% | 35.05% | 31.18% | 34.99% | |
| Year | 2006 | 2007 | 2008 | 2009 | 2010 | 2011 | 2012 | 2013 | 2014 | 2015 | 2016 | 2017 | 2018 | 2019 | 2020 |
|---|---|---|---|---|---|---|---|---|---|---|---|---|---|---|---|
| I | 0.170 | 0.182 | 0.181 | 0.170 | 0.188 | 0.183 | 0.170 | 0.147 | 0.155 | 0.161 | 0.148 | 0.144 | 0.133 | 0.134 | 0.126 |
| Z | 2.390 | 2.551 | 2.550 | 2.401 | 2.646 | 2.576 | 2.411 | 2.125 | 2.222 | 2.296 | 2.125 | 2.090 | 1.934 | 1.959 | 1.867 |
| P | 0.008 | 0.005 | 0.005 | 0.008 | 0.004 | 0.005 | 0.008 | 0.017 | 0.013 | 0.011 | 0.017 | 0.018 | 0.027 | 0.025 | 0.031 |
| 2006 | 2011 | 2016 | 2020 | Means | |
|---|---|---|---|---|---|
| X1 | 0.6836 *** | 0.4986 *** | 0.6057 *** | 0.5126 *** | 0.5751 *** |
| X2 | 0.1288 *** | 0.1171 *** | 0.2260 *** | 0.2114 *** | 0.1708 *** |
| X3 | 0.0581 *** | 0.5362 *** | 0.4142 *** | 0.4512 *** | 0.3649 *** |
| X4 | 0.0399 *** | 0.0929 *** | 0.0978 *** | 0.1084 *** | 0.0848 *** |
| X5 | 0.6789 *** | 0.6539 *** | 0.8222 *** | 0.7696 *** | 0.7312 *** |
| X6 | 0.2723 *** | 0.2088 *** | 0.1481 *** | 0.1062 *** | 0.1839 *** |
| Driver | X1 | X2 | X3 | X4 | X5 | X6 |
|---|---|---|---|---|---|---|
| X1 | 0.6070 | |||||
| X2 | 0.7129 | 0.2904 | ||||
| X3 | 0.7762 | 0.7909 | 0.4975 | |||
| X4 | 0.7519 | 0.7128 | 0.6955 | 0.0477 | ||
| X5 | 0.9185 | 0.9147 | 0.8576 | 0.9085 | 0.7849 | |
| X6 | 0.7858 | 0.5929 | 0.7792 | 0.6062 | 0.8902 | 0.2255 |
Disclaimer/Publisher’s Note: The statements, opinions and data contained in all publications are solely those of the individual author(s) and contributor(s) and not of MDPI and/or the editor(s). MDPI and/or the editor(s) disclaim responsibility for any injury to people or property resulting from any ideas, methods, instructions or products referred to in the content. |
© 2023 by the authors. Licensee MDPI, Basel, Switzerland. This article is an open access article distributed under the terms and conditions of the Creative Commons Attribution (CC BY) license (https://creativecommons.org/licenses/by/4.0/).
Share and Cite
Zhang, J.; Xu, Z.; Ci, F. Spatio–Temporal Evolutionary Features and Drivers of Green Competitiveness of Cities Surrounding the Yellow River. Sustainability 2023, 15, 14127. https://doi.org/10.3390/su151914127
Zhang J, Xu Z, Ci F. Spatio–Temporal Evolutionary Features and Drivers of Green Competitiveness of Cities Surrounding the Yellow River. Sustainability. 2023; 15(19):14127. https://doi.org/10.3390/su151914127
Chicago/Turabian StyleZhang, Jiawen, Zhenhua Xu, and Fuyi Ci. 2023. "Spatio–Temporal Evolutionary Features and Drivers of Green Competitiveness of Cities Surrounding the Yellow River" Sustainability 15, no. 19: 14127. https://doi.org/10.3390/su151914127
APA StyleZhang, J., Xu, Z., & Ci, F. (2023). Spatio–Temporal Evolutionary Features and Drivers of Green Competitiveness of Cities Surrounding the Yellow River. Sustainability, 15(19), 14127. https://doi.org/10.3390/su151914127