Article

Empirical Study of ESG Score Prediction through Machine Learning—A Case of Non-Financial Companies in Taiwan

1
Department of Finance, Chien Hsin University of Science and Technology, Taoyuan City 320678, Taiwan
2
Department of Business Administration, Chien Hsin University of Science and Technology, Taoyuan City 320678, Taiwan
*
Author to whom correspondence should be addressed.
Sustainability 2023, 15(19), 14106; https://doi.org/10.3390/su151914106
Submission received: 24 August 2023 / Revised: 18 September 2023 / Accepted: 21 September 2023 / Published: 23 September 2023
(This article belongs to the Special Issue Advances in Business Model Innovation and Corporate Sustainability)

Abstract

:
In recent years, ESG (Environmental, Social, and Governance) has become a critical indicator for evaluating sustainable companies. However, the actual logic used for ESG score calculation remains exclusive to rating agencies. Therefore, with the advancement of AI, using machine learning to establish a reliable ESG score prediction model is a topic worth exploring. This study aims to build ESG score prediction models for the non-financial industry in Taiwan using random forest (RF), Extreme Learning Machines (ELM), support vector machine (SVM), and eXtreme Gradient Boosting (XGBoost) and investigates whether the COVID-19 pandemic has affected the accuracy of these models. The dependent variable is the Taiwan ESG Sustainable Development Index, while the independent variables are 27 financial metrics and corporate governance indicators with three parts: pre-pandemic, pandemic, and the entire period (2018–2021). RMSE, MAE, MAPE, and r2 are conducted to evaluate these models. The results demonstrate the four supervised models perform well during all three periods. ELM, XGBoost, and SVM exhibit excellent performance, while RF demonstrates good accuracy but relatively lower than the others. XGBoost’s r2 shows inconsistency with RMSE, MAPE, and MAE. This study concludes the predictive performance of RF and XGBoost is inferior to that of other models.

1. Introduction

In recent years, there has been a growing global interest in Corporate Social Responsibility (CSR), sustainability, ESG, and risk asset management issues [1]. ESG ratings of companies have become crucial indicators for assessing their sustainability capabilities [2]. A study by PwC [3] revealed that the impact of ESG ratings on investment strategies is increasing, making it a key factor influencing investment decisions. As a prominent economic powerhouse in Asia, Taiwan holds a significant position in the global market. Compared with other economic regions, Taiwan’s economy is relatively concentrated, highly technology-driven, and operates in a shallow market structure, which sets it apart from the diversified economic structures of larger economic regions. Additionally, the limited circulation of stocks in the Taiwanese market, higher costs, and limited funding sources for companies impose constraints on their development. Due to these factors, Taiwanese investors face greater liquidity, price volatility, and information asymmetry risks compared with investors in other economic regions. Therefore, for Taiwanese investors, effectively measuring a company’s ESG performance and evaluating its sustainable business capabilities hold significant importance [4].
The ESG score and sustainability rating are derived from various factors encompassing environmental, social, governance, and economic-related aspects [5].
The issue of the accuracy of ESG scores and sustainability ratings is a subject frequently discussed in the literature. Shen et al. [6] conducted an evaluation of the sustainability ratings of China’s construction industry infrastructure projects using Key Assessment Indicators (KAIs). Meanwhile, Dong et al. [7] employed the Data Envelopment Analysis (DEA) method to assess the sustainability performance of 157 Chinese cities’ water infrastructure. The DEA approach calculates a unified sustainability score by considering seven inputs and five outputs that represent the economic, resource, and environmental dimensions of sustainability. In the realm of water resource management, Koop et al. [8] applied the geometric aggregation method to enhance the lowest-scoring indicators in integrated water resources management. In studies pertaining to public health, Gore, Ross, et al. [9] and Zamponi, Virginia et al. [10] employed statistical modeling techniques to assess various aspects of public health. Typically, rating agencies determine the ESG or sustainability scores based on the information disclosed by the companies themselves [11]. However, concerns about the accuracy of ESG scores have been widespread due to issues such as the absence of standardized criteria, the credibility of information sources, lack of transparency, and potential conflicts of interest, all of which can introduce biases and trade-offs [12]. Abhayawansa and Tyagi [13] proposed that a lack of standardization and credibility could be attributed to the opacity of scoring mechanisms employed by different ESG rating agencies and the lack of comparability among their rating standards. They also presented evidence showing a weak correlation between ESG ratings issued by different agencies. Different agencies devise their own scoring systems and criteria for calculating ESG scores, and they may develop different rating weights based on industries and national locations, resulting in significant discrepancies in scores for the same company across different rating agencies. Liu M. also pointed out that the average correlation between ESG ratings from different agencies ranged from 0.3 to 0.66 [14]. With dozens of ESG rating agencies internationally and over 600 sustainability ratings currently available, such as Bloomberg, MSCI, S&P SAM, ISS ESG, etc., the lack of consistent standards and credibility in ESG scores has become a subject of controversy [11,15,16,17,18,19]. The transparency of ESG calculation methodologies is a concern as ESG calculations may be influenced by company reports and related information disclosure, leading to potential information asymmetry issues in ESG ratings [20]. The extent of subjectivity involved in the calculation methods of different rating agencies remains largely unknown to the general investors, making the actual calculation logic appear somewhat similar to a black-box model. Chen et al. [21] also emphasized that the composition of ESG scores involves multiple dimensions, requiring a comprehensive consideration of the interactions and impacts among these dimensions to achieve accurate predictions. These complexities have contributed to public skepticism regarding the transparency of ESG scores.
To clarify the logic behind ESG score calculations, many studies have focused on establishing statistical predictive models for ESG. Licari, J. et al. [22] utilized traditional linear regression to predict ESG scores for over 19,000 companies across 96 countries/regions from 2004 to 2020. However, they found the linear regression predictive performance unsatisfactory, with an r2 of only 31.13%. This phenomenon may be attributed to the interference caused by the complex factors involved in the ESG rating process, which includes directly engaging with companies, reviewing publicly disclosed information during the data collection process, and occasionally supplementing with alternative data to measure and assign attribute weights within the assessment scope. There are significant gaps in coverage, especially when it comes to smaller companies, less regulated industries, and emerging markets. Consequently, applying traditional statistical tools for predictive ratings in such a complex environment poses substantial challenges. For instance, Del Vitto et al. [23] employed elementary regression models such as Ridge and Lasso regularization to forecast the individual E, S, and G sustainability ratings of corporations. They underscored that these models are classified as white-box algorithms, signifying their complete explicability. Their underlying mechanisms are uncomplicated: the model’s output is computed via a weighted summation of the attributes within each data sample. Consequently, the model’s interpretation can be directly inferred from the weightings allocated to the variables within the algorithm. Nevertheless, it is crucial to acknowledge that linear regression is vulnerable to overfitting when confronted with a substantial number of regressors (the features). Ridge regression mitigates overfitting but elevates bias (while reducing variance). Conversely, Lasso regression is designed to select features by driving coefficients toward zero through its penalization term. Nonetheless, Lasso selects only one feature from a cluster of correlated features, and this selection is arbitrary. This has a modest impact on the algorithm’s predictive capacity but does affect its interpretability unless complemented by specialized methodologies [24].
With the progression of AI technology, machine learning has emerged as a highly promising approach in the realm of environmental, social, governance, and economic analysis [23] and has been extensively researched. In the realm of economic forecasting, Tehranian, K. [25] employed various machine learning techniques such as Probit, Logit, Elastic Net, RF, Gradient Boosting, and Neural Networks to predict economic recessions in the United States. Concerning health issues and disease diagnosis, M. Maydanchi et al. [26] compared six classification models, including AdaBoost, RF, Decision Trees, K-Nearest Neighbors (KNN), Naïve Bayes, and Perceptron, to predict CVD symptoms. In the field of engineering, Ghasemi, A., Naser M.Z. [27] utilized multiple linear regression and two AI algorithms (RF and XGBoost) to develop a working model for predicting the properties of 3D concrete mixtures capable of withstanding pressure. In the realm of networking technology, Yonghong Wang et al. [28] employed machine learning to classify SDN traffic into attack or normal traffic. They used feature selection methods such as Fisher scoring and Wrapper for fine-grained detection. Subsequently, they employed Renyi’s rule-based detection method using a joint entropy algorithm to detect DDoS attacks on SDN controllers. All these studies addressed complex nonlinear problems using machine learning or deep learning and extended hidden layers based on the complexity of the problem, which is challenging to achieve with traditional statistical methods.
In general, machine learning techniques offer the advantage of reducing human effort in monitoring extensive amounts of information related to various ESG and sustainability issues [29] while ensuring the provision of consistent and real-time reporting streams [30,31,32,33].
Regression trees, random forest (RF), gradient boosting machines, artificial neural networks (ANN), support vector machines (SVM), eXtreme Gradient Boosting (XGBoost), and Extreme Learning Machines (ELM) have demonstrated their capacity to uncover intricate patterns and hidden relationships that may be difficult or even impossible to identify using linear analysis methods. Additionally, in the presence of multicollinearity, they outperform linear regression and enable precise classification of observations [12]. Valeria D’Amato [34] explored the importance of various financial fundamentals when predicting ESG ratings using generalized linear models and RF. However, their study was constrained to a limited set of financial fundamentals, including the current assets to current liabilities, sales-to-assets ratio, net income to sales, earnings before interest and tax to sales, price-to-earnings ratio, dividend yields, and debt-to-total assets ratio. Similarly, Fernando García et al. [35] conducted a comparable study on select financial fundamentals of certain companies. These included earnings per share, returns on assets, debt-to-equity ratio, market capitalization, trading volumes, and stock beta. They used a rough set model to predict ESG ratings for European companies. Tim Krappel et al. [36] introduced a heterogeneous ensemble model, incorporating feedforward neural networks, CatBoost [37], and XGBoost [38] models to predict ESG ratings using fundamental financial data for companies. Although these studies have provided evidence of the utility of financial fundamentals in predicting ESG ratings, they either focused on a limited subset of financial indicators, which may not be sufficient for the task, or applied machine learning techniques to a broad array of financial fundamentals without investigating the importance or statistical significance of these individual financial fundamentals.
Regarding the comparison of ESG classification prediction models, SVM, and tree-based ensembles have shown promising results in credit rating prediction [39,40,41]. Previous studies have also compared SVM and RF. Teoh T-T, et al. [42] found that both SVM and RF performed well in different industries, such as Basic Materials and Consumer Cyclicals. Lachlan M. [43] used RF, SVM, and logistic regression (LR) models to predict ESG performance for US and global companies, RF showed the highest classification predictability compared with conventional, sophisticated, and boosted tree-based methods. D’Amato et al. [12] used RF to assess how structural data (balance sheet items) might impact ESG scores assigned to regularly traded stocks. The results indicated that RF effectively reduced prediction errors while monitoring variance. Raza H et al. [44] employed various supervised machine learning techniques, including K Nearest Neighbors (KNN), polynomial regression, naive Bayes, random forest, artificial neural networks (ANN), and SVM (RBF), to predict ESG scores for non-financial companies in the UK, US, and Germany. Based on the MAE performance, SVM outperformed RF. The results imply that SVM and RF are appropriate models for ESG prediction; however, their suitability can be context-dependent. Krappel, T et al. [36] utilized the XGBoost model to predict ESG ratings, and they found that XGBoost provided accurate and reliable predictions. Agosto, A. [45] compared the applicability of different models, including XGBoost and RF, using ESG scores for 1382 European companies. The results showed that both XGBoost and RF exhibited good predictive accuracy, with XGBoost outperforming RF in terms of AUROC (area under the ROC curve) and AUPRC (area under the precision and recall curve).
Overall, different machine learning models have their respective advantages and limitations. RF exhibits benefits in high accuracy, resistance to overfitting, applicability to high-dimensional and large datasets, and feature importance estimation. However, it has drawbacks in terms of high computational cost and lower interpretability [46]. SVM demonstrates high accuracy and suitability for high-dimensional data, but it faces challenges in computational efficiency and parameter tuning [47]. XGBoost offers advantages in high accuracy and efficiency but has complexities in parameter tuning, requiring caution against overfitting risks [48]. Additionally, the emerging ELM model has gained popularity due to its high learning efficiency and strong generalization capabilities, widely applied in classification, regression, clustering, and feature learning tasks [49]. However, there are limited literature studies on whether ELM is suitable for predicting ESG scores, making it a worthwhile focus of discussion in this study.
Furthermore, in recent years, the outbreak of the COVID-19 pandemic has led to lockdowns and restrictions on public activities in various countries, significantly impacting the economy and financial markets. Instances of stock market crashes, plummeting commodity prices, and global demand declines have increased uncertainties for investors. Burdekin, R. C., and Harrison, S. [50] pointed out that the pandemic-induced financial and investor sentiment fluctuations may also cause fluctuations in ESG scores. Rubbaniy et al. [51] utilize a wavelet coherence approach to assess the co-movement between the daily global COVID-19 fear index (GFI) and the returns of ESG indices from 5 February 2020 to 18 January 2021. Their findings reveal a robust and positive co-movement between the GFI and ESG indice202s throughout the pandemic, providing evidence of the safe-haven characteristics of ESG indices during the COVID-19 pandemic. Therefore, one of the topics of interest in this research study is how the accuracy of machine learning models for ESG score prediction is affected when the market faces noise and disruptions due to the pandemic.
In summary, existing research on ESG score prediction has mainly focused on European and American markets, with limited studies on Taiwan’s highly technology-driven and shallow-depth market. This study aims to fill this research gap by focusing on Taiwanese companies and exploring the accuracy of machine learning models in predicting ESG scores. Additionally, the study hoped to expand beyond the use of financial indicators alone and incorporate corporate governance-related indicators for a more comprehensive and objective evaluation in line with the essence of ESG. Furthermore, the research will assess whether the abnormal fluctuations caused by the COVID-19 pandemic impact the predictive accuracy of these models. The research objectives can be summarized as follows: (1) Develop robust machine learning models for predicting the Taiwan ESG score in non-financial industries using historical ESG data, financial indicators (e.g., ROE and ROA), and corporate governance data. (2) Compare the predictive performance of four machine learning models, namely RF, SVM, ELM, and XGBoost, for ESG scores. By evaluating the accuracy and other relevant metrics of different models, identify the most suitable model for ESG rating prediction. (3) Assess whether market changes during the COVID-19 pandemic will impact the accuracy of ESG machine learning models and evaluate the applicability of these models. (4) Provide insights for investment decision-making: The results of this study can help investors to comprehensively assess a company’s sustainable development capabilities and long-term value, enabling them to make more informed investment decisions. It can also assist companies in understanding their strengths and weaknesses in ESG aspects, enhancing sustainability and competitiveness, and meeting the needs of investors and consumers.

2. Materials and Methods

2.1. Variables

The dependent variable in this study is the ESG score of listed and over-the-counter non-financial companies in Taiwan that comply with ESG standards. The data source is the Taiwan ESG Sustainable Development Index (TESG) developed by the Taiwan Economic Journal (TEJ), covering the period from 2018 to 2021. TEJ, established in 1990, is currently one of Taiwan’s largest financial and economic databases, providing information essential for fundamental analysis of securities and financial markets. It specializes in selling domestic and foreign securities, financial, industry, and macroeconomic data and offers consultation services in economic analysis, model design, and database construction. The TESG Sustainable Development Index includes a total of 16 issues under the three pillars of ESG, with over 60 variables. In addition to variables primarily included in corporate sustainability reports, it also encompasses information from annual shareholder meetings, public information such as labor laws, ISO or GMP certifications of products, and negative news related to social responsibility, aiming to supplement information gaps from companies without disclosed sustainability reports. The TESG scores are announced within one month of the public release of corporate sustainability reports. TEJ incorporates the above variables into the internationally recognized ESG framework authorized by the Sustainability Accounting Standards Board (SASB) to generate Taiwan-specific TESG indicators, representing the annual ESG rating results. This study collected all variable data from the TEJ+ database. Specifically, ESG data were extracted from the TEJ ESG database module.
As for the independent variables, this study collected the relevant literature [52,53,54,55] to identify potential variables that may influence ESG scores. Among these, financial data for companies were obtained from the “TEJ Company” module and the “TEJ Finance” module, while corporate governance data were sourced from the Taiwan CSR module. The researchers then used factor analysis to select appropriate variables as input indicators for the research model, extracting factors with eigenvalues greater than 1 [56]. The researchers further applied the Varimax rotation method to maximize variance and eliminate irrelevant variables to improve the predictive accuracy of the model. In total, 27 potential independent variables were selected from the TEJ database, including financial indicators (11 items) and corporate governance indicators (13 items) of listed and over-the-counter non-financial companies in Taiwan that complied with ESG standards from 2018 to 2021. These 27 indicators had a cumulative explanatory load of 76.605%. The suitability test resulted in a Kaiser-Meyer-Olkin (KMO) value of 0.527, exceeding the minimum acceptable value of 0.5 suggested by Kaiser (1974) for factor analysis [57]. Bartlett’s test of sphericity yielded an approximate chi-square value of 53,259.744 with a p-value of 0.000, indicating that the input variable data of these 27 indicators are suitable for subsequent analysis. The detailed list of variable indicators is shown in Table 1, and the research variables and the research framework using machine learning models are illustrated in Figure 1.
In addition, to investigate whether the prediction of ESG scores would be affected by the abnormal market volatility during the pandemic, this study divides data into three periods for comparison and analysis: the pre-pandemic period (2018–2019), the pandemic period (2020–2021), and the entire period (2018–2021). Data processing involves the following seven steps, as illustrated in Figure 2:
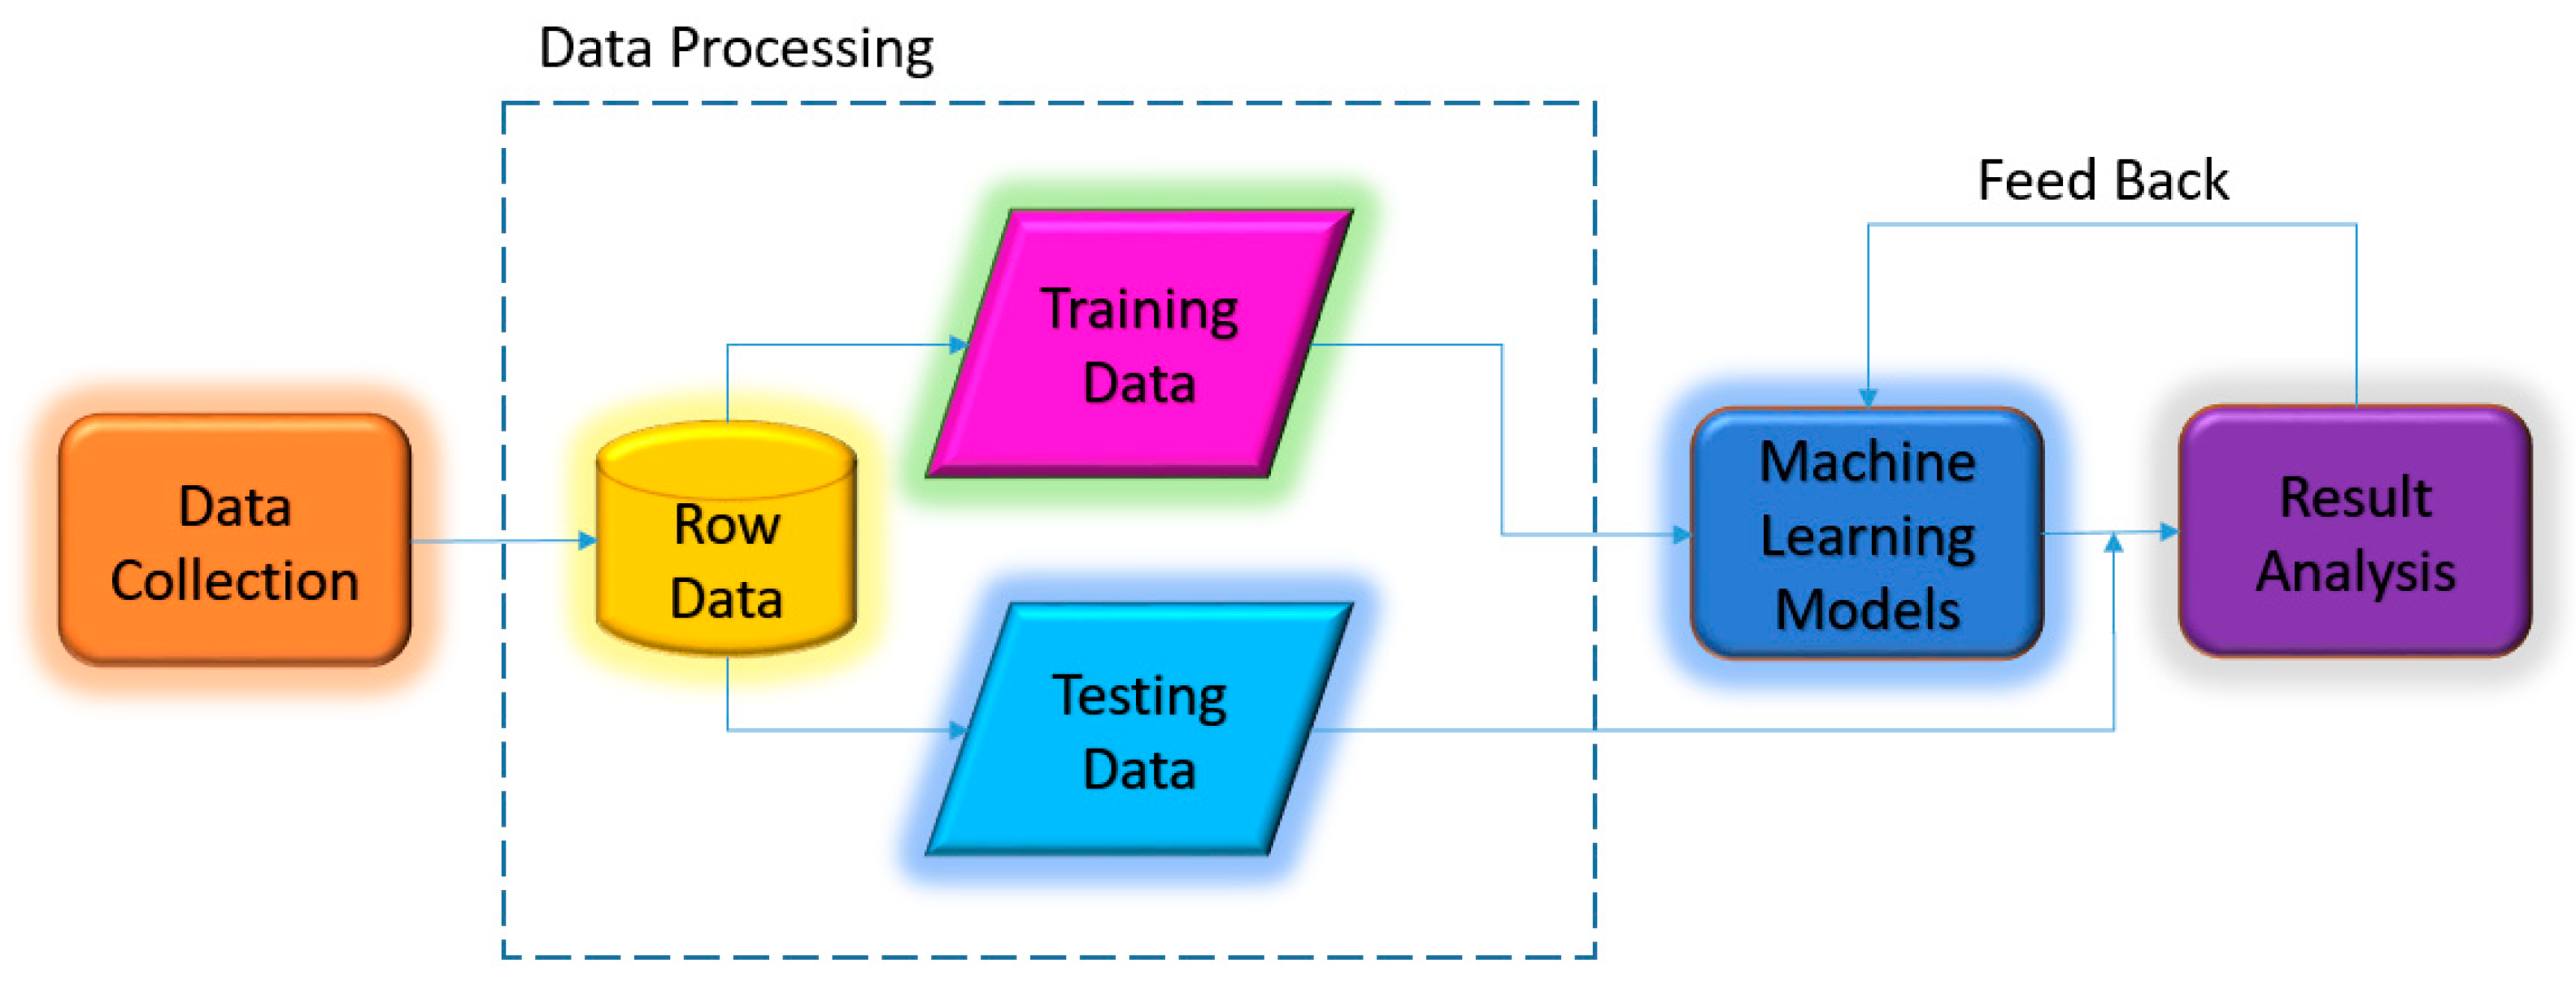
  • Data Preprocessing: If there are any missing data or other reasons that make it impossible to obtain trading information in the TEJ database, the entire dataset is excluded. After removing the missing values, a total of 5829 data points were used in this study (see Table 2).
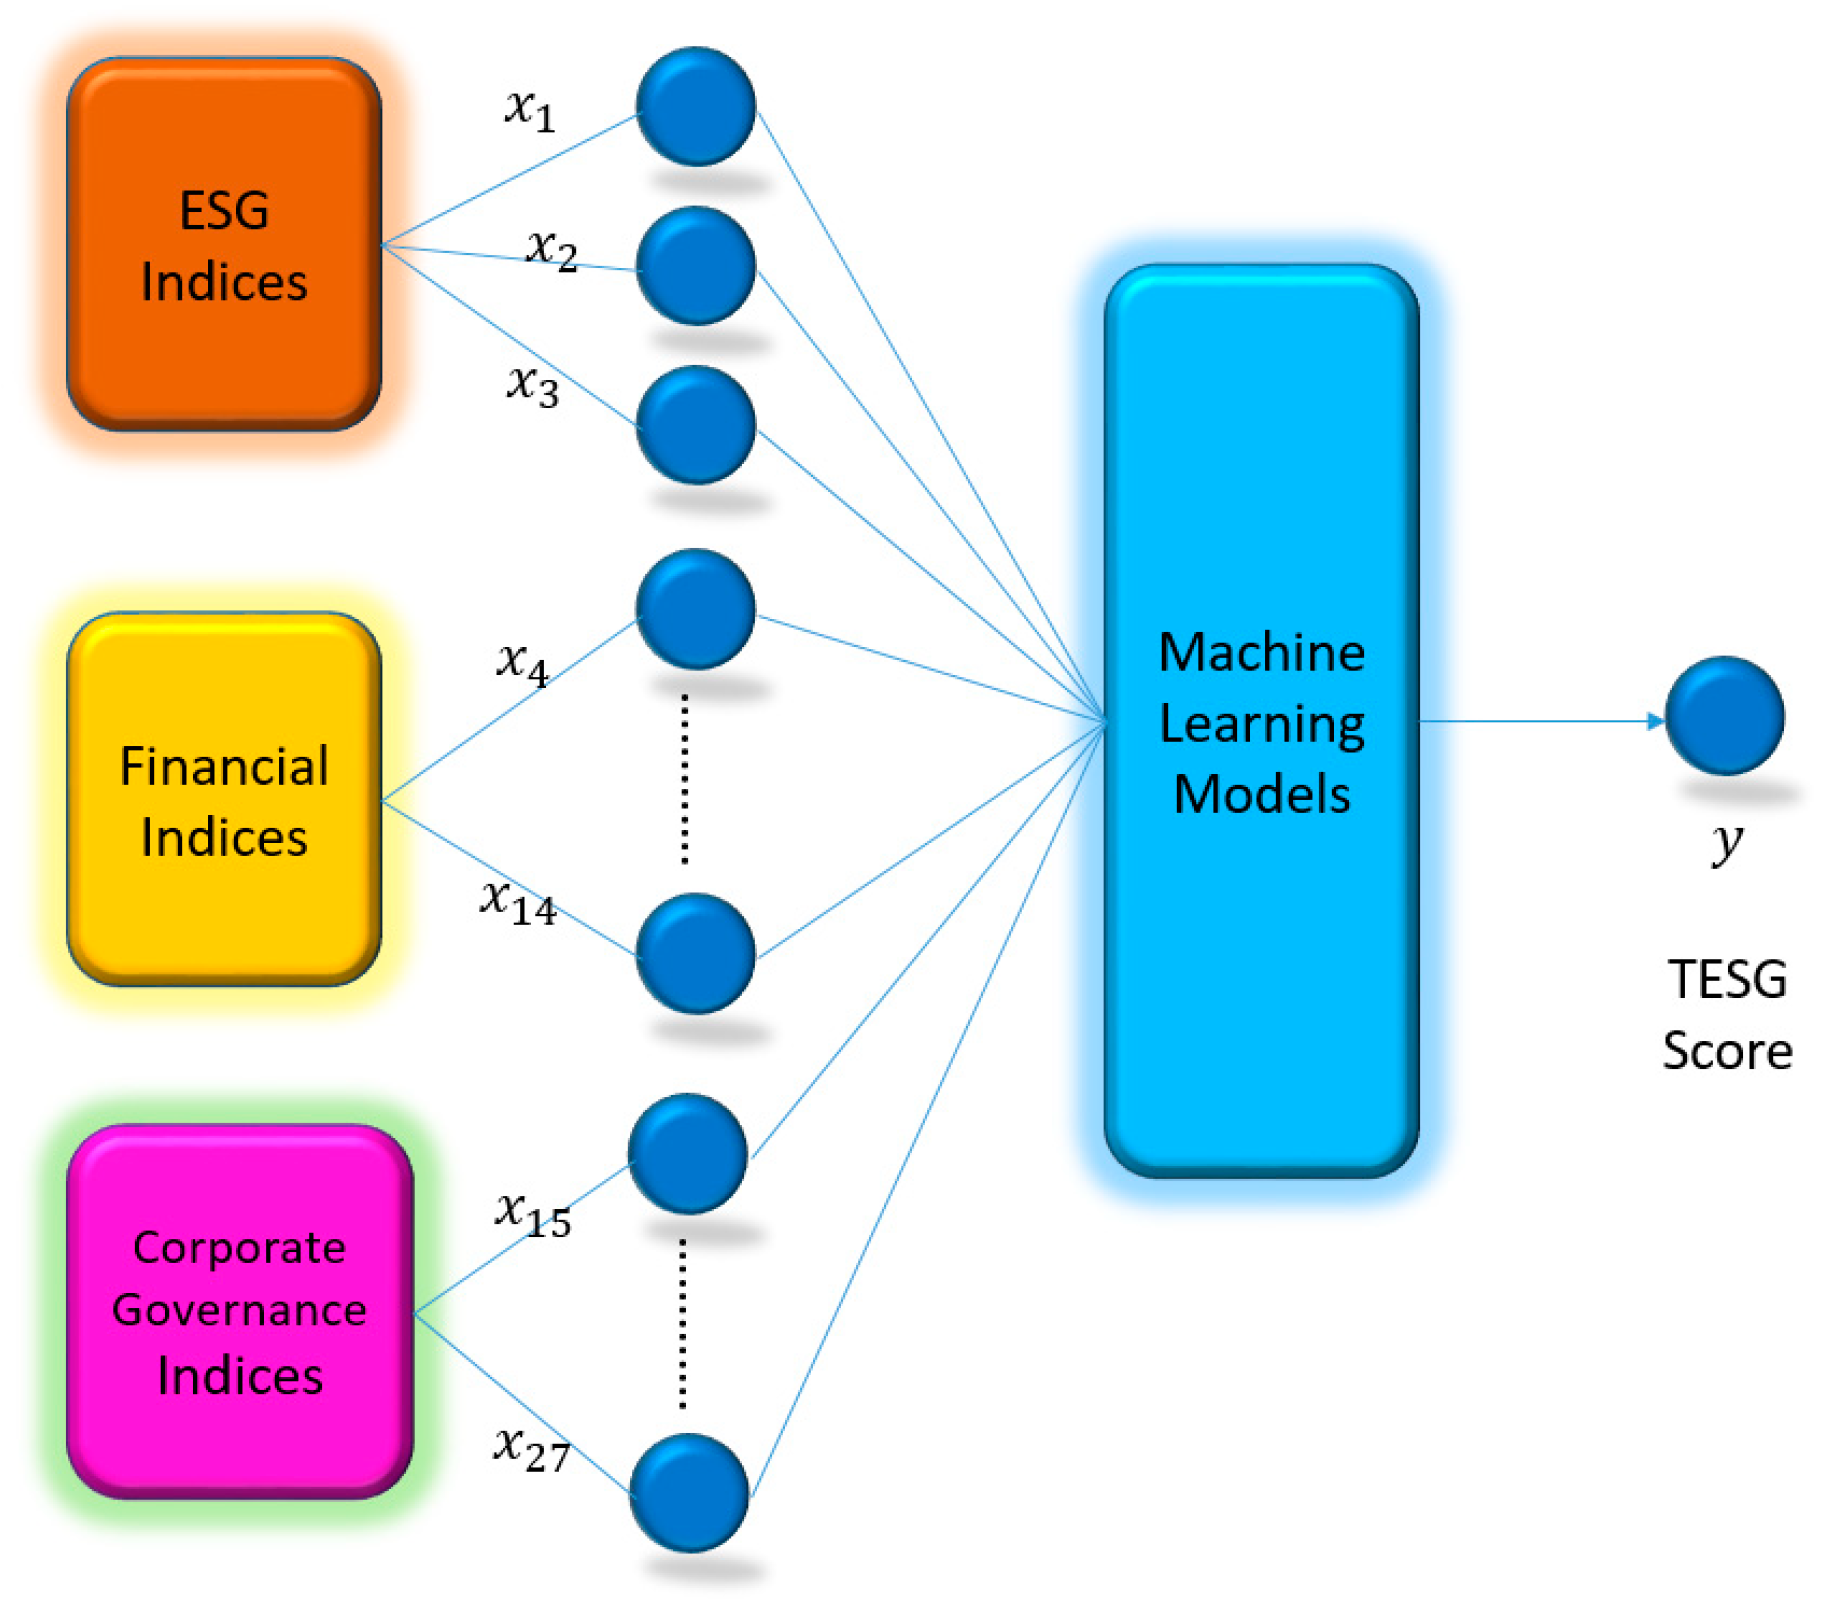
  • Model Building: This study utilizes the ESG scores of listed and over-the-counter non-financial companies in Taiwan that comply with ESG standards from 2018 to 2021 to establish four commonly used machine learning models for predicting TESG scores. The models include random forest (RF), Elaboration Likelihood Model (ELM), support vector machine (SVM), and eXtreme Gradient Boosting (XGBoost).
  • Setting Training and Testing Parameters: These data are split into a 70–30 ratio, where 70% is used for the training phase and 30% for the testing phase.
  • Normalization of Data: The variables are normalized to a range between 0 and 1. The normalization process is performed using the maximum ( X m a x ) and minimum ( X m i n ) values of these sampled data within a specific range. Depending on whether the variable’s initial value is greater than or equal to 0 or has negative values, two different formulas, (1) and (2), are utilized to obtain the normalized value ( X n o m ). These normalized values are input variable data for the deep learning models in this study.
If all variable initial values are greater than or equal to 0:
X n o m = X X m i n X m a x X m i n
If there are negative initial values in the variable:
X n o m = X m a x | X |
(where the denominator is the maximum value of X after taking its absolute value)
5.
Train the Model.
6.
Validate the Predictions.
7.
Model Comparison: Compare RMSE, MAE, MAPE, and r2 of the different models from step 6).

2.2. Machine Learning Models

This study selects four machine learning models that are potentially applicable for predicting ESG scores: SVM, ELM, RF, and XGBoost, and describes each of them as follows:

2.2.1. SVM

SVM is a supervised learning tool proposed by Cortes et al. [58]. It constructs a collection of classification hyperplanes in high-dimensional or infinite-dimensional space. The fundamental concept is quite simple: to find a decision boundary that maximizes the margins between two classes, allowing for perfect separation of the classes. The formula for handling non-linear problems in SVM is as follows (3):
f x = s i g n ( i = 1 , j = 1 n α i y i φ x i φ x j + b )
where φ x i and φ x j are the mapping functions, and the formula can be rewritten using the kernel function as follows (4):
f x = s i g n ( i = 1 , j = 1 n α i y i K ( x i , y j ) + b )
Commonly used kernel functions include the linear kernel, polynomial kernel, and radial basis function (RBF) kernel, among others. In this study, we adopt the most commonly used RBF kernel (5):
K x i , y j = e x p ( x i x j 2 2 σ 2 )

2.2.2. ELM

ELM is a feedforward neural network proposed by Professor Guang-Bin Huang of Nanyang Technological University, Singapore. Unlike traditional artificial neural networks (e.g., BPN) that require setting a large number of network training parameters, ELM only requires the setting of the network structure without the need for other parameters. Therefore, it is known for its simplicity and ease of use [32]. In this study, we adopt the single-layer feedforward neural network (SLFN) structure for ELM, which consists of an input layer, a hidden layer, and an output layer. The output function FL of the hidden layer is defined as (6):
f L = i = 1 l β i h i x = h x β
In the equation, x represents the input variable, and there is one hidden layer node. β is the output weight, and h x is the activation function, which maps data from the input layer to the feature space of ELM. The formula is shown as (Equation (7)):
h x = G a i , b i , x
In the equation, a i and b i are feature mapping parameters, also known as node parameters. Moreover, a i is the input weight (input weights). This study adopts the common Sigmoid function, as shown in (8):
G a i , b i , x = 1 1 + e x p a · x + b
The objective of learning in a single-hidden-layer neural network is to minimize the output error, and through learning and training, we can obtain the values of β that result in the minimum and unique error.

2.2.3. RF

RF was proposed by Breiman [59]. It utilizes the principle of ensemble learning, combining multiple decision trees to construct a more robust learning model, thus reducing the problem of overfitting and improving prediction accuracy as a machine learning method. Breiman defined RF as a set of tree-like structures forming a classifier, as shown in (9):
h x , k , k = 1 ,
where { k } is a set of independently and identically distributed random vectors, and the convergence of RF is given by a combination of classifiers as shown in (10):
h 1 x , h 2 x , , h k x
Randomly creating the training set from the distributions of random vectors X and Y , the margin function is defined as (11):
m g X , Y = α v k I h k X = Y max j Y a v k α v k I h k X = j
where I is the indicator function, which is used to correctly classify X and Y . The larger the margin function, the higher the correct classification score. The generalization error is defined as (12):
P E * = P X , Y ( m g X , Y < 0 )
The X and Y in this context represent the probabilities. The superiority or inferiority of the RF model is usually determined by the following factors: (1) The more vigorous the growth of each tree, the better the overall performance of the forest. (2) The better the independence and the worse the correlation between each tree in the forest, the better the classification performance. (3) The number of decision trees is the only parameter for RF execution and the key determining factor for the RF model with the minimum error.

2.2.4. XGBoost

XGBoost is a supervised machine-learning model similar to RF. In XGBoost, decision trees not only randomly select features but also reference the parameters of the previous tree as a basis for building the new decision tree. This study adopts the framework proposed by Chen and Guestrin [38], where the objective function consists of a training loss function and a regularization term. Let x i be the i th sample and y i be the predicted value for the i th sample in the dataset D = x i , y i i = 1,2 , , n , with k decision trees applied to the training model. The formula for y ^ i is given by (13):
y ^ i = k = 1 k f k x i , f k F
where F is the collection of decision trees and f k represents the k th decision tree within the set of trees. The result of the t th iteration is given by (14):
y ^ i t = y ^ i t 1 + f t ( x i )
The objective function is given by (15):
J f t = i = 1 n L y i , y ^ i t 1 + f t x i + Ω ( f t )
where L is the loss function, and Ω ( f t ) represents the model complexity. The formula is as follows (16):
Ω f t = γ 1 · T t + γ 2 1 2 j = 1 T ω j 2
where T t and ω represent the leaf nodes and their corresponding weights, and γ 1 and γ 2 are the regularization coefficients for L 1 and L 2 regularization, respectively. By applying the second-order Taylor expansion and simplifying the equation, we obtain the following Formula (17):
J f t = i = 1 n L y i , y ^ i t 1 + g i f t x i + 1 2 h i f t 2 ( x i ) + Ω ( f t )
where g i = L ( y i , y ^ i t 1 ) y ^ i t 1 ; h i = 2 L ( y i , y ^ i t 1 ) y ^ i t 1 after the calculations, the objective function is as follows (18):
J f t = i = 1 n L g i ω q ( x i ) + 1 2 h i ω q ( x i ) 2 + γ T + λ 1 2 j = 1 T ω j 2
The smaller the value of J f t , the better the structure of the tree.

2.3. Evaluation Index

The evaluation indices used in this study to measure the performance of the trained models are RMSE, MAPE, and MAE. The formulas are as follows (19–21):
R M S E = 1 n × i = 1 n ( Y i ^ Y i ) 2
M A P E = 100 % n i = 1 n | Y i ^ Y i Y i |
M A E = Y i ^ Y i n
Y i : Actual value
Y ^ i : Predicted output value from the network
n : Number of test examples
The above indicators, RMSE and MAPE, are commonly used to evaluate model accuracy. RMSE is useful for comparing the prediction errors of different models for specific variables, but it is sensitive to the scale of these data. On the other hand, MAPE is a relative measure that assesses the difference between predicted values and actual values without being influenced by the unit of measurement. Generally, a MAPE% value less than 10 is considered highly accurate, between 10 to 20 is considered good accuracy, between 20 to 50 is considered reasonable accuracy, and values above 50 are considered inaccurate [60]. MAE, on the other hand, represents the average absolute difference between the target values and predicted values. It measures the average length of prediction errors, regardless of their direction, and its values range from 0 to positive infinity. In addition, we also use the r2 to evaluate the model. The r2 value, also known as the “coefficient of determination” or “goodness of fit”, can be understood as the percentage of reduced error (PRE) and reflects the extent to which the predicted values explain the actual values. Its value typically ranges between 0 and 1, where an r2 closer to 1 indicates that the predicted values are closer to the true values.

3. Results

3.1. Model Parameters

This study implemented the ELM, RF, and SVM models using Matlab 2021 and the XGBoost model using Python 3.10. The ELM model is a single hidden layer neural network that offers advantages over traditional BPN models by requiring fewer parameters and having strong learning capabilities. The parameters for the ELM model were set as follows: one hidden layer with an optimal number of 30 hidden nodes determined through trial and error and the commonly used Sigmoid activation function as the feature mapping function. The remaining parameters were set to their default values.
For the RF classification model, the number of decision trees was set to 20 using the TreeBagger function. RF was specified to perform regression, and the feature selection method was set to ‘curvature’ to select split points based on feature curvature. The other parameters were set to their default values.
In the SVM model, the fitrsvm function in Matlab was used, and the linear kernel function was specified to perform dot product operations in the feature space. The remaining parameters were set to their default values.
Due to the unavailability of XGBoost’s Toolbox in Matlab, the XGBoost model was implemented in Python. The booster type was specified as ‘gbtree,’ the learning rate was set to 0.1, and max_delta_step was set to 5, limiting the maximum increment of weight updates to aid convergence. The number of trees (iterations) was set to 500, and the parallel construction of trees was set to 1, indicating the use of a single tree. Regarding the parameter settings for the four machine learning models in this study are listed in Table 3.

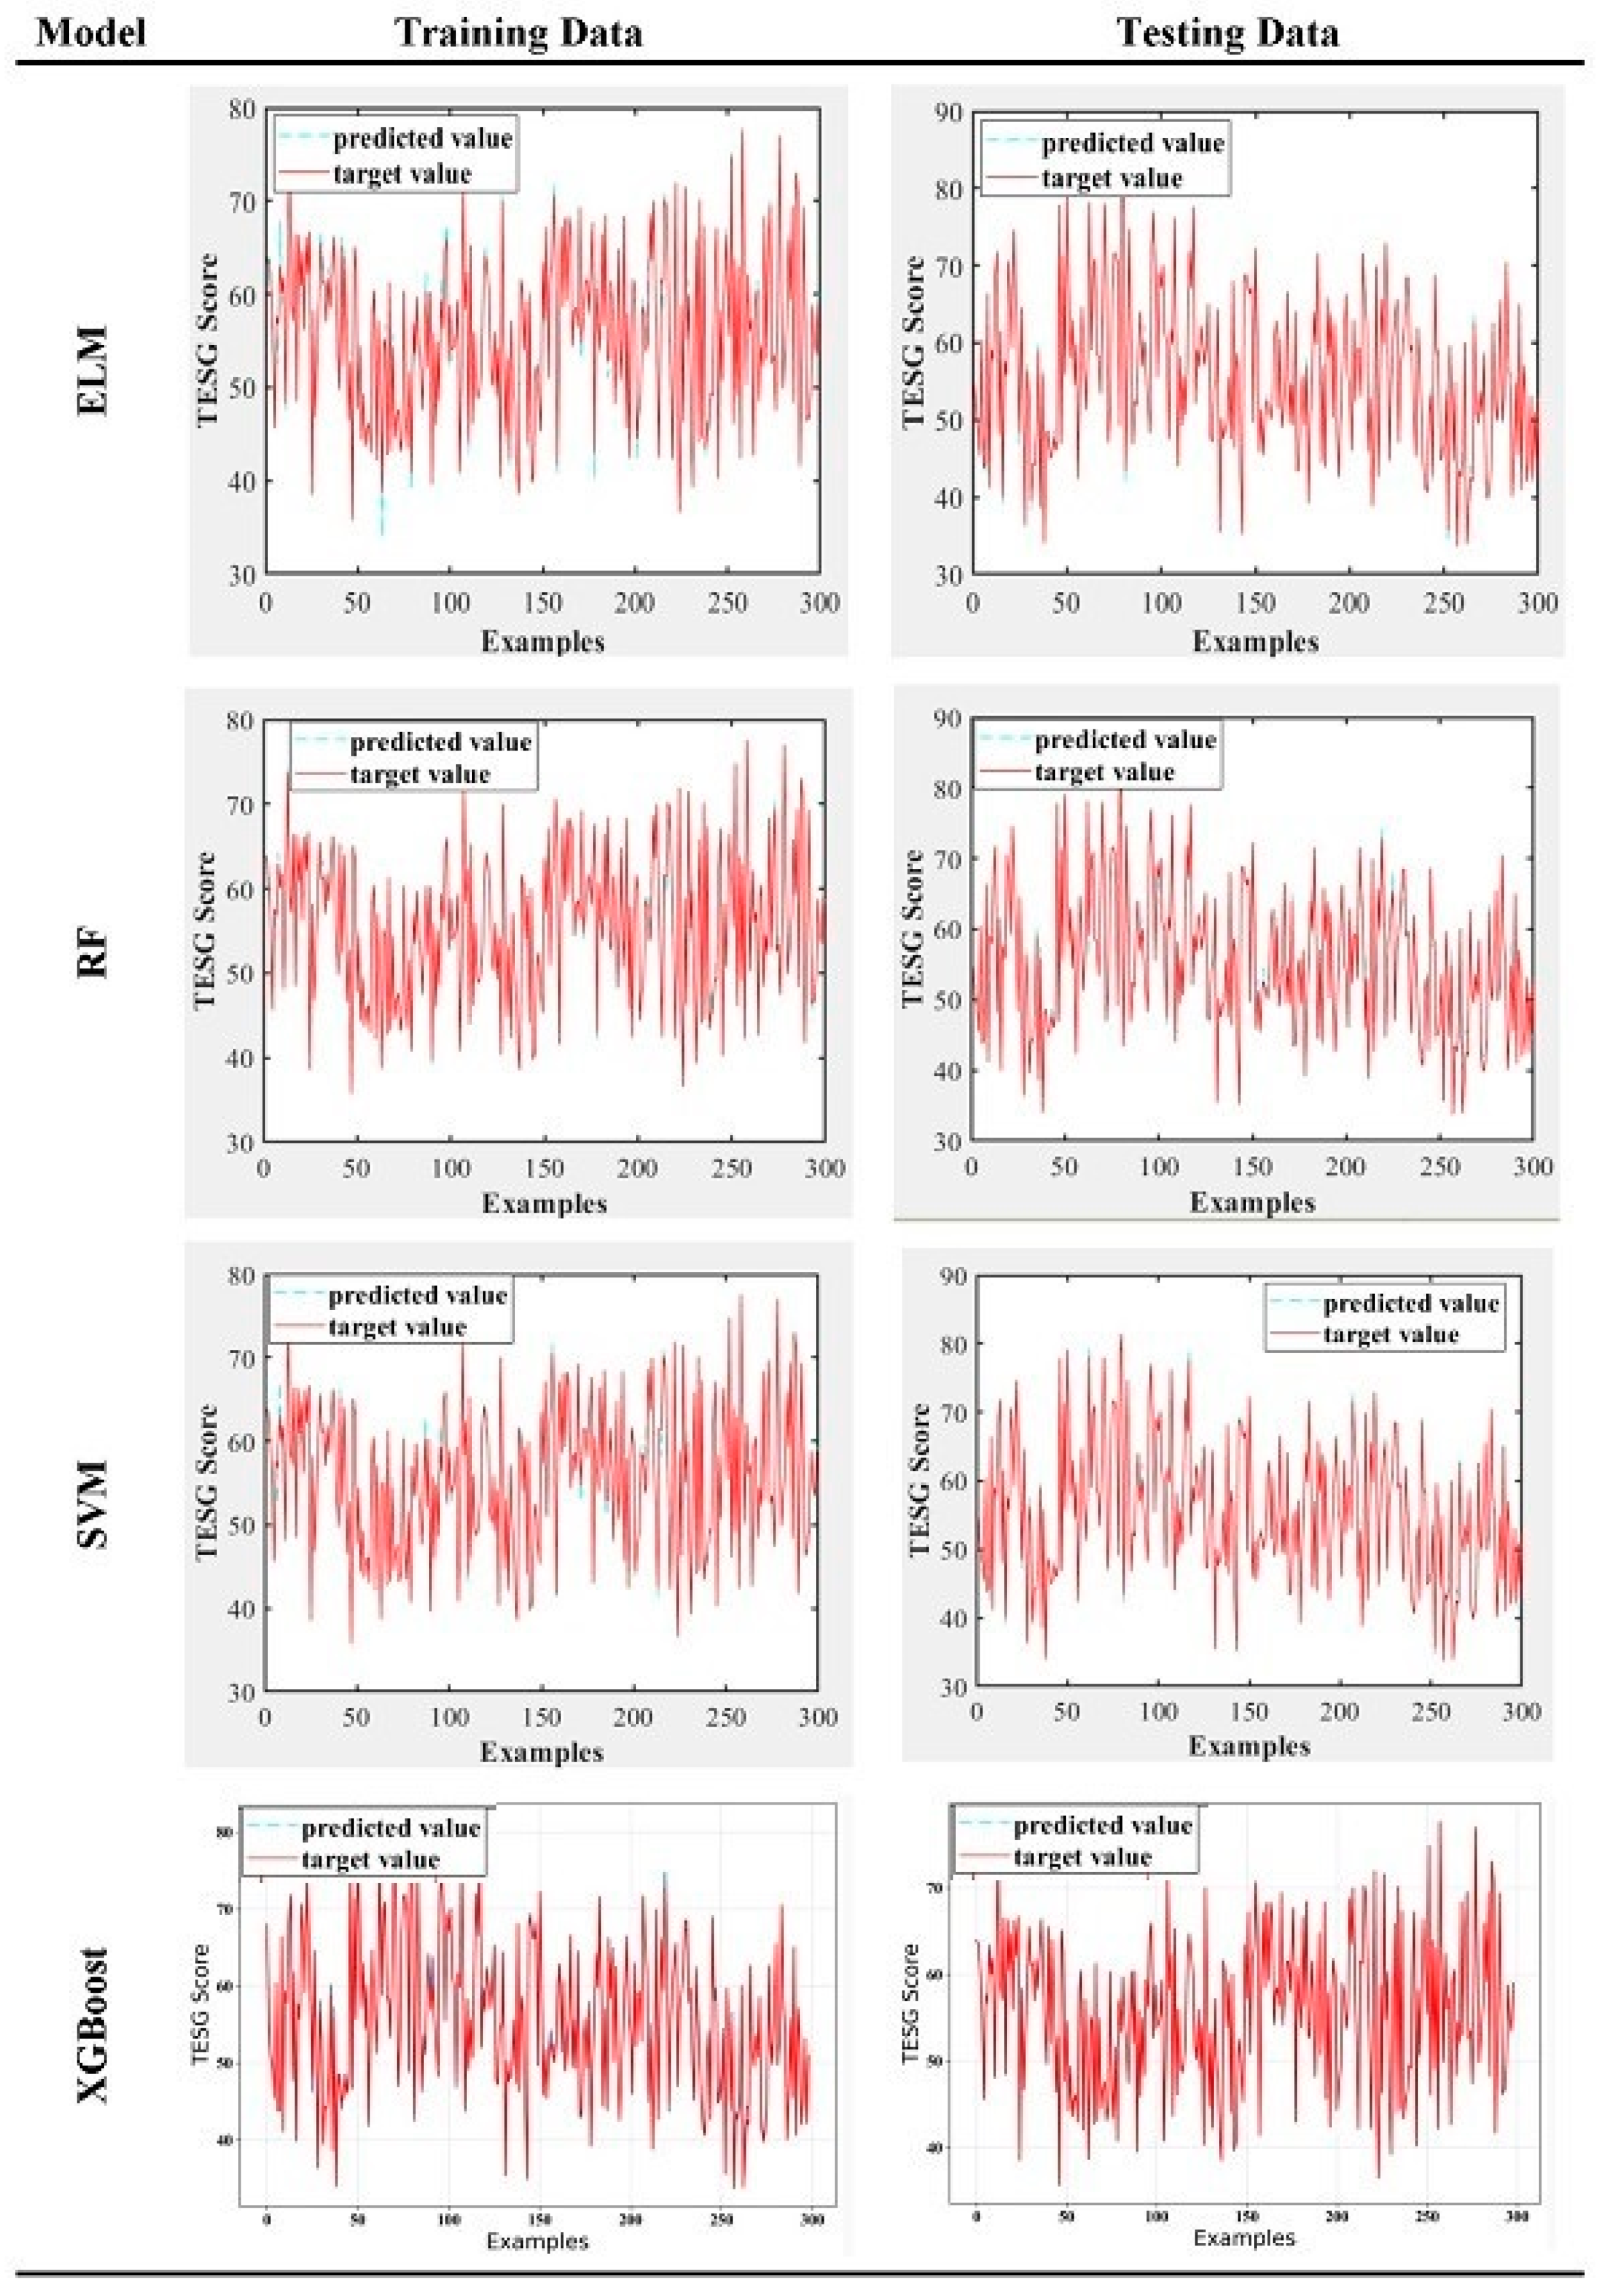
3.2. Empirical Prediction Results

As previously mentioned, these empirical data were divided into training and testing samples in a 7:3 ratio. Additionally, due to the impact of the COVID-19 pandemic, the number of samples used for each empirical model is shown in Table 4:
After conducting the empirical analysis using both MatLab and Python programs, the first step is to conduct a t-test to assess the statistical significance of the four machine-learning models in this study.
To further validate the effectiveness of the four machine learning models employed in this study for predicting ESG scores, we conducted a one-sample t-test for statistical significance using empirical data from 2018–2021. This was aimed at assessing how closely each model’s predictions align with target values. Under a 95% two-tailed confidence level, the null hypothesis ( H 0 ) assumes no significant difference between the predicted and target values (p-value greater than 0.05), whereas the alternative hypothesis ( H 1 ) posits that there is a significant difference (p-value less than 0.05). If H 0 is not rejected, it implies that the empirical findings of this study indicate no significant discrepancies between the predicted and target values.
According to Table 5, it can be observed that at a 95% two-tailed confidence level, all p-values are greater than 0.05. In other words, these models not only demonstrate effective learning outcomes but also exhibit significant predictive capabilities in the statistical significance tests. Based on the results of the statistical tests, it can be concluded that the predictive data generated by the four machine learning models employed in this study closely align with the target data.
This study conducted a single-sample t-test to assess the statistical significance of four machine-learning models during the pandemic period (2018–2021). After performing the statistical comparisons, it was found that none of the four machine-learning models rejected the null hypothesis ( H 0 ), indicating that there were no significant differences between their predicted values and the target values. In other words, the predictions of all four models were similar to the actual values, demonstrating good learning performance. Furthermore, by further comparing the models using metrics such as MAE, RMSE, MAPE, and r-square values, the relevant training and testing results are presented in Table 6:
Based on Table 6, it can be observed that all four ML models utilized in this study, regardless of the entire four-year period or the periods during and outside of the pandemic, achieved r2 above 0.95 when the RMSE, MAE, and MAPE values converged. This indicates that the ML models effectively predicted the TESG scores with high accuracy during the research period. Among them, the XGBoost and SVM models demonstrated better predictive performance in most cases. Figure 3 and Figure 4 compare the r2 of the four different ML models in both the training and testing samples, further demonstrating their excellent predictive capabilities, especially for the XGBoost model, which performed the best. The empirical results show that all four ML models applied in this study effectively learned and predicted the TESG scores mechanism.
The line charts (Figure 5) below display the actual values and predicted values of ELM, RF, SVM, and XGBoost models for both the training and testing datasets over the entire period from 2018 to 2021. Due to the large sample size, only the first 300 data points were selected for observation.
The results demonstrate that all four models (ELM, RF, SVM, and XGBoost) generated predictions that closely matched the actual values for both the training and testing datasets. The close alignment between the predicted values and actual values indicates that the four models performed well in capturing the underlying patterns and trends in these data. This suggests that the models have a strong ability to accurately predict the TESG scores during the period from 2018 to 2021, both for data used during training and for previously unseen data used during testing.

4. Discussion

In recent years, environmental protection and social responsibility have been receiving significant attention, and ESG (Environmental, Social, and Governance) sustainable development goals have become a global consensus. Relevant organizations in Taiwan have also followed suit. The Taiwan Economic Journal (TEJ), a reputable company in Taiwan that regularly publishes important financial and application analysis information, has developed the TESG (Taiwan ESG) sustainable development indicators for Taiwanese companies. It aims to evaluate and compare the sustainability performance of listed and over-the-counter companies in Taiwan, enabling relevant decision-makers such as company management teams, stock investors, and government agencies to effectively manage or assess the companies’ sustainability performance through a professional and reasonable evaluation mechanism. Therefore, this research aims to utilize four machine learning models, ELM, RF, SVM, and XGBoost, to learn and predict the TESG evaluation model developed by the TEJ. Finally, this study compares the predictive performance of these four models using RMSE, MAE, MAPE, and r2, and the conclusions are as follows:
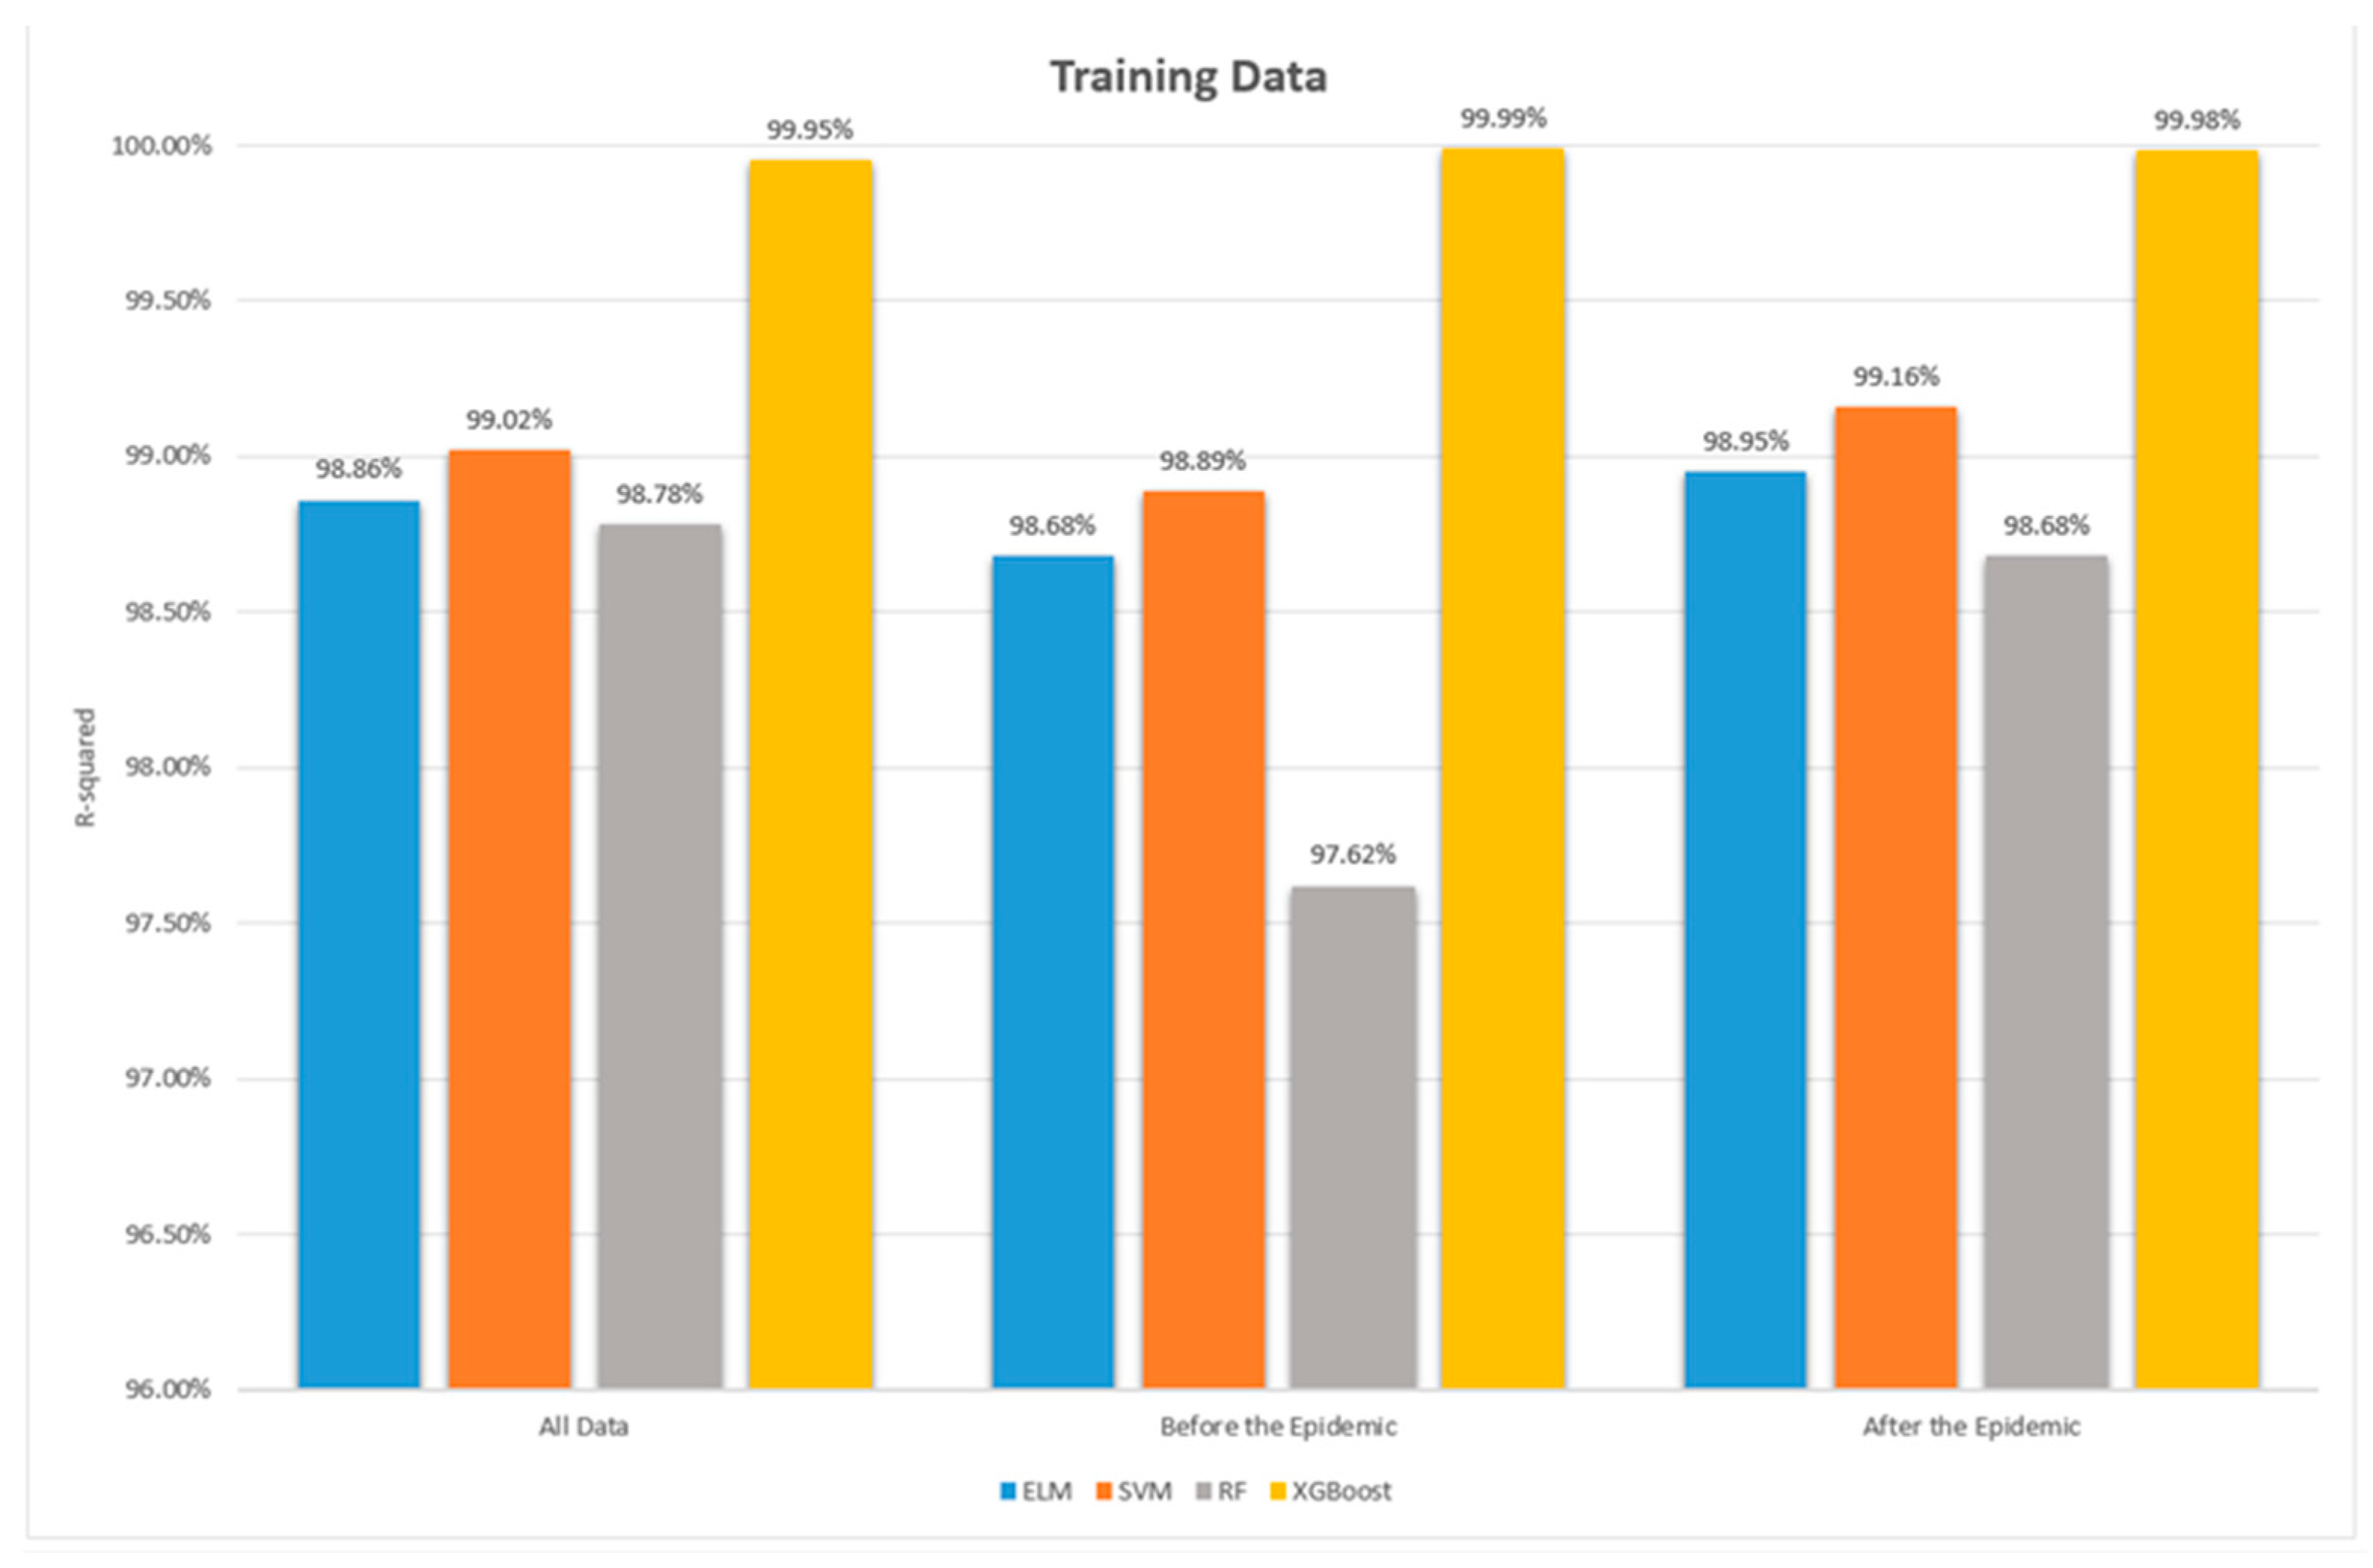
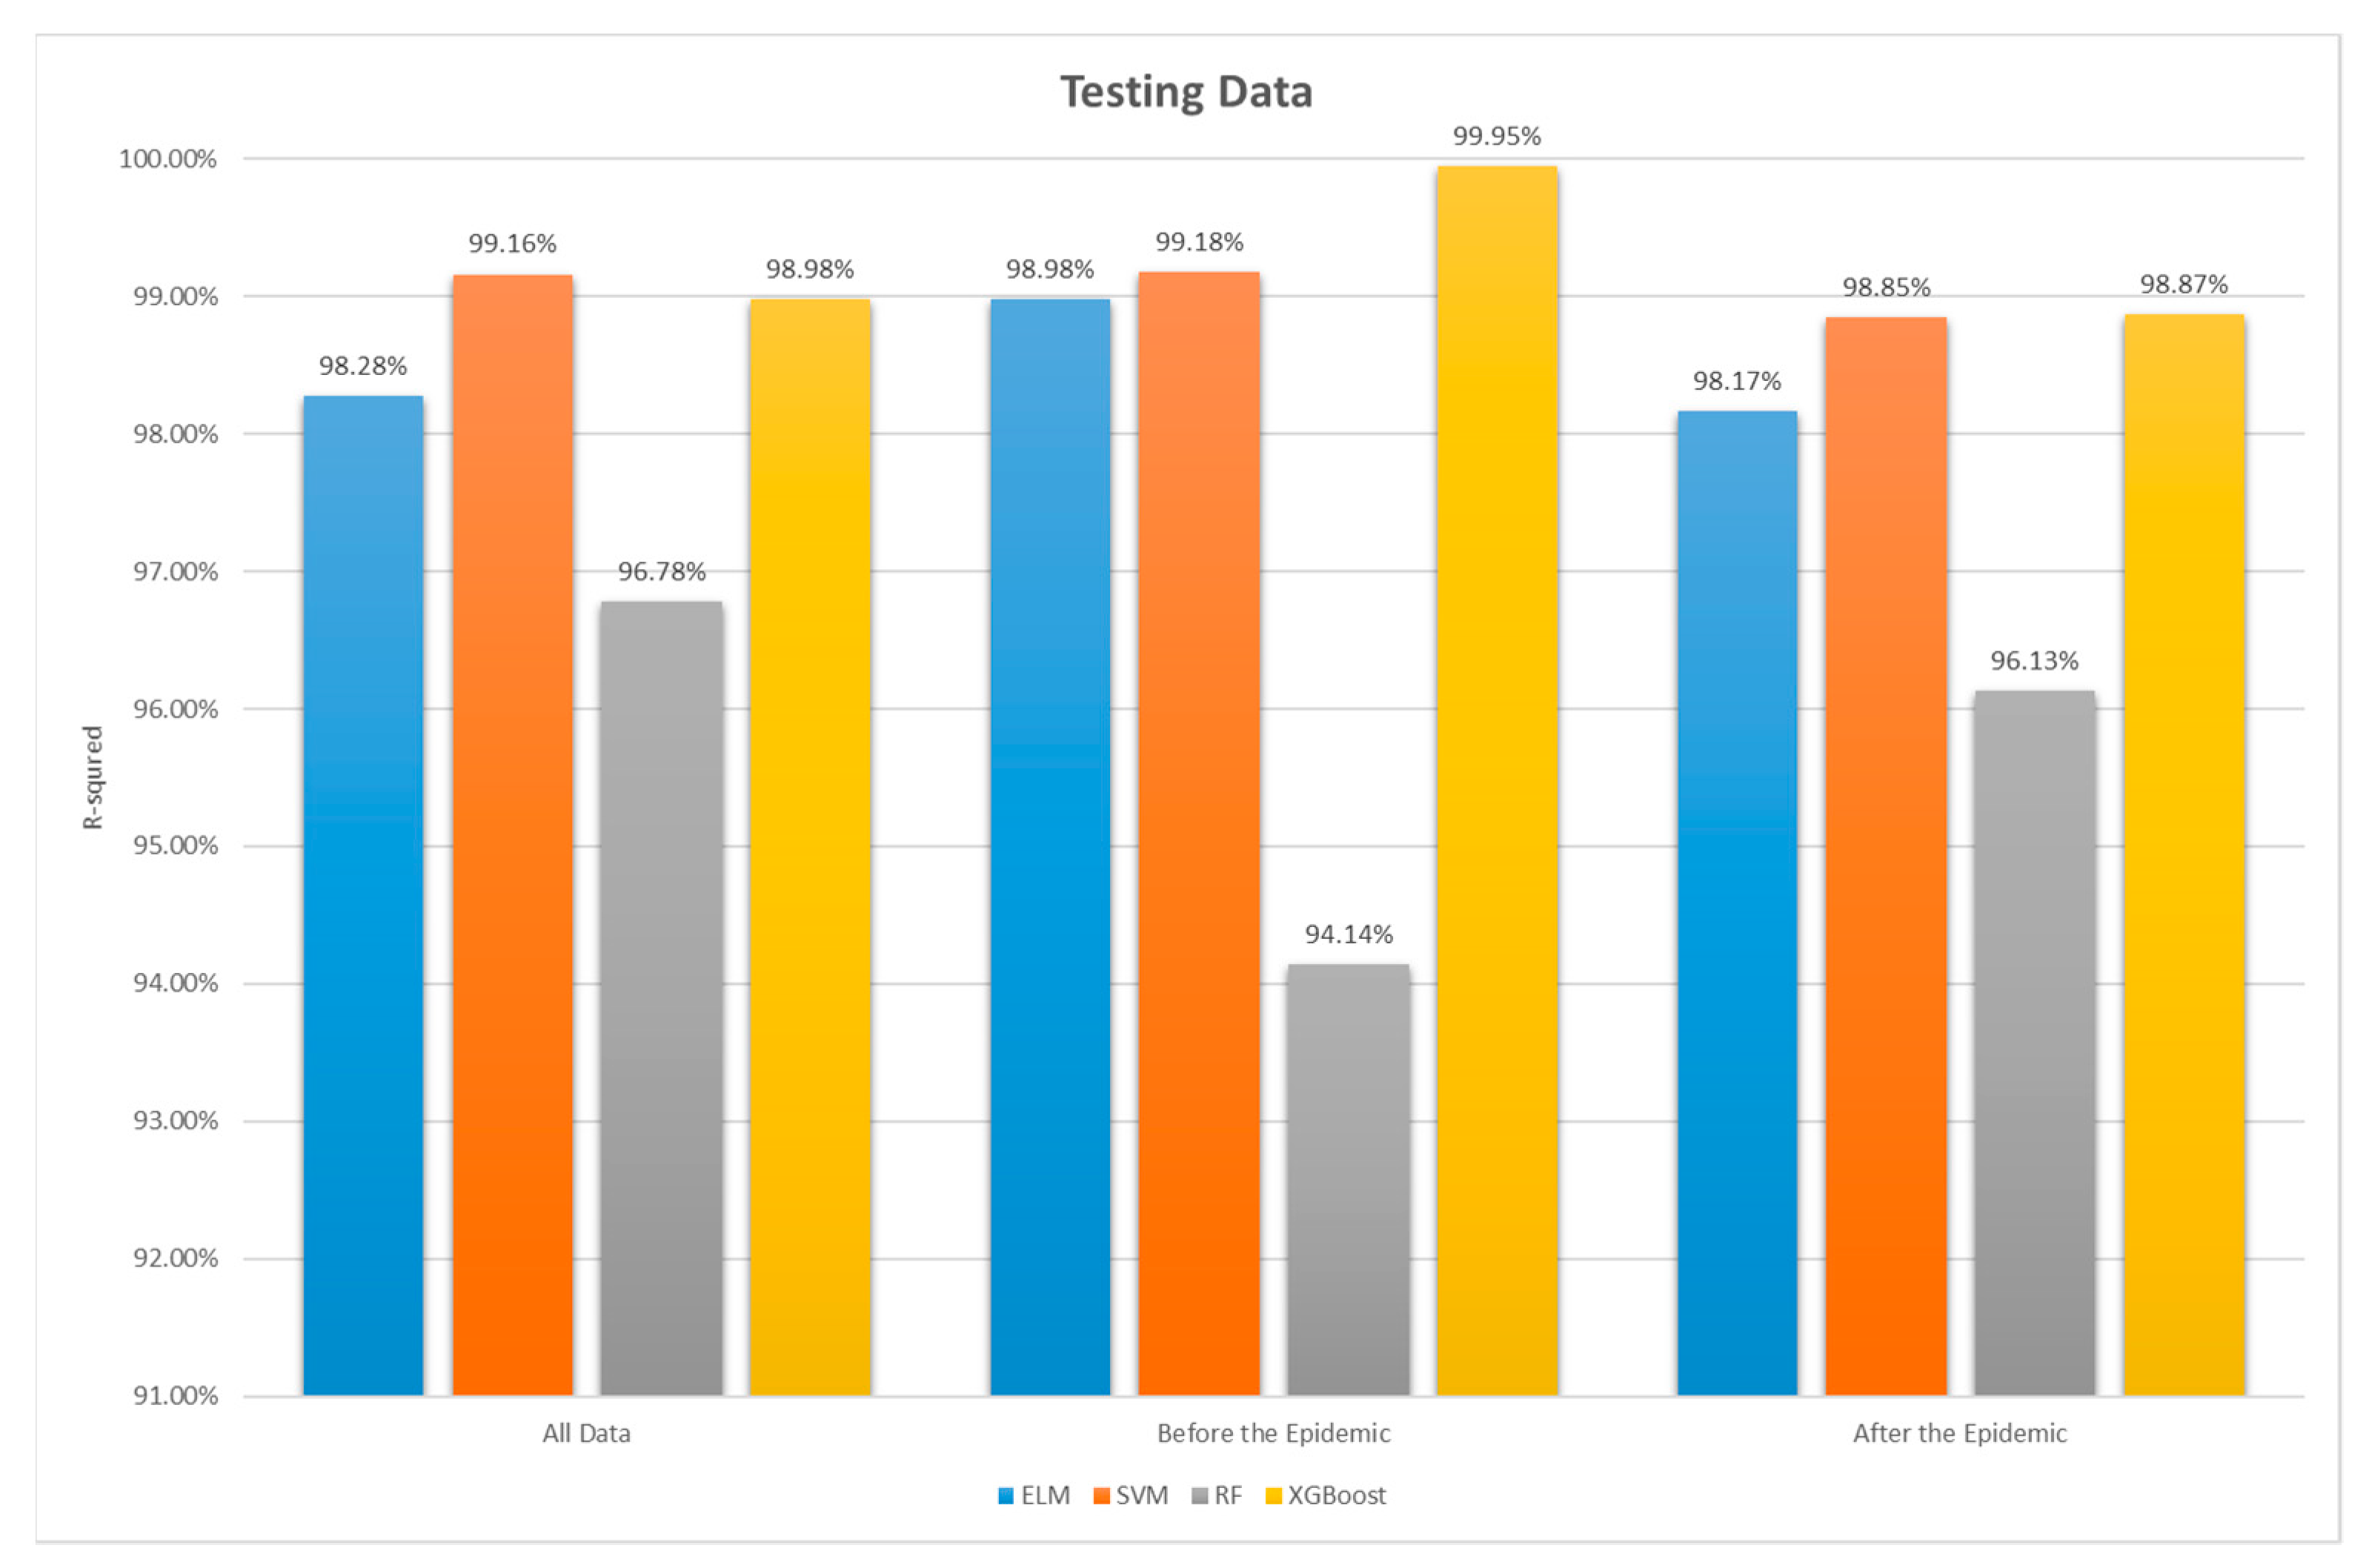
  • Overall, all four machine learning models, whether during the pandemic or non-pandemic periods or for the entire period from 2018 to 2021, have an r2 value greater than 0.975 in the training stage and greater than 0.94 in the testing stage. Generally, an r2 value ranges from 0 to 1, where an r2 value greater than 0.75 indicates a well-fitted model with high interpretability, while an r2 value less than 0.5 indicates poor model fitting. The results of this study show that all four models have good predictive capabilities for ESG scores in both the training and testing stages. Especially for ELM, XGBoost, and SVM models, their testing stage r2 values are all above 0.98, indicating excellent performance. Therefore, it can be inferred that, in terms of supervised learning models, machine learning is faster and more suitable for predicting complex problems than traditional mathematical models. For predicting ESG scores, machine learning is highly suitable and effective.
  • Regarding ESG prediction, the accuracy is consistently high, regardless of whether during the pandemic or non-pandemic periods, with no significant differences. In the testing stage, ELM and SVM show better predictive performance during non-pandemic periods, while RF performs better during pandemic periods. As for XGBoost, although its r2 value during non-pandemic periods is better, the RMSE, MAPE, and MAE metrics show the opposite result. Although the differences are not significant, the inconsistent performance among different metrics still warrants further research and investigation. Therefore, this study concludes that the predictive performance of RF and XGBoost models is inferior to that of ELM and SVM models.
  • While the extensive and widespread use of artificial intelligence and machine learning has become a trend in recent years, challenges such as overfitting and the “black box” nature of learning algorithms still exist. Specifically, the ELM model’s limitation lies in its random initialization of input weights and biases, making it effective only for simple functions and small labeled datasets. The SVM model also encounters similar issues, including a tendency to overfit, limitations in handling large samples, and complex clustering problems. Future research could explore the integration of genetic algorithms in the preliminary training phase to enhance and refine the parameter optimization processes for ELMs and SVMs.
  • Since the outbreak of COVID-19 in 2020, global attention to sustainability issues has become more intense than ever. The rise in ESG awareness poses challenges to traditional business models, impacting various aspects such as economic factors (investment trends in financial markets), social considerations (expectations from stakeholders such as investors and the general public for increased focus on sustainability), technological advancements (sustainable innovation in fields such as environmental protection and carbon reduction), environmental considerations (incorporating environmental factors into supply chain planning), as well as legal and political aspects. While this study mainly examines the correlation between ESG scores and financial performance and corporate governance, future research could consider incorporating technical, social, and policy-related dimensions to strengthen the overall ESG rating criteria, thereby improving the comprehensiveness of ESG evaluation mechanisms.

Author Contributions

Conceptualization, H.-Y.L. and B.-W.H.; methodology, H.-Y.L.; software, H.-Y.L.; validation, H.-Y.L. and B.-W.H.; formal analysis, H.-Y.L. and B.-W.H.; investigation, H.-Y.L.; resources, H.-Y.L. and B.-W.H.; data curation, H.-Y.L.; writing—original draft preparation, H.-Y.L. and B.-W.H.; writing—review and editing, H.-Y.L. and B.-W.H.; visualization, H.-Y.L.; supervision, B.-W.H.; project administration, H.-Y.L. All authors have read and agreed to the published version of the manuscript.

Funding

This research received no external funding.

Institutional Review Board Statement

Not applicable.

Informed Consent Statement

Not applicable.

Data Availability Statement

The research data can be provided upon reasonable request.

Conflicts of Interest

The authors declare no conflict of interest.

References

  1. Alipour, P.; Bastani, A.F. Value-at-Risk-Based Portfolio Insurance: Performance Evaluation and Benchmarking Against CPPI in a Markov-Modulated Regime-Switching Market. arXiv 2023, arXiv:2305.12539. [Google Scholar]
  2. Zheng, W.; Yin, L.; Chen, X.; Ma, Z.; Liu, S.; Yang, B. Knowledge base graph embedding module design for Visual question answering model. Pattern Recognit. 2021, 120, 108153. [Google Scholar] [CrossRef]
  3. PwC. Global Investor Survey: The Economic Realities of ESG. December 2021. Available online: https://www.pwc.com/gx/en/services/audit-assurance/corporate-reporting/2021-esg-investor-survey.html (accessed on 1 June 2023).
  4. Kao, L.L. ESG-Based Performance Assessment of the Operation and Management of Industrial Parks in Taiwan. Sustainability 2023, 15, 1424. [Google Scholar] [CrossRef]
  5. Choi, Y.; Wang, J.; Zhu, Y.; Lai, W. Students’ perception and expectation towards pharmacy education: A qualitative study of pharmacy students in a developing country. Indian J. Pharm. Educ. Res. 2021, 55, 63–69. [Google Scholar] [CrossRef]
  6. Shen, L.; Wu, Y.; Zhang, X. Key Assessment Indicators for the Sustainability of Infrastructure Projects. J. Constr. Eng. Manag. 2011, 137, 441–451. [Google Scholar] [CrossRef]
  7. Dong, X.; Du, X.; Li, K.; Zeng, S.; Bledsoe, B.P. Benchmarking Sustainability of Urban Water Infrastructure Systems in China. J. Clean. Prod. 2018, 170, 330–338. [Google Scholar] [CrossRef]
  8. Koop, S.H.A.; van Leeuwen, C.J. Assessment of the Sustainability of Water Resources Management: A Critical Review of the City Blueprint Approach. Water Resour. Manag. 2015, 29, 5649–5670. [Google Scholar] [CrossRef]
  9. Gore, R.; Lynch, C.J.; Jordan, C.A.; Collins, A.; Robinson, R.M.; Fuller, G.; Ames, P.; Keerthi, P.; Kandukuri, Y. Estimating the Health Effects of Adding Bicycle and Pedestrian Paths at the Census Tract Level: Multiple Model Comparison. JMIR Public Health Surveill. 2022, 8, e37379. [Google Scholar] [CrossRef]
  10. Zamponi, V.; O’Brien, K.; Jensen, E.; Feldhaus, B.; Moore, R.; Lynch, C.J.; Gore, R. Understanding and Assessing Demographic (In)Equity Resulting from Extreme Heat and Direct Sunlight Exposure Due to Lack of Tree Canopies in Norfolk, VA Using Agent-Based Modeling. Ecol. Model. 2023, 483, 110445. [Google Scholar] [CrossRef]
  11. Christensen, D.M.; Serafeim, G.; Sikochi, A. Why is corporate virtue in the eye of the beholder? The case of ESG ratings. Account. Rev. 2022, 97, 147–175. [Google Scholar] [CrossRef]
  12. D’Amato, V.; D’Ecclesia, R.; Levantesi, S. ESG score prediction through Random Forest algorithm. Comput. Manag. Sci. 2021, 19, 347–373. [Google Scholar] [CrossRef]
  13. Abhayawansa, S.; Tyagi, S. Sustainable investing: The black box of environmental, social, and governance (ESG) ratings. J. Wealth Manag. 2021, 24, 49–54. [Google Scholar] [CrossRef]
  14. Liu, M. Quantitative ESG disclosure and divergence of ESG ratings. Front. Psychol. 2022, 13, 936798. [Google Scholar] [CrossRef]
  15. Chatterji, A.K.; Durand, R.; Levine, D.I.; Touboul, S. Do ratings of firms converge? Implications for managers, investors, and strategy researchers. Strateg. Manag. J. 2016, 37, 1597–1614. [Google Scholar] [CrossRef]
  16. Gibson, B.R.; Krueger, P.; Schmidt, P.S. ESG rating disagreement and stock returns. Financ. Anal. J. 2021, 77, 104–127. [Google Scholar] [CrossRef]
  17. Berg, F.; Koelbel, J.F.; Rigobon, R. Aggregate confusion: The divergence of ESG rating. Rev. Financ. 2022, 26, 1–30. [Google Scholar] [CrossRef]
  18. Avramov, D.; Cheng, S.; Lioui, A.; Tarelli, A. Sustainable investing with ESG rating uncertainty. J. Finan. Econ. 2022, 145, 642–664. [Google Scholar] [CrossRef]
  19. Kotsantonis, S.; Serafeim, G. Four Things No One Will Tell You About ESG Data. J. Appl. Corp. Financ. 2019, 31, 50–58. [Google Scholar] [CrossRef]
  20. Li, C.; Zhang, L.; Huang, J.; Xiao, H.; Zhou, Z. Social responsibility portfolio optimization incorporating ESG criteria. J. Manag. Sci. Eng. 2021, 6, 75–85. [Google Scholar]
  21. Galagedera, D.U.A. Modelling social responsibility in mutual fund performance appraisal: A two-stage data envelopment analysis model with non-discretionary first stage output. Qual. Quant. 2019, 273, 376–389. [Google Scholar] [CrossRef]
  22. Licari, J.; Loiseau-Aslanidi, O.; Piscaglia, S.; Solis Gonzalez, B. ESG Score Predictor: Applying a Quantitative Approach for Expanding Company Coverage. Moody’s Anal. Available online: https://www.moodysanalytics.com/-/media/article/2021/esg-score-predictor.pdf (accessed on 23 July 2023).
  23. Del Vitto, A.; Marazzina, D.; Stocco, D. ESG Ratings Explainability through Machine Learning Techniques. Ann. Oper. Res. 2023, 1–30. [Google Scholar] [CrossRef]
  24. Wang, H.; Lengerich, B.J.; Aragam, B.; Xing, E.P. Precision Lasso: Accounting for Correlations and Linear Dependencies in High-Dimensional Genomic Data. Bioinformatics 2019, 35, 1181–1187. [Google Scholar] [CrossRef] [PubMed]
  25. Tehranian, K. Can Machine Learning Catch Economic Recessions Using Economic and Market Sentiments? arXiv 2023, arXiv:2308.16200. [Google Scholar] [CrossRef]
  26. Maydanchi, M.; Ziaei, A.; Basiri, M.; Azad, A.N.; Pouya, S.; Ziaei, M.; Haji, F.; Sargolzaei, S. Comparative Study of Decision Tree, AdaBoost, Random Forest, Naïve Bayes, KNN, and Perceptron for Heart Disease Prediction. In Proceedings of the SoutheastCon 2023, Orlando, FL, USA, 1–16 April 2023; pp. 204–208. [Google Scholar] [CrossRef]
  27. Ghasemi, A.; Naser, M.Z. Tailoring 3D Printed Concrete through Explainable Artificial Intelligence. Structures 2023, 56, 104850. [Google Scholar] [CrossRef]
  28. Wang, Y.; Wang, X.; Ariffin, M.M.; Abolfathi, M.; Alqhatani, A.; Almutairi, L. Attack Detection Analysis in Software-Defined Networks Using Various Machine Learning Methods. Comput. Electr. Eng. 2023, 108, 108655. [Google Scholar] [CrossRef]
  29. Ang, G.; Guo, Z.; Lim, E.P. On Predicting ESG Ratings Using Dynamic Company Networks. ACM Trans. Manag. Inf. Syst. 2023, 14, 1–34. [Google Scholar] [CrossRef]
  30. Biju, A.K.V.N.; Thomas, A.S.; Thasneem, J. Examining the Research Taxonomy of Artificial Intelligence, Deep Learning & Machine Learning in the Financial Sphere—A Bibliometric Analysis. Qual. Quant. 2023, 2, 1–30. [Google Scholar]
  31. Sokolov, A.; Mostovoy, J.; Ding, J.; Seco, L. Building Machine Learning Systems for Automated ESG Scoring. J. Impact ESG Investig. 2021, 1, 39–50. [Google Scholar] [CrossRef]
  32. Svanberg, J.; Ardeshiri, T.; Samsten, I.; Öhman, P.; Neidermeyer, P. Prediction of Controversies and Estimation of ESG Performance: An Experimental Investigation Using Machine Learning. In Handbook of Big Data and Analytics in Accounting and Auditing; Rana, T., Svanberg, J., Öhman, P., Lowe, A., Eds.; Springer: Singapore, 2023; pp. 65–87. [Google Scholar]
  33. Dwivedi, D.; Batra, S.; Pathak, Y.K. A Machine Learning Based Approach to Identify Key Drivers for Improving Corporate’s ESG Ratings. J. Law Sustain. Dev. 2023, 11, 1–15. [Google Scholar] [CrossRef]
  34. D’Amato, V.; D’Ecclesia, R.; Levantesi, S. Fundamental Ratios as Predictors of ESG Scores: A Machine Learning Approach. Decis. Econ. Financ. 2021, 44, 1087–1110. [Google Scholar] [CrossRef]
  35. García, F.; González-Bueno, J.; Guijarro, F.; Oliver, J. Forecasting the Environmental, Social, and Governance Rating of Firms by Using Corporate Financial Performance Variables: A Rough Set Approach. Sustainability 2020, 12, 3324. [Google Scholar] [CrossRef]
  36. Krappel, T.; Bogun, A.; Borth, D. Heterogeneous Ensemble for ESG Ratings Prediction. arXiv 2021, arXiv:2109.10085. [Google Scholar]
  37. Dorogush, A.V.; Ershov, V.; Gulin, A. CatBoost: Gradient Boosting with Categorical Features Support. arXiv 2018, arXiv:1810.11363. [Google Scholar]
  38. Chen, T.; Guestrin, C. XGBoost: A Scalable Tree Boosting System. In Proceedings of the 22nd ACM SIGKDD International Conference on Knowledge Discovery and Data Mining; Association for Computing Machinery: New York, NY, USA, 2016; pp. 785–794. [Google Scholar]
  39. Jabeur, S.B.; Sadaaoui, A.; Sghaier, A.; Aloui, R. Machine Learning Models and Cost-Sensitive Decision Trees for Bond Rating Prediction. J. Oper. Res. Soc. 2020, 71, 1161–1179. [Google Scholar] [CrossRef]
  40. Jones, S.; Johnstone, D.; Wilson, R. An Empirical Evaluation of the Performance of Binary Classifiers in the Prediction of Credit Ratings Changes. J. Bank. Financ. 2015, 56, 72–85. [Google Scholar] [CrossRef]
  41. Ozturk, H.; Namli, E.; Erdal, H.I. Modelling Sovereign Credit Ratings: The Accuracy of Models in a Heterogeneous Sample. Econ. Model. 2016, 54, 469–478. [Google Scholar] [CrossRef]
  42. Teoh, T.T.; Heng, Q.K.; Chia, J.J.; Shie, J.M.; Liaw, S.W.; Yang, M.; Nguwi, Y.Y. Machine Learning-Based Corporate Social Responsibility Prediction. In Proceedings of the 2019 IEEE International Conference on Cybernetics and Intelligent Systems (CIS) and IEEE Conference on Robotics, Automation and Mechatronics (RAM), Bangkok, Thailand, 18–20 November 2019; pp. 501–505. [Google Scholar]
  43. Michalski, L.; Lachlan; Low, R.K.Y. Corporate Credit Rating Feature Importance: Does ESG Matter? SSRN Paper 2021, 53–54. [Google Scholar] [CrossRef]
  44. Raza, H.; Khan, M.A.; Mazliham, M.S.; Alam, M.M.; Aman, N.; Abbas, K. Applying Artificial Intelligence Techniques for Predicting the Environment, Social, and Governance (ESG) Pillar Score Based on Balance Sheet and Income Statement Data: A Case of Non-Financial Companies of USA, UK, and Germany. Front. Environ. Sci. 2022, 10, 975487. [Google Scholar] [CrossRef]
  45. Agosto, A.; Cerchiello, P.; Giudici, P. Bayesian Learning Models to Measure the Relative Impact of ESG Factors on Credit Ratings. Int. J. Data Sci. Anal. 2023. [Google Scholar] [CrossRef]
  46. Shaik, A.B.; Srinivasan, S. A Brief Survey on Random Forest Ensembles in Classification Model. In International Conference on Innovative Computing and Communications; Bhattacharyya, S., Hassanien, A., Gupta, D., Khanna, A., Pan, I., Eds.; Springer: Singapore, 2019; pp. 1–5. [Google Scholar]
  47. Anguita, D.; Ghio, A.; Greco, N.; Oneto, L.; Ridella, S. Model Selection for Support Vector Machines: Advantages and Disadvantages of the Machine Learning Theory. In Proceedings of the 2010 International Joint Conference on Neural Networks (IJCNN), Barcelona, Spain, 18–23 July 2010; pp. 1–8. [Google Scholar]
  48. Ding, X.; Jiang, T.; Xue, W.; Li, Z.; Zhong, Y. A New Method of Human Gesture Recognition Using Wi-Fi Signals Based on XGBoost. In Proceedings of the 2020 IEEE/CIC International Conference on Communications in China (ICCC Workshops), Chongqing, China, 9–11 August 2020; pp. 237–241. [Google Scholar]
  49. Cao, J.W.; Zhang, K.; Luo, M.X.; Yin, C.; Lai, X.P. Extreme Learning Machine and Adaptive Sparse Representation for Image Classification. Neural Netw. 2016, 81, 91–102. [Google Scholar] [CrossRef]
  50. Burdekin, R.C.; Harrison, S. Relative Stock Market Performance during the Coronavirus Pandemic: Virus vs. Policy Effects in 80 Countries. J. Risk Financ. Manag. 2021, 14, 177. [Google Scholar] [CrossRef]
  51. Rubbaniy, G.; Khalid, A.A.; Rizwan, F.; Ali, S. Are ESG Stocks Safe-Haven during COVID-19? Studies in Economics and Finance 2021. Available online: https://ssrn.com/abstract=3779430 (accessed on 15 August 2023).
  52. Lee, M.T.; Suh, I. Understanding the Effects of Environment, Social, and Governance Conduct on Financial Performance: Arguments for a Process and Integrated Modelling Approach. Sustain. Technol. Entrep. 2022, 1, 100004. [Google Scholar] [CrossRef]
  53. Citterio, A.; King, T. The Role of Environmental, Social, and Governance (ESG) in Predicting Bank Financial Distress. Financ. Res. Lett. 2023, 51, 103411. [Google Scholar] [CrossRef]
  54. Aydoğmuş, M.; Gülay, G.; Ergun, K. Impact of ESG Performance on Firm Value and Profitability. Borsa Istanb. Rev. 2022, 22, S119–S127. [Google Scholar] [CrossRef]
  55. Gupta, A.; Sharma, U.; Gupta, S.K. The Role of ESG in Sustainable Development: An Analysis Through the Lens of Machine Learning. In Proceedings of the 2021 IEEE International Humanitarian Technology Conference (IHTC), Virtual, 2–4 December 2021; pp. 1–5. [Google Scholar]
  56. Kaiser, H.F. The Application of Electronic Computers to Factor Analysis. Educ. Psychol. Meas. 1960, 20, 141–151. [Google Scholar] [CrossRef]
  57. Kaiser, H.F. An Index of Factorial Simplicity. Psychometrika 1974, 39, 31–36. [Google Scholar] [CrossRef]
  58. Cortes, C.; Vapnik, V. Support-Vector Networks. Mach. Learn. 1995, 20, 273–297. [Google Scholar] [CrossRef]
  59. Breiman, L. Random Forests. Mach. Learn. 2001, 45, 5–32. [Google Scholar] [CrossRef]
  60. Lewis, E.B. Control of Body Segment Differentiation in Drosophila by the Bithorax Gene Complex. Embryonic Dev. 1982, 1, 383–417. [Google Scholar]
Figure 1. Research Framework.
Sustainability 15 14106 g001
Figure 2. Flowchart of this Research Process.
Sustainability 15 14106 g002
Figure 3. Comparison of r2 for the four Models during the Training Phase.
Sustainability 15 14106 g003
Figure 4. Comparison of r2 for the four Models during the Testing Phase.
Sustainability 15 14106 g004
Figure 5. Line Graphs of Actual Values and Predicted Values for the four Models.
Sustainability 15 14106 g005
Table 1. Independent Variables.
CategoryVariables
ESG IndicatorsEnvironmental Aspect Score
Social Aspect Score
Corporate Governance Aspect Score
Financial IndicatorsLong-term capital adequacy ratio (%)
Current ratio (%)
Quick ratio (%)
Fixed assets turnover ratio
Return on Operating Assets (%)
ROA(A) before tax and interest
ROE(A) after tax
Operating profit to paid-up capital ratio (%)
Pre-tax net income to paid-up capital ratio (%)
Net profit margin after tax (%)
Sustainable EPS
Corporate Governance IndicatorsStock Earnings Deviation (%)
Stock Seats Deviation Ratio (%)
Earnings Seats Deviation Ratio (%)
Seats Earnings Deviation Multiplier
Total Shares Held by Directors
Shares Held by Directors’ Relatives
Shares Held by Supervisors
Supervisor Ownership Ratio (%)
Shares Held by Managers
Shares Held by Managers’ Relatives
Manager Pledged Shares
Number of Regular Directors
Number of Independent Supervisors
Table 2. Number of datapoints by different TESG Categories.
TESG CategoryPre-PandemicPandemicEntire Period
Chemical Industry6495159
Cultural and Creative Industry1786103
Cement Industry141428
Semiconductor148381529
Biotechnology and Medical Care100390490
Optoelectronics Industry103301404
Automobile Industry3269101
Other Electronic Industry89194283
Oil, Electricity, and Gas Industry82836
Building Materials and Construction108164272
Glass and Ceramics81018
Food Industry4961110
Textile and Fiber Industry94110204
Shipping Industry376299
Communication and Networking Industry87198285
Paper Industry121325
Trade and Department Stores3583118
Plastic Industry425294
Information Services Industry38103141
Agricultural Technology31619
E-commerce32225
Electronic Retailing4374117
Electronic Components230449679
Computers and Peripherals122235357
Electrical Equipment and Cables303868
Electrical Machinery110227337
Rubber Industry212546
Steel Industry68101169
Tourism Industry26109135
Electronic Industry044
Others62312374
Table 3. Parameter Settings for Each Model in the Study.
ELM
Hidden Layer1 layer
Hidden Layer Nodes30
Feature Mapping FunctionSigmoid Function
Other ParametersDefault settings for the program
RF
Number of decision trees20
Decision Tree FunctionTreeBagger Function
Feature Splitting MethodCurvature
Other ParametersDefault settings for the program
SVM
Feature FunctionLinear Kernel Function
Other parametersDefault settings for the program
XGBoost
Booster Typegbtree
Learning Rate0.1
Max_delta_step5
Number of Iterations500
Parallel Tree Construction1
Table 4. Independent Variables.
PeriodTraining SampleTesting Sample
Entire Period (2018–2021)40801749
Pre-Pandemic (2018–2019)1262541
Pandemic (2020–2021)28181208
Table 5. Statistical Significance Test Results-Entire Period (2018–2021).
Predicted ValuesMeanSDtp-Value
/Significance (Two-Tailed)
ELMTraining54.25118.40780.0070.995
Testing52.89988.7541−0.4680.640
SVMTraining54.23058.4123−0.1490.881
Testing52.97468.6652−0.1020.919
RFTraining54.24688.0846−0.0270.978
Testing53.21247.91971.1450.252
XGBoostTraining54.25028.45510.0001.000
Testing53.03888.58010.2100.833
Table 6. Training and Testing Empirical Results.
PeriodIndexStageELMSVMRFXGBoost
Entire Period
(2018–2021)
RMSETraining0.90220.83640.93440.1854
Testing1.14110.79851.56020.8802
MAETraining0.60850.55050.62690.1365
Testing0.61000.53091.11780.6359
MAPETraining1.11831.01101.17830.2542
Testing1.15911.00532.19231.2156
r2Training0.98860.99020.98780.9995
Testing0.98280.99160.96780.9898
Pre-Pandemic
(2018–2019)
RMSETraining0.89950.82501.20950.0517
Testing0.90030.81042.16090.9995
MAETraining0.59140.53540.83910.0364
Testing0.59670.51931.53450.7035
MAPETraining1.08210.98021.56550.0679
Testing1.06220.93332.72731.2584
r2Training0.98680.98890.97620.9999
Testing0.98980.99180.94140.9995
Pandemic
(2020–2021)
RMSETraining0.90360.80891.01060.1258
Testing1.11510.88271.62050.8745
MAETraining0.61200.54000.68680.0914
Testing0.67220.57021.16550.6331
MAPETraining1.13801.00331.29790.1716
Testing1.27211.07942.27051.2166
r2Training0.98950.99160.98680.9998
Testing0.98170.98850.96130.9887
Disclaimer/Publisher’s Note: The statements, opinions and data contained in all publications are solely those of the individual author(s) and contributor(s) and not of MDPI and/or the editor(s). MDPI and/or the editor(s) disclaim responsibility for any injury to people or property resulting from any ideas, methods, instructions or products referred to in the content.

