Article

Consumers’ Awareness of Fish Traceability and Sustainability: An Exploratory Study in Italy and Spain

1
Department of Agricultural Sciences, University of Naples Federico II, 80138 Napoli, Italy
2
Enco Consulting—Enco Srl Via Michelangelo Schipa, 115, 80122 Napoli, Italy
3
Centre for Food Innovation and Development in the Food Industry, University of Naples Federico II, 80138 Napoli, Italy
4
Packaging, Transport & Logistics Research Center (ITENE), Albert Einstein 1, 46980 Paterna, Spain
*
Author to whom correspondence should be addressed.
Sustainability 2023, 15(19), 14103; https://doi.org/10.3390/su151914103
Submission received: 21 July 2023 / Revised: 8 September 2023 / Accepted: 22 September 2023 / Published: 23 September 2023

Abstract

:
Fish products are widely consumed in different European countries for their nutritional composition, such as their high protein content, omega-3 fatty acids, minerals, vitamins, and low carbohydrate content. Therefore, fishing provides important income and commercial opportunities in different Mediterranean coastal countries. As the increased consumption of fish products is leading to negative ecological impacts on marine flora and fauna, sustainability labels are increasingly emerging. Furthermore, to increase transparency in the fisheries sector and increase consumer confidence when purchasing, fish traceability is becoming increasingly important. Therefore, this study aimed to analyze the importance of fish traceability and the knowledge of some fish sustainability labels in two European coastal countries, Italy and Spain. The investigation was carried out through an online questionnaire filled out by 1913 consumers in Italy and Spain. The main results show that receiving traceability information was mainly important for the Italian population, while, although fish sustainability is increasingly important, respondents did not demonstrate that they frequently buy fish products with sustainability labels. The study also highlighted how the main characteristics of the respondents may influence their habits and perceptions regarding the issues.

1. Introduction

Fish products are widely consumed all around the world thanks to their nutritional composition. In particular, they are the primary dietary source of long-chain fatty acids (omega-3), including eicosapentaenoic acid (EPA) and docosahexaenoic (DHA), but also, they are rich in proteins, minerals, and vitamins and poor in carbohydrates [1,2]. Over the years, the consumption of fish products increased; indeed, as the FAO reported in 2014 [3], global per capita fish consumption increased from an average of 9.9 kg in the 1960s to 19.2 kg in 2012. It is expected that the value can reach 21.8 kg in 2050 [4]. The increasing demand for fish products is due to several reasons, including an increase in diet-related chronic diseases and a consumer’s higher interest in healthy foods [5,6]; the globalisation of the fish trade, which reduced commercial costs and made fish cheaper and more abundant; the growth in world population; and the increases in education levels, living standards, and product availability (e.g., frozen, thawed, canned, and refrigerated fish) [4,7,8,9]. The increase in fish consumption, and consequently, the increase in fishing activities, is becoming environmentally unsustainable and can threaten natural fish stocks in the sea [2,9]. Therefore, given the modern trends of interest in environmental sustainability [10], some brands are joining in sustainability programs. In this way, people can be informed about the reduced environmental impact of the food they consume [11,12]. Sustainability eco-labels aim to put a tag on the label, which should be easily recognised by the subjects during purchases and thus guide their purchasing choices towards more sustainable alternatives [13]. Among the most well-known fish sustainability labels is the Marine Stewardship Council (MSC), an international certification label for sustainable and well-managed fisheries [14]. The sustainability objective of the MSC label is expressed in three principles: to protect fish stocks in the sea by avoiding overfishing, to use fishing techniques that do not have a negative impact on marine flora and fauna, and to properly manage fisheries [15]. The MSC label can only be attributed to capture fisheries; as far as farming is concerned, the Aquaculture Stewardship Council (ASC) label certifies farms that apply sustainable farming practices. Specifically, the ASC’s objective is to protect local fauna, maintain farm water quality standards, respect harvest cycles, and follow strict guidelines for the administration of medicines and the correct formulation of farm feeds [16]. Another sustainability label for farmed fish products is Best Aquaculture Practices (BAP). BAP certifies environmentally responsible aquaculture, food safety, animal welfare, and product traceability [17,18]. Finally, another popular label is Friend of the Sea (FOS), whose main objective is the conservation of marine habitats. In contrast to the previous ones, it is applicable for both capture fisheries and farming [19].
Adhering to a sustainability eco-label has a higher cost for a company, which translates into a higher cost for the consumer [13,20]. Other authors have highlighted how the increase in the sales price may be perceived by the subjects as a barrier to consumption or may direct them to choose a cheaper but unlabelled sustainability alternative [21,22,23]. A further problem related to sustainability labels is that there are often no adequate dissemination campaigns to make sustainability labels known, so many people are aware of the label, but do not know what the objectives are behind the simple label [24].
Moreover, the increased abundance of fish products along the supply chain can lead to problems of authenticity, and thus, mislabeling among similar fish species could mislead less experienced consumers [25]. For this reason, another important modern focus is on food traceability. Traceability is a useful tool to communicate all the information about the purchased fish product’s journey from the sea to the final consumer. In addition, a traced product can guarantee higher quality, can improve consumer confidence, and finally can be a useful tool for possible food-related issues [26,27]. As reported in other studies [26], the increase in food-related issues over the years has increased the need for verified and guaranteed information on food quality and safety, especially for animal and highly perishable food products.
This study takes part in the SUREFISH project, whose main objective is to valorise traditional Mediterranean fish by fostering supply-chain innovation and consumer confidence in Mediterranean fish products by deploying innovative solutions to achieve unequivocal traceability and confirming their authenticity, thus preventing fraud.
Given the current state of fisheries in the Mediterranean area and the needs of consumers, this study aims to learn about the importance given by consumers to the traceability of purchased fish species and knowledge of fish sustainability labels. The study involved two coastal European countries, Italy and Spain, where consumers were sent a questionnaire to fill out online. The choice of these two countries is because they are both coastal countries whose economies are based on fishing. Moreover, coastal countries have the highest consumption frequency of fish products; as previously reported in 2019 [28], per capita seafood consumption in Italy and Spain was approximately 31.21 and 46.02 kg per year, respectively. Abundant consumption may be due to the strategic location that allows them to have large supplies of such products and culinary traditions [29].
Since traceability is linked to the authenticity and freshness of fish species [30,31], while fish sustainability labels only concern processed products [15], and since Italy and Spain are coastal countries whose fish consumption habits are more oriented toward fresh and local products [29], this study is based on three research questions:
RQ1. Do Italian and Spanish consumers consider it to be important to have information on the traceability of the fish species they buy?
RQ2. Are Italian and Spanish consumers familiar with the most well-known sustainability labels on the market?
RQ3. Can interest in fish traceability and sustainability be influenced by individual consumer characteristics?
The investigation of the above research questions will be helpful in identifying consumers’ characteristics that are useful for developing effective market strategies oriented toward traceable and sustainable food choices.

2. Materials and Methods

2.1. Research Overview

The online questionnaire was first developed in the Italian language by the Department of Agricultural Sciences of the University of Naples, Federico II; then, it was translated into Spanish by the Packaging, Transport and Logistics Research Centre (ITENE). The pre-tested questionnaire was administered in May and June 2021 to respondents by two market research agencies based in Italy and Spain, respectively. The online questionnaire was sent to 2003 consumers (1003 in Italy and 1000 in Spain), but only 1913 answers were considered (961 in Italy and 952 in Spain) because some of the respondents were not compatible with the objectives of the research (different diet habits, no fish liking, not fish consumers). In order to obtain a representative sample of both the Italian and Spanish population, the balancing requirements for participation requested from the market research agencies were age range (between 18 and 70 years old), gender (male, female), geographical location (coastal, inland city), number of inhabitants per population centre (up to 5000, between 5000 and 20,000, between 20,000 and 100,000, over 100,000 inhabitants), and educational qualification (middle school diploma, secondary school diploma, university degree, post-graduate formation). The study was conducted according to the guidelines of the Declaration of Helsinki and approved by the Institutional Review Board of the University of Naples, Federico II. Participants signed written informed consent in double copy. The privacy rights of human subjects were always observed, and names and surnames were not collected.

2.2. Online Questionnaire

The online questionnaire consisted of 10 questions, and it was subdivided into four different sections related to fish consumption habits and purchasing behaviour (1); perception of barriers to fish consumption (2); the importance of fish traceability and knowledge of sustainability labels (3); collection of respondents’ social-demographic information (4).
A summary of the questionnaire questions is shown in Table 1. In the first section, respondents were asked about their overall fish liking by using a 9-point hedonic scale (1 = “Extremely disliking”; 9 = “Extremely liking”) [32] and their fish consumption frequency by using a 7-point frequency scale (1 = “Never”, 2 = “Less than one per months”, 3 = “Once per months”, 4 = “2–3 times per months”, 5 = “Once a week”, 6 = “Twice a week” 7 = “More than two times per week”) (based on [33]). Finally, respondents were asked about the status of the purchased fish (fresh, frozen, canned, and processed) by using a 7-point frequency scale with the following anchors: 1 = “Never”, 4 = “Occasionally”, 7 = “Always” [34].
In the second section, the perception of barriers to fish consumption was analysed. respondents were provided with a list of five barriers (high price, time required to prepare fish meal, no cooking ability, high perishability, and no family preference, as reported by [34,35]), to which they had to respond by using a 7-point relevance scale (1 = “Not important”; 4 = “Indifferent”; 7 = “Absolutely important”).
In the third section, the definition of food traceability as “The ability to trace and follow a food, feed, food-producing animal or substance intended to be, or expected to be incorporated into a food or feed, through all stages of production, processing and distribution” [36] was provided to the respondents, and by using a 7-points relevance scale (1 = “Not important”, 4 = “Indifferent”, 7 = “Absolutely important”) the importance of fish traceability was analysed (based on [27]). Then, by using a 5-point familiarity scale [37] anchored with 1= “I do not know it”, 2 = “I know it, but I never bought it”, 3 = “I bought it once” 4 = “I bought it occasionally”, 5 = “I usually bought it “, respondents’ knowledge about fish sustainability labels was also analysed. The sustainability labels involved in the questionnaire were the following: Aquaculture Stewardship Council (ASC), Best Aquaculture Practices (BAP), Friend of the Sea (FOS), and Marine Stewardship Council (MSC).
Table 1. Summary of questionnaire.
SectionQuestionScaleAnswerReferences
1Fish liking1–9 hedonic scale(1) Extremely disliking—(9) extremely likingClaret et al., 2015 [32]
Consumption frequency1–7 frequency scale(1) Never, (2) less than once per month, (3) once per month, (4) 2–3 times per month, (5) once a week, (6) twice a week, (7) more than two times per weekHicks et al., 2008 [33]
Purchased status (fresh, frozen, canned, and processed)1–7 frequency scale(1) Never, (4) occasionally, (7) alwaysSaidi et al., 2022 [34]
2Barriers to consumption (high price, time required to prepare fish meals, no cooking ability, high perishability, no family preference)1–7 relevance scale(1) Not important, (4) indifferent, (7) absolutely important)Saidi et al., 2022 [34]; Vanhonacker et al., 2010 [35]
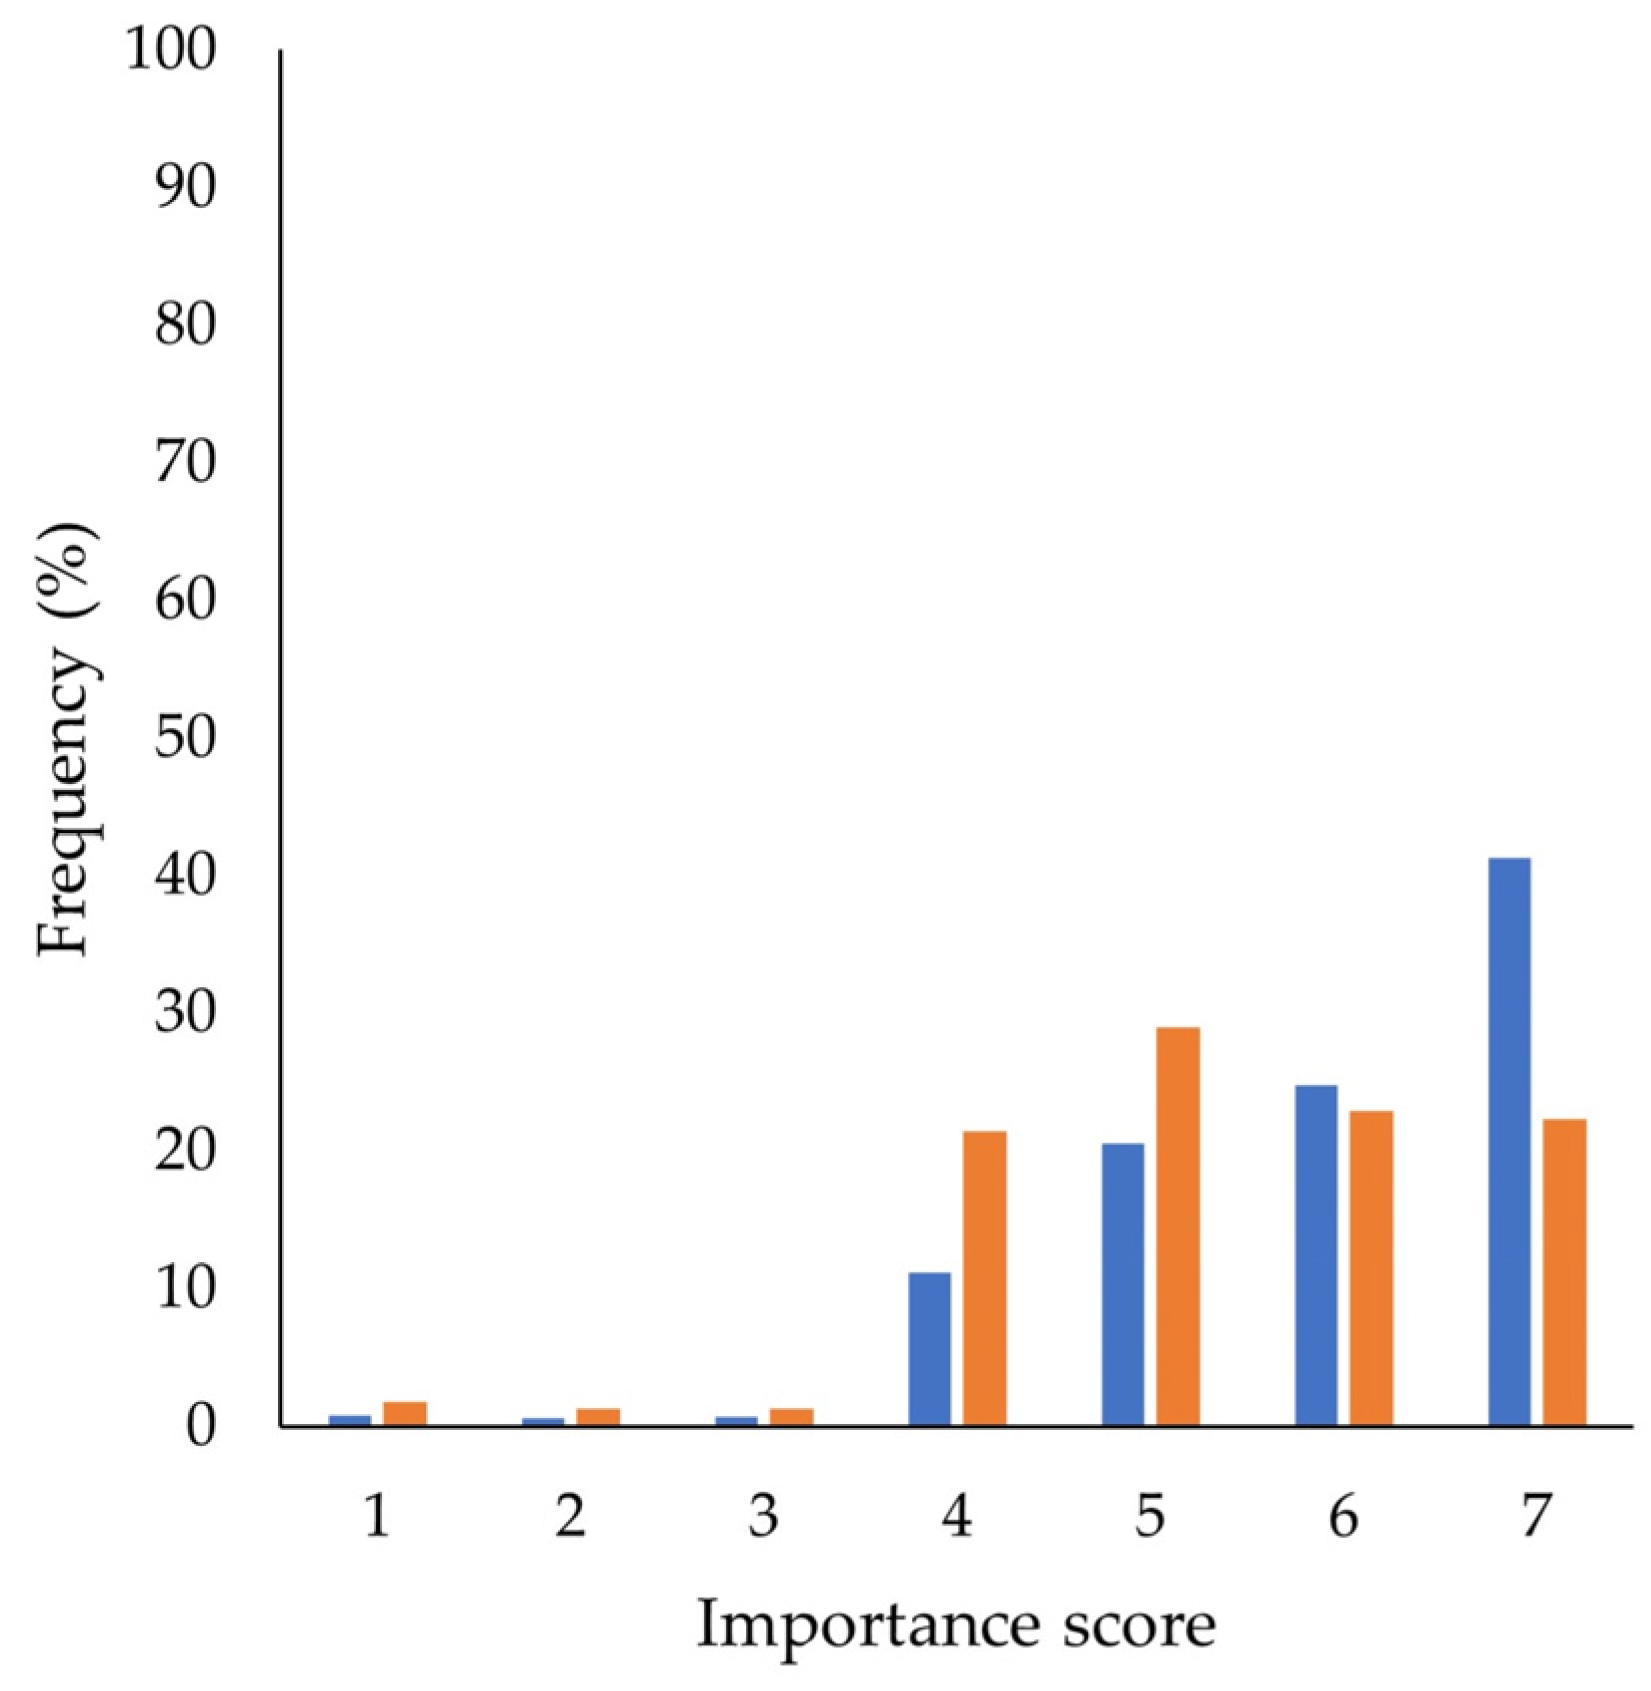
3Importance of fish traceability1–7 relevance scale(1) Not important, (4) indifferent, (7) absolutely important)Rodriguez-Salvador and Dopico, 2023 [27]
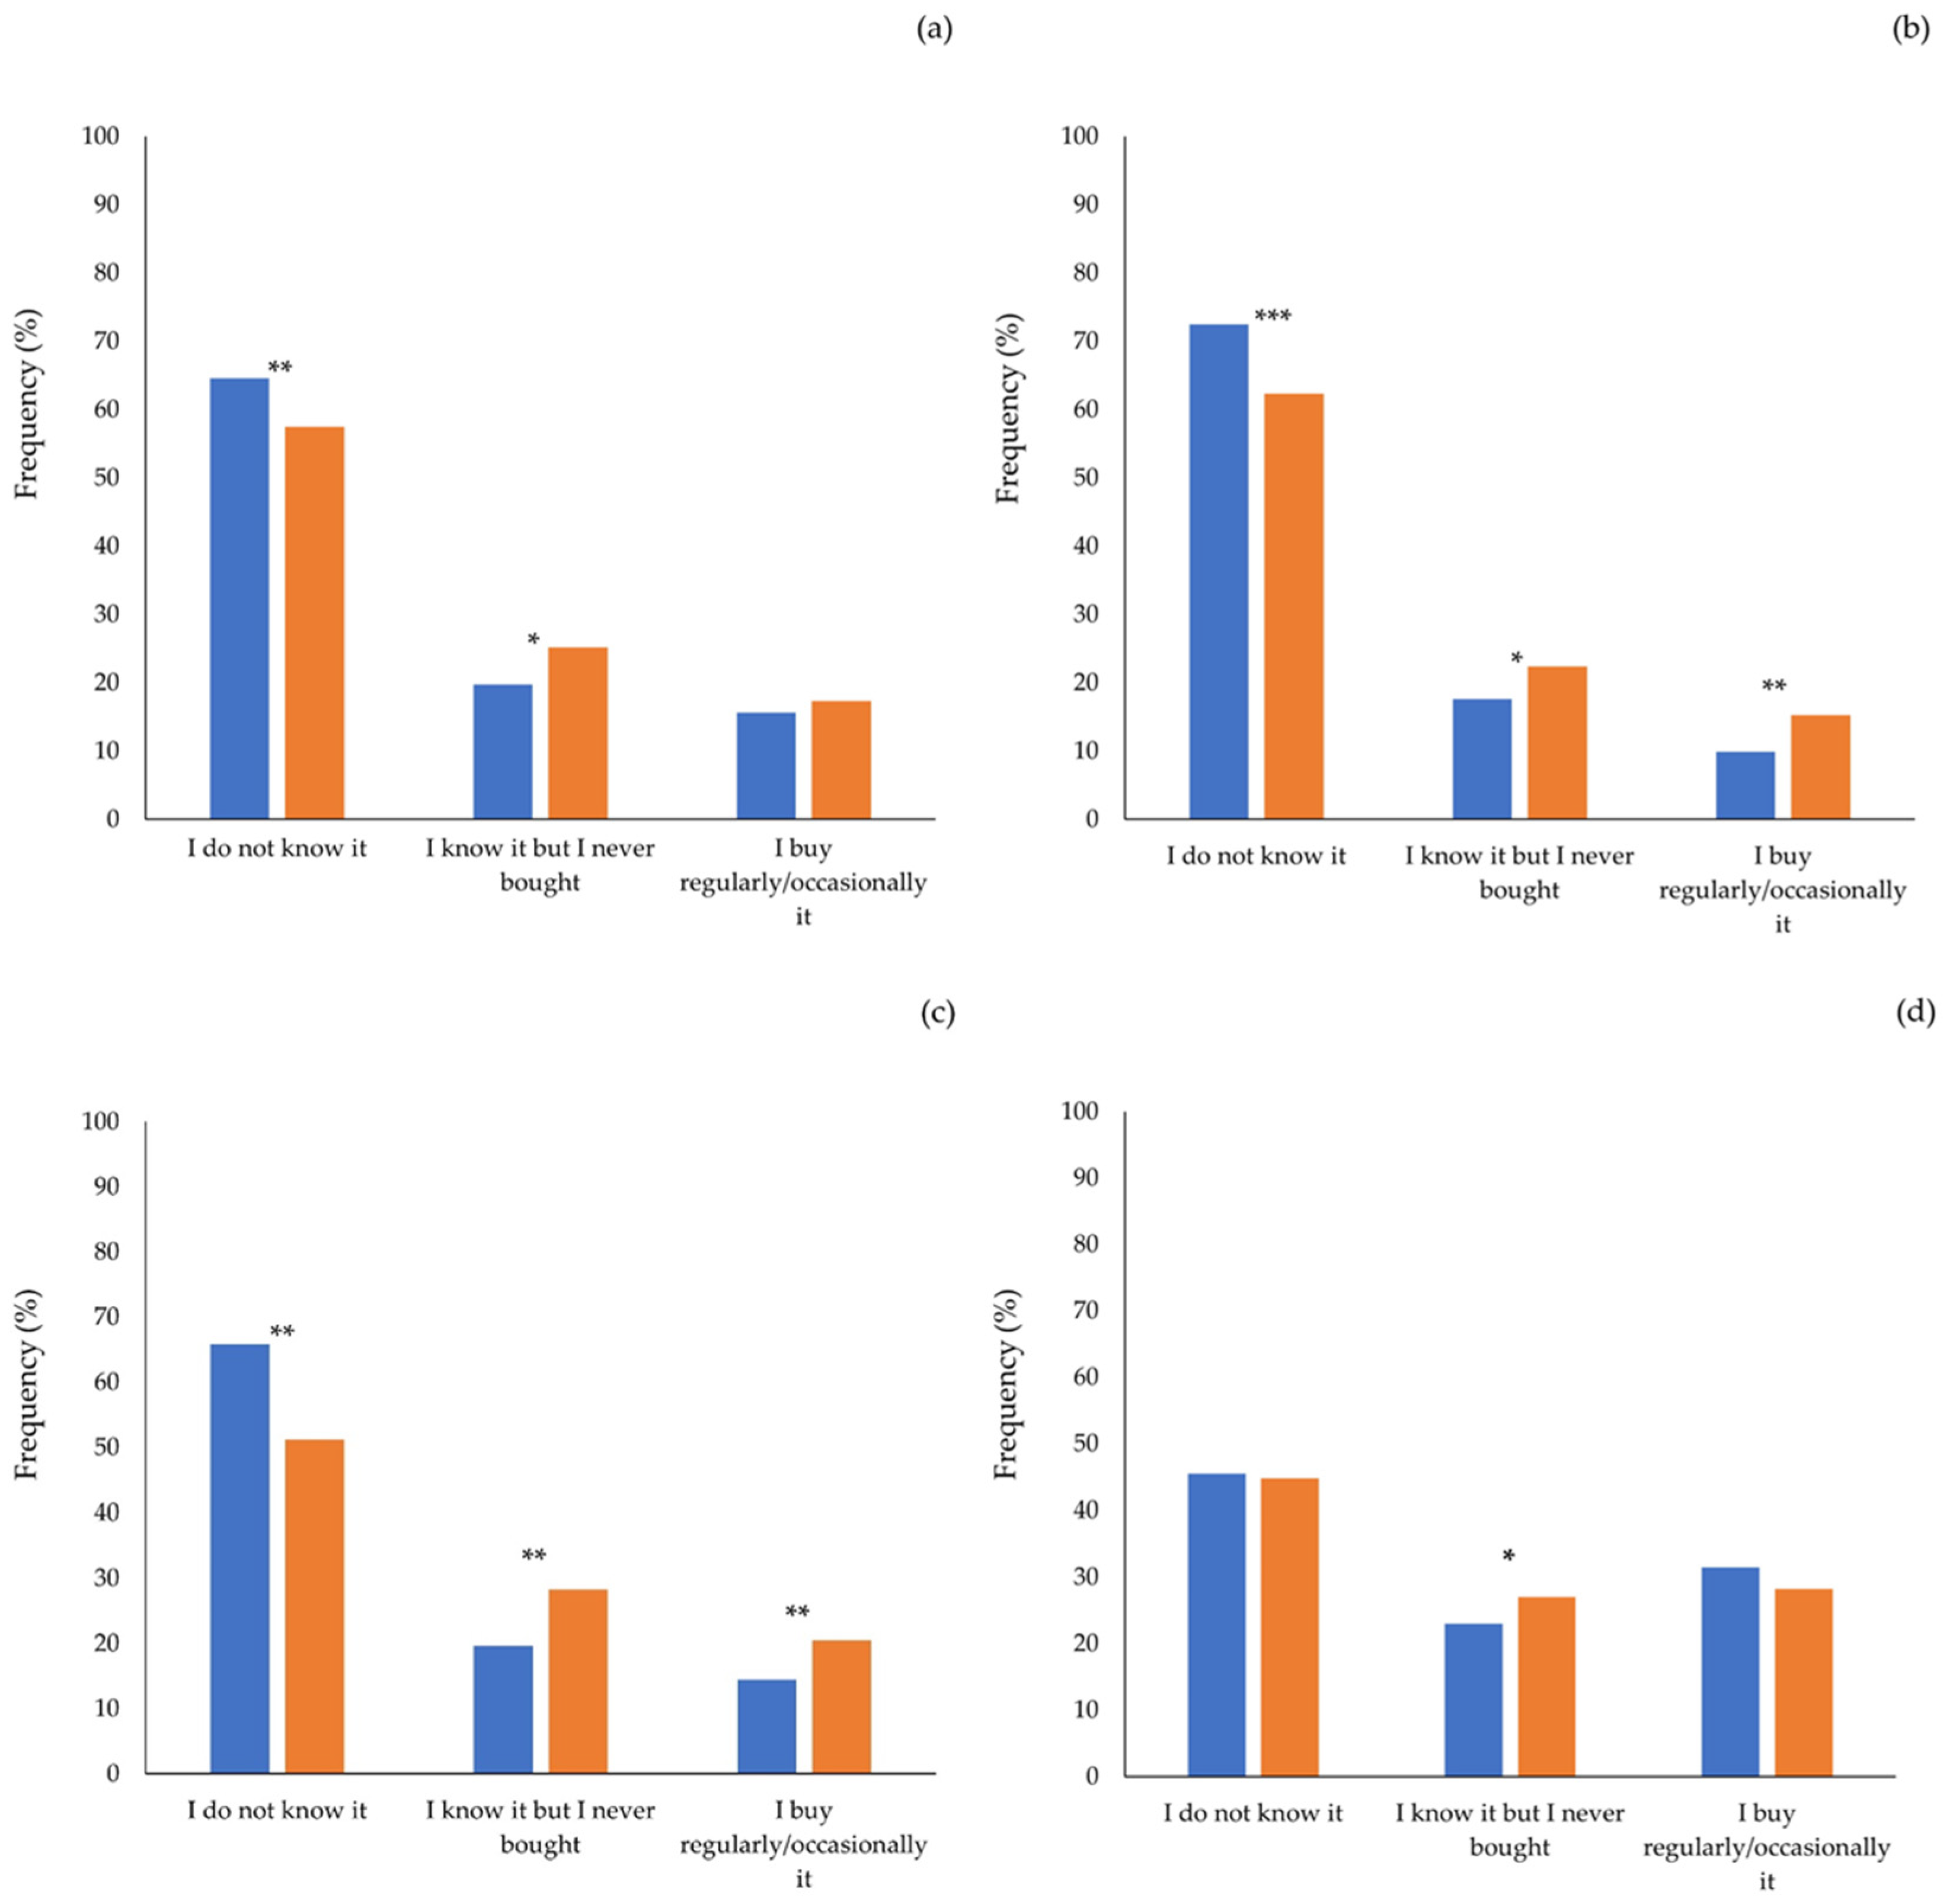
Knowledge of fish sustainability labels (ASC, BAP, FOS, MSC)1–5 familiarity scale(1) I do not know; (2) I know it, but I never bought it; (3) I bought it once; (4) I bought it occasionally; (5) I usually bought itTuorila et al., 2001 [37]
4Collection of socio-demographic information Gender, age, geographical living area, educational level, annual income, number of family members, number of children in the family, diet habits
In the last section, respondents’ socio-demographic data were collected. In particular, they were asked about gender, age, living area, education level, annual income, number of family members, number of children in the family, and diet habits.

2.3. Data Analysis

To properly decide the statistical approach to be used, a normality test (Shapiro–Wilk test, p > 0.05) was applied, and the homogeneity of variance was tested as well (Bartlett’s test, p > 0.05). A paired samples t-test was used to find differences in the knowledge of sustainability labels between Italian and Spanish respondents. Analysis of variance (one-way ANOVA and Duncan test, p ≤ 0.05) was used to find differences in the importance of traceability between the two countries and to analyse the effect of social-demographic variables on consumers’ responses. Then, respondents were grouped by country of origin, gender, and age group for a total of 16 observations and subjected to principal component analysis (PCA) to study the relationships between the observations and the variables analysed in the online questionnaire. Significance criteria were set at alpha = 0.05. The XLSTAT statistical software package (version 2016.02, Addinsoft) was used for data analysis.

3. Results and Discussion

3.1. Research Overview

Table 2 describes the individual information for Italian and Spanish respondents. They were equally distributed for gender, with an age range from 18 to 70 years old (average of 45 y.o.) both in Italy and Spain. The respondents were classified into four age groups: 18–29; 30–44; 45–54; 55–70, according to [38,39]. Regarding geographical living areas, respondents from the seaside and internal areas were involved. Regarding education level, the questionnaire included respondents with a middle school diploma, high school diploma, bachelor’s degree, and master’s or Ph.D. degree. Regarding annual income, respondents with an income from EUR < 20,000 to EUR > 100,000 were involved in the questionnaire. Finally, regarding diet habits, most of the respondents were omnivorous, flexitarian, or only fish eaters.

3.2. Respondents’ Interest in Traceability and Sustainability Label

The interest in food traceability is becoming increasingly important for consumers during purchase. The fish sector, especially for the processed species (frozen, canned, refrigerated, etc.), has a very long and complex supply chain [25]; therefore, as highlighted by other authors, receiving information regarding fish traceability can improve individuals’ trust, make consumers aware of this topic, and finally push them to buy tracked alternatives instead of untracked ones [26,27]. Furthermore, since fish is a highly perishable food [40,41], receiving detailed information about traceability can help consumers when purchasing, reducing food scares, but can also help food companies managing food-related issues (recalls of non-conforming products, problems related to specific production batches) [26]. The results of this study showed that it is important for Italian respondents to receive information about the traceability of the purchased fish species. On the contrary, for Spanish respondents, traceability information is less taken into account during the purchase. As shown in Figure 1, 41% of Italian respondents assigned a score of 7 on the 7-point Likert scale, while in Spain, only 22% of respondents assigned the same score. Our results are consistent with another study that reported that Spanish consumers have a lack of knowledge about fish traceability, so it is not a factor that is taken into account when purchasing fish products [40]. Moreover, it was found that in order to improve awareness of traceability, it is both important to educate respondents about the practice and also to make traceability reporting more prominent on packages so that it is more easily visible and recognizable [42]. Applying ANOVA (one-way ANOVA and Duncan test, p ≤ 0.05), statistically significant differences between the two countries were found (p ≤ 0.05). Therefore, in response to research question one (RQ1) formulated above, it could be concluded that for Italians, it is important to receive information on the traceability of purchased fish species, whereas for Spanish respondents, this information is not of key importance at the time of purchase.
Furthermore, regarding familiarity with sustainability labels, it was found that both Italian and Spanish respondents were unfamiliar with this issue. Indeed, as reported in Figure 2, the answer with a higher percentage was always “I do not know it” (average response rate 58%), followed by “I know it but I never bought it” (average response rate 23%), and finally, “I buy it regularly/occasionally” (average response rate 19%). A paired samples t-test showed statistically significant differences between Italian and Spanish respondents among the different responses for the sustainability labels considered (p ≤ 0.05). The best known label is the Marine Stewardship Council (MSC), although the frequency of purchase is still low, with values of 31% and 28% in Italy and Spain, respectively. In response to research question two (RQ2), although interest in fish sustainability is increasing [10], knowledge and, consequently, purchase of sustainable fish products is still low for both Italian and Spanish respondents. As confirmed in other studies [24], the lack of information on this issue implies a lack of awareness about the sustainability of fish, which results in low purchasing power for this category of products.

3.3. Effect of Socio-Demographic Variables

The effect of socio-demographic variables on the questions is reported in Table 3 and Table 4 for Italian and Spanish respondents, respectively (one-way ANOVA and Duncan test, p ≤ 0.05).
As shown in Table 3, gender did not influence the importance of traceability and awareness of sustainability labels in Italian respondents; ANOVA showed no statistically significant differences (p ≥ 0.05). Furthermore, in Spanish respondents, men were found to be more aware only of the MSC sustainability label (p ≤ 0.05). The age of the respondents inversely influenced the importance of traceability and knowledge of sustainability labels in both Italy and Spain. ANOVA showed that as age increases, traceability information becomes more important for respondents (p ≤ 0.05). The results are in agreement with [43], which points out that traceability is more important for adults, who are more careful about the safety, freshness, and quality of the products they buy. Conversely, as age decreases, knowledge of sustainability labels increases with statistically significant differences (p ≤ 0.05). This last result is in accordance with the evidence in the literature which reported significantly higher perceived importance of sustainability among young consumers (ranging from 20 to 40 years old) [44,45]. Many studies report a positive consumer willingness to buy sustainable fish once informed about sustainability labels and their meaning [46,47]. This consideration suggests that young respondents are more informed about the meaning of sustainability labels, and being more aware of their importance, they are also more used to buying sustainable fish options.
Applying ANOVA to find differences due to the geographic origin of the respondents (coastal or inland area), it was found that in Italy, this variable only influences knowledge of the ASC, BAP, and FOS labels with statistically significant differences (p ≤ 0.05). On the other hand, the importance of traceability and knowledge of the MSC label is greater for respondents from seaside areas but not to a statistically significant degree (p ≥ 0.05). In Spain, on the contrary, geographical origin does not show statistically significant differences in traceability and fish sustainability (p ≥ 0.05). In response to research question three (RQ3), respondents’ personal information influences their interest in fish traceability and sustainability. In particular, the results show that age has a greater influence on respondents’ perceptions of the variables discussed.

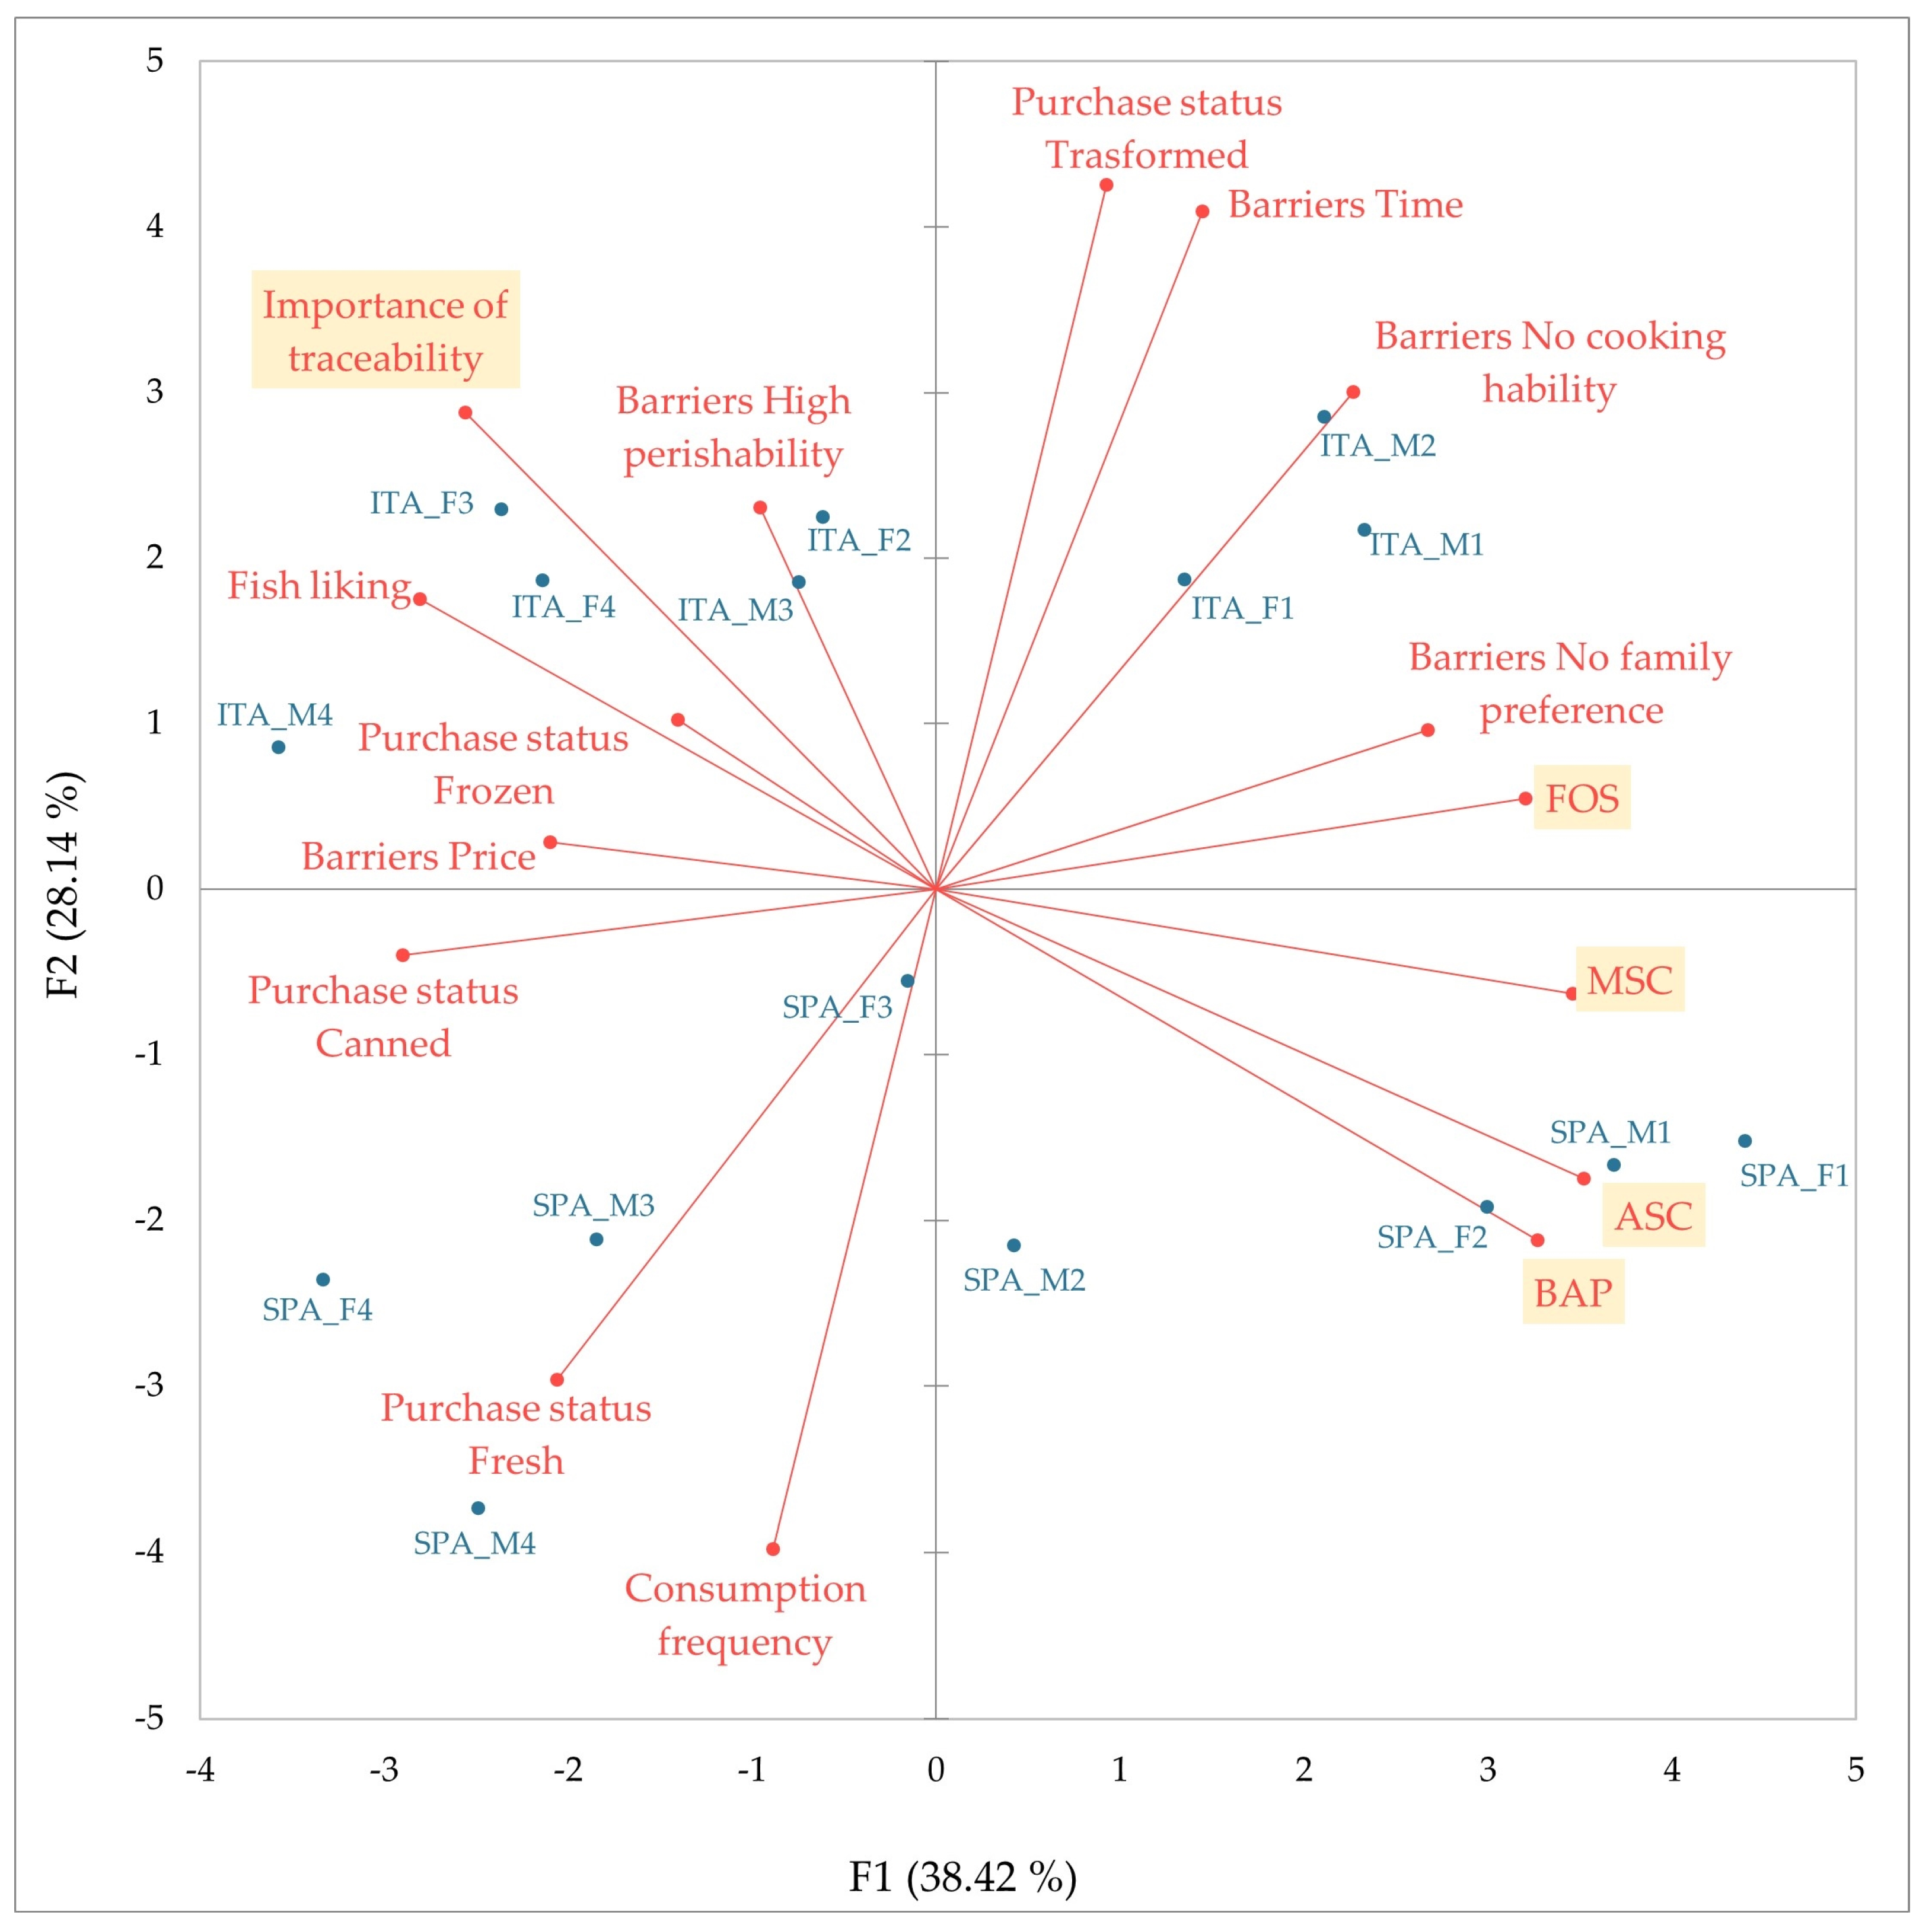
3.4. Principal Component Analysis (PCA)

Table 5 reports the correlation between variables and factors. Figure 3 is a representation of the respondents on the first two dimensions extracted by PCA accounting for 66.56% of the variance (38.42% PC1; 28.14 PC2). Respondents were well separated in terms of provenance and age; indeed, Italian respondents are located in the upper part, while the Spanish respondents are located in the lower part of the graph; additionally, the younger respondents are located in the right part, while the adults are in the left part of the graph. Figure 3 allows one to observe the variables which characterise the respondents and the associations among them. The results showed that adult Spanish respondents consume fresh fish more frequently than Italian ones; indeed, as reported in another study [27], Spain is among the top nations in fish consumption in Europe. On the other hand, adult Italian respondents have shown a greater liking for fish products compared to Spanish respondents, and they also buy more frozen fish and perceive the high price and the high perishability as a fish-consumption barrier. Actually, it is well established that fish consumption is beneficial to health, but the recommended daily intake is not widely achieved, and this is due to fish-consumption barriers [48,49,50]. As reported by other authors [21,22,23], fish price is the main barrier to consumption frequency. Although the price increase is often interpreted as signaling better quality, [51] reports that the increase in the price of fish products reduces the willingness of consumers to buy these products or to buy them in smaller quantities. Regarding the high perishability, fish are highly perishable food products due to their composition, which involves a series of chemical and microbiological reactions that take place from the post-catch phase until final consumption; this phenomenon is called autolysis [33,40,41]. Thus, the tendency to buy frozen products may be due to the perceived barriers among Italian adults. Such products, unlike fresh products, receive minimal processing treatment (cutting, filleting, removal of non-edible parts, and, finally, wrapping), so they also come with more information than fresh fish products. This could justify the Italian respondents’ greater interest in fish traceability compared to Spanish respondents, who, by buying more fresh fish, are more used to receiving less information about what they buy and are therefore better able to self-identify the characteristics of the purchased species. However, some fraud may be related to the provenance and freshness of the species purchased [25,52], so it would also be advisable to disseminate strategies to raise awareness of fish traceability to direct purchases toward this category of products and reduce the probability of any kind of fraud.
Young respondents, especially Italians, on the other hand, perceive other types of barriers to consumption, such as the inability and time required to prepare a fish meal and the low preference for fish in the family. This is why they tend to buy more transformed products that are tasty and easy to prepare. Such products are currently the only ones on the market with sustainability labels, which is why this class of consumers may be more aware of such labels. As reported above, although this respondent class is more informed about sustainability labels, awareness of such labels is still very low. As discussed above, awareness-raising strategies are needed to steer consumer purchases toward more sustainable choices.

4. Conclusions

This study was based on three research questions related to the importance of traceability (RQ1), knowledge of sustainability labels (RQ2), and the influence of socio-demographic variables (RQ3) in the respondents’ choices and knowledge of Italian and Spanish respondents towards seafood products. The questionnaire highlighted that traceability is more important to Italian than to Spanish respondents. These differences are due to consumption and purchasing habits as well as the personal variables of the respondents. Sustainability labels, on the other hand, were little known in both countries. Younger respondents, given their purchasing habits, were found to be more informed about fish sustainability issues. Therefore, dissemination strategies are necessary to improve knowledge about traceability and fish sustainability to orientate purchases toward this category of products and to value companies that provide accurate and detailed information and that respect both animal and environmental sustainability. Considering the results, market strategies oriented toward traceable and sustainable food choices can be based on the individual characteristics found to influence the consumers’ knowledge about traceability and fish sustainability. A possible limitation of the study is that the respondents’ opinions on fish traceability and sustainability were only analysed through an online questionnaire. Future research may focus on consumer tests to analyse the impact of such variables on the perception of different fish products during sensory evaluation by consumers.

Author Contributions

Conceptualisation, R.D.M.; methodology, S.P. and R.D.M.; software, S.P.; validation, S.P. and R.D.M.; formal analysis, G.F. and S.P.; investigation, G.F. and F.C.; data curation, G.F. and S.P.; writing—original draft preparation, G.F. and S.P.; writing—review and editing, S.P., N.H.S. and R.D.M.; visualisation, F.C.; supervision, R.D.M.; project administration, R.D.M.; funding acquisition, P.M. and S.M. All authors have read and agreed to the published version of the manuscript.

Funding

This study is part of the SUREFISH project Fostering Mediterranean fish ensuring traceability and authenticity, (https://surefish.eu/, accessed on 20 July 2023), which has received funding from the PRIMA Call 2019 Section 1—Agro-food Value Chain 2019, Topic 1.3.1, Grant n, 1933. This research was funded by MIPAAF, CUP J65E22000280007, https://www.politicheagricole.it/ (accessed on 20 July 2023).

Institutional Review Board Statement

The study was conducted in agreement with the guidelines of the Declaration of Helsinki and the Italian ethical requirements on research activities and personal data protection (D.L. 30.6.03 n. 196).

Informed Consent Statement

Informed consent was obtained from all respondents involved in the study.

Data Availability Statement

The data presented in this study are available upon request from the corresponding author.

Acknowledgments

We are sincerely grateful to the study participants in both Italy and Spain, as well as to colleagues within the SUREFISH and MIPAAF project who helped with the outreach and dissemination activities associated with this research.

Conflicts of Interest

The authors declare no conflict of interest.

References

  1. Nesheim, M.C.; Yaktine, A.L. Seafood Choices: Balancing Benefits and Risks; National Academies Press: Washington, DC, USA, 2007; pp. 1–722. [Google Scholar]
  2. Carlucci, D.; Nocella, G.; De Devitiis, B.; Viscecchia, R.; Bimbo, F.; Nardone, G. Consumer purchasing behaviour towards fish and seafood products. Patterns and insights from a sample of international studies. Appetite 2015, 84, 212–227. [Google Scholar] [CrossRef] [PubMed]
  3. FAO. Opportunities and challenges. In The State of World Fisheries and Aquaculture; FAO: Rome, Italy, 2020. [Google Scholar]
  4. Morales, L.E.; Higuchi, A. Is fish worth more than meat?—How consumers’ beliefs about health and nutrition affect their willingness to pay more for fish than meat. Food Qual Prefer. 2018, 65, 101–109. [Google Scholar] [CrossRef]
  5. McGuire, S. World Cancer Report 2014; World Health Organization, International Agency for Research on Cancer, WHO Press: Geneva, Switzerland, 2015. [Google Scholar]
  6. Willett, W.; Rockström, J.; Loken, B.; Springmann, M.; Lang, T.; Vermeulen, S.; Garnett, T.; Tilman, D.; DeClerck, F.; Wood, A.; et al. Food in the Anthropocene: The EAT–Lancet Commission on healthy diets from sustainable food systems. Lancet 2019, 393, 447–492. [Google Scholar] [CrossRef] [PubMed]
  7. Myrland, Ø.; Trondsen, T.; Johnston, R.S.; Lund, E. Determinants of seafood consumption in Norway: Lifestyle, revealed preferences, and barriers to consumption. Food Qual. Prefer. 2000, 11, 169–188. [Google Scholar] [CrossRef]
  8. Tomic, M.; Kovacicek, T.; Matulic, D. Attitudes as basis for segmenting Croatian fresh fish consumers. New Medit Mediterr. J. Econ. Agric. Environ. Rev. Méditerr D’economie Agric. Environ. 2016, 15, 63–71. [Google Scholar]
  9. Verbeke, W.; Vanhonacker, F.; Sioen, I.; Van Camp, J.; De Henauw, S. Perceived importance of sustainability and ethics related to fish: A consumer behavior perspective. Ambio 2007, 36, 580–585. [Google Scholar] [CrossRef]
  10. Pucci, T.; Casprini, E.; Galati, A.; Zanni, L. The virtuous cycle of stakeholder engagement in developing a sustainability culture: Salcheto winery. J. Bus. Res. 2020, 119, 364–376. [Google Scholar] [CrossRef]
  11. Krystallis, A.; Grunert, K.G.; de Barcellos, M.D.; Perrea, T.; Verbeke, W. Consumer attitudes towards sustainability aspects of food production: Insights from three continents. J. Mark. Manag. 2012, 28, 334–372. [Google Scholar] [CrossRef]
  12. Van Loo, E.J.; Caputo, V.; Nayga, R.M.; Seo, H.S.; Zhang, B.; Verbeke, W. Sustainability labels on coffee: Consumer preferences, willingness-to-pay and visual attention to attributes. Ecol. Econ. 2015, 118, 215–225. [Google Scholar] [CrossRef]
  13. Annunziata, A.; Mariani, A.; Vecchio, R. Effectiveness of sustainability labels in guiding food choices: Analysis of visibility and understanding among young adults. Sustain. Prod. Consum. 2019, 17, 108–115. [Google Scholar] [CrossRef]
  14. Parkes, G.; Swasey, J.H.; Underwood, F.M.; Fitzgerald, T.P.; Strauss, K.; Agnew, D.J. The effects of catch share management on MSC certification scores. Fish Res. 2016, 182, 18–27. [Google Scholar] [CrossRef]
  15. Maesano, G.; Di Vita, G.; Chinnici, G.; Pappalardo, G.; D’amico, M. The role of credence attributes in consumer choices of sustainable fish products: A review. Sustainability 2020, 12, 10008. [Google Scholar] [CrossRef]
  16. Sherry, J.; Koester, J. Life cycle assessment of aquaculture stewardship council certified Atlantic Salmon (Salmo salar). Sustainability 2020, 12, 6079. [Google Scholar] [CrossRef]
  17. Roheim, C.A.; Sudhakaran, P.O.; Durham, C.A. Certification of Shrimp and Salmon for Best Aquaculture Practices: Assessing Consumer Preferences in Rhode Island. Aquac. Econ. Manag. 2012, 16, 266–286. [Google Scholar] [CrossRef]
  18. Soley, G.; Hu, W.; Vassalos, M. Willingness to Pay for Shrimp with Homegrown by Heroes, Community-Supported Fishery, Best Aquaculture Practices, or Local Attributes. J. Agric. Appl. Econ. 2019, 51, 606–621. [Google Scholar] [CrossRef]
  19. Galati, A.; Pastor, L.M.; Crescimanno, M.; Giaimo, R.; Giacomarra, M. Sustainable European fishery and the Friend of the Sea scheme: Tools to achieve sustainable development in the fishery sector. Int. J. Glob. Small Bus. 2015, 7, 247–265. [Google Scholar] [CrossRef]
  20. Aprile, M.C.; Punzo, G. How environmental sustainability labels affect food choices: Assessing consumer preferences in southern Italy. J. Clean. Prod. 2022, 332, 130046. [Google Scholar] [CrossRef]
  21. Verbeke, W.; Vackier, I. Individual determinants of fish consumption: Application of the theory of planned behaviour. Appetite 2005, 44, 67–82. [Google Scholar] [CrossRef]
  22. Leek, S.; Maddock, S.; Foxall, G. Situational determinants of fish consumption. Br. Food J. 2000, 102, 18–39. [Google Scholar] [CrossRef]
  23. Olsen, S.O. Consumer involvement in seafood as family meals in Norway: An application of the expectancy-value approach. Appetite 2001, 36, 173–186. [Google Scholar] [CrossRef]
  24. García-Herrero, L.; De Menna, F.; Vittuari, M. Sustainability concerns and practices in the chocolate life cycle: Integrating consumers’ perceptions and experts’ knowledge. Sustain. Prod. Consum. 2019, 20, 117–127. [Google Scholar] [CrossRef]
  25. Giusti, A.; Tinacci, L.; Sotelo, C.G.; Acutis, P.L.; Ielasi, N.; Armani, A. Authentication of ready-to-eat anchovy products sold on the Italian market by BLAST analysis of a highly informative cytochrome b gene fragment. Food Control 2019, 97, 50–57. [Google Scholar] [CrossRef]
  26. Menozzi, D.; Halawany-Darson, R.; Mora, C.; Giraud, G. Motives towards traceable food choice: A comparison between French and Italian consumers. Food Control 2015, 49, 40–48. [Google Scholar] [CrossRef]
  27. Rodriguez-Salvador, B.; Calvo Dopico, D. Differentiating fish products: Consumers’ preferences for origin and traceability. Fish Res. 2023, 262, 106682. [Google Scholar] [CrossRef]
  28. EUMOFA. The EU Fish Market 2020; European Union: Maastricht, The Netherlands, 2020; p. 170. [Google Scholar]
  29. Welch, A.; Lund, E.; Amiano, P.; Dorronsoro, M.; Brustad, M.; Kumle, M.; Rodriguez, M.; Lasheras, C.; Janzon, L.; Jansson, J.; et al. Variability of fish consumption within the 10 European countries participating in the European Investigation into Cancer and Nutrition (EPIC) study. Public Health Nutr. 2002, 5, 1273–1285. [Google Scholar] [CrossRef] [PubMed]
  30. Carvalho, D.C.; Palhares, R.M.; Drummond, M.G.; Frigo, T.B. DNA Barcoding identification of commercialized seafood in South Brazil: A governmental regulatory forensic program. Food Control 2015, 50, 784–788. [Google Scholar] [CrossRef]
  31. Helyar, S.J.; Lloyd, H.A.D.; De Bruyn, M.; Leake, J.; Bennett, N.; Carvalho, G.R. Fish product mislabelling: Failings of traceability in the production chain and implications for Illegal, Unreported and Unregulated (IUU) fishing. PLoS ONE 2014, 9, e98691. [Google Scholar] [CrossRef]
  32. Claret, A.; Guerrero, L.; Gartzia, I.; Garcia-Quiroga, M.; Ginés, R. Does information affect consumer liking of farmed and wild fish? Aquaculture 2016, 454, 157–162. [Google Scholar] [CrossRef]
  33. Hicks, D.; Pivarnik, L.; McDermott, R. Consumer perceptions about seafood—An Internet survey. J. Foodserv. 2008, 19, 213–226. [Google Scholar] [CrossRef]
  34. Saidi, A.; Sacchi, G.; Cavallo, C.; Cicia, G.; Di Monaco, R.; Puleo, S.; Del Giudice, T. Drivers of fish choice: An exploratory analysis in Mediterranean countries. Agric. Food Econ. 2022, 10, 29. [Google Scholar] [CrossRef]
  35. Vanhonacker, F.; Pieniak, Z.; Verbeke, W. Fish market segmentation based on consumers’ motives, barriers and risk perception in Belgium. J. Food Prod. Mark. 2010, 16, 166–183. [Google Scholar] [CrossRef]
  36. European Parliament and Council. Regulation (EC) No 178/2002 of 28 January 2002 laying down the general principles and requirements of food law, establishing the European Food Safety Authority and laying down procedures in matters of food safety. Off. J. Eur. Communities 2002, L31, 1–24. Available online: http://eur-lex.europa.eu/LexUriServ/LexUriServ.do?uri=OJ:L:2002:031:0001:0024:EN:PDF (accessed on 19 June 2023).
  37. Tuorila, H.; Lähteenmäki, L.; Pohjalainen, L.; Lotti, L. Food neophobia among the Finns and related responses to familiar and unfamiliar foods. Food Qual. Prefer. 2001, 12, 29–37. [Google Scholar] [CrossRef]
  38. Spinelli, S.; Prescott, J.; Pierguidi, L.; Dinnella, C.; Arena, E.; Braghieri, A.; Di Monaco, R.; Toschi, T.G.; Endrizzi, I.; Proserpio, C.; et al. Phenol-rich food acceptability: The influence of variations in sweetness optima and sensory-liking patterns. Nutrients 2021, 13, 866. [Google Scholar] [CrossRef] [PubMed]
  39. Predieri, S.; Sinesio, F.; Monteleone, E.; Spinelli, S.; Cianciabella, M.; Daniele, G.M.; Dinnella, C.; Gasperi, F.; Endrizzi, I.; Torri, L.; et al. Gender, age, geographical area, food neophobia and their relationships with the adherence to the mediterranean diet: New insights from a large population cross-sectional study. Nutrients 2020, 12, 1778. [Google Scholar] [CrossRef] [PubMed]
  40. Rodriguez-Salvador, B.; Dopico, D.C. Understanding the value of traceability of fishery products from a consumer perspective. Food Control. 2020, 112, 107142. [Google Scholar] [CrossRef]
  41. Prabhakar, P.K.; Vatsa, S.; Srivastav, P.P.; Pathak, S.S. A comprehensive review on freshness of fish and assessment: Analytical methods and recent innovations. Food Res. Int. 2020, 133, 109157. [Google Scholar] [CrossRef]
  42. Calvo Dopico, D.; Mendes, R.; Silva, H.A.; Verrez-Bagnis, V.; Pérez-Martín, R.; Sotelo, C.G. Evaluación, señalización y disposición a pagar por la trazabilidad. Una comparativa internacional. Span. J. Mark.—ESIC 2016, 20, 93–103. [Google Scholar] [CrossRef]
  43. Myae, A.C.; Goddard, E. Importance of traceability for sustainable production: A cross-country comparison. Int. J. Consum. Stud. 2012, 36, 192–202. [Google Scholar] [CrossRef]
  44. Verbeke, W.; Sioen, I.; Brunsø, K.; Henauw, S.; Camp, J. Consumer perception versus scientific evidence of farmed and wild fish: Exploratory insights from Belgium. Aquac. Int. 2007, 15, 121–136. [Google Scholar] [CrossRef]
  45. Salladarré, F.; Guillotreau, P.; Perraudeau, Y.; Monfort, M.C. The demand for seafood eco-labels in France. J. Agric. Food Ind. Organ. 2010, 8. [Google Scholar] [CrossRef]
  46. Bronnmann, J.; Asche, F. Sustainable Seafood From Aquaculture and Wild Fisheries: Insights From a Discrete Choice Experiment in Germany. Ecol. Econ. 2017, 142, 113–119. [Google Scholar] [CrossRef]
  47. Groening, C.; Sarkis, J.; Zhu, Q. Green marketing consumer-level theory review: A compendium of applied theories and further research directions. J. Clean. Prod. 2018, 172, 1848–1866. [Google Scholar] [CrossRef]
  48. Altintzoglou, T.; Vanhonacker, F.; Verbeke, W.; Luten, J. Association of health involvement and attitudes towards eating fish on farmed and wild fish consumption in Belgium, Norway and Spain. Aquac. Int. 2011, 19, 475–488. [Google Scholar] [CrossRef]
  49. Burger, J.; Gochfeld, M. Perceptions of the risks and benefits of fish consumption: Individual choices to reduce risk and increase health benefits. Environ. Res. 2009, 109, 343–349. [Google Scholar] [CrossRef]
  50. Grieger, J.A.; Miller, M.; Cobiac, L. Knowledge and barriers relating to fish consumption in older Australians. Appetite 2012, 59, 456–463. [Google Scholar] [CrossRef]
  51. Claret, A.; Guerrero, L.; Ginés, R.; Grau, A.; Hernández, M.D.; Aguirre, E.; Peleteiro, J.B.; Fernández-Pato, C.; Rodríguez-Rodríguez, C. Consumer beliefs regarding farmed versus wild fish. Appetite 2014, 79, 25–31. [Google Scholar] [CrossRef] [PubMed]
  52. Cutarelli, A.; Amoroso, M.G.; De Roma, A.; Girardi, S.; Galiero, G.; Guarino, A.; Corrado, F. Italian market fish species identification and commercial frauds revealing by DNA sequencing. Food Control 2014, 37, 46–50. [Google Scholar] [CrossRef]
Figure 1. Importance of fish traceability in Italy and Spain. Italy, Spain.
Sustainability 15 14103 g001
Figure 2. Sustainability label knowledge in Italy and Spain: ASC (a), BAP (b), FOS (c), MSC (d). Italy (963), Spain (954). Asterisks indicate significant differences (* p < 0.05; ** p < 0.01; *** p < 0.001).
Sustainability 15 14103 g002
Figure 3. Principal component analysis (PCA) plot of 16 groups (provenance, gender, age) of respondents (observations) and 16 variables (x variables). Active variables, Active observations. ITA (Italian); SPA (Spanish); M (Male); F (Female); numbers from 1 to 4 are related to age group (1: 18−29, 2: 30−44, 3: 45−54, 4: 55−70).
Sustainability 15 14103 g003
Table 2. Characteristics of Italian and Spanish respondents involved in the questionnaire (%).
ItalySpain
Respondents n (%)Female n (%)Male n (%)Respondents n (%)Female n (%)Male n (%)
Age
18–29167 (17)82 (49)85 (51)218 (23)83 (38)135 (62)
30–44274 (29)137 (50)137 (50)248 (26)104 (42)144 (58)
45–54230 (24)115 (50)115 (50)145 (15)91 (63)54 (37)
55–70290 (30)149 (51)141 (49)341 (36)200 (59)141 (41)
Provenance
Seaside410 (43)203 (49)207 (51)521 (55)263 (50)258 (50)
Internal551 (57)280 (51)271 (49)431 (45)215 (50)216 (50)
Education
Middle school diploma102 (11)52 (51)50 (49)105 (11)49 (47)56 (53)
High school diploma507 (53)247 (49)260 (51)375 (39)189 (50)186 (50)
Bachelor288 (30)148 (51)140 (49)368 (39)182 (49)186 (51)
Master/PhD64 (6)36 (56)28 (44)104 (11)58 (56)46 (44)
Job
Freelancer107 (11)45 (42)62 (58)76 (8)44 (58)32 (42)
Employee385 (40)172 (45)213 (55)383 (40)203 (46)180 (64)
Worker110 (12)39 (35)71 (65)95 (10)47 (50)48 (50)
Unemployed187 (19)132 (71)55 (29)202 (21)97 (48)105 (52)
Student73 (8)41 (56)32 (44)90 (10)28 (31)62 (69)
Other99 (10)54 (54)45 (46)106 (11)59 (56)47 (44)
Annual income
EUR < 20,000257 (26)147 (57)110 (43)295 (31)116 (39)179 (61)
EUR 20,000–40,000395 (40)180 (47)215 (53)395 (41)215 (54)180 (46)
EUR 40,000–60,000123 (17)54 (44)69 (56)128 (13)75 (59)53 (41)
EUR 60,000–100,00038 (4)14 (37)24 (63)51 (5)38 (74)13 (26)
EUR > 100,00010 (1)7 (70)3 (30)15 (3)10 (67)5 (33)
Not answer138 (12)81 (59)57 (41)68 (7)24 (35)44 (65)
Diet habits
Omnivorous832 (87)417 (50)415 (50)536 (57)302 (56)234 (44)
Flexitarian55 (6)33 (60)22 (40)110 (11)45 (41)65 (59)
Only eat fish62 (6)25 (40)37 (60)36 (4)20 (56)16 (44)
Other12 (1)8 (67)4 (33)270 (28)111 (41)159 (59)
Table 3. Effect of social-demographic variables (average values ± SD) for Italian respondents.
QuestionGenderAgeGeographical Location
FMp-Value18–2930–4445–5455–70p-ValueSeaInternalp-Value
Importance of traceability6.0 ± 1.15.8 ± 1.20.0725.6 ± 1.2 a5.8 ± 1.3 ab5.9 ± 1.2 b6.2 ± 1.0 c0.0016.0 ± 1.2 b5.8 ± 1.2 a0.144
MSC2.4 ± 1.52.4 ± 1.40.8592.6 ± 1.4 b2.6 ± 1.5 b2.2 ± 1.4 a2.2 ± 1.4 a0.0012.5 ± 1.52.3 ± 1.40.149
ASC1.8 ± 1.21.7 ± 1.20.4932.1 ± 1.4 c1.9 ± 1.3 b1.5 ± 1.1 a1.6 ± 1.1 a0.0011.9 ± 1.3 a1.7 ± 1.1 b0.009
BAP1.5 ± 1.01.6 ± 1.00.1141.8 ± 1.1 c1.6 ± 1.1 b1.3 ± 0.8 a1.4 ± 0.9 a0.0011.7 ± 1.1 a1.4 ± 0.9 b0.001
FOS1.7 ± 1.21.8 ± 1.20.5292.0 ± 1.3 b1.8 ± 1.1 ab1.6 ± 1.1 a1.7 ± 1.2 a0.0201.8 ± 1.2 a1.7 ± 1.2 b0.044
Different letters correspond to statistically significant differences (p ≤ 0.05).
Table 4. Effect of social-demographic variables (average values ± SD) for Spanish respondents.
QuestionGenderAgeGeographical Location
FMp-Value18–2930–4445–5455–70p-ValueCoastalInlandp-Value
Importance of traceability5.3 ± 1.35.4 ± 1.20.0745.1 ± 1.3 a5.4 ± 1.2 b5.6 ± 1.1 b5.5 ± 1.3 b0.0015.3 ± 1.35.3 ± 1.30.950
MSC2.3 ± 1.4 a2.5 ± 1.4 b0.0342.7 ± 1.4 b2.7 ± 1.4 b2.1 ± 1.5 a2.1 ± 1.4 a0.0012.4 ± 1.42.3 ± 1.40.881
ASC2.0 ± 1.22.0 ± 1.30.1552.3 ± 1.3 b2.2 ± 1.3 b1.8 ± 1.3 a1.6 ± 1.1 a0.0011.9 ± 1.21.9 ± 1.30.624
BAP1.8 ± 1.21.9 ± 1.30.0782.2 ± 1.3 b2.1 ± 1.3 b1.7 ± 1.2 a1.5 ± 1.0 a0.0011.7 ± 1.11.9 ± 1.30.113
FOS2.0 ± 1.32.2 ± 1.30.0652.5 ± 1.3 b2.4 ± 1.4 b1.9 ± 1.3 a1.7 ± 1.2 a0.0012.2 ± 1.32.0 ± 1.30.644
Different letters correspond to statistically significant differences (p ≤ 0.05).
Table 5. Correlation between variables and factors.
VariablesF1F2
Fish liking−0.7120.380
Consumption frequency−0.225−0.864
Purchase status fresh−0.522−0.643
Purchase status frozen−0.3560.222
Purchase status canned−0.735−0.087
Purchase status trasformed0.2340.923
Barriers price−0.5320.061
Barriers time0.3670.888
Barriers, no cooking ability0.5750.652
Barriers, high perishability−0.2430.501
Barriers, no family preference0.6770.208
Importance of traceability−0.6490.625
MSC0.876−0.137
ASC0.892−0.379
BAP0.829−0.460
FOS0.8120.119
Disclaimer/Publisher’s Note: The statements, opinions and data contained in all publications are solely those of the individual author(s) and contributor(s) and not of MDPI and/or the editor(s). MDPI and/or the editor(s) disclaim responsibility for any injury to people or property resulting from any ideas, methods, instructions or products referred to in the content.

