
Rare Species Are Significant in Harsh Environments and Unstable Communities: Based on the Changes of Species Richness and Community Stability in Different Sub-Assemblages

 ,
,
Abstract
:1. Introduction
2. Materials and Methods
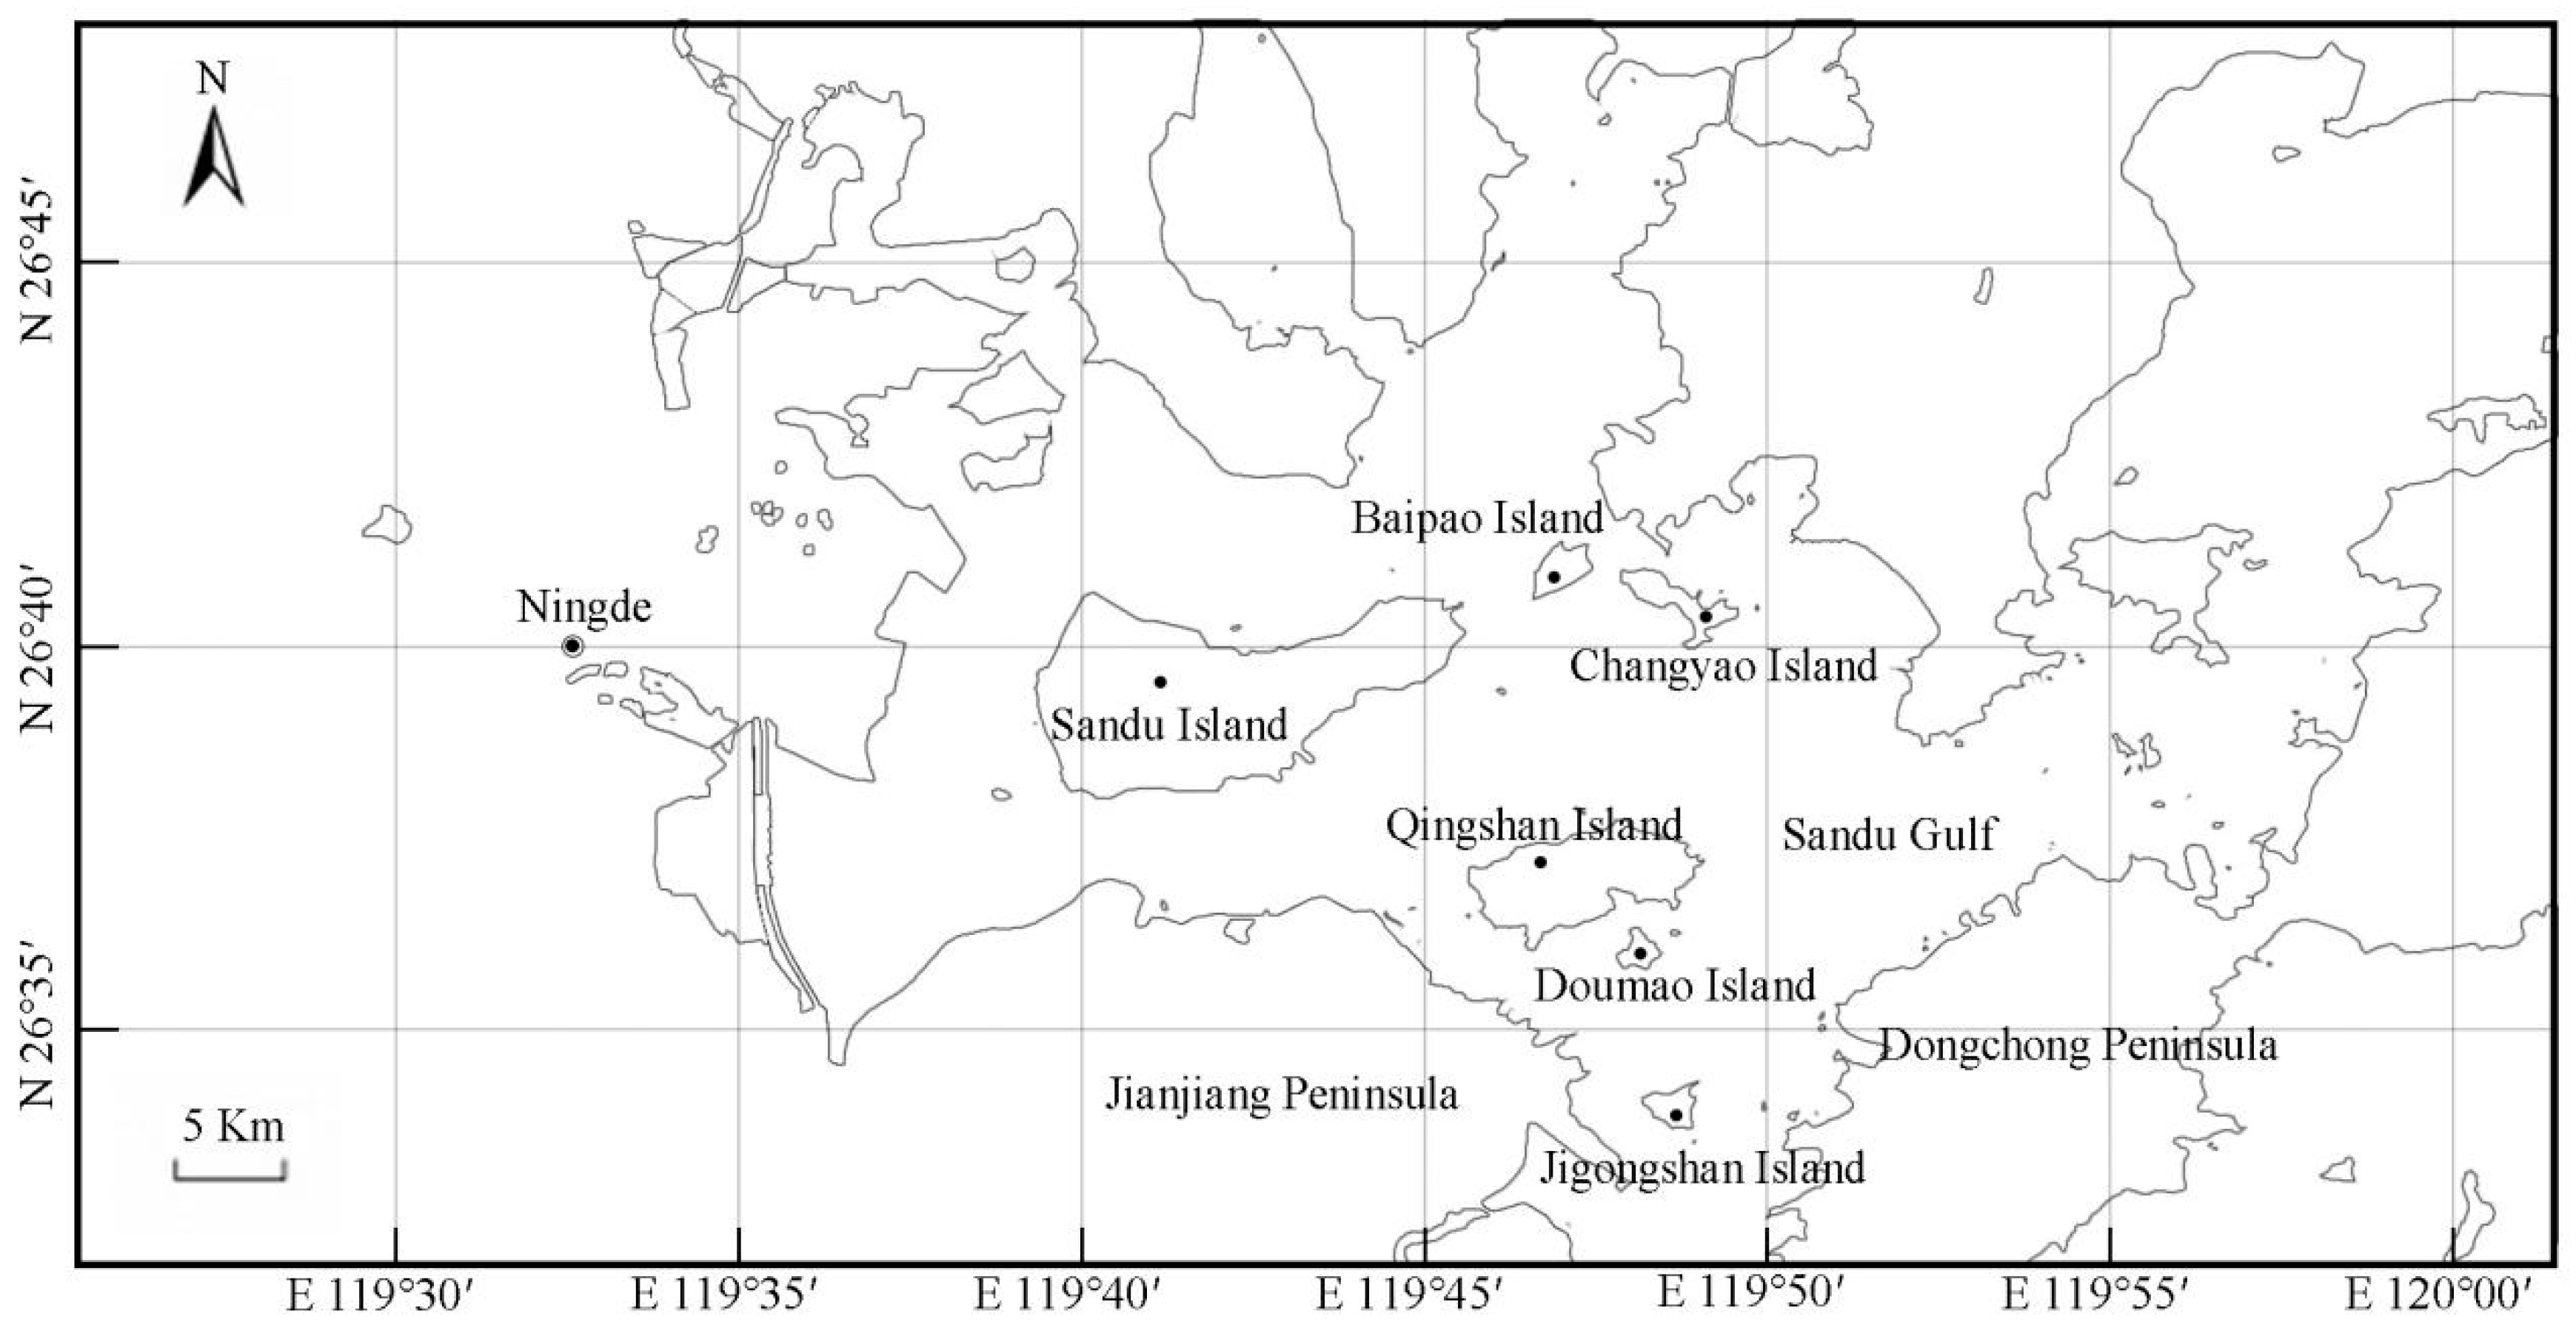
2.1. Research Area Overview
2.2. Community Survey
2.3. Analysis Method of the Distribution Patterns of Species Richness
2.4. The Method of Stability Analysis
2.5. Environmental Interpretation
3. Results and Analysis
3.1. Contribution of the Common and Rare Species to Species Richness of the Community
3.2. Contributions of the Common and Rare Species to the Community Stability
3.3. Correlation between Species Richness Distribution and Environmental Factors
4. Discussion
5. Conclusions and Recommendations
- (1)
- The frequency magnitude of species is an important influence in determining the degree of species contribution to community richness patterns. Common species are frequent and widely distributed, and the decrease in common species can greatly reduce the species diversity of the area. Consequently, common species are the highest-priority species that should be protected in the community. However, rare species with lower frequencies are more important for areas with harsh environments, and the increase in rare species can significantly contribute to the species richness index in areas with lower abundance. Therefore, rare species are ecologically significant for environmentally harsh areas, and we cannot arbitrarily ignore the contributions of rare species to community richness patterns.
- (2)
- Community stability can be influenced by many factors. In a relatively stable community, the stability of the community is mainly determined by the dominant species, and rare species have a relatively small effect on the stability. In less stable, continuously successional communities, the stability of the community increases gradually with increasing species richness, which may be related to the growth habits of the added species but not significantly correlated with the frequency of the added species. That is, both common species with high frequency and rare species with low frequency may be important contributors to community stability. Therefore, when calculating the community stability, one should never only calculate the stability results represented by the dominant species of the community.
- (3)
- Within a certain range, the greater the soil pH and wind speed, the greater the species richness in the island community will be. The soil organic matter plays an important role in maintaining soil stability on islands. When organic matter is insufficient, it may lead to the alteration of the soil nutrients, destruction of island habitats, and reduction in species richness, which are detrimental to the stable development of communities. Islands are typical fragile ecosystems, and rare species have a very important ecological status in the harsh environment of islands, especially in terms of their contributions to the richness and stability of communities on the islands. Therefore, in the future research process, rare species should not be simply discarded but should be comprehensively analyzed in combination with other information to delve deeper into the important value of rare species on the islands.
Author Contributions
Funding
Institutional Review Board Statement
Informed Consent Statement
Data Availability Statement
Conflicts of Interest
Appendix A

| Sample Plot No. | Longitude | Latitude | Elevation (m) | Slope Aspect | Slope (°) | Slope Position | Crown Density | Distance from Coastline (km) | Distance to the Nearest Island (km) | Distance to the Mainland (km) | Air Temperature (°C) | Precipitation (mm/a) | Wind Speed (m/s) |
|---|---|---|---|---|---|---|---|---|---|---|---|---|---|
| S1 | 119°40′47.66″ | 26°39′07.25″ | 42.4 | SE160(SU) | 30 | Middle | 0.75 | 1.438 | 2.844 | 3.699 | 20.206 | 1319.333 | 1.072 |
| S2 | 119°40′47.12″ | 26°39′09.55″ | 81.1 | SE160(SU) | 30 | Up | 0.75 | 1.508 | 2.824 | 3.761 | 19.864 | 1328.361 | 1.072 |
| S3 | 119°39′33.26″ | 26°39′53.18″ | 178.4 | N353(SH) | 30 | Up | 0.80 | 0.596 | 1.455 | 3.488 | 19.989 | 1327.944 | 0.964 |
| S4 | 119°39′20.11″ | 26°39′51.20″ | 71.9 | NW312(HSH) | 30 | Middle | 0.75 | 0.302 | 1.238 | 3.222 | 19.989 | 1327.944 | 0.952 |
| S5 | 119°39′32.59″ | 26°39′57.99″ | 123.2 | W261(HSU) | 37 | Up | 0.68 | 0.515 | 1.573 | 3.395 | 19.989 | 1327.944 | 0.964 |
| S6 | 119°40′22.00″ | 26°39′43.00″ | 175.5 | SE155(HSU) | 32 | Middle | 0.80 | 1.652 | 2.316 | 4.659 | 19.481 | 1330.194 | 1.097 |
| S7 | 119°40′16.47″ | 26°40′10.93″ | 40.7 | NW289(HSH) | 24 | Low | 0.75 | 0.911 | 2.657 | 4.210 | 20.042 | 1331.361 | 1.063 |
| S8 | 119°40′10.60″ | 26°40′07.14″ | 96.0 | NE23(SH) | 23 | Low | 0.80 | 1.096 | 2.458 | 4.126 | 19.481 | 1330.194 | 1.052 |
| S9 | 119°44′53.67″ | 26°40′25.00″ | 126.0 | SW205(SU) | 30 | Up | 0.55 | 0.512 | 1.738 | 4.035 | 19.436 | 1320.167 | 0.767 |
| S10 | 119°44′35.47″ | 26°39′58.77″ | 157.2 | S180(SU) | 30 | Up | 0.93 | 0.491 | 2.024 | 4.549 | 19.894 | 1325.778 | 0.690 |
| S11 | 119°44′46.93″ | 26°40′00.68″ | 133.0 | SW191(SU) | 30 | Middle | 0.95 | 0.368 | 1.749 | 4.615 | 19.892 | 1322.500 | 0.767 |
| S12 | 119°44′44.44″ | 26°39′59.58″ | 140.9 | NE47(SH) | 30 | Middle | 0.90 | 0.380 | 1.800 | 4.622 | 19.892 | 1322.500 | 0.690 |
| S13 | 119°42′04.34″ | 26°38′33.02″ | 109.1 | SW224(SU) | 28 | Low | 0.60 | 0.152 | 3.428 | 3.287 | 19.991 | 1323.150 | 1.074 |
| S14 | 119°41′55.43″ | 26°38′29.77″ | 109.1 | SW197(SU) | 35 | Low | 0.60 | 0.031 | 3.350 | 3.251 | 20.043 | 1323.280 | 1.094 |
| S15 | 119°40′46.81″ | 26°39′11.85″ | 92.1 | SE119(HSU) | 26 | Middle | 0.80 | 1.581 | 2.815 | 3.829 | 19.864 | 1328.361 | 1.072 |
| S16 | 119°40′40.70″ | 26°39′06.44″ | 49.4 | SE151(HSU) | 32 | Low | 0.65 | 1.420 | 2.650 | 3.626 | 20.206 | 1319.333 | 1.072 |
| S17 | 119°40′19.56″ | 26°38′53.23″ | 55.0 | SE115(HSU) | 22 | Low | 0.60 | 1.057 | 2.136 | 3.120 | 20.050 | 1326.528 | 0.929 |
| S18 | 119°39′09.64″ | 26°39′46.10″ | 36.2 | NW294(HSH) | 22 | Low | 0.58 | 0.181 | 1.016 | 3.102 | 19.989 | 1327.944 | 0.946 |
| S19 | 119°41′11.56″ | 26°40′14.92″ | 89.3 | NE39(SH) | 27 | Low | 0.88 | 0.410 | 1.185 | 4.185 | 19.953 | 1332.000 | 1.111 |
| S20 | 119°41′16.77″ | 26°40′12.60″ | 64.0 | NE35(SH) | 30 | Low | 0.85 | 0.446 | 1.072 | 4.217 | 19.953 | 1332.000 | 1.123 |
| Q1 | 119°45′49.49″ | 26°36′45.54″ | 83.2 | SW197(SU) | 28 | Middle | 0.70 | 0.373 | 0.694 | 2.218 | 19.978 | 1304.139 | 1.247 |
| Q2 | 119°45′54.47″ | 26°36′44.06″ | 74.4 | SW212(SU) | 26 | Middle | 0.80 | 0.376 | 0.825 | 1.975 | 19.978 | 1304.139 | 1.246 |
| Q3 | 119°45′49.49″ | 26°37′14.24″ | 160.7 | NW342(SH) | 24 | Middle | 0.67 | 0.364 | 1.197 | 2.823 | 19.831 | 1305.028 | 1.214 |
| Q4 | 119°45′51.85″ | 26°37′19.87″ | 92.4 | N7(SH) | 34 | Middle | 0.80 | 0.205 | 1.375 | 2.991 | 19.831 | 1305.028 | 1.215 |
| Q5 | 119°45′32.05″ | 26°37′02.60″ | 36.9 | SW219(SU) | 34 | Low | 0.80 | 0.118 | 0.631 | 2.231 | 19.901 | 1304.810 | 1.220 |
| Q6 | 119°45′33.29″ | 26°37′04.47″ | 58.1 | SW242(SU) | 35 | Middle | 0.80 | 0.185 | 0.698 | 2.301 | 19.893 | 1304.760 | 1.224 |
| C1 | 119°48′34.85″ | 26°40′11.21″ | 26.0 | SW208(SU) | 38 | Up | 0.65 | 0.054 | 1.515 | 2.206 | 19.908 | 1299.540 | 0.857 |
| C2 | 119°48′43.84″ | 26°40′35.66″ | 49.2 | S175(SU) | 36 | Middle | 0.95 | 0.250 | 0.761 | 1.570 | 19.883 | 1301.361 | 0.795 |
| C3 | 119°48′02.29″ | 26°41′07.33″ | 54.2 | N351(SH) | 26 | Low | 0.93 | 0.175 | 1.417 | 0.546 | 19.682 | 1311.060 | 0.683 |
| C4 | 119°48′20.11″ | 26°40′57.27″ | 56.6 | NE71(HSH) | 33 | Low | 0.65 | 0.079 | 1.143 | 0.734 | 19.772 | 1308.833 | 0.715 |
| C5 | 119°48′43.16″ | 26°40′48.40″ | 16.2 | NE55(SH) | 27 | Low | 0.55 | 0.029 | 0.541 | 1.220 | 19.892 | 1303.472 | 0.795 |
| J1 | 119°48′24.42″ | 26°34′14.67″ | 104.7 | E88(HSH) | 37 | Up | 0.70 | 0.321 | 0.961 | 1.816 | 19.681 | 1270.472 | 1.838 |
| J2 | 119°48′35.68″ | 26°34′15.09″ | 44.6 | E83(HSH) | 24 | Middle | 0.80 | 0.140 | 0.891 | 2.066 | 19.681 | 1270.472 | 1.819 |
| J3 | 119°48′08.40″ | 26°34′16.59″ | 47.7 | NE38(SH) | 38 | Middle | 0.70 | 0.228 | 1.239 | 1.561 | 19.688 | 1273.160 | 1.842 |
| J4 | 119°47′59.29″ | 26°34′17.35″ | 19.3 | N3(SH) | 28 | Low | 0.78 | 0.140 | 1.430 | 1.440 | 19.695 | 1274.560 | 1.854 |
| B1 | 119°46′31.03″ | 26°41′06.06″ | 99.5 | SW225(SU) | 34 | Up | 0.68 | 0.328 | 1.737 | 2.078 | 19.614 | 1321.190 | 0.703 |
| B2 | 119°47′01.63″ | 26°41′23.15″ | 45.8 | SE127(HSU) | 22 | Up | 0.75 | 0.125 | 0.988 | 1.099 | 19.617 | 1321.500 | 0.650 |
| B3 | 119°47′03.07″ | 26°41′23.62″ | 44.6 | E83(HSH) | 24 | Middle | 0.80 | 0.084 | 0.957 | 1.062 | 19.681 | 1270.472 | 1.819 |
| D1 | 119°47′39.27″ | 26°36′09.74″ | 57.0 | NW282(HSU) | 31 | Up | 0.85 | 0.227 | 1.073 | 2.134 | 19.928 | 1283.833 | 1.608 |
| D2 | 119°47′45.28″ | 26°36′15.55″ | 63.0 | NW291(HSU) | 23 | Low | 0.75 | 0.130 | 0.983 | 2.375 | 19.928 | 1283.833 | 1.617 |
Appendix B
| Sample Plot No. | pH | K (g/kg) | K (mg/kg) | T-P (g/kg) | P (mg/kg) | T-N (g/kg) | N (mg/kg) | SOM (g/kg) | S (g/kg) |
|---|---|---|---|---|---|---|---|---|---|
| S1 | 4.55 | 1.17 | 73.71 | 0.09 | 2.31 | 1.03 | 172.12 | 31.48 | 1.36 |
| S2 | 4.66 | 0.41 | 52.89 | 0.06 | 1.40 | 0.72 | 157.09 | 23.36 | 1.62 |
| S3 | 4.65 | 4.71 | 76.73 | 0.19 | 1.33 | 1.47 | 119.25 | 38.39 | 0.97 |
| S4 | 4.66 | 3.19 | 44.26 | 0.34 | 3.95 | 1.67 | 161.40 | 43.98 | 0.97 |
| S5 | 4.64 | 3.19 | 51.64 | 0.10 | 1.55 | 0.74 | 141.96 | 20.99 | 1.51 |
| S6 | 4.44 | 6.95 | 32.71 | 0.26 | 1.10 | 1.38 | 179.98 | 47.05 | 1.34 |
| S7 | 4.41 | 4.78 | 91.24 | 0.21 | 1.43 | 1.84 | 224.79 | 48.87 | 1.78 |
| S8 | 4.30 | 5.04 | 45.62 | 0.11 | 1.80 | 1.33 | 214.71 | 45.98 | 1.46 |
| S9 | 4.36 | 9.84 | 45.62 | 0.10 | 0.96 | 1.24 | 163.96 | 48.45 | 1.81 |
| S10 | 4.60 | 3.68 | 51.89 | 0.12 | 1.51 | 1.22 | 152.48 | 37.95 | 0.87 |
| S11 | 4.61 | 3.16 | 74.07 | 0.16 | 0.92 | 1.31 | 167.87 | 41.78 | 0.49 |
| S12 | 4.61 | 3.32 | 102.86 | 0.15 | 1.24 | 1.64 | 231.32 | 42.81 | 1.49 |
| S13 | 4.62 | 7.14 | 84.01 | 0.16 | 1.35 | 0.96 | 140.50 | 39.87 | 1.02 |
| S14 | 4.67 | 8.82 | 84.01 | 0.19 | 1.68 | 1.38 | 180.03 | 41.16 | 1.64 |
| S15 | 4.49 | 3.69 | 112.70 | 0.17 | 1.12 | 1.65 | 148.91 | 41.20 | 1.37 |
| S16 | 4.67 | 2.07 | 55.02 | 0.09 | 1.31 | 1.06 | 136.17 | 29.22 | 1.69 |
| S17 | 4.45 | 2.05 | 74.81 | 0.11 | 3.17 | 0.87 | 178.88 | 22.06 | 0.82 |
| S18 | 4.68 | 7.59 | 23.69 | 0.23 | 0.85 | 1.36 | 166.64 | 45.70 | 1.07 |
| S19 | 4.44 | 6.70 | 44.71 | 0.19 | 1.02 | 1.79 | 192.54 | 52.85 | 1.22 |
| S20 | 4.22 | 9.06 | 44.48 | 0.21 | 1.30 | 1.30 | 204.37 | 34.74 | 0.50 |
| Q1 | 4.92 | 2.66 | 55.58 | 0.15 | 1.63 | 1.32 | 80.06 | 37.04 | 1.36 |
| Q2 | 5.37 | 2.51 | 44.71 | 0.17 | 0.66 | 1.35 | 76.42 | 35.35 | 1.62 |
| Q3 | 5.21 | 2.52 | 34.50 | 0.16 | 0.61 | 1.13 | 68.50 | 31.23 | 0.97 |
| Q4 | 5.14 | 1.69 | 63.51 | 0.21 | 1.16 | 1.54 | 90.79 | 43.13 | 0.97 |
| Q5 | 5.05 | 2.85 | 75.57 | 0.17 | 1.12 | 1.72 | 118.29 | 44.19 | 1.51 |
| Q6 | 5.31 | 2.61 | 53.93 | 0.14 | 0.78 | 1.04 | 84.51 | 31.23 | 1.34 |
| C1 | 5.96 | 2.38 | 42.18 | 0.27 | 1.46 | 1.06 | 76.42 | 33.10 | 1.78 |
| C2 | 4.82 | 3.04 | 93.48 | 0.19 | 0.64 | 1.01 | 102.75 | 37.69 | 1.46 |
| C3 | 4.17 | 8.28 | 45.16 | 0.26 | 1.99 | 2.08 | 196.67 | 48.30 | 1.81 |
| C4 | 4.32 | 9.71 | 35.56 | 0.22 | 2.21 | 1.46 | 164.10 | 64.02 | 0.87 |
| C5 | 4.58 | 2.82 | 93.48 | 0.17 | 1.08 | 1.57 | 120.43 | 46.56 | 0.49 |
| J1 | 4.66 | 3.81 | 126.26 | 0.28 | 1.62 | 2.10 | 250.19 | 54.73 | 1.49 |
| J2 | 4.57 | 4.76 | 63.82 | 0.19 | 0.97 | 1.36 | 419.77 | 44.18 | 1.02 |
| J3 | 4.37 | 4.80 | 44.48 | 0.18 | 0.98 | 1.24 | 135.82 | 50.28 | 1.64 |
| J4 | 5.05 | 2.46 | 72.28 | 0.31 | 1.25 | 1.12 | 111.29 | 41.06 | 1.37 |
| B1 | 4.82 | 2.69 | 74.44 | 0.17 | 1.86 | 1.51 | 126.13 | 49.71 | 1.69 |
| B2 | 4.81 | 2.90 | 56.15 | 0.18 | 1.36 | 1.38 | 179.45 | 41.10 | 0.82 |
| B3 | 5.00 | 4.43 | 145.07 | 0.22 | 1.36 | 2.20 | 205.19 | 65.73 | 1.07 |
| D1 | 5.01 | 3.68 | 90.37 | 0.22 | 1.09 | 1.70 | 143.80 | 54.99 | 1.22 |
| D2 | 4.82 | 4.71 | 118.48 | 0.21 | 0.69 | 1.38 | 147.95 | 44.92 | 0.50 |
Appendix C
| Species Types | Species (Variety) | Absolute Frequency | Distribution on the Island (√) | |||||
|---|---|---|---|---|---|---|---|---|
| Sandu Island | Qingshan Island | Changyao Island | Jigongshan Island | Baipao Island | Doumao Island | |||
| Common species | Ilex pubescens Hook. et Arn. | 40 | √ | √ | √ | √ | √ | √ |
| Litsea rotundifolia var. oblongifolia (Nees) Allen | 40 | √ | √ | √ | √ | √ | √ | |
| Smilax china L. | 40 | √ | √ | √ | √ | √ | √ | |
| Gardenia jasminoides Ellis | 39 | √ | √ | √ | √ | √ | √ | |
| Symplocos sumuntia Buch.-Ham. ex D. Don | 38 | √ | √ | √ | √ | √ | √ | |
| Mussaenda pubescens W. T. Aiton | 37 | √ | √ | √ | √ | √ | √ | |
| Heptapleurum heptaphyllum (L.) Y. F. Deng | 36 | √ | √ | √ | √ | √ | √ | |
| Toxicodendron succedaneum (L.) O. Kuntze | 34 | √ | √ | √ | √ | √ | √ | |
| Adinandra millettii (Hook. et Arn.) Benth. et Hook. f. ex Hance | 34 | √ | √ | √ | √ | √ | √ | |
| Psychotria asiatica Wall. | 31 | √ | √ | √ | √ | √ | √ | |
| Melastoma malabathricum Linnaeus | 30 | √ | √ | √ | √ | √ | √ | |
| Eurya nitida Korthals | 30 | √ | √ | √ | √ | √ | √ | |
| Smilax glabra Roxb. | 29 | √ | √ | √ | √ | √ | √ | |
| Melicope pteleifolia (Champion ex Bentham) T. G. Hartley | 29 | √ | √ | √ | √ | √ | √ | |
| Rhodomyrtus tomentosa (Ait.) Hassk. | 28 | √ | √ | √ | √ | √ | ||
| Syzygium hancei Merr. et Perry | 28 | √ | √ | √ | √ | √ | √ | |
| Alyxia sinensis Champ. ex Benth. | 27 | √ | √ | √ | √ | √ | √ | |
| Ilex triflora Bl. | 26 | √ | √ | √ | √ | √ | √ | |
| Loropetalum chinense (R. Br.) Oliver | 25 | √ | √ | √ | √ | √ | √ | |
| Clerodendrum cyrtophyllum Turcz. | 23 | √ | √ | √ | √ | √ | √ | |
| Ilex asprella (Hook. et Arn.) Champ. ex Benth. | 23 | √ | √ | √ | ||||
| Archidendron lucidum (Benth) I. C. Nielsen | 21 | √ | √ | √ | √ | |||
| Zanthoxylum nitidum (Roxb.) DC. | 21 | √ | √ | √ | √ | √ | √ | |
| Ficus erecta Thunb. | 20 | √ | √ | √ | √ | √ | √ | |
| Rhaphiolepis indica (Linnaeus) Lindley | 20 | √ | √ | √ | √ | √ | √ | |
| Rubus corchorifolius L. f. | 20 | √ | √ | √ | √ | √ | √ | |
| Viburnum fordiae Hance | 20 | √ | √ | √ | √ | √ | √ | |
| Zanthoxylum avicennae (Lam.) DC. | 20 | √ | √ | √ | √ | √ | √ | |
| Symplocos lancifolia Sieb. et Zucc. | 20 | √ | √ | √ | √ | √ | √ | |
| Morinda parvifolia Bartl. et DC. | 19 | √ | √ | √ | √ | √ | √ | |
| Glochidion obovatum Sieb. et Zucc. | 18 | √ | √ | √ | √ | √ | √ | |
| Smilax lanceifolia Roxb. | 17 | √ | √ | √ | √ | |||
| Acronychia pedunculata (L.) Miq. | 17 | √ | √ | √ | √ | √ | √ | |
| Embelia vestita Roxb. | 17 | √ | √ | √ | √ | √ | √ | |
| Paederia foetida L. | 17 | √ | √ | √ | √ | √ | √ | |
| Camphora officinarum Nees ex Wall. | 16 | √ | √ | √ | √ | √ | √ | |
| Celastrus aculeatus Merr. | 16 | √ | √ | √ | √ | √ | ||
| Camellia sinensis (L.) O. Ktze. | 16 | √ | √ | √ | √ | √ | √ | |
| Symplocos tanakana Nakai | 16 | √ | √ | √ | √ | √ | ||
| Ficus variolosa Lindl. ex Benth. | 15 | √ | √ | √ | √ | |||
| Ficus pumila L. | 15 | √ | √ | √ | √ | √ | ||
| Rubus amphidasys Focke ex Diels | 14 | √ | √ | √ | √ | √ | ||
| Mallotus repandus var. chrysocarpus (Pamp.)S.M.Hwang | 14 | √ | √ | √ | ||||
| Wikstroemia trichotoma (Thunb.) Makino | 13 | √ | √ | √ | √ | √ | ||
| Celastrus hindsii Benth. | 13 | √ | √ | √ | √ | √ | ||
| Vaccinium bracteatum Thunb. | 13 | √ | √ | |||||
| Ardisia quinquegona Blume | 13 | √ | √ | √ | √ | √ | ||
| Elaeocarpus decipiens Hemsl. | 13 | √ | √ | √ | √ | √ | ||
| Rhododendron simsii Planch. | 13 | √ | √ | √ | √ | |||
| Symplocos anomala Brand | 12 | √ | √ | √ | √ | √ | ||
| Ardisia crenata Sims | 12 | √ | √ | √ | √ | √ | ||
| Rhus chinensis Mill. | 12 | √ | √ | √ | √ | √ | ||
| Glochidion rubrum Bl. | 12 | √ | √ | √ | √ | √ | ||
| Callerya nitida (Bentham) R. Geesink | 12 | √ | √ | √ | ||||
| Daphniphyllum oldhamii (Hemsl.) Rosenthal | 12 | √ | √ | √ | √ | √ | ||
| Pseudosasa amabilis (McClure) Keng f. | 12 | √ | √ | √ | √ | |||
| Lonicera japonica Thunb. | 11 | √ | √ | √ | √ | √ | √ | |
| Callicarpa giraldii Hesse ex Rehd. | 11 | √ | √ | √ | √ | √ | ||
| Tarenna mollissima (Hook. et Arn.) Robins. | 11 | √ | √ | √ | √ | |||
| Celtis biondii Pamp. | 10 | √ | √ | √ | √ | √ | ||
| Ficus stenophylla Hemsl. | 10 | √ | √ | √ | √ | √ | ||
| Sageretia thea (Osbeck) Johnst. | 10 | √ | √ | √ | √ | √ | ||
| Glochidion eriocarpum Champ. ex Benth. | 10 | √ | √ | √ | ||||
| Diplospora dubia (Lindl.) Masam. | 10 | √ | √ | √ | √ | |||
| Lindera glauca (Siebold & Zucc.) Blume | 9 | √ | √ | √ | √ | √ | ||
| Ardisia sieboldii Miq. | 9 | √ | √ | √ | √ | √ | ||
| Xylosma congesta (Loureiro) Merrill | 8 | √ | √ | √ | √ | √ | ||
| Rosa cymosa Tratt. | 8 | √ | √ | √ | √ | √ | ||
| Pericampylus glaucus (Lam.) Merr. | 8 | √ | √ | √ | √ | |||
| Ardisia lindleyana D. Dietrich | 8 | √ | √ | |||||
| Vitex quinata (Lour.) Will. | 8 | √ | √ | √ | √ | √ | ||
| Quercus glauca Thunb. | 8 | √ | √ | |||||
| Symplocos congesta Benth. | 8 | √ | √ | √ | ||||
| Elaeagnus glabra Thunb. | 8 | √ | √ | √ | √ | |||
| Urena lobata L. | 8 | √ | √ | √ | √ | √ | √ | |
| Camellia oleifera Abel. | 7 | √ | √ | |||||
| Triadica sebifera (Linnaeus) Small | 7 | √ | √ | √ | √ | √ | ||
| Lespedeza bicolor Turcz. | 7 | √ | √ | √ | ||||
| Maclura cochinchinensis (Loureiro) Corner | 7 | √ | √ | √ | ||||
| Canarium album (Lour.) DC. | 7 | √ | √ | √ | √ | √ | ||
| Mallotus paniculatus (Lam.) Muell. Arg. | 7 | √ | √ | √ | √ | |||
| Celastrus gemmatus Loes. | 6 | √ | √ | √ | ||||
| Pittosporum tobira (Thunb.) Ait. | 5 | √ | √ | √ | ||||
| Elacocarpus japonicus S. et Z. | 5 | √ | √ | |||||
| Cunninghamia lanceolata (Lamb.) Hook. | 5 | √ | √ | √ | √ | |||
| Antidesma japonicum Sieb. et Zucc. | 5 | √ | √ | √ | √ | |||
| Celtis sinensis Pers. | 5 | √ | √ | |||||
| Rubus hirsutus Thunb. | 5 | √ | √ | |||||
| Schima superba Gardn. et Champ. | 5 | √ | √ | |||||
| Rubus parvifolius L. | 5 | √ | √ | √ | ||||
| Rosa laevigata Michx. | 5 | √ | √ | √ | √ | |||
| Ficus hirta Vahl | 5 | √ | √ | |||||
| Diospyros kaki var. silvestris Makino | 4 | √ | √ | √ | ||||
| Casearia glomerata Roxb. | 4 | √ | √ | |||||
| Ficus pandurata Hance | 4 | √ | √ | |||||
| Coptosapelta diffusa (Champ. ex Benth.) Van Steenis | 4 | √ | ||||||
| Vaccinium mandarinorum Diels | 4 | √ | ||||||
| Camphora parthenoxylon (Jack) Nees | 4 | √ | ||||||
| Berchemia kulingensis Schneid. | 4 | √ | √ | √ | ||||
| Urena procumbens L. | 4 | √ | √ | √ | ||||
| Mallotus philippensis (Lam.) Muell. Arg. | 4 | √ | √ | √ | ||||
| Syzygium buxifolium Hook. et Arn. | 4 | √ | √ | √ | ||||
| Quercus myrsinifolia Blume | 3 | √ | ||||||
| Phyllostachys heteroclada Oliver | 3 | √ | √ | √ | ||||
| Adina pilulifera (Lam.) Franch. ex Drake | 3 | √ | √ | √ | ||||
| Triadica cochinchinensis Loureiro | 3 | √ | √ | |||||
| Ficus pandurata Hance | 3 | √ | √ | |||||
| Diospyros morrisiana Hance | 3 | √ | √ | √ | ||||
| Glochidion triandrum (Blanco) C. B. Rob. | 3 | √ | ||||||
| Breynia fruticosa (L.) Hook. f. | 3 | √ | √ | |||||
| Machilus phoenicis Dunn | 3 | √ | √ | |||||
| Rare species | Tylophora ovata (Lindl.) Hook. ex Steud. | 2 | √ | √ | ||||
| Acacia confusa Merr. | 2 | √ | √ | |||||
| Phyllostachys makinoi Hayata | 2 | √ | √ | |||||
| Trema cannabina var. dielsiana (Hand.-Mazz.) C.J.Chen | 2 | √ | √ | √ | ||||
| Elaeocarpus sylvestris (Lour.) Poir. | 2 | √ | √ | |||||
| Vernicia montana Lour. | 2 | √ | √ | |||||
| Castanopsis carlesii (Hemsl.) Hayata. | 2 | √ | ||||||
| Photinia villosa (Thunb.) DC. | 2 | √ | √ | |||||
| Pinus massoniana Lamb. | 2 | √ | √ | |||||
| Dimocarpus longan Lour. | 2 | √ | √ | |||||
| Castanopsis fargesii Franch. | 2 | √ | ||||||
| Ardisia brevicaulis Diels | 2 | √ | ||||||
| Ormosia henryi Prain | 2 | √ | √ | |||||
| Elaeagnus pungens Thunb. | 2 | √ | √ | |||||
| Tashiroea quadrangularis (Cogn.) R. Zhou & Ying Liu | 2 | √ | ||||||
| Photinia bodinieri Lévl. | 2 | √ | √ | |||||
| Liquidambar formosana Hance | 2 | √ | √ | |||||
| Berchemia floribunda (Wall.) Brongn. | 2 | √ | ||||||
| Camphora micrantha (Hayata) Y.Yang, Bing Liu & Zhi Yang | 2 | √ | ||||||
| Dodonaea viscosa (L.) Jacq. | 2 | √ | √ | |||||
| Symplocos lucida (Thunberg) Siebold & Zuccarini | 1 | √ | ||||||
| Antidesma montanum var. microphyllum (Hemsley) Petra Hoffmann | 1 | √ | ||||||
| Rourea microphylla (Hook. et Arn.) Planch. | 1 | √ | ||||||
| Ohwia caudata (Thunberg) H. Ohashi | 1 | √ | ||||||
| Lespedeza virgata (Thunb.) DC. | 1 | √ | ||||||
| Firmiana simplex (L.) W. Wight | 1 | √ | ||||||
| Cinnamomum japonicum Sieb. | 1 | √ | ||||||
| Broussonetia kaempferi Sieb. | 1 | √ | ||||||
| Photinia prunifolia (Hook. et Arn.) Lindl. | 1 | √ | ||||||
| Glochidion puberum (L.) Hutch. | 1 | √ | ||||||
| Rosa bracteata Wendl. | 1 | √ | ||||||
| Euonymus laxiflorus Champ. ex Benth. | 1 | √ | ||||||
| Trema tomentosa (Roxb.) Hara | 1 | √ | ||||||
| Ficus sarmentosa Buch.-Ham. ex J. E. Sm. var. sarmentosa | 1 | √ | ||||||
| Embelia undulata (Wall.) Mez | 1 | √ | ||||||
| Callicarpa kochiana Makino | 1 | √ | ||||||
| Eriobotrya japonica (Thunb.) Lindl. | 1 | √ | ||||||
| Casuarina equisetifolia L. | 1 | √ | ||||||
| Vitex negundo var. cannabifolia (Sieb.et Zucc.) Hand.-Mazz. | 1 | √ | ||||||
| Myrsine seguinii H. Léveillé | 1 | √ | ||||||
| Calamus thysanolepis Hance | 1 | √ | ||||||
| Alangium kurzii Craib | 1 | √ | ||||||
| Wikstroemia indica (L.) C. A. Mey. | 1 | √ | ||||||
| Symplocos stellaris Brand | 1 | √ | ||||||
| Pleioblastus amarus (Keng) Keng f. | 1 | √ | ||||||
| Rubus rosifolius Smith | 1 | √ | ||||||
| Lespedeza cuneata (Dum.-Cours.) G. Don | 1 | √ | ||||||
| Viburnum dilatatum Thunb. | 1 | √ | ||||||
| Aralia echinocaulis Hand.-Mazz. | 1 | √ | ||||||
| Styrax calvescens Perk. | 1 | √ | ||||||
| Glochidion hirsutum (Roxb.) Voigt | 1 | √ | ||||||
| Rubus buergeri Miq. | 1 | √ | ||||||
| Photinia glabra (Thunb.) Maxim. | 1 | √ | ||||||
| Celastrus rosthornianus Loes. | 1 | √ | ||||||
| Maesa japonica (Thunb.) Moritzi. ex Zoll. | 1 | √ | ||||||
| Vitex rotundifolia Linnaeus f. | 1 | √ | ||||||
| Zanthoxylum ailanthoides Sied. et. Zucc. | 1 | √ | ||||||
| Sarcandra glabra (Thunb.) Nakai | 1 | √ | ||||||
Appendix D
| Species Types | Species (Variety) | Absolute Frequency | Distribution on the Island (√) | |||||
|---|---|---|---|---|---|---|---|---|
| Sandu Island | Qingshan Island | Changyao Island | Jigongshan Island | Baipao Island | Doumao Island | |||
| Common species | Gahnia tristis Nees | 29 | √ | √ | √ | √ | √ | √ |
| Adiantum flabellulatum L. | 25 | √ | √ | √ | √ | √ | ||
| Lindsaea orbiculata (Lam.) Mett. ex Kuhn | 23 | √ | √ | √ | √ | √ | √ | |
| Lophatherum gracile Brongn. | 19 | √ | √ | √ | √ | √ | √ | |
| Miscanthus sinensis Anderss. | 14 | √ | √ | √ | √ | √ | √ | |
| Lygodium japonicum (Thunb.) Sw. | 10 | √ | √ | √ | √ | |||
| Alpinia zerumbet (Pers.) B. L. Burtt & R. M. Sm. | 10 | √ | √ | √ | √ | √ | ||
| Senecio scandens Buch.-Ham. ex D. Don | 10 | √ | √ | √ | √ | |||
| Carex breviculmis R. Br. | 10 | √ | √ | √ | ||||
| Pteris semipinnata L. Sp. | 9 | √ | √ | √ | ||||
| Liriope spicata (Thunb.) Lour. | 9 | √ | √ | √ | √ | |||
| Dianella ensifolia (L.) Redouté | 7 | √ | √ | √ | √ | √ | ||
| Oplismenus undulatifolius (Arduino) Beauv. | 5 | √ | √ | √ | ||||
| Miscanthus floridulus (Lab.) Warb. ex Schum et Laut. | 5 | √ | √ | √ | ||||
| Woodwardia japonica (L. F.) Sm. | 4 | √ | ||||||
| Carex scabrifolia Steud. | 4 | √ | √ | √ | ||||
| Scutellaria indica L. | 3 | √ | √ | √ | ||||
| Asparagus cochinchinensis (Lour.) Merr. | 3 | √ | √ | |||||
| Solena heterophylla Lour. | 3 | √ | √ | |||||
| Onychium japonicum (Thunb.) Kze. | 3 | √ | √ | |||||
| Arthraxon hispidus (Thunb.) Makino | 3 | √ | √ | √ | ||||
| Rare species | Diplazium donianum (Mett.) Tard.-Blot | 2 | √ | |||||
| Setaria plicata (Lam.) T. Cooke | 2 | √ | √ | |||||
| Lilium brownii F. E. Brown ex Miellez | 2 | √ | ||||||
| Patrinia villosa (Thunb.) Juss. | 2 | √ | ||||||
| Odontosoria chinensis J. Sm. | 2 | √ | √ | |||||
| Commelina benghalensis Linnaeus | 2 | √ | √ | |||||
| Polystichum tsus-simense (Hook.) | 2 | √ | √ | |||||
| Macrothelypteris torresiana (Gaud.) Ching | 2 | √ | √ | |||||
| Setaria viridis (L.) Beauv. | 2 | √ | √ | |||||
| Blechnopsis orientalis C. Presl | 2 | √ | √ | |||||
| Oplismenus compositus (L.) Beauv. | 2 | √ | √ | |||||
| Symphyotrichum subulatum (Michx.) G.L.Nesom | 2 | √ | ||||||
| Cyclosorus interruptus (Willd.) H. Ito | 2 | √ | ||||||
| Arisaema heterophyllum Blume | 1 | √ | ||||||
| Sarcopyramis napalensis Wallich | 1 | √ | ||||||
| Alocasia odora (Roxburgh) K. Koch | 1 | √ | ||||||
| Emilia sonchifolia (L.) DC. | 1 | √ | ||||||
| Leucocasia gigantea (Blume) Schott | 1 | √ | ||||||
| Arachniodes chinensis (Rosenst.) Ching | 1 | √ | ||||||
| Pteris kiuschiuensis Hieron. | 1 | √ | ||||||
| Solidago decurrens Lour. | 1 | √ | ||||||
| Dryopteris championii (Benth.) C. Chr. | 1 | √ | ||||||
| Erigeron canadensis L. | 1 | √ | ||||||
| Polygala japonica Houtt. | 1 | √ | ||||||
| Tectaria phaeocaulis (Ros.) C. Chr. | 1 | √ | ||||||
| Duchesnea indica (Andr.) Focke | 1 | √ | ||||||
| Elymus dahuricus Turcz. | 1 | √ | ||||||
| Centella asiatica (L.) Urban | 1 | √ | ||||||
| Pteris ensiformis Burm. | 1 | √ | ||||||
| Dryopteris varia (L.) O. Ktze. | 1 | √ | ||||||
| Dryopteris setosa (Thunb.) Akasawa | 1 | √ | ||||||
| Sceptridium ternatum (Thunb.) Y. X. Lin | 1 | √ | ||||||
| Carex cruciata Wahlenb. | 1 | √ | ||||||
| Dryopteris fuscipes C. Chr. | 1 | √ | ||||||
| Cyperus rotundus L. | 1 | √ | ||||||
| Microstegium vimineum (Trin.) A. Camus | 1 | √ | ||||||
| Persicaria chinensis (L.) H. Gross | 1 | √ | ||||||
| Cymbidium ensifolium (L.) Sw. | 1 | √ | ||||||
References
- Reilly, M.J.; Wimberly, M.C.; Newell, C.L. Wildfire effects on plant species richness at multiple spatial scales in forest communities of the southern Appalachians. J. Ecol. 2006, 94, 118–130. [Google Scholar] [CrossRef]
- Freestone, A.L.; Inouye, B.D. Dispersal limitation and environmental heterogeneity shape scale-dependent diversity patterns in plant communities. Ecology 2006, 87, 2425–2432. [Google Scholar] [CrossRef]
- Wang, S.X.; Zhao, L.; Li, N.; Guo, H.; Wang, X.A.; Duan, R.Y. The relative contributions of rare and common species to the patterns of species richness in plant communities. Biodivers. Sci. 2016, 24, 658–664. [Google Scholar] [CrossRef]
- Sizling, A.L.; Sizlingová, E.; Storch, D.; Reif, J.; Gaston, K.J. Rarity, commonness, and the contribution of individual species to species richness patterns. Am. Nat. 2009, 174, 82–93. [Google Scholar] [CrossRef]
- Gaston, K.J. Biodiversity and extinction: The importance of being common. Prog. Phys. Geogr. 2008, 32, 73–79. [Google Scholar] [CrossRef]
- Berg, A.; Tjernberg, M. Common and rare Swedish vertebrates—Distribution and habitat preferences. Biodivers. Conserv. 1996, 5, 101–128. [Google Scholar] [CrossRef]
- Tsang, T.P.N.; Bonebrake, T.C. Contrasting roles of environmental and spatial processes for common and rare urban butterfly species compositions. Landsc. Ecol. 2017, 32, 47–57. [Google Scholar] [CrossRef]
- Arnoldi, M.H.B. The inherent multidimensionality of temporal variability: How common and rare species shape stability patterns. Ecol. Lett. 2019, 22, 1557–1567. [Google Scholar] [CrossRef]
- Neeson, T.M.; Doran, P.J.; Ferris, M.C.; Fitzpatrick, K.B.; Herbert, M.; Khoury, M.; Moody, A.T.; Ross, J.; Yacobson, E.; McIntyre, P.B. Conserving rare species can have high opportunity costs for common species. Glob. Chang. Biol. 2018, 24, 3862–3872. [Google Scholar] [CrossRef]
- Feng, L.; Yu, L.F.; Wang, Y.; Zhang, L.M.; Zhao, Q.; Li, F.B. The effects of the functional redundancy and functional diversity on the community stability in different stages of the plant communities restoration in karst vegetation. Ecol. Environ. Sci. 2022, 31, 670–678. [Google Scholar]
- Yao, T.H.; Zhu, Z.H.; Li, Y.N.; Pan, S.Y.; Kong, B.B.; Wei, X.H.; Du, J.L. Effects of functional diversity and functional redundancy on the community stability of an alpine meadow. Acta Ecol. Sin. 2016, 36, 1547–1558. [Google Scholar]
- Zhang, J.H.; Huang, Y.M. Biodiversity and stability mechanisms: Understanding and future research. Acta Ecol. Sin. 2016, 36, 3859–3870. [Google Scholar]
- Du, Z.Y.; Wang, J.W.; Xing, W.L.; Xiao, J.; Xie, L.; Hou, H.; Chen, G.C. Plant species diversity and communities stability in vegetation restoration area in Karst Antimony Mining Sites, Guizhou, China. Res. Environ. Sci. 2023, 36, 188–197. [Google Scholar]
- Cui, N.J.; Chen, X.H.; Liu, Y.; Zhang, J.; Yang, W.Q. Shrub and herb diversity at different ages of Pinus massoniana plantation. Acta Ecol. Sin. 2014, 34, 4313–4323. [Google Scholar]
- Xiao, J.H.; Lai, M.Y.; Li, M.; Wang, C.X.; Zhong, Z.F.; Wen, Q.Y.; Wang, Y.; Wen, Q.; Luo, Z.; Qian, Z.; et al. Characteristics of Pinus massoniana forest community and species diversity of island in Sandu Gulf, Ningde, Fujian Province. Acta Ecol. Sin. 2023, 43, 1–17. [Google Scholar] [CrossRef]
- Zheng, Y.R. Comparison of methods for studying stability of forest community. Sci. Silvae Sin. 2000, 36, 28–32. [Google Scholar]
- Song, Y.C. Vegetation Ecology, 2nd ed.; Higher Education Press: Beijing, China, 2017; pp. 35–39. [Google Scholar]
- Li, L.; Zhang, J.J.; Chen, B.Q.; Feng, H.C.; Zhang, S.H.; Sun, R.X.; Gao, S.; Zhang, H.; Yin, J. Dynamic changes of vegetation communities in a small watershed been chronically closed in Loess Plateau in western Shanxi Province. Sci. Silvae Sin. 2018, 54, 1–9. [Google Scholar]
- Qi, Y.X.; Luo, H.; Zhao, T.N. Study on the simple measurement method of crown density. Digit. For. 2009, 11, 62–63. [Google Scholar]
- Lu, R.K. Methods of Soil Agrochemical Analysis; China Agricultural Science and Technology Press: Beijing, China, 2000. [Google Scholar]
- Wang, S.X.; Wang, X.A.; Guo, H.; Zhang, G.Q.; Wang, S.; He, Y.J. Relative contributions of rare and common species to the multiple-scale patterns of species diversity in Quercus wutaishanica communities on the Loess Plateau. Acta Ecol. Sin. 2018, 38, 8060–8069. [Google Scholar]
- Pei, S.X.; Fa, L.; Du, M.Y.; Guo, J.; Xin, X.B. Contribution of undergrowth species of Pinus tabuliformis plantation to the distribution pattern of community species richness in the Zhongtiao Mountain. Acta Bot. Boreali Occident. Sin. 2021, 41, 1409–1416. [Google Scholar]
- Tu, H.R.; Nong, J.L.; Zhu, J.; Zhao, J.J.; Yang, W.L.; Zhu, Q.Q.; Xie, Y.J.; Liu, R.H. Interspecific associations of main species and community stability of Myrsine seguinii community in Karst hills of Guilin, southwestern China. Acta Ecol. Sin. 2022, 42, 3688–3705. [Google Scholar]
- Jiang, N.H.; Zhang, S.H. Interspecific association and environmental interpretation of dominant herbaceous species in Pinus yunnanensis forest in the western suburbs of Chuxiong City. Ecol. Environ. Sci. 2021, 30, 2109–2120. [Google Scholar]
- Lim, C.J.; Basri, M.; Ee, G.C.L.; Omar, D. Phytoinhibitory activities and extraction optimization of potent invasive plants as eco-friendly weed suppressant against Echinochloa colona (L.) Link. Ind. Crops Prod. 2017, 100, 19–34. [Google Scholar] [CrossRef]
- Yang, L.; Wang, J.; Huang, Y.H.; Hui, D.F.; Wen, M.L. Effects of the interception of litterfall by the understory on carbon cycling in eucalyptus plantations of South China. PLoS ONE 2014, 9, e100464. [Google Scholar] [CrossRef] [PubMed]
- O’Brien, M.J.; Carbonell, E.P.; Losapio, G.; Schlueter, P.M.; Schoeb, C. Foundation species promote local adaptation and fine-scale distribution of herbaceous plants. J. Ecol. 2021, 109, 191–203. [Google Scholar] [CrossRef]
- Landi, S.; Chiarucci, A. Commonness and rarity of plants in a reserve network: Just two faces of the same coin. Rend. Lincei 2014, 25, 369–380. [Google Scholar] [CrossRef]
- Van Schalkwyk, J.; Pryke, J.S.; Samways, M.J. Contribution of common vs. rare species to species diversity pat-terns in conservation corridors. Ecol. Indic. 2019, 104, 279–288. [Google Scholar] [CrossRef]
- Bailey, R.C.; Norris, R.H.; Reynoldson, T.B. Bioassessment of Freshwater Ecosystems; Springer: Boston, MA, USA, 2014. [Google Scholar]
- Gotelli, N.J.; Graves, G.R. Null Models in Ecology; Smithsonian Institute Press: Washington, DC, USA, 1996. [Google Scholar]
- Mason, N.W.H.; Mouillot, D.; Lee, W.G.; Wilson, B. Functional richness, functional evenness and functional divergence: The primary components of functional diversity. Oikos 2005, 111, 112–118. [Google Scholar] [CrossRef]
- Mouillot, D.; Bellwood, D.R.; Baraloto, C.; Chave, J.; Galzin, R.; Harmelin-Vivien, M.; Kulbicki, M.; Lavergne, S.; Lavorel, S.; Mouquet, N.; et al. Rare species support vulnerable functions in high-diversity ecosystems. PLoS Biol. 2013, 11, e001569. [Google Scholar] [CrossRef]
- Zhang, L.; Yang, Z.H.; Tang, S.Y.; Zhang, M.; Zhang, R.Y.; Huang, Y.K.; Shang, Z. Slope vegetation characteristics and community stability at different restoration years of open-pit coal mine waste dump. Acta Ecol. Sin. 2021, 41, 5764–5774. [Google Scholar]
- Chen, J. The species diversity and stability of Tsuga tchekiangensis community in Mang Mountain Nature Reserve. Chin. Agric. Sci. Bull. 2010, 26, 81–85. [Google Scholar]
- Jian, X.M.; Sui, W.; Wang, Y.N.; Wang, Q.F.; Chen, Y.P.; Jiang, C.; Xiang, Z.Y. Species diversity and stability of grassland plant community in heavily-degraded karst tiankeng: A case study of Zhanyi tiankeng in Yunnan, China. Acta Ecol. Sin. 2018, 38, 4704–4714. [Google Scholar]
- Liu, G.C.; Huang, Y.X.; Wang, Q.G.; Xing, Y.J. Effects of environmental factors on plant species diversity: Research progress. Chin. Agric. Sci. Bull. 2018, 34, 83–89. [Google Scholar]
- He, Y.Q.; Zeng, J.Y.; Chen, G.J.; Xiao, J.H.; Deng, C.Y. Characteristics and species diversity of typical forest community in Dalian Iisland of Pingtan, Fujian, China. Chin. J. Appl. Environ. Biol. 2022, 28, 759–769. [Google Scholar]
- Jing, Y.; Li, Y.; Yao, Y.; Tuo, D.; Lin, Y.; Sha, N.; Luo, H. Enzyme activities of saline-alkali soil and its relationship with soil microbial biomass and physicochemical factor. J. Agric. Sci. Technol. 2016, 18, 128–138. [Google Scholar]
- Chi, Y.; Shi, H.H.; Guo, Z.; Ding, D.W. Connotation, features and causes of island ecological vulnerability. Haiyang Xuebao 2015, 37, 93–105. [Google Scholar]
- Cao, Y.; Larsen, D.P.; Thorne, R.S.J. Rare species in multivariate analysis for bioassessment: Some considerations. J. N. Am. Benthol. Soc. 2001, 20, 144–153. [Google Scholar] [CrossRef]
- Ai, D.; Chu, C.; Ellwood, F.; Hou, R.; Wang, G. Migration and niche partitioning simultaneously increase species richness and rarity. Ecol. Model. 2013, 258, 33–39. [Google Scholar] [CrossRef]


| Item | Most Common | Rarest | All | Exc.-Most Common | Exc.-Rarest |
|---|---|---|---|---|---|
| Most common | 0.411 ** | 0.479 ** | 0.214 | 0.447 ** | |
| Rarest | 0.337 * | 0.731 ** | 0.683 ** | 0.561 ** | |
| All | 0.889 ** | 0.523 ** | 0.975 ** | ||
| Exc.-most common | 0.671 ** | 0.586 ** | 0.936 ** | 0.942 ** | |
| Exc.-rarest | 0.899 ** | 0.442 ** | 0.996 ** | 0.922 ** |
| Layer | Item | Simulated Curves | R2 | p | Crosspoint Coordinates | Euclidean Distance | Cumulative Species | Cumulative Frequency |
|---|---|---|---|---|---|---|---|---|
| Shrub layer | All | y = −0.0144x2 + 2.2455x + 13.061 | 0.984 | 0.000 | (31.07, 68.93) | 15.66 | 169 | 1634 |
| Exc.-rarest | y = −0.0122x2 + 2.0847x + 8.9627 | 0.993 | 0.000 | (34.12, 65.88) | 19.97 | 131 | 1596 | |
| Exc.-most common | y = −0.0135x2 + 2.2199x + 7.111 | 0.990 | 0.000 | (33.57, 66.43) | 19.19 | 128 | 606 | |
| Exc.-rare | y = −0.0106x2 + 1.9535x + 7.2182 | 0.996 | 0.000 | (36.09, 63.91) | 22.75 | 111 | 1556 | |
| Exc.-common | y = −0.0118x2 + 2.0577x + 7.0064 | 0.992 | 0.000 | (35.19, 64.81) | 21.48 | 105 | 333 | |
| Common | y = −0.0069x2 + 1.6342x + 3.6914 | 0.998 | 0.000 | (40.95, 59.05) | 29.63 | 64 | 1301 | |
| Rare | y = −0.0056x2 + 1.5046x + 1.7447 | 0.996 | 0.000 | (43.45, 56.55) | 33.16 | 58 | 78 | |
| Herb layer | All | y = −0.0114x2 + 1.761x + 30.797 | 0.929 | 0.000 | (28.39, 71.61) | 11.87 | 60 | 295 |
| Exc.-rarest | y = −0.0116x2 + 1.8979x + 20.21 | 0.970 | 0.000 | (31.51, 68.49) | 16.28 | 35 | 270 | |
| Exc.-most common | y = −0.0106x2 + 1.8035x + 18.973 | 0.967 | 0.000 | (33.02, 66.98) | 18.41 | 55 | 163 | |
| Exc.-rare | y = −0.0104x2 + 1.8818x + 12.492 | 0.991 | 0.000 | (34.71, 65.29) | 20.80 | 22 | 224 | |
| Exc.-common | y = −0.0082x2 + 1.6187x + 15.681 | 0.988 | 0.000 | (36.34, 63.66) | 23.11 | 50 | 109 | |
| Common | y = −0.0074x2 + 1.6722x + 4.3996 | 0.998 | 0.000 | (40.30, 59.70) | 28.71 | 10 | 186 | |
| Rare | y = −0.0055x2 + 1.4935x + 1.964 | 0.995 | 0.000 | (43.49, 56.51) | 33.22 | 38 | 51 |
Disclaimer/Publisher’s Note: The statements, opinions and data contained in all publications are solely those of the individual author(s) and contributor(s) and not of MDPI and/or the editor(s). MDPI and/or the editor(s) disclaim responsibility for any injury to people or property resulting from any ideas, methods, instructions or products referred to in the content. |
© 2023 by the authors. Licensee MDPI, Basel, Switzerland. This article is an open access article distributed under the terms and conditions of the Creative Commons Attribution (CC BY) license (https://creativecommons.org/licenses/by/4.0/).
Share and Cite
Xiao, J.; Zhong, Z.; Wang, C.; Li, M.; Wen, Q.; Lin, X.; Luo, Z.; Qian, Z.; Li, M.; Deng, C. Rare Species Are Significant in Harsh Environments and Unstable Communities: Based on the Changes of Species Richness and Community Stability in Different Sub-Assemblages. Sustainability 2023, 15, 13994. https://doi.org/10.3390/su151813994
Xiao J, Zhong Z, Wang C, Li M, Wen Q, Lin X, Luo Z, Qian Z, Li M, Deng C. Rare Species Are Significant in Harsh Environments and Unstable Communities: Based on the Changes of Species Richness and Community Stability in Different Sub-Assemblages. Sustainability. 2023; 15(18):13994. https://doi.org/10.3390/su151813994
Chicago/Turabian StyleXiao, Jihong, Zhifei Zhong, Chunxiao Wang, Mei Li, Qingyan Wen, Xiting Lin, Zhen Luo, Zhijun Qian, Minghe Li, and Chuanyuan Deng. 2023. "Rare Species Are Significant in Harsh Environments and Unstable Communities: Based on the Changes of Species Richness and Community Stability in Different Sub-Assemblages" Sustainability 15, no. 18: 13994. https://doi.org/10.3390/su151813994
APA StyleXiao, J., Zhong, Z., Wang, C., Li, M., Wen, Q., Lin, X., Luo, Z., Qian, Z., Li, M., & Deng, C. (2023). Rare Species Are Significant in Harsh Environments and Unstable Communities: Based on the Changes of Species Richness and Community Stability in Different Sub-Assemblages. Sustainability, 15(18), 13994. https://doi.org/10.3390/su151813994