Article

Characteristics and Influencing Factors of the Spatial and Temporal Variability of the Coupled Water–Energy–Food Nexus in the Yellow River Basin in Henan Province

1
Collaborative Innovation Center for Efficient Utilization of Water Resources, North China University of Water Resources and Electric Power, Zhengzhou 450046, China
2
School of Water Conservancy, North China University of Water Resources and Electric Power, Zhengzhou 450046, China
3
Jiangxi Water Resources Institute, Nanchang 330013, China
*
Authors to whom correspondence should be addressed.
Sustainability 2023, 15(18), 13977; https://doi.org/10.3390/su151813977
Submission received: 8 August 2023 / Revised: 18 September 2023 / Accepted: 18 September 2023 / Published: 20 September 2023

Abstract

:
The interconnection of water, energy, and food constitutes a complex and intricate relationship. A comprehensive index system for the water–energy–food (WEF) nexus in the Yellow River Basin (YRB) in Henan Province was formulated utilizing entropy weighting and the analytic hierarchy process. This was carried out to quantify and assess the evolution of the WEF nexus from 2006 to 2020. GeoDetector was employed to ascertain how selected factors influenced the coupled, coordinated growth of the WEF nexus. Three principal findings were revealed in this study. (1) The value of the comprehensive evaluation index of the WEF nexus increased over the study period from 0.2752 to 0.7044, with the degree of coupling coordination expanding from 0.5232 to 0.8361, indicating an overall increasing trend. (2) Significant spatial disparities across the province were detected in the degree of coupling coordination of the WEF nexus. Cities such as Kaifeng, Zhengzhou, and Luoyang had greater degrees of WEF coupling coordination compared to other cities, while Jiyuan demonstrated the least degree of coordination. (3) GeoDetector exhibited that factors like education expenditure, arable land area, and population density individually exerted a strong influence on coupling coordination; the influence of two-factor combinations heightened this effect, and nonlinear relationships between factor pairs further increased the influence. This investigation offers a conceptual structure for planning and implementing high-quality development in the YRB in Henan Province, thus serving as an essential reference for local governmental decision making.

1. Introduction

Water, energy, and food systems are pivotal to human survival and progress [1]. These three systems are intrinsically interconnected, intertwining with ecosystems, societies, and economies in elaborate and multifaceted manners. Nonetheless, performing a quantitative appraisal of the water–energy–food (WEF) nexus poses a formidable challenge, especially at distinct spatial and temporal scales [2]. A change in one of the three systems will inevitably affect the other two; thus, a WEF nexus model is necessary to provide an all-encompassing view of the relationships between water, energy, and food, and to enable a unified analysis.
With China’s swift advancement in recent years, the demand for resources has dramatically escalated. Consequently, the conflicts surrounding the management of water, energy, and food systems have become increasingly pronounced. The Yellow River Basin (YRB), an integral region within the Belt and Road initiative’s infrastructure and a strategic area for China’s economic growth [3], warrants a meticulous and exhaustive examination of the WEF nexus. Such analysis is indispensable to comprehend and foster the synergy between the three systems.
Henan Province, witnessing the ascent of both entrenched and burgeoning industries, has led to a spike in water and energy demand. Therefore, it is crucial to orchestrate alterations within water, energy, and food systems in the province to rectify any disparities. Such coordination would augment the development of the WEF nexus, champion environmental protection, and ensure the high-quality cultivation of the YRB in Henan Province.
Researchers across the globe have extensively explored the WEF nexus over an extended period. Three current prominent research avenues are as follows. (1) The development and regulation of the WEF nexus: Fu et al. [4] scrutinized Heilongjiang Province, introducing a symbiosis framework and devising a composite regional WEF system to ascertain the degree of symbiosis for the years 2010–2019. Xu et al. [5] constructed a WEF nexus index to measure both the development level and the degree of coupling coordination between individual systems, further identifying potential enhancements. Zhang et al. [6] employed a geographically weighted regression model to empirically detect spatial and temporal characteristics and contributory factors of coupling coordination, estimating the degree of such coordination for the WEF nexus in China’s western region. (2) The security of the WEF nexus: Li et al. [7] targeted the middle and upper reaches of China’s Yellow River for a WEF–CSR (coupling security risk) conflict study, integrating copula risk assessment for probability determination. Ji et al. [8] devised a WEF nexus security evaluation index system through a pressure–state–response framework, utilizing set–pair analysis and variable fuzzy sets to gauge WEF nexus security in northwest China for 2010–2019. Raya-Tapia et al. [9] developed a WEF nexus index to assess water, energy, and food security, formulating a system of evaluative indicators to gauge the three individual systems’ security. Wang et al. [10] analyzed municipalities in Xinjiang, leveraging the real coding based on accelerating genetic algorithms (RAGA) with the projection pursuit evaluation (PPE) model to quantify WEF system security by examining coupling in the WEF nexus. (3) The sustainability of the WEF nexus: Sun et al. [11] fashioned a comprehensive index system to assess a sustainable WEF nexus, amalgamating a game theoretical empowerment method, an enhanced Technique for Order Preference by Similarity to Ideal Solution (TOPSIS) method with gray system correlation, and a coupled coordination model for a holistic assessment. The study quantified and evaluated the sustainability of 30 regional WEF couplings in China for 2010–2019, probing spatial and temporal variations in sustainable WEF linkages’ coupled coordination. Cansino-Loeza et al. [12] assessed the development of WEF nexus security using indexes of availability, accessibility, and sustainability in the study area over time, with the Mexican state of Sonora as an illustration. Sani et al. [13] executed a two-by-two comparison of water and energy, sanitation, and food accessibility at the local level in six sampled communities, employing nine sustainable development indicators to monitor progress toward sustainable development goals.
The majority of researchers, both domestically and internationally, have opted for the country, province, or an entire basin as the study area, with a limited focus on individual cities as subjects of research interest. Few have delved into the coordinated impact of the coupled water, energy, or food systems. In this investigation, the WEF nexus in the YRB in Henan Province was examined using data from 2006 to 2020, specific to Henan Province. Emphasis was placed on the basin within the province, determining index weights through a fusion of methodologies to model the WEF nexus in the basin as a conjunction of three distinct systems. The state of development for each system was quantified, identifying factors that influence the degree of coordination in the WEF nexus, thereby furnishing a foundational reference for social, economic advancement, and local governmental decision making.

2. Overview of the Study Area, Data Sources, and Research Methods

2.1. Overview of the Study Area

Henan Province (31°23′–36°22′ N, 110°21′–116°39′ E) encompasses the middle and lower reaches of the Yellow River and comprises four significant river basins: the Yangtze, Huai, Yellow, and Hai River basins. The province hosts nine cities within the YRB: Sanmenxia, Jiyuan, Luoyang, Zhengzhou, Jiaozuo, Xinxiang, Kaifeng, Anyang, and Puyang. Henan’s geography and climate lead to an uneven spatial distribution of precipitation across these cities. The province often grapples with natural disasters and is marked by a scarcity of total water resources.
Henan serves as a principal energy producer and consumer in China, with coal dominating both energy production and consumption for an extended period. Cities along the river basin exhibit high energy consumption, particularly in Zhengzhou, Luoyang, and Anyang. The potential for coal resource development is currently minimal, and the area that once exported coal has metamorphosed into a significant net importer [14].
Furthermore, Henan is a prominent agricultural production hub in China. The province’s total grain production surpasses the rest of the country, yielding 21.910 million tonnes of grain in the nine cities in 2020, accounting for 32.09% of the province’s total grain output. However, certain areas exhibit low levels of mechanization, and issues related to resource scarcity, environmental harm, and primitive, low value-added agricultural production methods persist [15].

2.2. Data Sources

Data to gauge the level of coordinated development in the WEF nexus within the study area were sourced from the China Statistical Yearbook, Henan Provincial Statistical Yearbook, Henan Provincial Water Resources Bulletin, the Statistical Yearbook of the nine cities in question, and the Water Resources Bulletin, spanning the period from 2007 to 2021.

2.3. Research Methods

2.3.1. Indicator System

Our approach took into account both the behavior of the WEF nexus and the empirical situation in the YRB in Henan Province. Water system indicators were chiefly selected for water resources and water usage, energy system indicators were selected for energy consumption and economic activity, and food system indicators were selected primarily for production volume and economic engagement. References to existing research [11,16,17] enabled the selection of widely recognized, commonly utilized indicators to compose three indicator systems, each comprising 9 indicators. Together, these systems comprehensively represent the developmental level of the three components forming the WEF nexus in the study region, cumulatively constituting the WEF degree of coupling coordination index system, as delineated in Table 1.

2.3.2. Indicator Weights

The entropy weight method [18] serves as an objective assignment procedure that calculates the weight value of each indicator by assessing the degree of internal difference in the observed value of each indicator. Employing the entropy weight method to determine weight primarily utilizes the utility value of each indicator to ascertain the weight magnitude. The analytic hierarchy process (AHP) [19], a subjective empowerment assessment method, systematically and simplistically decomposes decision-making-related elements into various levels, such as objectives, guidelines, and programs. Upon this foundation, both qualitative and quantitative analyses are conducted. By synergizing entropy weighting with the AHP, the weight of each evaluation index was determined [20,21,22]. These weights were amalgamated to furnish a comprehensive weighting that balanced subjective and objective assessments and redressed the imperfections and deficiencies in individual weightings, thereby enhancing the evaluation’s rationality [23]. This augmentation significantly bolstered the reliability of the final outcomes, conducted in two subsequent steps.
(1)
Normalize the initial data
For positive indicators:
X i j = x i j min x i j max x i j min x i j
and for negative indicators:
X i j = max x i j x i j max x i j min x i j
where Xij is the standardized indicator value of indicator j in year i; xij is the actual value of indicator j in year i; and max xij and min xij are, respectively, the maximum and minimum values of indicator j in year i.
(2)
Combine subjective and objective weights
The subjective weights obtained via the entropy method are denoted as wj [24,25,26], and the objective weights obtained by the hierarchical analysis method are denoted as cj [27,28]. The weights wj and cj were combined linearly to obtain the final weight, denoted as Q, where Q = acj + bwj; a and b denote the relative importance of the objective and subjective weights, and satisfy 0 ≤ a ≤ 1, 0 ≤ b ≤ 1 and a + b = 1. In this study, the objective and subjective weighting methods were equally important, so a and b were both 0.5 and Q = 0.5cj + 0.5wj. The weight of each indicator is shown in Table 1.

2.3.3. Comprehensive Evaluation Model

A comprehensive evaluation function was devised for the WEF nexus, grounded in the characteristic features stemming from the water resources, energy, and food systems. The model is structured as follows.
W w = i = 1 n α i w i E e = i = 1 n β i e i F f = i = 1 n γ i f i
where W(w), E(e), and F(f), are, respectively, the comprehensive evaluation indices of the water resources, energy, and food systems; αi, βi, and γi are the respective weights of each evaluation index in the system; wi, ei, and fi are the respective dimensionless values of each index; and n is the number of years over which the system is evaluated.

2.3.4. Coupling Coordination Degree Model and Type Classification

The WEF nexus unifies the three systems of water resources, energy, and food. A WEF nexus degree of coupling coordination model was formulated in light of existing research [29,30]:
C = 3 W w E e F f 3 W w + E e + F f
T = W w + E e + F f 3
D = C × T
In the model, C is the degree of coupling of the WEF nexus, T is the comprehensive evaluation index of the WEF nexus, and D is the degree of coupling coordination of the WEF nexus. C takes a value in the interval (0, 1], and a greater value of C indicates a greater degree of interaction between the three systems and a stronger correlation between them; on the other hand, a lower value of C indicates a lesser degree of interaction between the three systems and a weaker correlation. D also takes a value in the range (0, 1], and a greater value of D indicates greater coordination and a beneficial level of development among the three systems; a lower value of D indicates less synergy among the systems.
Technological development and economic development have both been rapid in recent years, and society now pays increasing attention to the protection of water resources. Demands for energy and food are also increasing. A focus only on the development of a single system is no longer enough to meet the current development needs, and, as we identified in our introduction, current research hotspots are composites of several subordinate systems. The analysis of interactions between systems requires specific criteria for judgment. The evaluation criteria that we chose were C (degree of coupling), T (comprehensive evaluation index), and D (degree of coupling coordination), which have been widely analyzed by researchers across the world. The degree of connection between system constituents and the benefits of interaction to the system as a whole can be judged more rapidly and more objectively.
We developed a classification of the coupling degree grounded on pertinent literature [31], as exhibited in Table 2. Additionally, the degree of coupling coordination was categorized, based on scholarly works, into 10 coordination categories [6,32], as illustrated in Table 3.

3. Results

3.1. Time Series Variation Characteristics

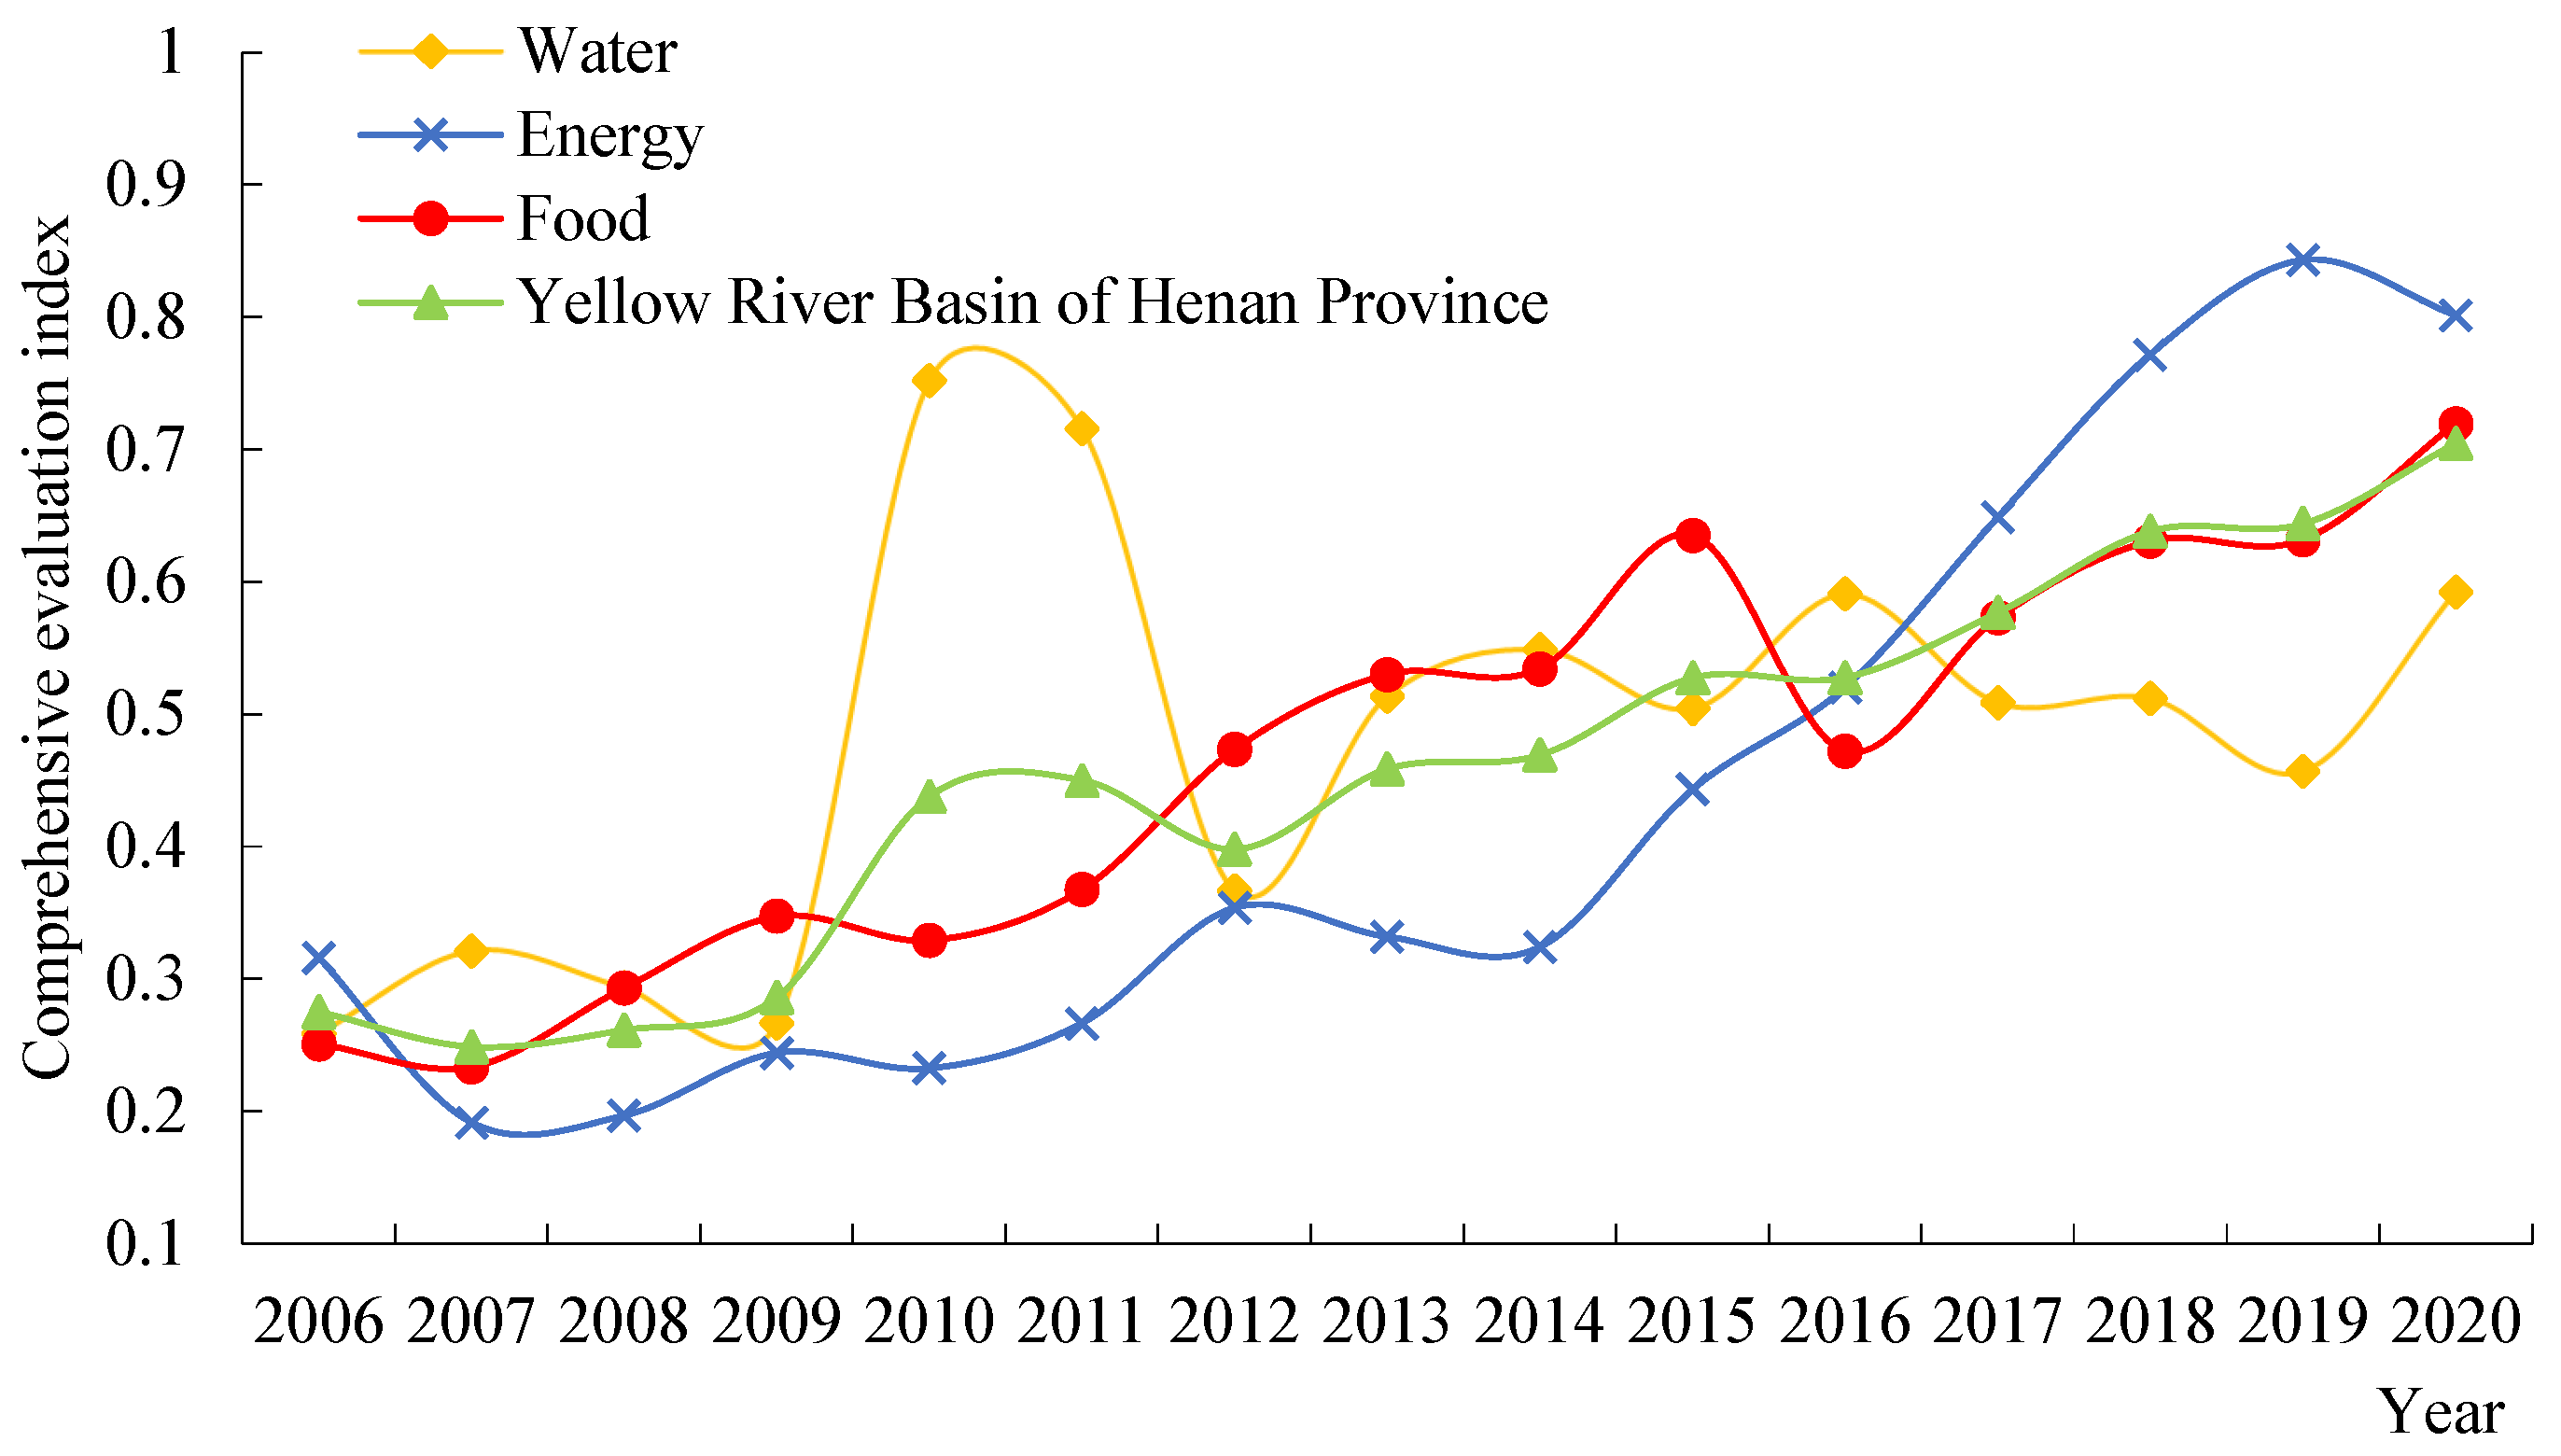
3.1.1. Time Series Change Characteristics of Comprehensive Evaluation Index

The comprehensive evaluation index (T) of each system within the WEF nexus was computed for each year spanning from 2006 to 2020 using the comprehensive evaluation model, as depicted in Figure 1.
Figure 1 illustrates that the comprehensive evaluation index for the WEF nexus fluctuated between 0.2488 and 0.7044 from 2006 to 2020, maintaining an approximately constant rate of increase.
The water resource system exhibited greater variability. During the period of 2007–2009, the evaluation index consistently declined from 0.3213 to 0.2669. The primary cause of this decline was a decrease in the per capita water resources of 6.98% from 2007, accompanied by a rise in the per capita water consumption of 7.30%. From 2009 to 2013, an N-shaped change trend was observed. In the span of 2009–2010, rainfall surged in the province, particularly in the central–eastern and southern regions during April and July, and September witnessed extensive heavy precipitation that surpassed historical maximums at several weather stations. Consequently, the per capita water resources swelled by 33.98% over the preceding year, causing the water resource system evaluation index to soar from 0.2669 to 0.7521. During 2010–2012, the index plummeted sharply, primarily due to successive years of varied drought severity and a continual decrease in precipitation. A rise in precipitation in 2013 led to an increased evaluation index of 0.5137. Throughout 2013–2020, the index wavered, bottoming at 0.4568 in 2019. This water resource system comprehensive evaluation index was principally driven by the average precipitation and per capita water resources, with respective decreases of 22.80% and 18.84% compared to 2018.
The energy system comprehensive evaluation index demonstrated an overall fluctuating upward trend. During the transition from the 11th Five-Year Plan to the 13th Five-Year Plan, adjustments to the provincial energy structure markedly yielded results, with the energy consumption per unit of gross domestic product consistently declining. Since the 13th Five-Year Plan, carbon dioxide emissions within the province have continually decreased, and the effectiveness of energy conservation and emission reduction has become more pronounced. Notable decreases in the comprehensive evaluation index of the energy system were recorded in 2007, 2014, and 2020, relative to the preceding years. Specifically, the index dipped from 0.3160 to 0.1916 during 2006–2007, when Henan Province’s total primary energy consumption far exceeded its production. The coal-centric energy consumption contributed to a rise in carbon dioxide emissions, and the average energy conservation and protection expenditure receded by 9.9% from 2006, even as raw coal (16.1%), coke consumption (20.0%), and diesel consumption (32.9%) all climbed from the previous year. In 2014, a slight decrease in the energy system comprehensive evaluation index was attributed to the waning coal market and chemical industry overcapacity. The pressure on energy industry operation intensified, and investment shrank by 18.7% compared with the previous year. In 2020, the index fell from 0.8431 to 0.8014, mainly on account of energy conservation and protection expenditures, which averaged at a 33.3% reduction compared to 2019.

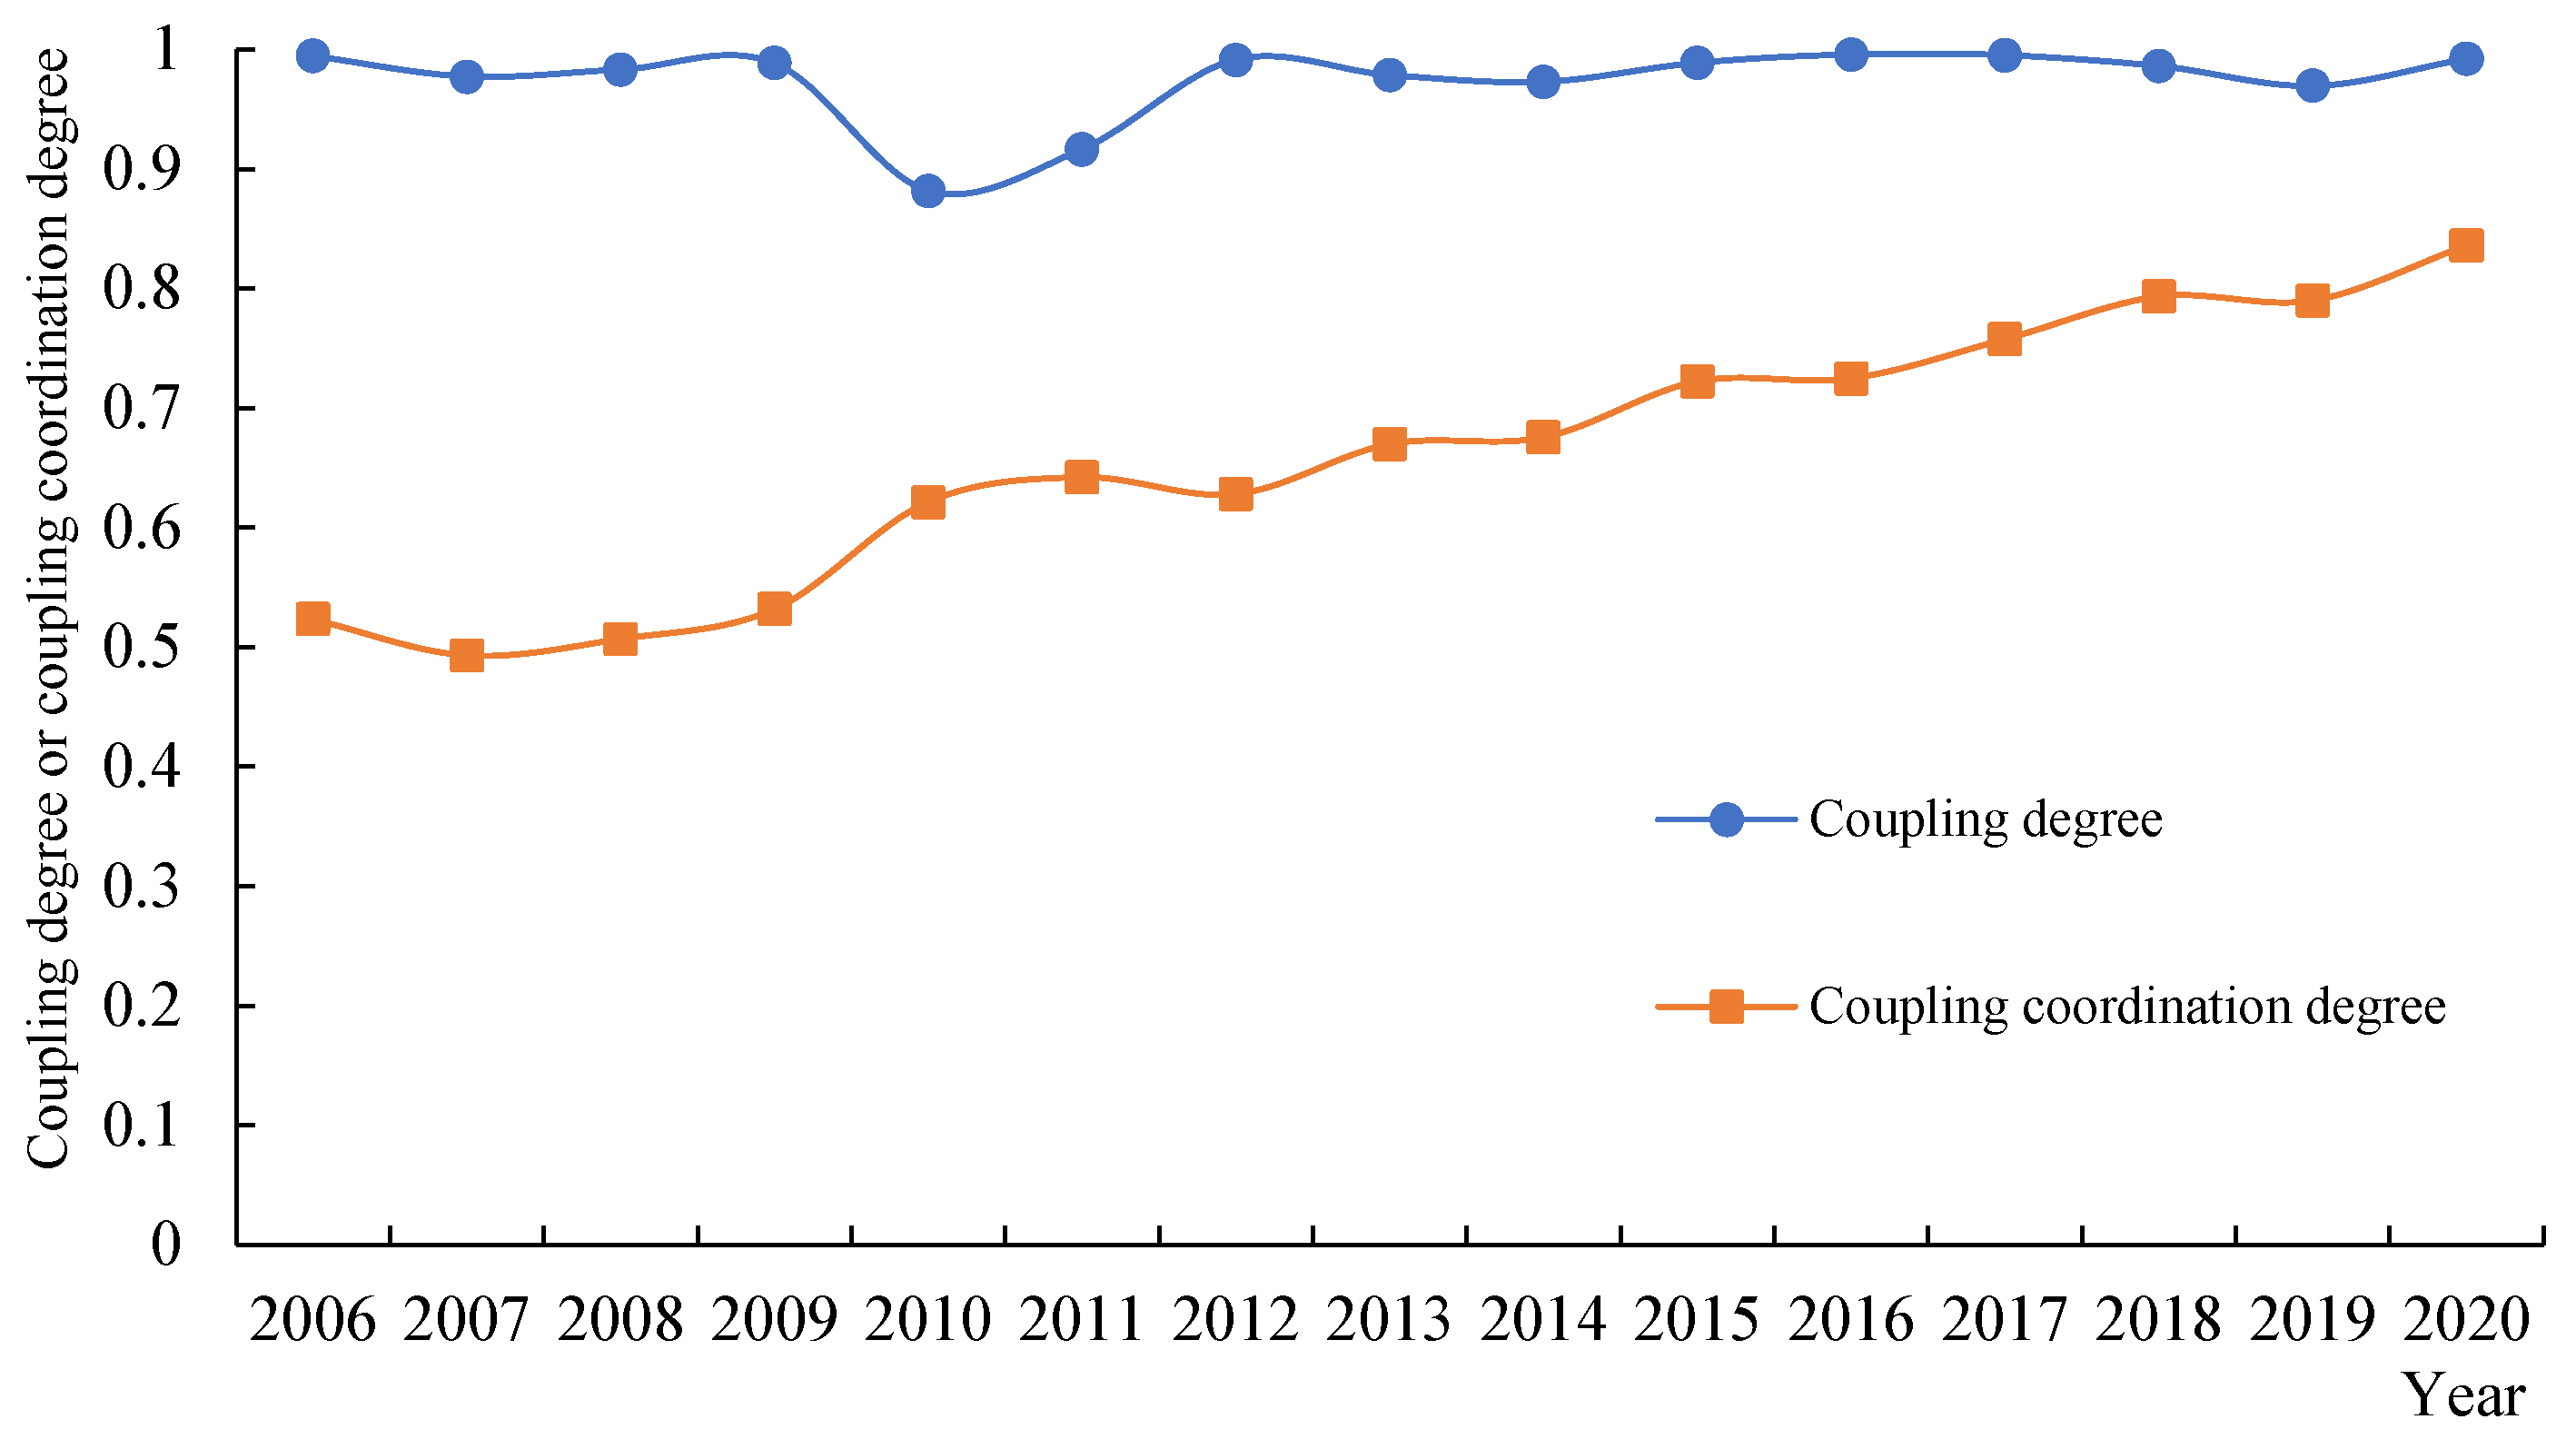
3.1.2. Time Series Variation Characteristics of Degree of Coupling and Degree of Coupling Coordination

The degree of coupling (C), degree of coupling coordination (D), and comprehensive evaluation index (T) of the WEF nexus for 2006–2020 were obtained using the degree of coupling model. The results are tabulated in Table 4. C and D were plotted as a line graph to facilitate the analysis of changes in their time series, as illustrated in Figure 2.
Figure 2 illustrates that the degree of coupling of the WEF nexus in the YRB in Henan Province from 2006 to 2020 spanned a range of 0.8817–0.9951, while the degree of coupling coordination fluctuated within the range of 0.5004–0.8189. The variations in both the degree of coupling and the degree of coupling coordination were minimal throughout these years.
Throughout the study period, the degree of coupling remained predominantly high, with the lowest value (0.8817) observed in 2010. This particular year saw Henan Province experiencing considerable precipitation, characterized by numerous heavy rainfall events and sustained periods of rainfall. Such weather conditions led to fluctuations in the water resource system and a subsequent decrease in interaction among the three systems. This phenomenon is reflected in the diminished degree of coupling in the WEF nexus. Meanwhile, the degree of coupling coordination progressively increased over the span of 2006–2020, reaching a peak in 2020. Thus, the coupling of the WEF nexus in the study area achieved a beneficial level and evolved in an orderly manner during these years.

3.2. Spatial Variation

3.2.1. Characteristics of Spatial Variation in the Comprehensive Evaluation Index

The spatial development of the degree of coupling coordination of the WEF nexus in the study area was examined by calculating the average value for each system and assessing the comprehensive evaluation index for each of the nine cities from 2006 to 2020, as depicted in Figure 3.
Figure 3 reveals that the average value of the WEF nexus comprehensive evaluation index for each city ranged from 0.3323 to 0.5814 for the given time frame. Sanmenxia boasted the highest average value of the water resource system comprehensive evaluation index (0.7367), whereas Puyang registered the lowest value (0.2022). Sanmenxia’s landscape, abundant water resources, sparse population, and compact land area contributed to a low average per capita water consumption from 2006 to 2020. Furthermore, its annual precipitation averaged 665.08 mm/y, the highest among the nine cities, explaining its supreme average value of per capita water resources. Puyang, a drier region of Henan Province, possesses relatively scant water resources, with an average annual precipitation of 527.53 mm/y over the studied period, the least among the cities.
Zhengzhou recorded the highest average value of the comprehensive evaluation index of the energy system for 2006–2020 (0.7510), and Jiyuan the lowest (0.2554). As the province’s most rapidly developing city and host to numerous industrial enterprises, Zhengzhou led in terms of enterprises, consuming over 10,000 tons of coal. The city also marked the most substantial average investment in the energy sector and exhibited high carbon emissions due to significant coal and electricity consumption. Since the inception of the national 12th Five-Year Plan, Zhengzhou has been at the forefront of promoting energy diversification, clean energy deployment, and energy reform. It also invested the most in energy conservation and protection among the nine cities. In contrast, Jiyuan, the smallest city in terms of both area and population, lagged in economic development and exhibited a sluggish growth in its energy system.
Kaifeng claimed the highest average comprehensive evaluation index for the food system from 2006 to 2020 (0.7599), and Sanmenxia the least (0.2309). Kaifeng also led in terms of the average multiyear value added for agriculture, forestry, fishery, and animal husbandry, and maintained a relatively high proportion of irrigated farmland area. Conversely, Sanmenxia struggled with limited arable land, challenging agricultural production conditions, and low levels of mechanization. Its average unit area grain yield was 3945.28 kg/ha, and its percentage of irrigated farmland area stood at 30.5%, both of which were the lowest among the nine cities.

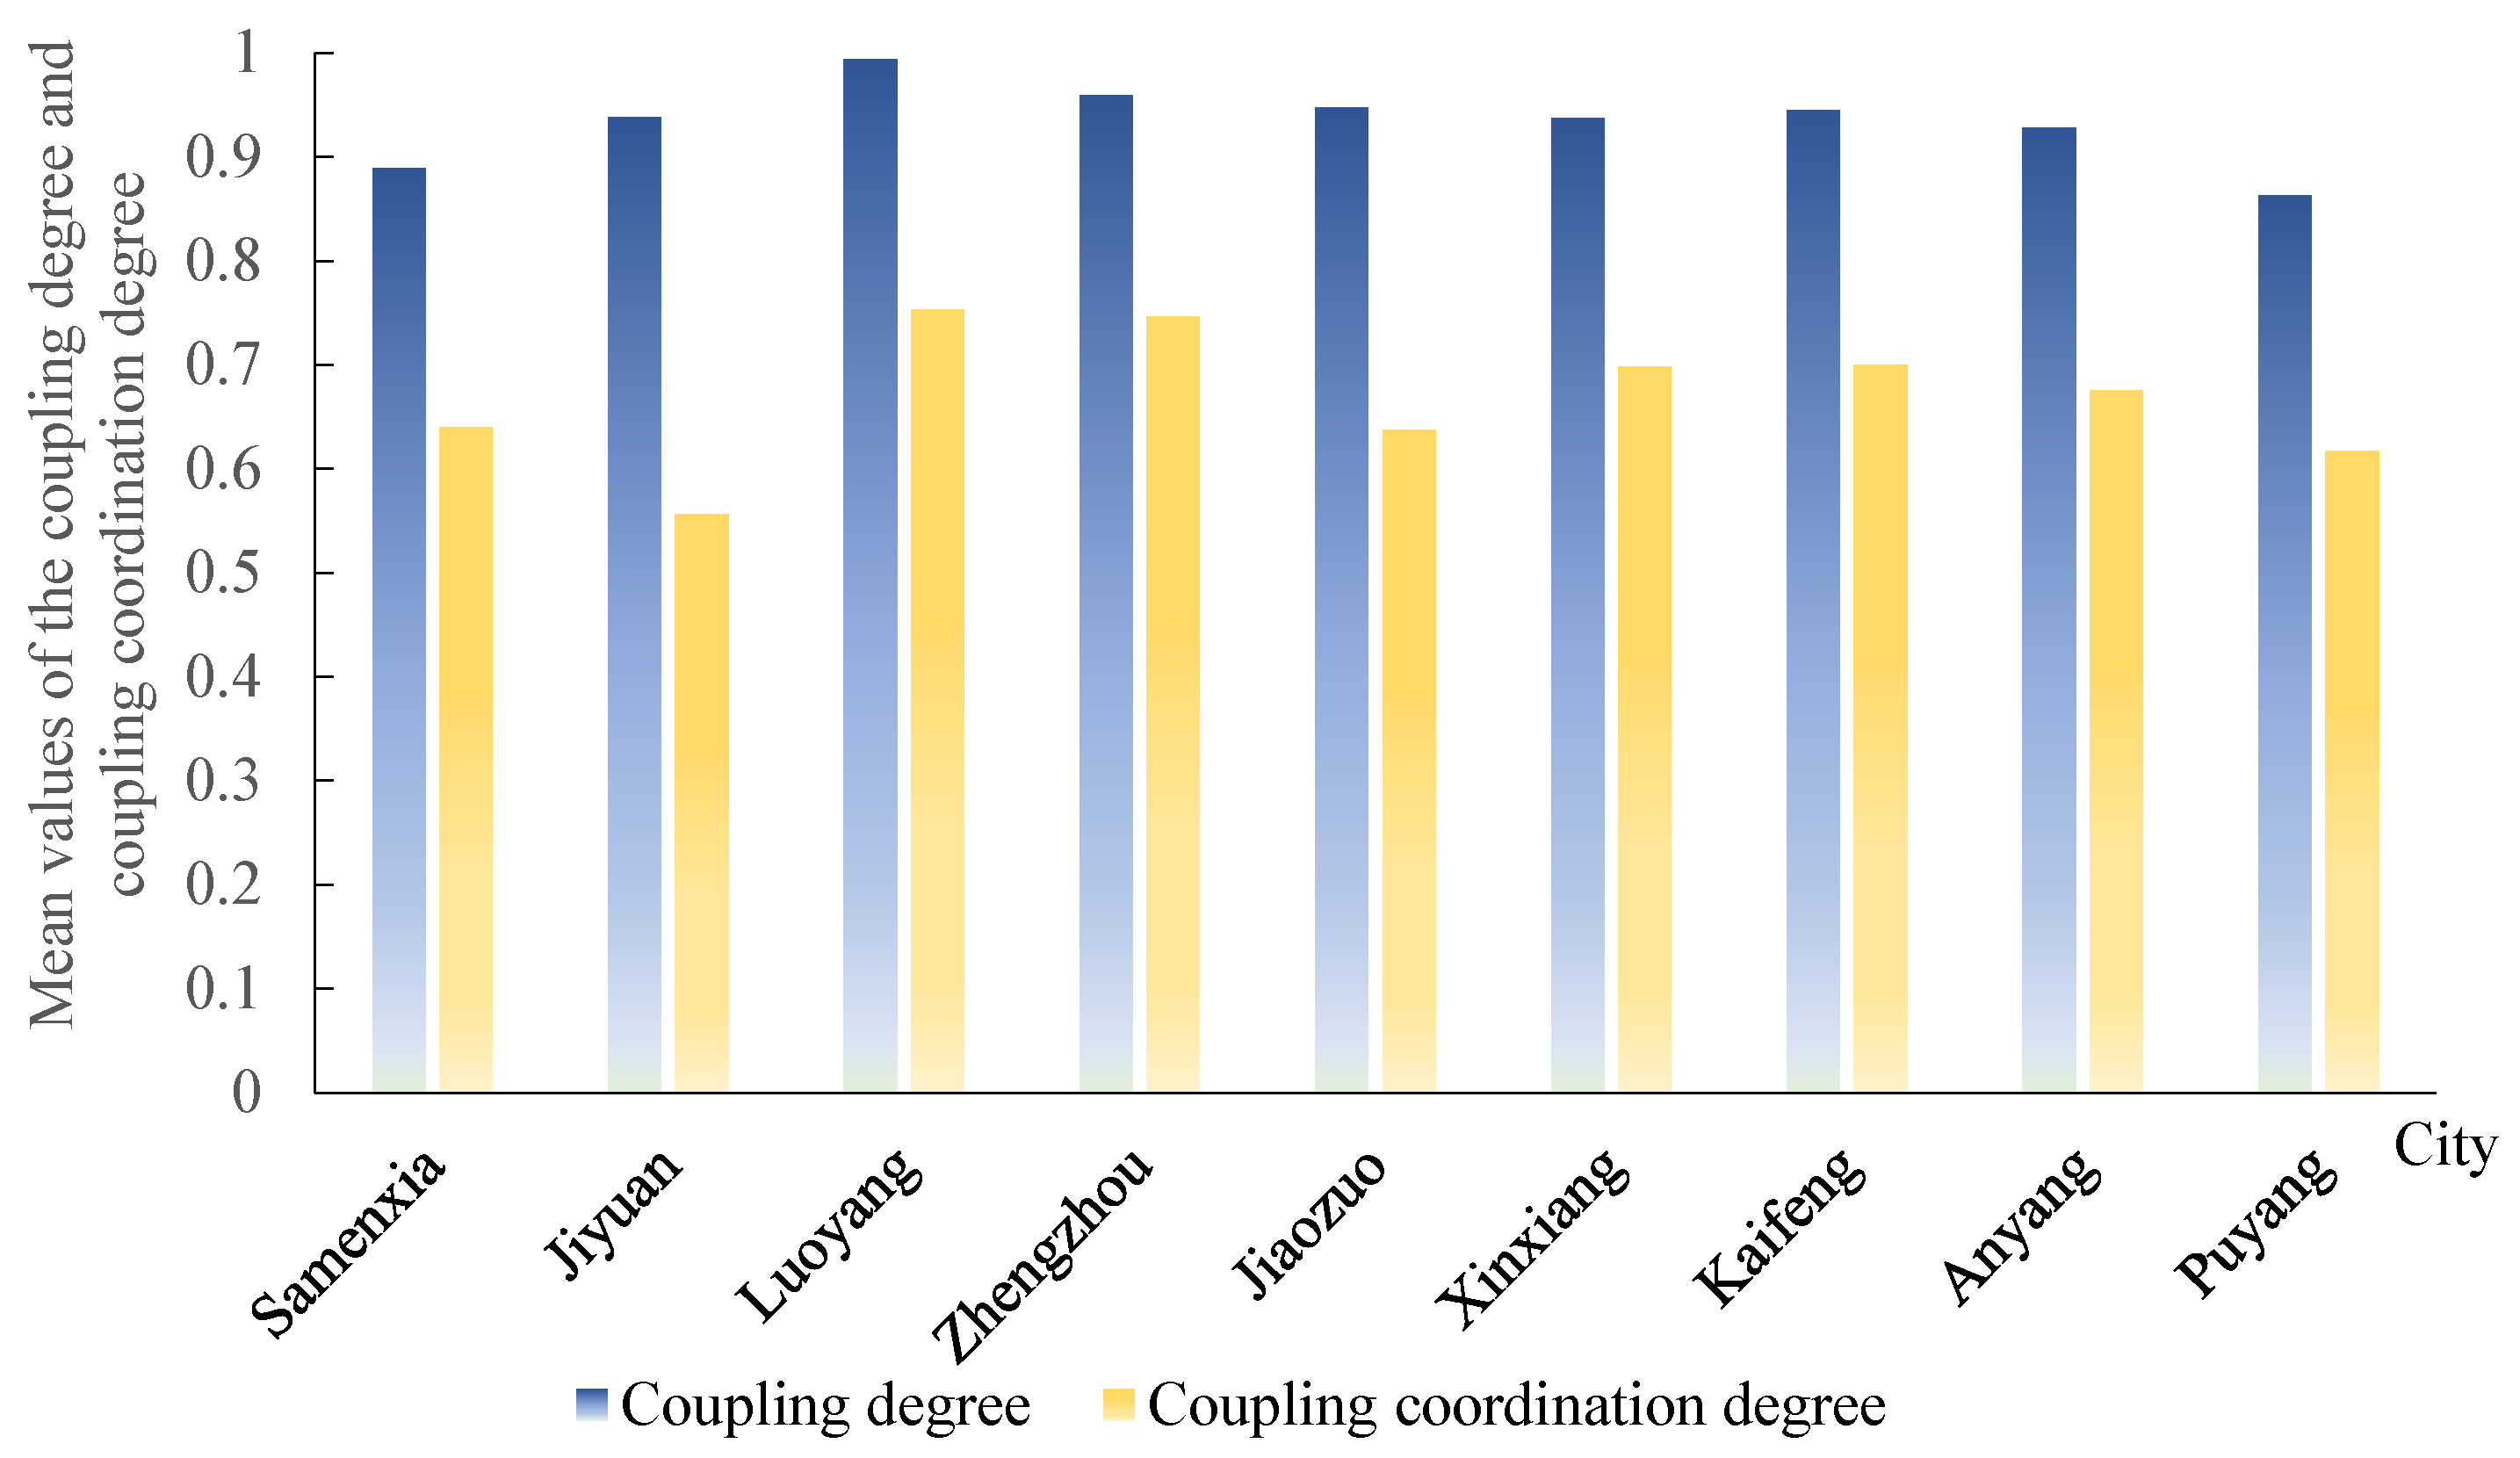
3.2.2. Characteristics of Spatial Variation in Degree of Coupling and Degree of Coupling Coordination

Figure 4 depicts the mean values of the degree of coupling and degree of coupling coordination for the nine cities from 2006 to 2020.
Overall, the mean value of the degree of coupling for all cities was relatively high, though the mean value of the degree of coupling coordination exhibited variations across the cities. Specifically, Luoyang (0.7530), Zhengzhou (0.7466), and Kaifeng (0.7003) demonstrated an intermediate level of coupling coordination. In contrast, Jiyuan, with the least mean value (0.5568), was barely coordinated, while the remaining cities showed primary coordination.
Luoyang, the second-largest city in Henan Province, benefits from abundant precipitation and ample water resources. Its three systems exhibited balanced development, leading to the highest mean degree of coupling coordination among the cities. Zhengzhou, the provincial capital and fastest-growing city, possesses a favorable geographical location and a robust energy industry. However, its food system lagged behind the other two systems, resulting in a mean degree of coupling coordination that ranked second to Kaifeng. The latter city, adjacent to Zhengzhou, experienced more rapid economic growth and ranked third in the mean degree of coupling coordination. Jiyuan was barely coordinated and ranked the lowest, mainly due to high coal consumption, an inefficient energy consumption profile, and backward energy systems.
The cities of Anyang, Xinxiang, Puyang, Sanmenxia, and Jiaozuo revealed variations across the three subsystems, with marked differences among them. The robust development of a single system did not offset the deficiencies in the other two systems. Thus, the degree of coupling coordination in these cities offers room for enhancement in the overall development of the WEF nexus.

4. Factors That Influence the Degree of Coordination in the WEF Nexus

4.1. GeoDetector

GeoDetector is a statistical tool designed to analyze spatial heterogeneity and pinpoint its underlying drivers. It was introduced by Wang et al. [33] in 2017 and it has gradually become a hot model studied by scholars in China in recent years, and it has appeared in many research fields. For example, Xu et al. [34]. explored the northern boundary of China’s terrestrial tropics based on GeoDetector; Wang et al. [35]. quantitatively attributed soil erosion in different geomorphological pattern type areas of karst based on GeoDetector; Li et al. [36]. discussed the spatial and temporal differentiation of urbanization in China from 2010 to 2020 and used GeoDetector to explore the influencing factors; Li et al. [37]. explored the spatio-temporal variation of biodiversity maintenance in the Yellow River Basin from 2000 to 2020 and investigated the influencing factors using a geoprobe; Li et al. [38]. analyzed the characteristics of the spatio-temporal evolution of ecosystem health in the Beijing–Tianjin–Hebei region and investigated the influencing factors based on a geoprobe; Wang et al. [39]. investigated the spatio-temporal evolution of ecosystem service value in the Liaohe River Delta over the past 30 years and analyzed the influencing factors using a geoprobe. Various studies based on GeoDetector can fully illustrate the maturity and reliability of the model. We used the factor detector and interaction detector components of GeoDetector.
The factor detector identifies spatial heterogeneity in the dependent variable and computes the extent to which the independent variable explains the dependent variable, expressed by the formula for q:
q = 1 1 N σ 2 h = 1 L N h σ h 2
The value of q is in the range [0, 1], and a higher value of q indicates a stronger explanatory power of the independent variable on the dependent variable; N is the number of cities in the study area; σ2 is the overall variance of the degree of coupled coordination of cities in the study area; h is the number of strata of the influence factor; Nh is the number of cities in stratum h; and σh2 is the variance of the dependent variable in stratum h.
The interaction detector identifies whether the interaction between the two factors increases or decreases the explanatory power on the dependent variable by calculating the magnitude of q values (q(x1), q(x2)) when the two influencing factors act on the dependent variable individually and when they act in concert (q(x1 ∩ x2)), and then comparing the two results. Interaction types are listed in Table 5.

4.2. Impact Factor Index System Construction

Changes in the degree of coupling coordination within the WEF nexus is a multifaceted process, shaped by various factors such as population, economy, environment, and more. Drawing from existing studies [40,41], we identified seven key influencing factors (as detailed in Table 5) and selected the years 2006, 2013, and 2020 as representatives for analysis. This analysis aimed to understand how these factors contributed to changes in the coupled coordination of the WEF nexus. Utilizing GeoDetector, we assessed the influence of each factor on system coupling, examining the degree of coupling coordination for the nine cities in the study area during the chosen years. The insights derived offer theoretical support for the rational allocation of resources and the formulation of regional policies. The following is a brief summary of the seven selected factors, organized in Table 6.

4.2.1. Population Density

Henan province is known for its high population density. An escalation in this density expedites the consumption of water, food, and energy, primarily impacting the coupling and coordination within the WEF nexus.

4.2.2. Urbanization Rate

An increase in urbanization signifies a surge in rural-to-urban migration. This shift fuels cities’ industrialization by providing substantial labor, consequently influencing the energy system. Simultaneously, a decrease in rural labor affects agricultural production efficiency, impacting both the food and water resource systems.

4.2.3. GDP per Capita

The interrelation between energy use and the economy is evident. Economic expansion often comes at the expense of energy consumption, and constraining energy use can hinder economic growth. Additionally, the potential environmental degradation due to economic growth necessitates a comprehension of its impact on the WEF nexus.

4.2.4. Green Coverage

Green or vegetation coverage is an indicator of regional environmental protection. Embracing the belief that “Clear water and green mountains are tantamount to mountains of gold and silver”, the attention to environmental preservation makes green coverage a relevant proxy for gauging environmental health in the context of the WEF nexus.

4.2.5. Environmental Water-Use Ratio

The cost of rapid technological and economic advancement is often a decline in environmental quality. As such, improving agricultural land’s irrigation coefficient and researching clean energy are integral to environmental protection. Therefore, the environmental aspects of water use play a crucial role in determining the WEF nexus’s coupling coordination.

4.2.6. Arable Land

Arable land, being directly utilized for crop growth, correlates closely with the food and water resource systems. Moreover, food production involves energy consumption, meaning that fluctuations in arable land area can significantly influence the coupling coordination of the WEF nexus.

4.2.7. Education Funding

Increased education funding promotes equitable access and quality in education. As education furnishes human resources for water, energy, and food development, as well as employment in related industrial and commercial sectors, an enhanced education level fosters individual literacy, environmental conservation, and a more efficient usage of water, energy, and food. This, in turn, has subsequent effects on the coupling coordination of the WEF nexus.
Table 6. Impact factor system of coupled coordination in the WEF nexus in the YRB in Henan Province.
Impact Factor Impact Factor CodeUnit
Population densityX1person/km2
Urbanization rateX2%
GDP per capitaX3yuan
Green coverageX4%
Environmental water-use ratioX5%
Arable landX6ha
Education fundingX7yuan

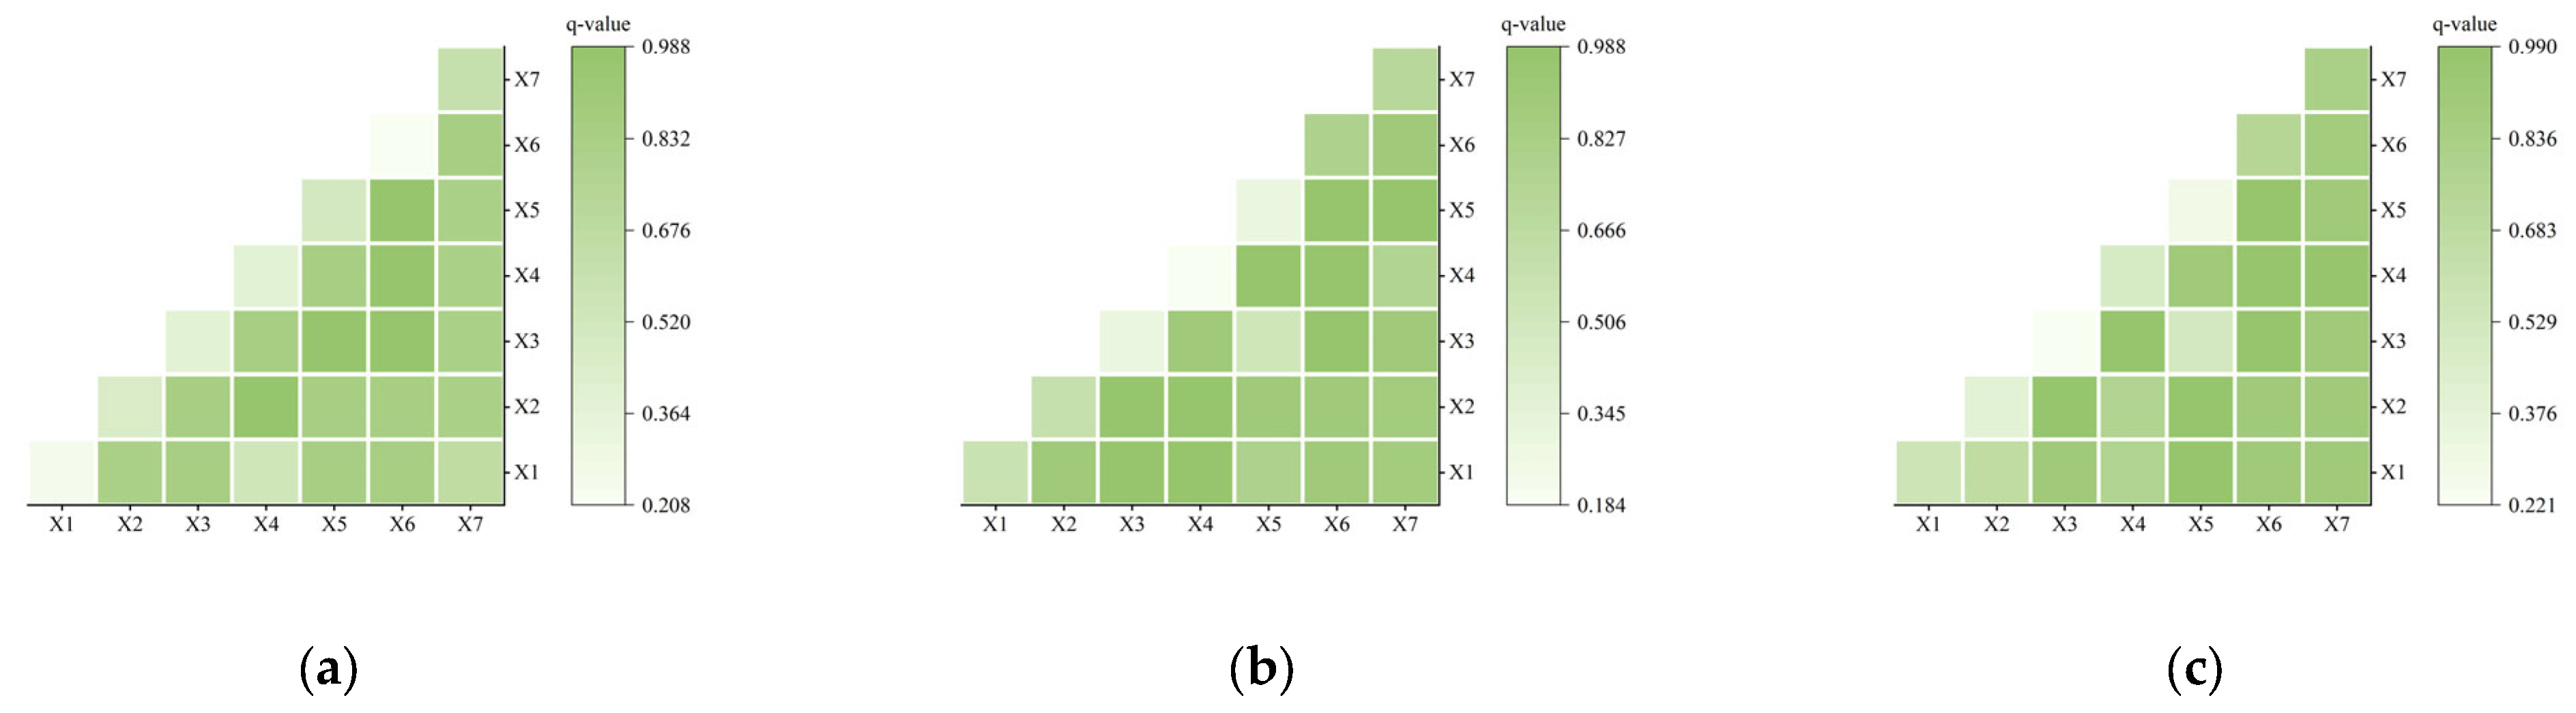
4.3. Detection Results and Analysis

The q values representing each influence factor for the selected years (2006, 2013, and 2020) were derived by incorporating the influence factors and degrees of coupling coordination for the nine cities, as detailed in Table 7. The interactions between the two factors and their corresponding q values are illustrated in Figure 5.
GeoDetector’s factor detection revealed that the q values associated with the same impact factor fluctuated annually. For 2006, the most significant explanatory impact factors were the environmental water-use ratio (X5) and education funding (X7). For 2013, the population density (X1), urbanization rate (X2), arable land (X6), and education funding (X7) had the highest explanatory power. For 2020, the population density (X1), arable land (X6), and education funding (X7) were the leading impact factors. Collectively, education funding (X7) demonstrated the strongest explanatory power, succeeded by arable land (X6) and population density (X1), with education funding (X7) consistently ranking among the top two throughout the study years. These findings underscore the paramount influence of education funding (X7) on the degree of coupling coordination within the WEF nexus. Arable land (X6) escalated from seventh place in 2006 to second in 2020, and population density (X1) advanced from sixth to third, highlighting the considerable impact these factors exert on the WEF nexus. Although the urbanization rate (X2) and environmental water-use ratio (X5) registered higher q values in one of the three years, the GDP per capita (X3) and green coverage (X4) remained at low levels throughout, signifying their weak influence on the WEF nexus’s coupling coordination.
Interaction detection within GeoDetector disclosed that interactions were generally two-factor strengthening or nonlinear strengthening (as shown in Table 5), indicative of the WEF nexus’s coupled coordination being modulated by the cumulative effects of diverse elements. Figure 5 elucidates that the interactions between the GDP per capita (X3) and arable land (X6), and between the ecological water-use ratio (X5) and arable land (X6), were among the top two across the three years. Additionally, the q values for interactions between factors such as population density (X1), urbanization rate (X2), ecological water use ratio (X5), and education funding (X7) augmented over time. Although the urbanization rate (X2) had a significant q value in only one year of the single-factor test, and GDP per capita (X3) consistently registered a low q value, their impact on the nexus’s coupling coordination amplified when in conjunction with other factors. The interplay between arable land (X6) and education expenditure (X7) also exhibited considerable explanatory power, congruent with the single-factor test findings. Thus, the complex multifactorial relationships profoundly shape the coupling coordination of the WEF nexus, demanding an intricate understanding of effective policymaking and resource management.

5. Discussion

The study revealed a gradual increase in the degree of coupling coordination of the WEF nexus within the study area from 2006 to 2020. Peng’s [17] research found that Henan Province was at the primary coordination stage during 2006–2015 and progressed to the intermediate–advanced stage in 2016–2020 for the WEF nexus. In our study, we identified the stages as being dysfunctional to being just barely coordinated during 2006–2009, having primary coordination from 2010 to 2014, and having intermediate to good coordination during 2015–2020.
Our findings are largely in alignment with Peng’s, except for the period of 2006–2009. This discrepancy mainly stemmed from variations in sample sizes and the employment of inter-provincial data. Xu et al. [42] examined WEF coupling mechanisms in the YRB and found the mean degree of coupling coordination to be 0.6900, and the mean degree of coupling to be 0.9750 in Henan Province for 2008–2018. Our corresponding values of 0.6613 and 0.9708 for the same timeframe were consistent with Xu et al.’s conclusions.
In determining the weights for each of the three WEF systems, we consulted the relevant literature [43,44,45]. This process must take into account any synergy in the system and the weighting of each system within the nexus. Li et al. [46] computed the weights through hierarchical analysis, while Wang et al. [47] recognized the need for weighting due to differences in coupled coordination. The method of weight assignment can significantly influence results; thus, finding an optimal, objective, and rational weight assignment remains an essential focus for future research.
Our study was constrained by limited time and data, allowing for analysis only in three distinct years and resulting in a small sample size. Future research should aim to expand the analysis to the county level, increasing the sample size for a more nuanced investigation.
The research area selected in this paper has not been studied before, so it can be used as a theoretical basis for urban policy making and resource regulation in the research area, to better utilize the inherent advantages of each city, to strengthen the communication and cooperation among cities in the basin, and to properly deal with the competitive and cooperative relationships in the basin.
Sustainable development encompasses the coordinated growth of society, the economy, the population, resources, and the environment, focusing on ecological sustainability, economic viability, and social advancement. This is predicated on the conservation of natural resources and the environment, driven by incentives for economic development, and aimed at enhancing human life quality. Water, energy, and food are vital resources for human survival, and the WEF nexus formed by these components relates directly to social, economic, demographic, and environmental facets. Advancing the level of WEF coupling contributes to water conservation, energy efficiency improvement, and increased food production, thereby supporting sustainable development. The WEF nexus in this study aligns with the United Nations Sustainable Development Goals (SDGs) on eradicating hunger, ensuring clean water and sanitation, and promoting affordable and clean energy. Exploring the WEF nexus furthers the realization of sustainable cities and communities, and can provide valuable theoretical insights and research directions for regions with similar geographical and resource conditions.

6. Conclusions

We conducted a detailed investigation into the temporal and spatial alterations in the degree of coupling (C), the degree of coupling coordination (D), and the comprehensive evaluation index (T) across nine cities within YRB in Henan Province from 2006 to 2020. This was achieved by devising an evaluative index system for the WEF nexus within the study area. Our analysis spanned various factors affecting system coupling and coupling coordination within a geographical context, leading to the following principal conclusions:
(1)
Overall trend analysis: The entire WEF nexus in the YRB in Henan Province manifested a general upward trend in the comprehensive evaluation index, punctuated by minor decreases in 2007 and 2012. Notably, fluctuations were more pronounced in the water resource system, and decreases in certain years tempered the overall coupling and coupled coordination of the system. Conversely, the energy and food systems’ comprehensive evaluation indexes demonstrated a fluctuating yet upward trajectory, with a narrower range of variation compared to the water resource system.
(2)
Developmental stages of coupling coordination (2006–2020): The time series analysis unveiled five developmental stages in the WEF nexus: near disorder, barely coordinated, primary coordination, intermediate coordination, and good coordination, with degrees of coupling coordination ranging from 0.4931 to 0.8361. Among the cities, Kaifeng, Zhengzhou, and Luoyang exhibited greater mean degrees of coupling coordination and achieved intermediate coordination. Jiyuan, however, was at the opposite end, demonstrating the lowest mean degree of coupling coordination, classifying it as barely coordinated. Variations among other cities were less pronounced but still discernible.
(3)
Geographical factors’ influence: Our geographical analysis identified seven pivotal factors. Among them, education funding, arable land, and population density were found to exert the most significant influence on coupling coordination. Conversely, the influence of environmental water use on coupling coordination diminished over the studied period, and the GDP per capita and green coverage had weak explanatory powers overall. Additionally, interaction detection revealed that the interactions between factors were characterized by two-factor increasing and nonlinear increasing patterns, thus signifying that the promotion of coupled coordination is contingent on the synergistic interplay between factors.

Author Contributions

Conceptualization, S.W.; Methodology, R.Y.; Formal analysis, A.W.; Investigation, S.S. and A.W.; Data curation, R.Y. and J.Y.; Writing—original draft, R.Y.; Writing—review & editing, S.W., S.S., T.L. and J.Y.; Supervision, A.W. and T.L.; Funding acquisition, S.W. All authors have read and agreed to the published version of the manuscript.

Funding

This research was funded by the General Project of National Natural Science Foundation of China (grant number 52079051); Key Scientific Research Project of Henan Province Colleges and Universities (grant number 22A570004 & 23A570006); Henan Provincial Science and Technology Plan Project (grant number 162102110130).

Institutional Review Board Statement

Not applicable.

Informed Consent Statement

Not applicable.

Data Availability Statement

Not applicable.

Conflicts of Interest

The authors declare no conflict of interest.

References

  1. Yin, D.; Yu, H.; Lu, Y.; Zhang, J.; Li, G. A Comprehensive Evaluation Framework of Water-Energy-Food System Coupling Coordination in the Yellow River Basin, China. Chin. Geogr. Sci. 2023, 33, 333–350. [Google Scholar] [CrossRef] [PubMed]
  2. Xu, P.; Wu, S.; Zhang, J.; Wu, X.; Jia, B.; Dai, J.; Yu, L.; Zhang, Y.; Qi, Y. Suitability Evaluation of the Water-Energy-Food System: A Case Study in Sichuan Province, China. Front. Environ. Sci. 2022, 10, 875458. [Google Scholar] [CrossRef]
  3. Zhao, L.; Liu, S.; Sun, C. Study on coupling and coordinated development of water-energy-food security system in the Yellow River Basin. Water Resour. Prot. 2021, 37, 69–78. [Google Scholar]
  4. Fu, Y.; Ren, Y.; Pei, W. Evaluation of the symbiosis level of the water-energy-food complex system based on the improved cloud model: A case study in Heilongjiang Province. Environ. Sci. Pollut. Res. 2023, 30, 22963–22984. [Google Scholar] [CrossRef] [PubMed]
  5. Xu, S.; He, W.; Shen, J.; Degefu, D.M.; Yuan, L.; Kong, Y. Coupling and coordination degrees of the core water–energy–food nexus in China. Int. J. Environ. Res. Public Health 2019, 16, 1648. [Google Scholar] [CrossRef] [PubMed]
  6. Zhang, N.; Yang, X.; Chen, T. Research on the coupling coordination of water-energy-food system and its temporal and spatial characteristics. China Environ. Sci. 2022, 42, 4444–4456. [Google Scholar]
  7. Li, W.; Jiang, S.; Zhao, Y.; Li, H.; Zhu, Y.; He, G.; Xu, Y.; Shang, Y. A copula-based security risk evaluation and probability calculation for water-energy-food nexus. Sci. Total Environ. 2023, 856, 159236. [Google Scholar] [CrossRef]
  8. Ji, J.; Chen, J.; Ding, T.; Gu, Y. Security assessment and obstacle factors diagnosis of water-energy-food nexus based on pressure-state-response framework in Northwest China. Stoch. Environ. Res. Risk Assess 2023, 37, 73–88. [Google Scholar] [CrossRef]
  9. Raya-Tapia, A.Y.; López-Flores, F.J.; Ponce-Ortega, J.M. Incorporating deep learning predictions to assess the water-energy-food nexus security. Environ. Sci. Policy 2023, 144, 99–109. [Google Scholar] [CrossRef]
  10. Wang, Y.; Pu, A.; Yan, X.; Sun, J. Comprehensive Evaluation of Water-Energy—Food Nexus Safety in Xinjiang. Trans. Chin. Soc. Agric. Mach. 2020, 51, 264–272. [Google Scholar]
  11. Sun, L.; Niu, D.; Yu, M.; Li, M.; Yang, X.; Ji, Z. Integrated assessment of the sustainable water-energy-food nexus in China: Case studies on multi-regional sustainability and multi-sectoral synergy. J. Clean. Prod. 2022, 334, 130235. [Google Scholar] [CrossRef]
  12. Cansino-Loeza, B.; Sánchez-Zarco, X.G.; Mora-Jacobo, E.G.; Saggiante-Mauro, F.E.; González-Bravo, R.; Mahlknecht, J.; Ponce-Ortega, J.M. Systematic approach for assessing the water–energy–food nexus for sustainable development in regions with resource scarcities. ACS Sustain. Chem. Eng. 2020, 8, 13734–13748. [Google Scholar] [CrossRef]
  13. Sani, Y.; Scholz, M. Water-energy-food accessibility and tracking progress towards achieving sustainable development goals in the Savannah region of Katsina State, Nigeria. Water 2021, 13, 3595. [Google Scholar] [CrossRef]
  14. Zhao, G.; Ye, X.; Liang, Z.; Zeng, W. Current situation of energy supply and demand and future coal supply and demand forecast in Henan Province. Coal Eng. 2022, 54, 180–185. [Google Scholar]
  15. Zhang, X. Exploration of the path of high-quality agricultural development in Henan Province under the double-loop pattern. Agric. Econ. 2021, 10, 16–18. [Google Scholar]
  16. Qin, T.; Tong, J.P. Spatiotemporal change of water- energy- food coupling efficiency and influencing factors in the Yangtze River Economic Belt. Resour. Sci. 2021, 43, 2068–2080. [Google Scholar] [CrossRef]
  17. Peng, J. Coupling Relationship and Spatial-Temporal Differentiation of the Water-Energy-Food Nexus in the Yellow River Basin. Reg. Econ. Rev. 2022, 2, 51–59. [Google Scholar]
  18. Li, H.; He, Y.; Bi, X. Coupling coordination relationship between ecological environment and high-quality development in Lanzhou section of Yellow River Basin. Arid. Land Geogr. 2022, 45, 1244–1253. [Google Scholar]
  19. Xia, H.; Liu, L.; Zhou, X.; Chen, K.; Li, Y.; Kuang, P.; Sun, G.; Lei, Y. Selection of Suitable Mosses for Bare Rock and Steep Slope Greening after Jiuzhaigou Earthquake Based on the Analytic Hierarchy Process. Bull. Bot. Res. 2023, 43, 540–549. [Google Scholar]
  20. Cai, F.; Hu, Z.; Jiang, B.; Ruan, W.; Cai, S.; Zou, H. Ecological Health Assessment with the Combination Weight Method for the River Reach after the Retirement and Renovation of Small Hydropower Stations. Water 2023, 15, 355. [Google Scholar] [CrossRef]
  21. Li, J.; Cheng, W.; Liang, M.; Yan, X.; Yang, J.; Zhang, Y.; Feng, L.; Tian, Y.; Xie, K. Comprehensive evaluation on sustainable development of China’s advanced coal to chemicals industry based on EWM-AHP. Chem. Ind. Eng. Prog. 2020, 39, 1329–1338. [Google Scholar]
  22. Cheng, Y.; Wang, J.; Shu, K. The coupling and coordination assessment of food-water-energy systems in China based on sustainable development goals. Sustain. Prod. Consum. 2023, 35, 338–348. [Google Scholar] [CrossRef]
  23. Liu, D.; Gong, W.; Xing, W.; Li, X.; Ma, X.; Yu, Y. Comprehensive method for determining the weights of vulnerability assessment indexes on islands and the coastal zone based on the AHP weight method and entropy weight method. Mar. Environ. Sci. 2015, 34, 462–467. [Google Scholar]
  24. Liang, Y.; Zhang, J.; Zhou, K. Study on driving factors and spatial effects of environmental pollution in the Pearl River-Xijiang River Economic Belt, China. Int. J. Environ. Res. Public Health 2022, 19, 6833. [Google Scholar] [CrossRef] [PubMed]
  25. Qu, W.; Lian, H.; Wang, Y.; Ma, Y. Spatiotemporal Evolution of the Coupling Coordination Relationship of “Population–Environment” Development in the Xi’an Metropolitan Area. Sustainability 2023, 15, 4533. [Google Scholar] [CrossRef]
  26. Liu, S.; Zhao, L. Development and synergetic evolution of the water–energy–food nexus system in the Yellow River Basin. Environ. Sci. Pollut. Res. 2022, 29, 65549–65564. [Google Scholar] [CrossRef] [PubMed]
  27. Ding, R.; Yu, K.; Fan, Z.; Liu, J. Study and Application of Urban Aquatic Ecosystem Health Evaluation Index System in River Network Plain Area. Int. J. Environ. Res. Public Health 2022, 19, 16545. [Google Scholar] [CrossRef]
  28. Wang, Y.; Du, P.; Liu, B.; Chen, C. Vulnerability assessment of coastal tourist attractions to oil spill stress based on a pressure-state-response framework: A case study of the Bohai Sea, China. Front. Mar. Sci. 2023, 10, 1155291. [Google Scholar] [CrossRef]
  29. Wang, S.; Kong, W.; Ren, L.; Zhi, D.; Dai, B. Research on misuses and modification of coupling coordination degree model in China. J. Nat. Resour. 2021, 36, 793–810. [Google Scholar] [CrossRef]
  30. Wang, L.; Hou, B.; Zhou, Y.; Chen, X.; Wang, X.; Huang, Y. Research on the coupling coordinative degree in urban water-energy-food system. Hydro Sci. Eng. 2021, 1, 9–17. [Google Scholar]
  31. Li, B.; Yan, J. Research on the Dynamic Coupling Coordinative Degree Among Water. Energy-Environment System in the Yellow River Basin. Yellow River 2022, 44, 59–63. [Google Scholar]
  32. Deng, P.; Chen, J.; Chen, D.; Shi, H.; Bi, B.; Liu, Z.; Yin, Y.; Cao, X. The evolutionary characteristics analysis of the coupling and coordination among water, energy and food: Take Jiangsu Province as an example. J. Water Resour. Water Eng. 2017, 28, 232–238. [Google Scholar]
  33. Wang, J.; Xu, C. Geodetector; Principle and prospective. Acta Geogr. Sin. 2017, 72, 116–134. [Google Scholar]
  34. Xu, Q.; Dong, Y.; Wang, Y.; Yang, R.; Xu, C. Determinants and identification of the northern boundary of China’s tropical zone. J. Geogr. Sci. 2018, 28, 31–45. [Google Scholar] [CrossRef]
  35. Wang, H.; Gao, J.; Hou, W. Quantitative attribution analysis of soil erosion in different geomorphological types in karst areas: Based on the geodetector method. J. Geogr. Sci. 2019, 29, 271–286. [Google Scholar] [CrossRef]
  36. Li, R.; Huang, X.; Liu, Y. Spatio-temporal differentiation and influencing factors of China’s urbanization from 2010 to 2020. Acta Geogr. Sin. 2023, 78, 777–791. [Google Scholar]
  37. Li, J.; Li, S.; Zhang, Y.; Pang, J. Spatio-temporal variation of biodiversity maintenance function and its driving factors in the Yellow River Basin from 2000 to 2020. China Environ. Sci. 2023, 1–11. [Google Scholar] [CrossRef]
  38. Li, K.; Wang, X.; Yao, L. Spatial-temporal Evolution of Ecosystem Health and Its Influencing Factors in Beijing-Tianjin-Hebei Region. Environ. Sci. 2023, 10, 1067835. [Google Scholar]
  39. Wang, G.; Zhang, F. Spatial and Temporal Evolution and Impact Factors Analysis of Ecosystem Service Value in the Liaohe River Delta over the Past 30 Years. Environ. Sci. 2023, 13, 1146. [Google Scholar]
  40. Wang, Z.; Tian, Y. Water-energy-food nexus and its influencing factors in China. South North Water Transf. Water Sci. Technol. 2022, 20, 243–252. [Google Scholar]
  41. Li, C.; Zhang, S. Chinese provincial water-energy-food coupling coordination degree and influencing factors research. China Popul. Resour. Environ. 2020, 30, 120–128. [Google Scholar]
  42. Xu, H.; Wang, Y.; Zhang, Z.; Gao, Y.; Zhang, D. Coupling mechanism of water-energy-food and spatiotemporal evolution of coordinated development in the Yellow River Basin. Resour. Sci. 2021, 43, 2526–2537. [Google Scholar] [CrossRef]
  43. Wang, Y.; Song, J.; Sun, H. Coupling interactions and spatial equilibrium analysis of water-energy-food in the Yellow River Basin, China. Sustain. Cities Soc. 2023, 88, 104293. [Google Scholar] [CrossRef]
  44. Dong, Q.; Zhong, K.; Liao, Y.; Xiong, R.; Waang, F.; Pang, M. Coupling coordination degree of environment, energy, and economic growth in resource-based provinces of China. Resour. Policy 2023, 81, 103308. [Google Scholar] [CrossRef]
  45. Jing, P.; Hu, T.; Sheng, J.; Mahmoud, A.; Liu, Y.; Yang, D.; Guo, L.; Li, M.; Wu, Y. Coupling coordination and spatiotemporal dynamic evolution of the water-energy-food-land (WEFL) nexus in the Yangtze River Economic Belt, China. Environ. Sci. Pollut. Res. 2023, 30, 34978–34995. [Google Scholar] [CrossRef] [PubMed]
  46. Li, P.; Yang, G.; Li, X.; Yang, M.; Chen, D.; Wang, J. Safety evaluation of water resources-eco-economic complex system in ManasRiver Basin. J. Shihezi Univ. Nat. Sci. 2018, 36, 95–101. [Google Scholar]
  47. Wang, Y.; Chen, X.; Sun, P.; Liu, H.; He, J. Spatial-temporal Evolution of the Urban-rural Coordination Relationship in Northeast China in 1990–2018. Chin. Geogr. Sci. 2021, 31, 429–443. [Google Scholar] [CrossRef]
Figure 1. Comprehensive evaluation indexes of the WEF constituent systems and the WEF nexus for the YRB in Henan Province for the years 2006–2020.
Sustainability 15 13977 g001
Figure 2. Degree of coupling and degree of coupling coordination of the WEF nexus in the YRB in Henan Province, 2006–2020.
Sustainability 15 13977 g002
Figure 3. Average values of the comprehensive evaluation index of each system for the nine cities in the YRB in Henan Province and for the WEF nexus during 2006–2020. (a) Water resource system. (b) Energy system. (c) Food system. (d) WEF nexus.
Sustainability 15 13977 g003
Figure 4. Mean values of the degree of coupling and the degree of coupling coordination of the nine cities in the YRB in Henan Province during 2006–2020.
Sustainability 15 13977 g004
Figure 5. Two-factor interactions for coupling coordination in the YRB in Henan Province for 2006, 2013, and 2020. (a) 2006. (b) 2013. (c) 2020.
Sustainability 15 13977 g005
Table 1. Comprehensive index system of the WEF nexus in the YRB in Henan Province.
System Indicator Unit Weight Attribute
Water Precipitation amount mm 0.0712 +
Per capita water consumption m3 person−1 0.1437
Per capita water resources m3 0.1604 +
Sewage treatment rate % 0.0659 +
Percentage of water used in agriculture % 0.1254
Percentage of industrial water use % 0.088
Proportion of urban and rural living environment water % 0.1913 +
Water resources modulus Million m3/km2 0.072 +
Water consumption of RMB 10,000 gross domestic product (GDP) m3/million yuan 0.0822
Energy Energy industry investment volume Million yuan 0.1704 +
Energy conservation and protection expenditure Million yuan 0.1794 +
Raw coal consumption Ten thousand tons 0.1277
Coke consumption Ten thousand tons 0.0646
Diesel consumption Ten thousand tons 0.0689
Carbon dioxide emissions Ten thousand tons 0.1167
Energy consumption per unit of GDP Ton of standard coal/million yuan 0.0868
Electricity consumption of the entire society Billion kWh 0.1301 +
Energy consumption per unit of industrial added value Ton of standard coal/million yuan 0.0555
Food Agricultural machinery power Million kWh 0.1061 +
Per capita food production kg/person 0.1463 +
Grain production per unit area kg/ha 0.1431 +
Grain sown area Thousand ha 0.1538 +
Proportion of effective irrigated area on farmland % 0.1297 +
Fertilizer load t/ha 0.0944
Value added of agriculture, forestry, animal husbandry, and fishery Billion 0.0629 +
Agricultural value added Billion 0.0879 +
Food consumer price index % 0.0758
“+” represents a positive indicator, i.e., the larger the value of the indicator, the better; “−“ represents a negative indicator, i.e., the smaller the value of the indicator, the better.
Table 2. Degree of coupling classification.
Degree of Coupling Category (C) Degree of Coupling Descriptor
(0, 0.3] Low-level coupling
(0.3, 0.5] Fly down coupling
(0.5, 0.8] Breaking in coupling
(0.8, 1.0] High-level coupling
Table 3. Classification of coupling coordination.
Degree of Coupling Coordination Descriptor Degree of Coupling Coordination Category (D) Type of Coupling Coordination
Dysfunctional decay (0, 0.10] Extremely dysfunctional recession
(0, 0.20] Severe dysregulation recession
(0.20, 0.30] Moderate dysregulation recession
(0.30, 0.40] Mild dysregulation recession
Transition (0.40, 0.50] On the verge of dysfunctional recession
(0.50, 0.60] Barely coordinated development
Coordinated development (0.60, 0.70] Primary coordination development
(0.70, 0.80] Intermediate coordination development
(0.80, 0.90] Good coordination development
(0.90, 1.00] Quality coordinated development
Table 4. WEF nexus degree of coupling, degree of coupling coordination, and comprehensive evaluation index, 2006–2020.
YearDegree of Coupling (C)Comprehensive Evaluation Index (T)Degree of Coupling Coordination (D)Qualitative Degree of CouplingQualitative Degree of Coupling Coordination
20060.99470.27520.5232High-level couplingBarely coordinated
20070.97730.24880.4931High-level couplingOn the verge of disorder
20080.98320.26130.5068High-level couplingBarely coordinated
20090.98860.28620.5319High-level couplingBarely coordinated
20100.88170.43790.6214High-level couplingPrimary coordination
20110.91650.45000.6422High-level couplingPrimary coordination
20120.99140.39790.6281High-level couplingPrimary coordination
20130.97860.45850.6699High-level couplingPrimary coordination
20140.97290.46910.6756High-level couplingPrimary coordination
20150.98880.52750.7222High-level couplingIntermediate coordination
20160.99580.52770.7249High-level couplingIntermediate coordination
20170.99510.57680.7576High-level couplingIntermediate coordination
20180.98610.63810.7933High-level couplingIntermediate coordination
20190.96960.64390.7901High-level couplingIntermediate coordination
20200.99230.70440.8361High-level couplingGood coordination
Table 5. Classification of interaction types.
Judgment CriteriaInteraction Type
q x 1 x 2 < M i n q x 1 , q x 2 Nonlinear, weakening
M i n q x 1 , q x 2 < q x 1 x 2 < M a x q x 1 , q x 2 Single factor, nonlinear, weakening
q x 1 x 2 > M a x q x 1 , q x 2 Two-factor, strengthening
q x 1 x 2 = M a x q x 1 , q x 2 Independent
q x 1 x 2 > q x 1 + q x 2 Nonlinear, strengthening
Table 7. The q values of coupling coordination factors in the YRB in Henan Province for 2006, 2013, and 2020.
2006 2013 2020
Impact Factor q Value Impact Factor q Value Impact Factor q Value
X1 0.250 X1 0.574 X1 0.574
X2 0.455 X2 0.602 X2 0.380
X3 0.373 X3 0.296 X3 0.222
X4 0.373 X4 0.185 X4 0.491
X5 0.509 X5 0.306 X5 0.296
X6 0.209 X6 0.778 X6 0.750
X7 0.607 X7 0.708 X7 0.824
Disclaimer/Publisher’s Note: The statements, opinions and data contained in all publications are solely those of the individual author(s) and contributor(s) and not of MDPI and/or the editor(s). MDPI and/or the editor(s) disclaim responsibility for any injury to people or property resulting from any ideas, methods, instructions or products referred to in the content.

