Article

Course Prophet: A System for Predicting Course Failures with Machine Learning: A Numerical Methods Case Study

by
Isaac Caicedo-Castro
SOCRATES Research Team, Department of Systems and Telecommunications Engineering, Faculty of Engineering, University of Córdoba, Montería 230002, Colombia
Sustainability 2023, 15(18), 13950; https://doi.org/10.3390/su151813950
Submission received: 28 July 2023 / Revised: 3 September 2023 / Accepted: 5 September 2023 / Published: 20 September 2023
(This article belongs to the Special Issue Educational Intelligence and Emerging Educational Technology)

Abstract

:
In this study, our purpose was to conceptualize a machine-learning-driven system capable of predicting whether a given student is at risk of failing a course, relying exclusively on their performance in prerequisite courses. Our research centers around students pursuing a bachelor’s degree in systems engineering at the University of Córdoba, Colombia. Specifically, we concentrate on the predictive task of identifying students who are at risk of failing the numerical methods course. To achieve this goal, we collected a dataset sourced from the academic histories of 103 students, encompassing both those who failed and those who successfully passed the aforementioned course. We used this dataset to conduct an empirical study to evaluate various machine learning methods. The results of this study revealed that the Gaussian process with Matern kernel outperformed the other methods we studied. This particular method attained the highest accuracy (80.45%), demonstrating a favorable trade-off between precision and recall. The harmonic mean of precision and recall stood at 72.52%. As far as we know, prior research utilizing a similar vector representation of students’ academic histories, as employed in our study, had not achieved this level of prediction accuracy. In conclusion, the main contribution of this research is the inception of the prototype named Course Prophet. Leveraging the Gaussian process, this tool adeptly identifies students who face a higher probability of encountering challenges in the numerical methods course, based on their performance in prerequisite courses.

1. Introduction and Background

In this study, our goal was to conceive an intelligent system that predicts whether a given student is at risk of failing the Numerical Methods course before the lectures commence, based on the students’ performance in prerequisite courses.
Predicting whether a given student is at risk of failing a specific course in a bachelor’s degree program enables all stakeholders, including students, lecturers, academic policymakers, and others, to take precautions and prevent unsatisfactory performance or course dropouts. By implementing these precautions effectively, students can avoid psychological issues, frustration, and financial loss.
Motivated by the goal of preventing students from facing the unpleasant and undesirable consequences of failing a course, prior research focused on identifying students at risk of course failure. Machine learning, particularly classification methods (i.e., a type supervised learning approaches), has gained widespread adoption in these studies.
Various classifiers have been adopted, including:
  • artificial neural networks or multilayer perceptron [1,2,3,4,5,6];
  • support vector machines [1,2,6,7];
  • logistic regression [2,6,7,8];
  • decision trees [2,6,7,8],
  • ensemble methods with different classification methods [1,4];
  • random forest [2,3,4,6],
  • gradient boosting [3]; extreme gradient boosting (XGBoost) [3,4,6];
  • variants of gradient boosting [3,7], namely CatBoost [9] and LightGBM [10]; and
  • Gaussian processes for classification [6].
Much of the prior research in this domain has concentrated on online courses [1,2,4,5,8], namely computer networking and web design [1], mathematics [8], and STEM (science, technology, engineering, and mathematics) in general [5]. In these studies, the notion of "failing" encompasses both dropping out of the course and not successfully passing it. Notably, the primary aim of these research endeavors is not to predict the risk of failure before students commence their courses; instead, their focus lies in forecasting risk during the course development phase. The forecast relies on students’ activities, such as, the number of course views; content downloads; and grades achieved in assignments, tests, quizzes, projects, and so forth.
Nonetheless, the paramount importance of early prediction cannot be overstated. An anticipatory forecast empowers stakeholders with the insight necessary to formulate strategies and effectively mitigate the risk of course failure. Thus, the most favorable scenario involves identifying students at risk of failing a course prior to its initiation.
In contrast to the studies mentioned earlier, in [3,6], the goal was to forecast students’ risk of failure prior to the course beginning, using their grades in prerequisite courses. In [3], grades were represented as ordinal data rather than quantitative data, and students’ ages were also used for prediction in addition to grades. In [6], the predictive input variables encompassed scores in the admission test and grades in prerequisite courses. Notably, this latter work was dedicated to the Numerical Methods course within the bachelor’s degree program of Systems Engineering at the University of Córdoba in Colombia. In the present paper, we have achieved enhanced results in comparison to the findings published in [6].
In [6], following the assessment of multiple machine learning methods via 10-fold cross-validation (10FCV), the optimal mean values for accuracy, precision, recall, and harmonic mean ( F 1 ) stood at 76.67%, 71.67%, 51.67%, and 57.67%, respectively. In the present study, we expanded our dataset and conducted a similar evaluation using 10FCV across various methods. The outcomes demonstrated notable advancements, with the highest mean values for accuracy, precision, recall, and harmonic mean ( F 1 ) reaching 80.45%, 83.33%, 66.5%, and 72.52%, respectively.
In both our study and in [6], it is taken into consideration that, across a wide spectrum of bachelor’s degree programs, courses are deliberately structured and scheduled into semesters, with the complexity gradually increasing over time. Initially, foundational subjects are introduced, establishing the groundwork for more advanced topics in subsequent semesters. This course progression model introduces the concept of "prerequisite courses", where the successful completion of specific courses is imperative for progressing to more advanced ones. For instance, a student who faces challenges in passing the differential calculus course may encounter difficulties in the numerical methods course, as the latter builds upon the foundational concepts established in the former.
The interaction between course dynamics and the findings elucidated in [6], where the anticipation of course failure risk was predicated based on students’ academic background and admission test results, has spurred our exploration of the following research question: Can an intelligent system proficiently learn patterns within a students’ academic history to predict, solely based on their performance in prerequisite courses, whether a given student is susceptible to course failure? As far as we know, this question has not been investigated in prior research.
The contributions of our study are as follows:
(i)
A larger dataset was employed in the current study compared to the one utilized in [6]. Our dataset comprises 103 instances, each characterized by 39 variables. Among these, 38 variables serve as independent variables, while one serves as the target variable. In contrast, the dataset used in [6] consists of 56 instances, representing a subset of our expanded dataset.
(ii)
The conceptualization of an intelligent system named Course Prophet, which harnesses Gaussian processes for classification. This innovative system predicts the probability of a student failing the numerical methods course given their performance in prerequisite courses, such as, e.g., calculus, physics, computer programming, and so forth. To the best of our knowledge, prior research employing a similar vector representation of students’ academic histories, as utilized in our study, had not achieved such a high level of forecasting accuracy in Course Prophet.
(iii)
The outcomes of an extensive experimental evaluation that reveal the superior performance of Gaussian processes compared to support vector machines, decision trees, and other machine learning methods. This evaluation demonstrates the effectiveness of our approach in predicting the risk of course failure for individual students.
The remainder of this paper is outlined as follows: In Section 2, we present the evaluation method adopted in this study; delve into the details of input variable representation; and present the assumptions, limitations, dataset collection, and the machine learning methods evaluated. In addition, we describe the nuts and bolts of the Course Prophet system. Section 3 explains the experimental setting and provides a detailed analysis of the evaluation conducted of the machine learning methods. Finally, we conclude the paper in Section 4.

2. Methods

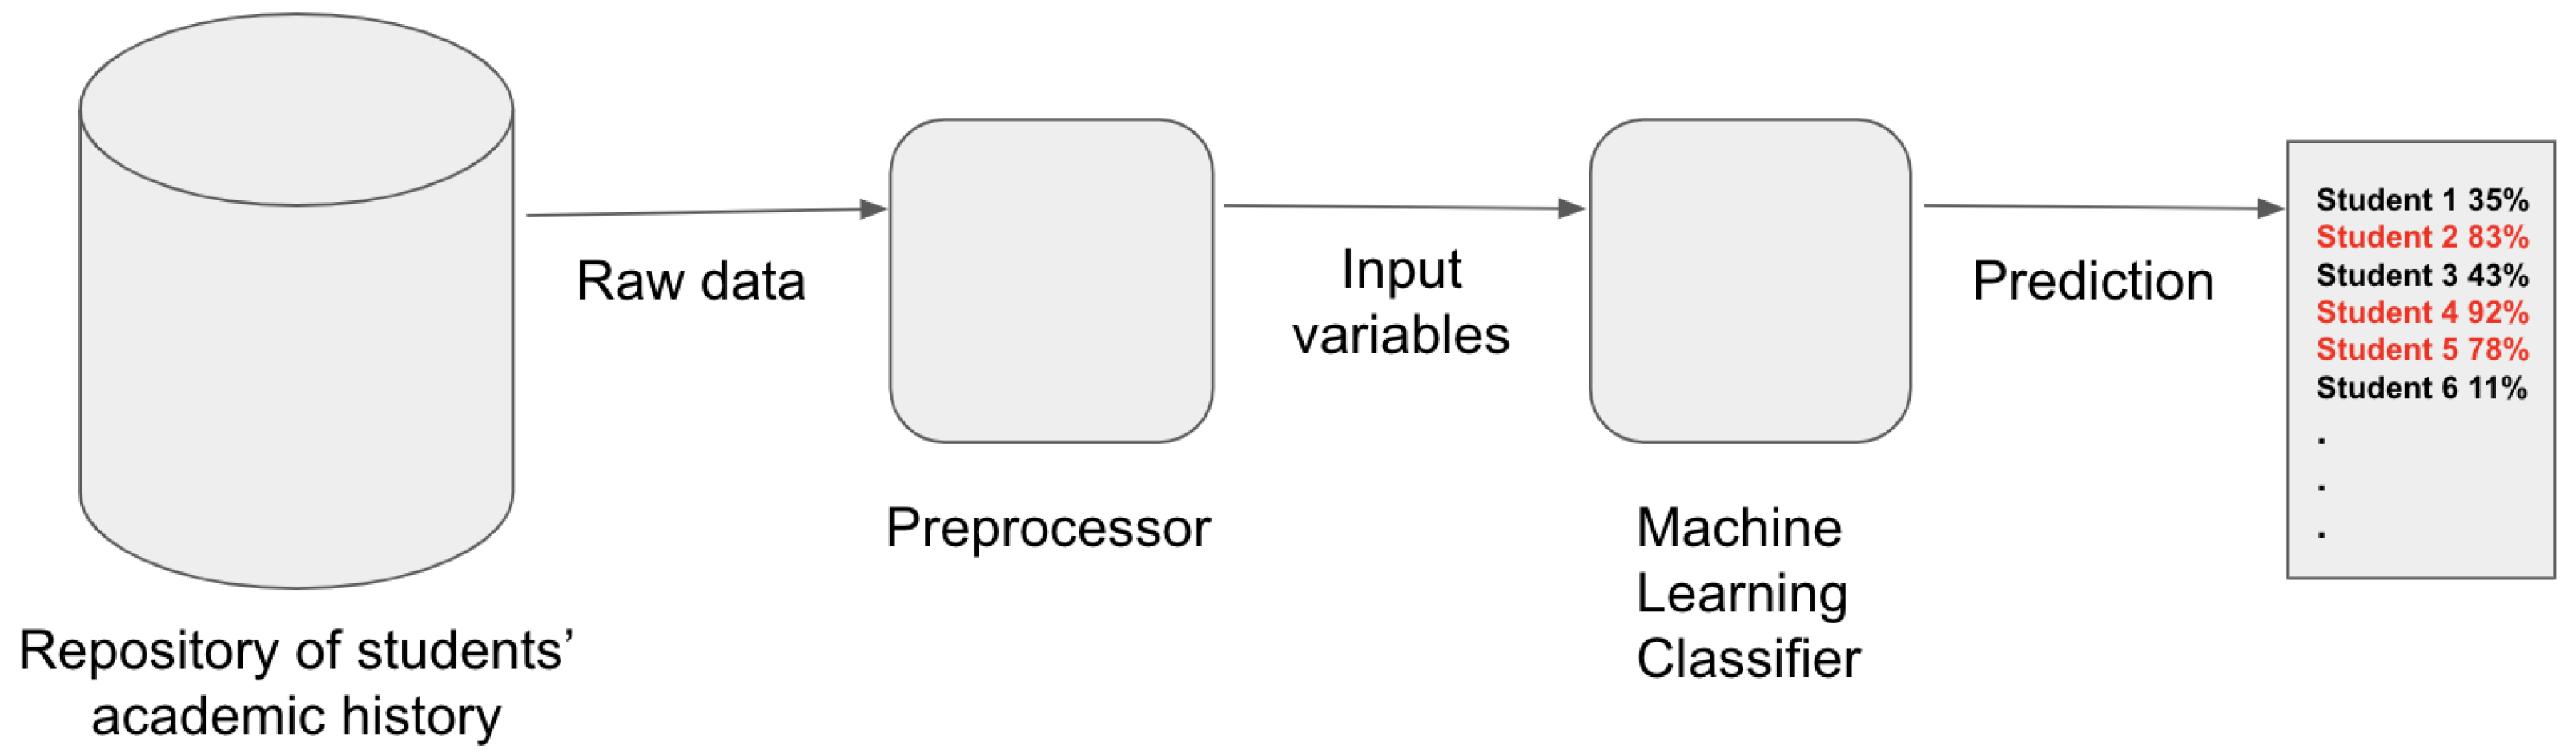
To achieve the goal of this study, which involved conceptualizing an intelligent system for predicting the risk of students failing the numerical methods course, we employed machine learning techniques. In this pursuit, we extended the dataset used in [6] by conducting a survey among students pursuing a bachelor’s degree in systems engineering at the University of Córdoba in Colombia, a public university. The students’ provided data were anonymized to ensure their privacy, and only their grades were considered, omitting any personal identifiers, such as identification numbers, names, gender, and economic stratum.
We leveraged the dataset to identify the most suitable machine learning method to address the problem and to be integrated into the intelligent system. To this end, we conducted an assessment of several machine learning methods using K-fold cross-validation (KFCV). This methodology allowed us to systematically evaluate each method K times, utilizing K distinct sets of training and test datasets. In our evaluation, we opted for K to be 10, aligning with the choice made in [6]. This selection facilitated direct comparison with the findings of the aforementioned study.
The purpose of the evaluation was twofold: to select the most effective machine learning method, and to determine the optimal hyper-parameter settings (e.g., regularization parameter for multilayer perceptrons and logistic regression).

2.1. Representation of the Input Variables

To address our research inquiry, we extended our research beyond [6] and sustained our investigation into the pivotal numerical methods course, which is an integral element of the curriculum. This course’s theoretical and practical dimensions are intricately intertwined with foundational subjects such as calculus, physics, and computer programming. Our specific focus on this course aimed to unveil the intricate relationships between students’ performance in prerequisite courses and their vulnerability to failure in a subsequent course. The predictive capacity of our intelligent system endeavors to provide indispensable insights, guiding academic interventions and fostering student success.
Grades are a pivotal indicator of students’ academic performance, and Colombian universities adhere to a grading system that spans from 0 to 5 for students enrolled in bachelor’s degree programs. Typically, a course is considered passed if a student attains a final grade higher than 3. In our specific research context, the University of Córdoba enforces a minimum global average grade of 3.3, as outlined in Article 16 of the university’s official student code [11]. Furthermore, the university’s regulations, particularly Article 28, establish additional policies concerning student retention for those whose global average grade falls below the aforementioned 3.3 threshold. These policies serve as essential guidelines for maintaining academic standards and ensuring students’ progress and success.
Therefore, students who attain a global average grade ranging between 3 and 3.3 find themselves in an academic probationary status. To retain their student standing, they must elevate their grade to at least 3.3 in the subsequent semester, as stipulated in Article 16 of the student code [11]. Failure to meet this requirement could lead to their dismissal from the university. Furthermore, if a student’s global average grade falls below 3, automatic withdrawal from the university ensues. The prospect of losing student status due to academic performance is a pressing concern, commonly referred to as student dropout.
While students’ grades serve as a measure of their performance in each course, the number of semesters a student attends a particular course offers insights into its level of challenge for them. Therefore, for each prerequisite course, our prediction model incorporates three pivotal input variables: (i) the number of semesters the student has been enrolled in the course, (ii) the highest final grade achieved during the semesters the student attended the course, and (iii) the lowest final grade received while the student was enrolled in the course for at least one semester.
We represent these variables for each prerequisite course using a multidimensional real-valued vector. Consequently, the ith student is represented by a D-dimensional vector x i X , with its components corresponding to the above-mentioned variables. Herein, X = { x | x R D 0 x j 5 , for all j = 1 , , D } . In our context, D = 33 as we have ten prerequisite courses, and three variables are linked with each course. Each component of the vector x i represents a specific input variable, as follows:
  • x i 1 represents the highest final grade obtained by a student in the calculus I course;
  • x i 2 denotes the number of semesters a student has enrolled in the calculus I course;
  • x i 3 represents the lowest final grade earned by a student in the calculus I course;
  • x i 4 represents the highest final grade obtained by a student in the calculus II course;
  • x i 5 denotes the number of semesters a student has enrolled in the calculus II course;
  • x i 6 represents the lowest final grade earned by a student in the calculus II course;
  • x i 7 represents the highest final grade obtained by a student in the calculus III course;
  • x i 8 denotes the number of semesters a student has enrolled in the calculus III course;
  • x i 9 represents the lowest final grade earned by a student in the Calculus III course;
  • x i , 10 represents the highest final grade obtained by a student in the linear algebra course;
  • x i , 11 denotes the number of semesters a student has enrolled in the linear algebra course;
  • x i , 12 represents the lowest final grade earned by a student in the linear algebra course;
  • x i , 13 represents the highest final grade obtained by a student in the physics I course;
  • x i , 14 denotes the number of semesters a student has enrolled in the physics I course;
  • x i , 15 represents the lowest final grade earned by a student in the physics I course;
  • x i , 16 represents the highest final grade obtained by a student in the physics II course;
  • x i , 17 denotes the number of semesters a student has enrolled in the physics II course;
  • x i , 18 represents the lowest final grade earned by a student in the physics II course;
  • x i , 19 represents the highest final grade obtained by a student in the physics III course;
  • x i , 20 denotes the number of semesters a student has enrolled in the physics III course;
  • x i , 21 represents the lowest final grade earned by a student in the physics III course;
  • x i , 22 represents the highest final grade obtained by a student in the introduction to computer programming course;
  • x i , 23 denotes the number of semesters a student has enrolled in the introduction to computer programming course;
  • x i , 24 represents the lowest final grade earned by a student in the introduction to computer programming course;
  • x i , 25 represents the highest final grade obtained by a student in the computer programming I course;
  • x i , 26 denotes the number of semesters a student has enrolled in the computer programming I course;
  • x i , 27 represents the lowest final grade earned by a student in the computer programming I course;
  • x i , 28 represents the highest final grade obtained by a student in the computer programming II course;
  • x i , 29 denotes the number of semesters a student has enrolled in the computer programming II course;
  • x i , 30 represents the lowest final grade earned by a student in the computer programming II course;
  • x i , 31 represents the highest final grade obtained by a student in the computer programming III course;
  • x i , 32 denotes the number of semesters a student has enrolled in the computer programming III course;
  • x i , 33 represents the lowest final grade earned by a student in the computer programming III course.
It is noteworthy that, out of the available 38 variables, we opted to use 33 in our study. This decision stemmed from our research’s exclusive emphasis on students’ performance in prerequisite courses, leading us to exclude admission-related variables from our input set.
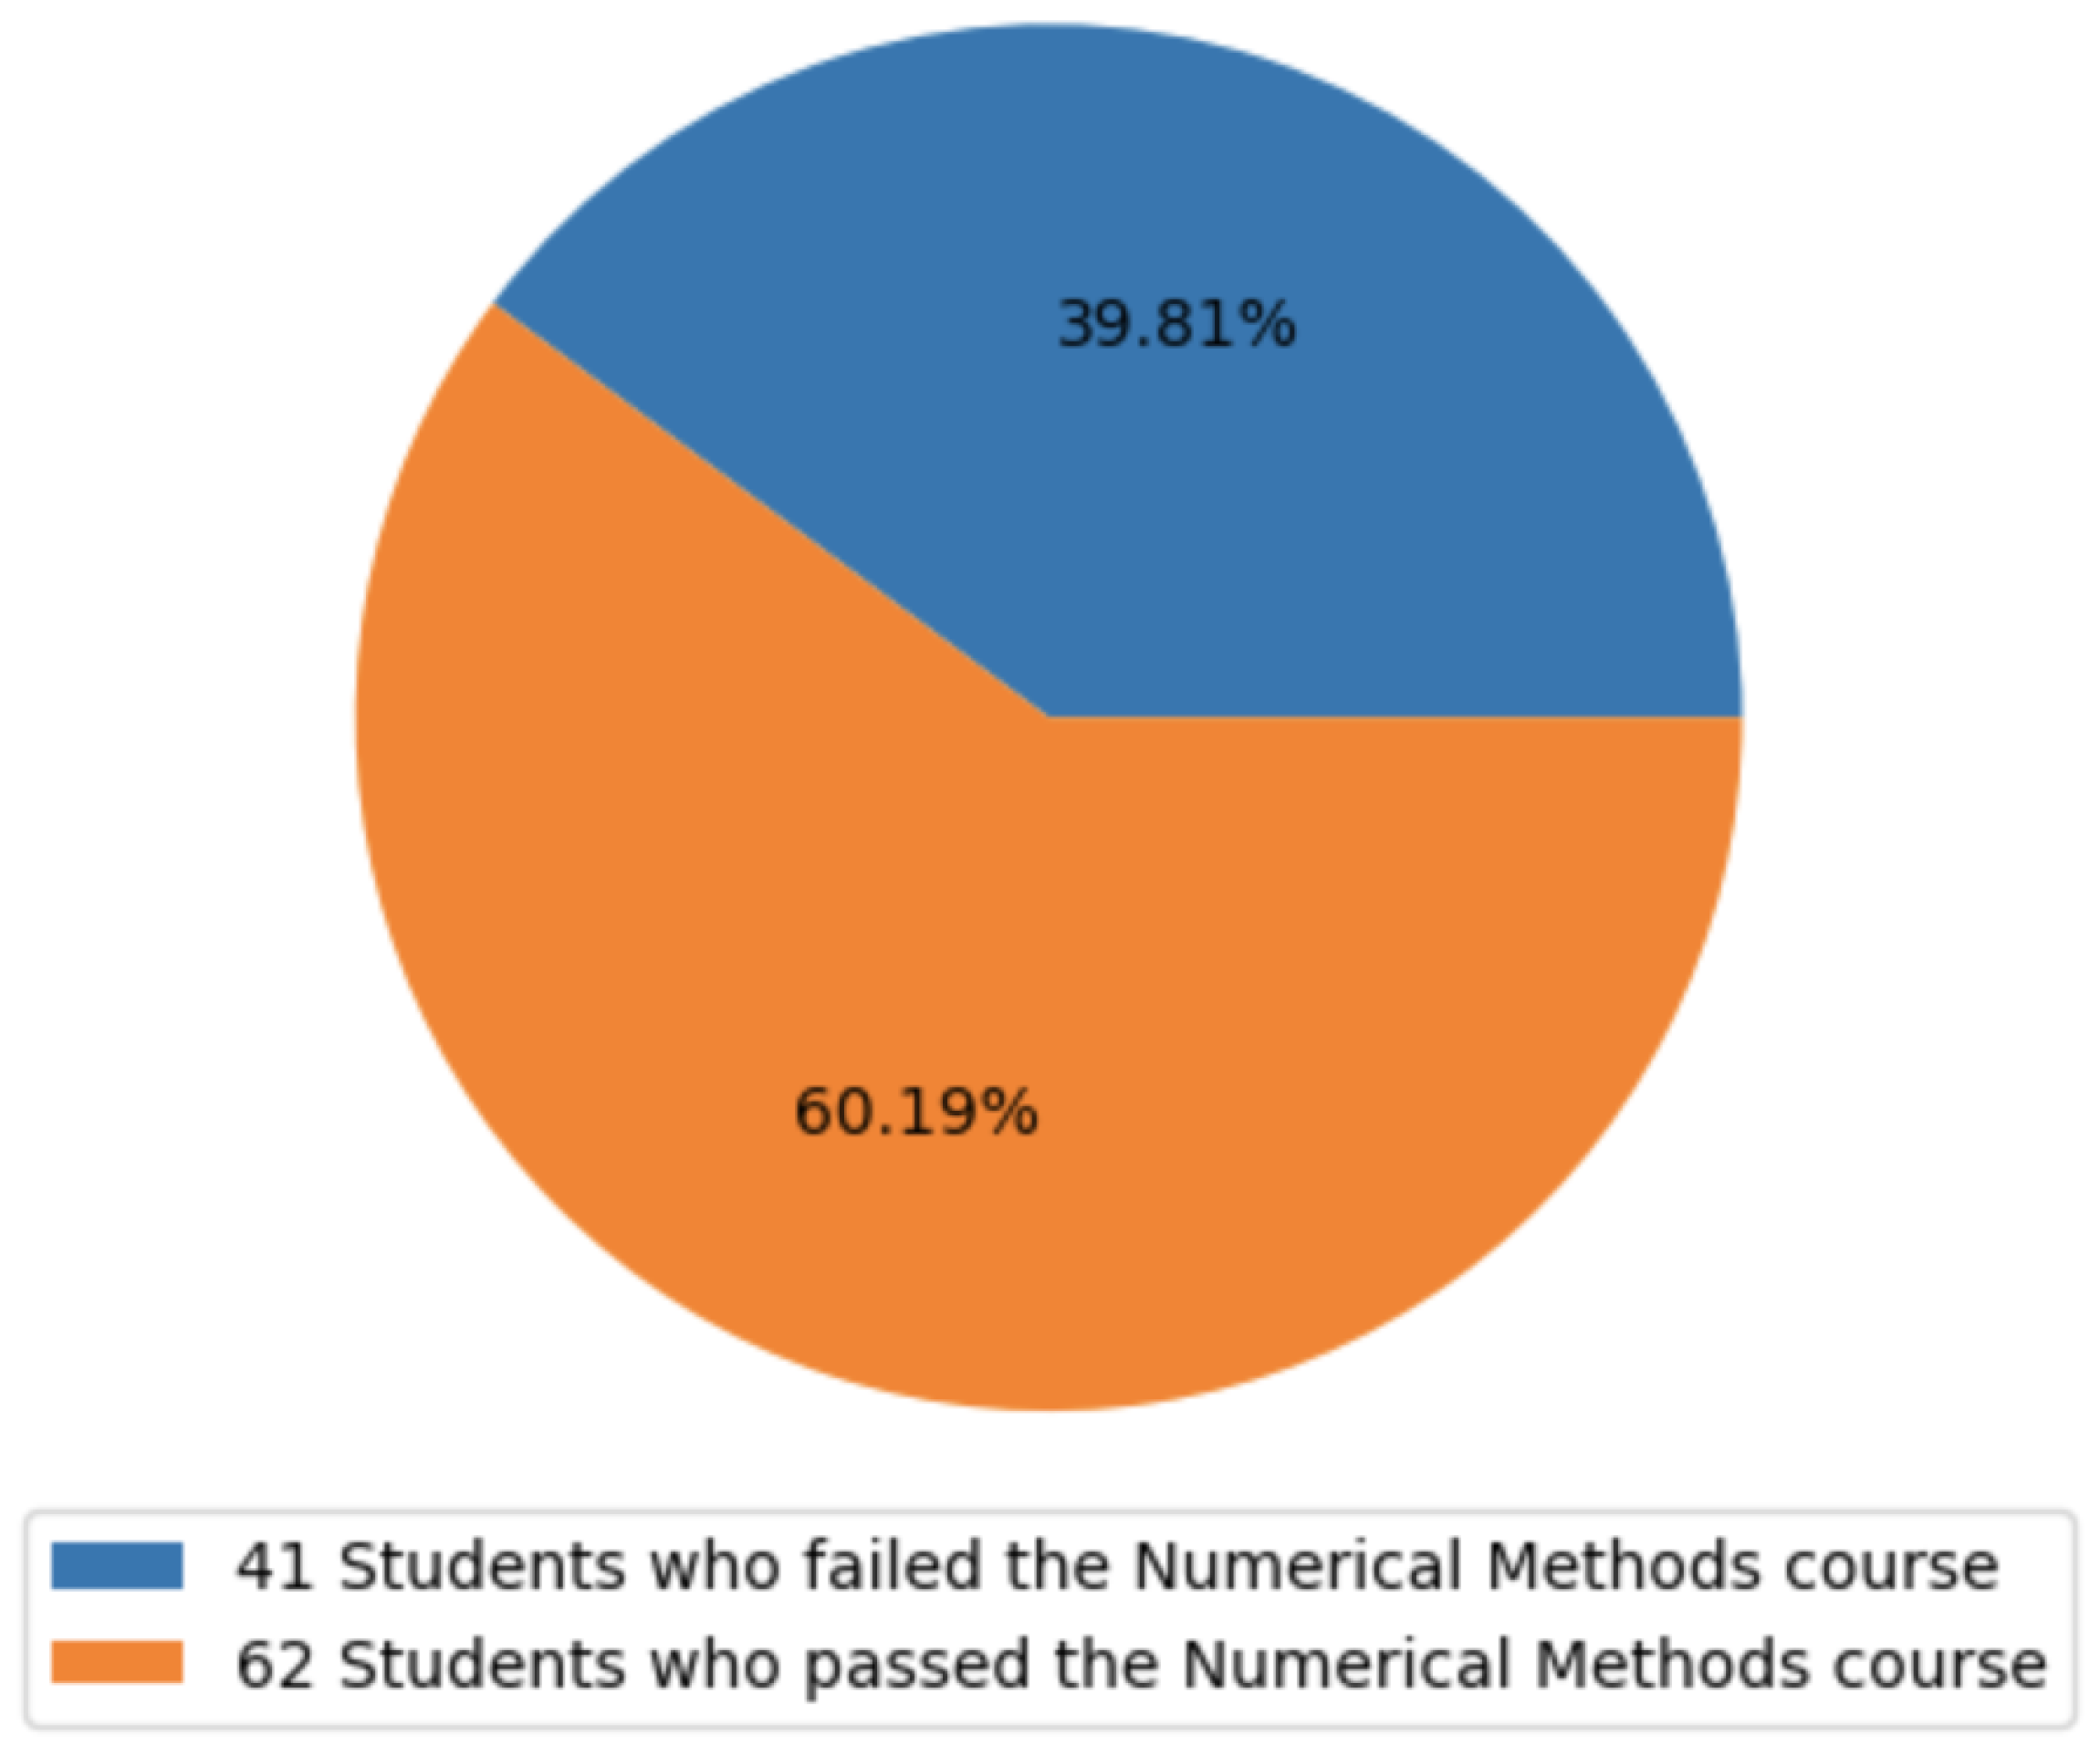
To formalize the problem, let D = { ( x i , y i ) | x i X , y i { 0 , 1 } , for all i = 1 , 2 , , n } denote the training dataset. Here, n represents the number of instances within the set (i.e., n < 103 , due to a portion being reserved for evaluation). Each element in D is a real-valued vector x i representing the academic record of the ith student, along with the corresponding target variable y i . The target variable takes a value of one if the student either failed or dropped out of the numerical methods course ( y i = 1 ), or zero otherwise ( y i = 0 ).
In other words, the problem addressed in our study is to determine the function f, where f : X { 0 , 1 } , that maps the input variables from the academic record to the target variable, utilizing the provided training dataset. To tackle this challenge, we have chosen a supervised learning approach, specifically employing classification methods.

2.2. Key Assumptions and Limitations

To conduct this research, we considered the following assumptions:
(i)
We assume that students are at risk of course failure if they have the potential to either fail or drop out of the numerical methods course;
(ii)
We assume that students’ grades in prerequisite courses serve as sufficient input variables for forecasting the probability of course failure;
(iii)
Within the context of the bachelor’s degree program in systems engineering at the University of Córdoba, we assume that the prerequisite courses for the numerical methods course include linear algebra, calculus I, II, III, physics I, II, III, introduction to computer programming, computer programming I, II, and III. Thus, the subjects encompassed within the numerical methods course are as follows:
(a)
Approximations and computer arithmetic: understanding these subjects is contingent on grasping the concepts taught in the introduction to computer programming course;
(b)
Non-linear equations: proficiency in this area necessitates a firm grasp of integral calculus (taught in calculus II), the ability to program computers using iterative and selective control structures (skills taught in both introduction to computer programming and computer programming I), and a thorough understanding of the Taylor series. The latter serves as the foundation for the secant method, a numerical technique used to solve non-linear equations;
(c)
Systems of linear equations: mastery in this domain requires familiarity with matrix and vector operations, which are covered in the linear algebra course. Additionally, it involves programming skills related to methods such as Gaus–Seidel or Jacobi, topics addressed in the computer programming II course;
(d)
Interpolation: to comprehend interpolation, students should have a background in the topics covered in calculus II. Additionally, they should be proficient in subjects taught in courses such as linear algebra, computer programming I, and II, as these are essential for implementing various numerical interpolation methods;
(e)
Numerical integration: this subject involves the use of algorithms to compute integrals that cannot be solved analytically. Therefore, students should have a solid understanding of what integration is (taught in the calculus II course) and be capable of calculating some integrals;
(f)
Ordinary differential equations: proficiency in this subject requires a strong foundation in concepts from prior mathematics courses. While it would be beneficial for students to have attended a differential equations course, in this study’s context, this is concurrently scheduled with numerical methods, allowing students to attend both in the same semester;
(g)
Numerical optimization: this subject serves as an introduction to more advanced courses such as statistics, linear and non-linear programming, stochastic methods, and machine learning. To comprehend it fully, students must have mastered topics taught in courses such as computer programming II and III, linear algebra, basic calculus, and vector calculus (covered in the calculus III course).
The limitations of our research are two-fold:
(i)
Our study does not encompass an examination of the relevance of demographic and personal data in the prediction process;
(ii)
The design of action plans aimed at preventing at-risk students from failing falls outside the scope of this research.

2.3. Machine Learning Methods

To solve the previously defined problem of predicting the risk of course failure, we adopted classification methods such as logistic regression, which is well-suited for binary outcome prediction tasks. Logistic regression utilizes the logistic function of the linear combination between input variables and weights, and a classifier is fitted by maximizing the objective function based on the log-likelihood of the training data given the binary outcome [12]. In our study, we employed the limited-memory Broyden–Fletcher–Goldfarb–Shanno (L-BFGS) algorithm [13,14] to efficiently fit the logistic regression classifier.
With the logistic regression method, it is assumed that a hyperplane exists to separate vectors into two classes within a multidimensional real-valued vector space. While this assumption might be reasonable taking into account the high dimensionality (i.e., D = 33 ) of the dataset used in this study, we also adopted other classifiers more suited for non-linear classification problems, such as the Gaussian process classifier. The Gaussian process is a probabilistic method based on Bayesian inference, where the probability distribution of the target variable is Gaussian or normal, explaining the name of the method [15,16]. One of the main advantages of the Gaussian process classifier is its ability to incorporate prior knowledge about the problem, thereby improving its forecasting, even with a small training dataset. Furthermore, within the context of this study, where the dataset is rather small, the Gaussian process classifier is a suitable choice.
In this study, we used several kernels (a.k.a., covariant functions) with Gaussian processes. For instance, the radial basis function kernel, which is defined as follows:
k G ( x i , x j ) = γ exp | | x j x i | | 2 2 σ 2 ,
where x i , x j R D are two D-dimensional vectors in real-valued space, and γ , σ R are scalars corresponding to the weight and length scale of the kernel, respectively.
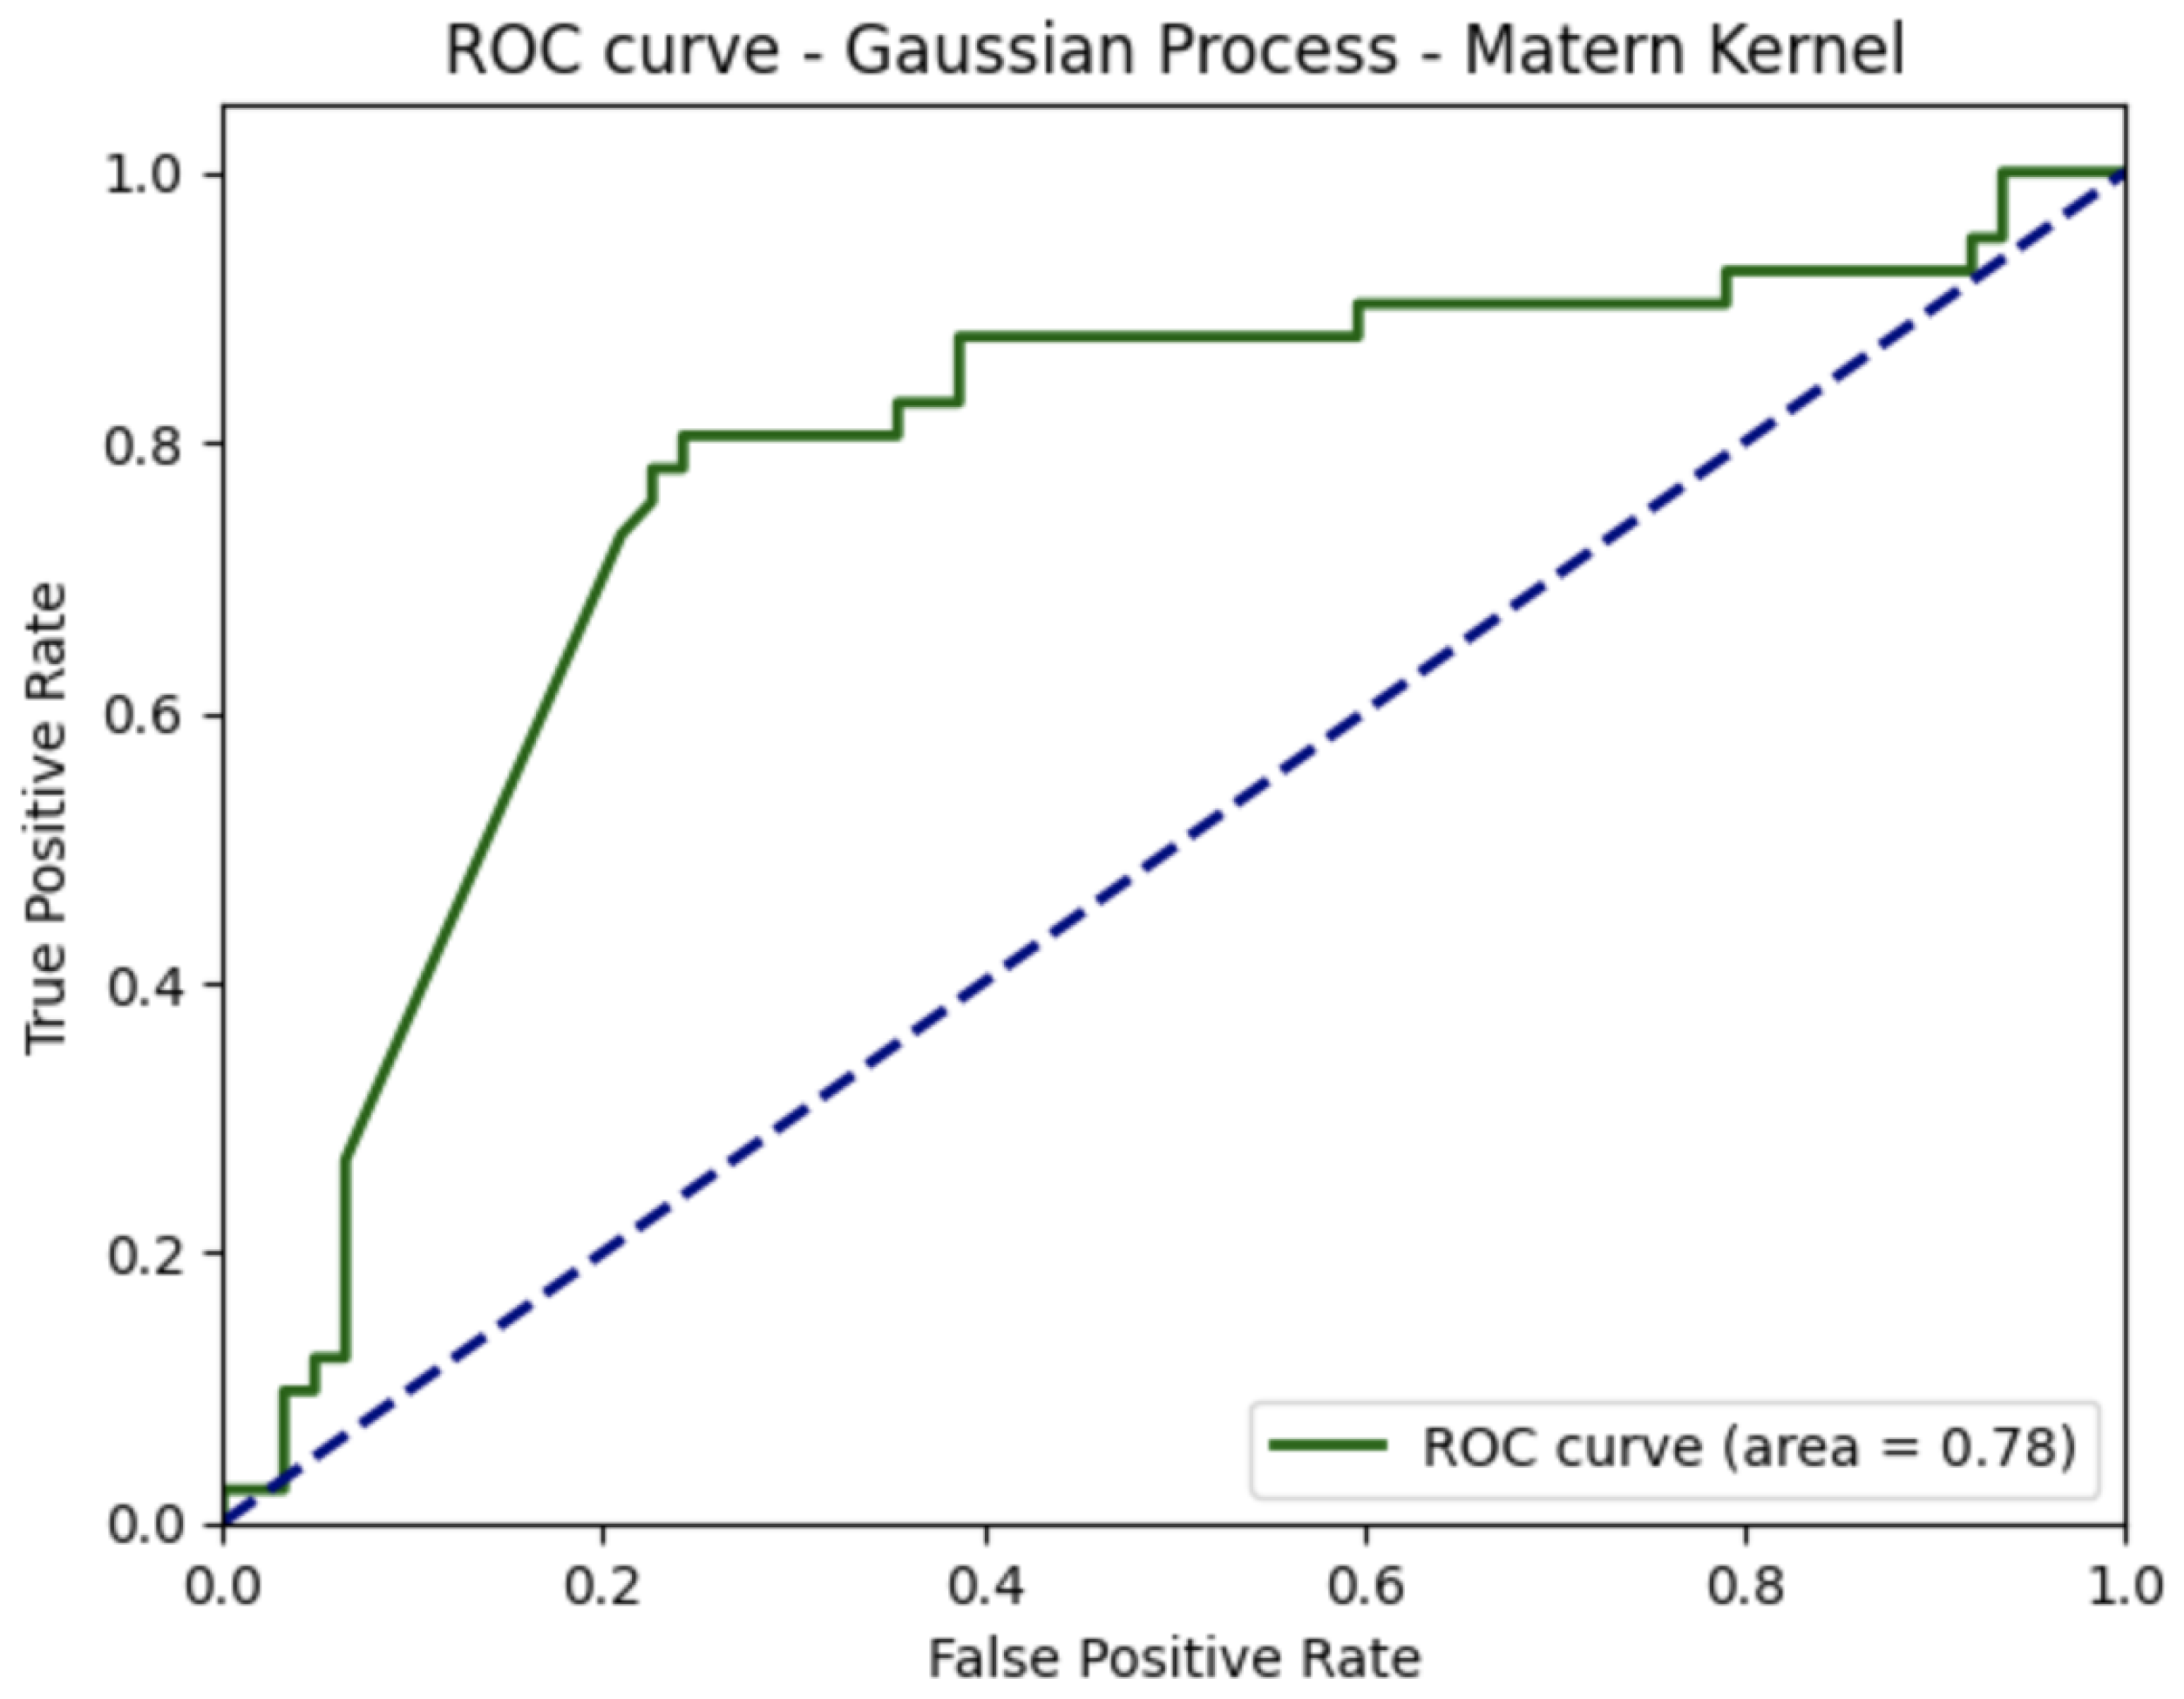
In addition, we used the Matern kernel, which is defined as follows:
k M ( x i , x j ) = γ 1 Γ ( ν ) 2 ν 1 2 ν | | x j x i | | 2 σ ν K ν 2 ν | | x j x i | | 2 σ ,
where K ν ( · ) and Γ ( · ) are the modified Bessel function and the gamma function, respectively. The hyperparameter ν R controls the smoothness of the kernel function.
Moreover, we employed a rational quadratic kernel, defined as follows:
k r ( x i , x j ) = 1 + | | x j x i | | 2 2 α σ 2 α ,
where σ is used for the same purpose as in Equation (1), while α R is the scale mixture parameter, such that α > 0 .
Furthermore, we combined Matern and radial basis function kernels by summing both as follows:
k ( x i , x j ) = γ G k G ( x i , x j ) + γ M k M ( x i , x j ) ,
where γ G and γ M are the weights assigned to the kernels.
On the other hand, the support vector machines (SVM) method is, to date, the best theoretical mehods and one of the most successful methods in the practice of modern machine learning ([17], p. 79).It is based on convex optimization, allowing for a global maximum solution to be found, which is its main advantage. However, the SVM method is not well suited for interpretation in data mining, and it is better suited for training accurate machine-learning-based systems. A detailed description of this method can be found in [18].
Both SVM and logistic regression are linear classification methods that assume the input vector space can be separated by a linear decision boundary (or a hyperplane in the case of a multidimensional real-valued space). However, when this assumption is not satisfied, SVM can be used along with kernel methods to handle non-linear decision boundaries (see [18] for further details). In this study, we used the radial basis function kernel, which is similar to the one presented in Equation (1), and it is defined as follows:
k G ( x i , x j ) = exp ( γ | | x j x i | | 2 ) ,
where γ controls the radius of this spherical kernel, whose center is x j . Additionally, we used the polynomial and Sigmoid kernels defined in Equations (6) and (7), respectively. In Equation (6), d N is the degree of the kernel, and γ R is the coefficient in Equation (7).
k p ( x i , x j ) = x i , x j d
k s ( x i , x j ) = tanh ( γ x i , x j )
Although the SVM method is considered one of the most successful methods in the practice of modern machine learning, multilayer perceptrons and their variants, which are artificial neural networks, are the most successful methods in the practice of deep learning and big data, particularly in tasks such as speech recognition, computer vision, natural language processing, and so forth. ([19], p. 3). In this research, we adopted multilayer perceptrons fitted through back-propagated cross-entropy error [20], and the optimization algorithm known as Adam [21]. We used multilayer perceptrons with one and five hidden layers.
The multilayer perceptron method is a universal approximator (i.e., it is able to approximate any function for either classification or regression), which is its main advantage. However, its main disadvantage is that the objective function (a.k.a., loss function) based on the cross-entropy error is not convex. Therefore, the synaptic weights obtained through the fitting process might not converge to the most optimum solution because there are several local minima in the objective function. Thus, finding a solution depends on the random initialization of the synaptic weights. Furthermore, multilayer perceptrons have more hyperparameters to be tuned than other learning algorithms (e.g., support vector machines or naive Bayes), which is an additional shortcoming.
Except for the logistic regression method, all the above-mentioned methods are not easily interpretable. Therefore, we adopted decision trees, which are classification algorithms commonly used in data mining and knowledge discovery. In decision tree training, a tree is created using the dataset as input, where each internal node represents a test on an independent variable, each branch represents the result of the test, and leaves represent forecasted classes. The construction of the tree is carried out in a recursive way, beginning with the whole dataset as the root node, and at each iteration, the fitting algorithm selects the next attribute that best separates the data into different classes. The fitting algorithm can be stopped based on several criteria, such as when all the training data are classified or when the accuracy or performance of the classifier cannot be further improved.
Decision trees are fitted through heuristic algorithms, such as greedy algorithms, which may lead to several local optimal solutions at each node. This is one of the reasons why there is no guarantee that the learning algorithm will converge to the most optimal solution, which is also the case with the multilayer perceptrons algorithm. Therefore, this is the main drawback of decision trees, and it can cause completely different tree shapes due to small variations in the training dataset. Decision trees were proposed in 1984, and in [22], Breiman et al. delve into the details of this method. We also adopted ensemble methods based on multiple-decision trees such as, Adaboost (stands for adaptive boosting) [23], random forest [24], and extreme gradient boosting, a.k.a. XGBoost [25].

2.4. Course Prophet Architecture

We conducted an evaluation to select one of the machine learning methods discussed in Section 2.3. Our objective was to implement the chosen method into the intelligent system that we were developing, henceforth referred to as Course Prophet. In Section 3.3, we will delve into the reasons behind our selection of the Gaussian process (GP) for classification, based on the evaluation results.
Figure 1 depicts the components of Course Prophet. While our study primarily focuses on the forecasting process, we also provide the architecture’s components, which include
  • Repository of students’ academic history: this stores the final grades achieved by each student in every enrolled course;
  • Preprocessor: this component retrieves the dataset from the repository and formats it as explained in Section 2.1;
  • Machine Learning Classifier: using a GP model, this classifier categorizes each student as either at risk or not. Additionally, the GP classifier provides the probability of the risk, as it is a probabilistic machine learning method.

3. Evaluation

3.1. Experimental Setting

The evaluation was conducted on a dataset comprising 103 instances, with each one containing 33 input variables and one target variable. Figure 2 displays the proportion of positive instances (students who failed the numerical methods course) and negative instances (students who passed the course). The pie chart illustrates that the dataset was reasonably balanced, albeit with a slightly higher number of negative examples, indicating more students successfully passed the course compared to those who failed.
During the K-fold cross-validation (KFCV), we centered each input variable in the training dataset by removing the mean and scaling to unit variance. Hyperparameters for each machine learning method were tuned through a grid search within the KFCV process. Here are the best hyperparameter settings:
  • Gaussian Process Classifier:
    Radial Basis Function Kernel: σ = 1 , γ = 3.81 × 10 6 .
    Matern Kernel: ν = 1.3 , σ = 2.5 × 10 1 , γ = 3.81 × 10 6 .
    Combination of Radial Basis Function and Matern Kernel: γ G = γ M = 3.81 × 10 6 (same as the previous kernels).
    Rational Quadratic Kernel: σ = 3.81 × 10 6 , α = 16 .
  • Support Vector Machine
    Radial Basis Function Kernel: γ = 3.9 × 10 3 , C = 4 .
    Polynomial Kernel: d = 1 , C = 7.59 × 10 1 .
  • Logistic Regression Classifier: Regularization parameter = 10 2 .
  • Decision Trees: Gini and Entropy indexes.
  • XGBoost Algorithm: Learning rate = 1.13 × 10 1 , Maximum depth = 3, Number of estimators = 50, Entropy Index.
  • Adaboost Algorithm: Learning rate = 3.13 × 10 2 , Number of estimators = 110, Entropy Index.
  • Random Forest: 15 trees, Minimum one sample per leaf, Minimum three samples per split, Maximum depth of nine levels.
The results of our study, as presented in Section 3.2, were obtained using the hyperparameter settings described earlier. For prototyping, we utilized the Python programming language and the Scikit-Learn library [26] within Google Colaboratory [27].

3.2. Results

The mean evaluation results for accuracy, precision, recall, and harmonic mean can be found in Table 1, Table 2, Table 3 and Table 4, respectively. According to the results, the Gaussian process (GP) with the Matern kernel outperformed the other machine learning methods in terms of accuracy and harmonic mean, as presented in Table 1 and Table 4. We selected decision trees (DT) as the baseline, because this is a method that is typically less accurate but suitable for interpreting the output.
Table 2 shows that support vector machines (SVM) with the radial basis function kernel performed better than the other machine learning methods in terms of precision. Nevertheless, it was outperformed by 8 out of the 16 other methods in terms of recall, as revealed in Table 3. These results are consistent with the confusion matrices presented in Table 5 and Table 6, where SVM with the radial basis function failed to classify more students at risk than GP with the Matern kernel, leading to an increased number of false negatives and a lower recall. Therefore, the SVM with the radial basis function kernel did not have the highest harmonic mean ( F 1 ) among the methods evaluated (see Table 4).
Although GP with the Matern kernel did not achieve the highest precision or recall individually, it stood out as one of the methods with high values in both metrics, resulting in a better trade-off between precision and recall, as evidenced by its harmonic mean ( F 1 ), which was the highest, as shown in Table 4.
In addition to the evaluation of the methods regarding accuracy, precision, recall, and harmonic mean ( F 1 ), as presented in Table 1, Table 2, Table 3 and Table 4, respectively, we conducted a further analysis of the receiver operating characteristic (ROC) curves for both GP with the Matern kernel and SVM with the radial basis function kernel, as depicted in Figure 3 and Figure 4, respectively. The area under the ROC curve (AUC) for GP with the Matern kernel was found to be 0.78, indicating that this classifier performed significantly better than random guessing and provided a good level of discrimination between positive and negative instances. Furthermore, Figure 4 demonstrates that the SVM with the radial basis function kernel had a greater AUC compared to GP with the Matern kernel.
Nonetheless, it is important to note that, while the SVM with the radial basis function kernel had a greater AUC compared to GP with the Matern kernel, a high AUC alone does not necessarily imply a superior predictive performance. The choice between these classifiers should consider other factors, such as the specific objectives of the prediction model and the balance between precision and recall.
On the other hand, these results indicated that our dataset’s size was substantial enough to enable machine learning methods to effectively learn consistent patterns between students’ course outcomes and their performance in prerequisite courses. Notably, the Gaussian process (GP) classifier with the Matern kernel emerged as the standout performer. It achieved a notably higher harmonic mean ( F 1 ), while also demonstrating robust discrimination capabilities, as evidenced by the ROC curve. This dual advantage positioned GP with the Matern kernel as the most promising classifier for predicting students’ risk of failure in the numerical methods course based on their academic performance in prerequisite courses.
In essence, these findings underscore the dataset’s richness and the significant potential of GP with the Matern kernel as the preferred choice for accurately predicting course failure risk. This classifier not only excelled in its performance but also offered robust discriminatory power, reinforcing its suitability for this critical predictive task.

3.3. Discussion

Based on the results obtained in this study, the Gaussian process (GP) with the Matern kernel stands out as the optimal choice for implementing Course Prophet. GP not only excels in accuracy but also maintains a favorable balance between precision and recall, as clearly presented in Table 1, Table 2, Table 3 and Table 4.
One of the key advantages of GP lies in its probabilistic nature, enabling it to furnish valuable predictive probabilities regarding student course failure. This particular capability greatly enhances decision-making compared to methods such as support vector machines (SVM), which lack inherent probabilistic functionalities.
The provision of failure probability is instrumental in resource allocation for supporting at-risk students. For instance, when a student is assigned a probability of failure around 54%, it might be judicious to evaluate whether additional support or intervention measures are necessary to improve their chances of success.
In the final analysis, the paired t-test conducted on the mean of each metric used to evaluate the machine learning methods yielded intriguing results. Notably, it revealed that there were no statistically significant differences between GP with the Matern kernel and the SVM with the radial basis function kernel (i.e., p-value > 0.05), despite the former outperforming the latter in terms of accuracy and harmonic mean ( F 1 ).
In our paired t-test analysis, further compelling findings emerged regarding the performance of the machine learning methods during the evaluation. First, we uncovered strong statistical evidence supporting the superiority of GP with the Matern kernel over SVM equipped with the polynomial and sigmoid kernels concerning recall (both cases yielded a p-value of 0.04). Additionally, GP with the Matern kernel displayed a remarkable precision compared to GP with the dot product kernel, as substantiated by a p-value of 0.02.
Furthermore, GP with the Matern kernel exhibited a higher accuracy in contrast to multilayer perceptrons (MLP) featuring five hidden layers, underpinned by a p-value of 0.03. Similarly, in the comparison between GP with the Matern kernel and MLP with a single hidden layer, the former exhibited higher accuracy, supported by substantial statistical evidence (a p-value of 0.01).
It is noteworthy that GP with the Matern kernel surpassed the accuracy of the decision tree (DT) with a Gini index, securing a p-value of 0.01.Moreover, it surpassed the DT regarding the precision, recall, and harmonic mean, as substantiated by p-values of 0.02, 0.03, and 0.009, respectively.
Additionally, in the case of the DT accuracy with an entropy index, GP with the Matern kernel outperformed it significantly, achieving a p-value of 0.03. This superiority extended to the recall (with a p-value of 0.08) and harmonic mean (with a p-value of 0.03), further solidifying its robust performance.
The accuracy of GP with the Matern kernel surpassed that of AdaBoost with an entropy index, demonstrating substantial statistical evidence, with a p-value of 0.002. Moreover, it excelled in terms of precision (with a p-value of 0.007) and harmonic mean (with a p-value of 0.004).
Finally, GP with the Matern kernel showcased its mettle by surpassing logistic regression in recall, with a p-value of 0.04. These findings collectively underscore the superior performance of GP with the Matern kernel across the various critical evaluation metrics.
In summary, an analysis of the results reveals that GP with the Matern kernel is a strong candidate for implementing Course Prophet, in order to forecast the risk of failing the numerical methods course based on students’ academic history in prerequisite courses. It offers competitive performance across multiple evaluation metrics and is particularly effective in terms of recall, making it well suited for identifying students at risk of course failure.

4. Conclusions and Ongoing Work

Throughout the course of this research, the machine learning classifier of Course Prophet revealed its capability for predicting whether a given student is at risk of course failure with an impressive accuracy rate of 80.45%. As far as our literature review indicates, what makes this achievement particularly noteworthy is that this level of forecasting accuracy had not been attained in previous research endeavors that relied solely on a similar vector representation of students’ academic histories used in our study. This result underscores the substantial progress made in addressing the central research question posed in this study; a question that, to the best of our knowledge, has remained largely unexplored in prior research.
From the analysis of the results we can draw the following conclusions:
(i)
The Gaussian process (GP) with a Matern kernel was identified as the optimal choice for implementing Course Prophet. It exhibited superior performance in terms of accuracy and achieved a favorable balance between precision and recall when compared to the other machine learning methods.
(ii)
GP’s probabilistic nature was highlighted as a key advantage. It can provide valuable predictive probabilities of student course failure, enhancing decision-making compared to methods such as support vector machines (SVM), which lack inherent probabilistic capabilities.
(iii)
The paired t-test results revealed that GP with the Matern kernel consistently outperformed the various other machine learning methods, and in many cases these differences were statistically significant. This indicates the robustness and reliability of GP’s performance across different metrics.
(iv)
The predictive probabilities generated by GP can aid in the allocation of resources to support at-risk students more effectively. For instance, a specific probability threshold could be set to determine when intervention measures are warranted, based on the odds of student failure.
(v)
The GP with the Matern kernel exhibited versatility by excelling in multiple metrics, including accuracy, precision, recall, and harmonic mean. This versatility makes it a well-rounded choice for predicting the risk of student failure in the numerical methods course based on academic history in prerequisite courses.
Up to this point, our research efforts have centered on perfecting the forecasting process, by thoroughly investigating various machine learning classifiers. However, our work is far from complete. We are currently in the process of developing a preprocessor to efficiently retrieve academic histories using the vector representation we studied in this work. Additionally, we are working on creating a user-friendly interface that will effectively present the forecasting information to end-users, who are tasked with making critical decisions based on the system predictions. This ongoing work represents the next crucial steps in enhancing the functionality and usability of our intelligent system, Course Prophet.
As a direction for further research, this study could be extended to encompass a broader range of courses and bachelor’s degrees. Exploring the effectiveness of Course Prophet in predicting course failure risks across various disciplines would provide a more comprehensive understanding of its applicability and impact.
Moreover, conducting user assessments and gathering feedback from stakeholders, including educators, administrators, and students, would be crucial for evaluating Course Prophet’s practical usability and effectiveness. Understanding user satisfaction and identifying areas for improvement could lead to a more refined and user-friendly system.
Addressing the challenges associated with curriculum changes is essential to ensure the adaptability and relevance of Course Prophet in the long run. Developing strategies to seamlessly integrate curriculum updates into the system would enhance its sustainability and usefulness.
Furthermore, delving into the possibility of extending Course Prophet into a recommender system for course selection, tailored to each student’s performance, holds significant promise. By offering personalized course recommendations that align with their academic strengths and requirements, we can substantially enrich the educational journey of students. In pursuit of this goal, we plan to investigate unsupervised learning techniques, including but not limited to association rules, dimensionality reduction, clustering, and so forth. These explorations aim to further refine Course Prophet’s capabilities and enhance its utility in guiding students toward successful academic paths.
Lastly, investigating the impact of the early identification of at-risk students raises important ethical considerations. Conducting in-depth research on the ethical and practical implications of using machine learning technology for educational decision-making is necessary, to ensure responsible and informed adoption.
By addressing these points, future research can enrich the knowledge and applicability of Course Prophet, paving the way for more informed decision-making in educational institutions.

Funding

This research was funded by the University of Córdoba in Colombia grant number FI-01-22.

Institutional Review Board Statement

The study was approved by the Institutional Research Board of the University of Córdoba in Colombia (FI-01-22, 22 January 2023).

Informed Consent Statement

Not applicable.

Data Availability Statement

The dataset is available online, to allow the reproduction of our study, and for further research [28].

Acknowledgments

Caicedo-Castro thanks the Lord Jesus Christ for blessing this project and the Universidad de Córdoba in Colombia for supporting the Course Prophet Research Project (grant FI-01-22). In particular, a deepest appreciation goes to Jairo Torres-Oviedo, rector of the University of Córdoba in Colombia, for all his help and support throughout this study. The author is grateful to the students who participated in the survey, providing the essential dataset used to train and evaluating the machine learning methods adopted in this research. Finally, the author thanks the editors and the anonymous referees for their comments, which enhanced the quality of this article.

Conflicts of Interest

The author declares no conflict of interest.

Abbreviations

The following abbreviations are used in this manuscript:
AdaboostAdaptive Boosting
AUCArea Under the ROC Curve
DTDecision Trees
GPGaussian Process
LRLogistic Regression
KFCVK-Fold Cross-Validation
RFRandom Forest
ROCReceiver Operating Characteristics
SVMSupport Vector Machines
XGBoosteXtreme Gradient Boosting

References

  1. Lykourentzou, I.; Giannoukos, I.; Nikolopoulos, V.; Mpardis, G.; Loumos, V. Dropout prediction in e-learning courses through the combination of machine learning techniques. Comput. Educ. 2009, 53, 950–965. [Google Scholar] [CrossRef]
  2. Kabathova, J.; Drlik, M. Towards Predicting Student’s Dropout in University Courses Using Different Machine Learning Techniques. Appl. Sci. 2021, 11, 3130. [Google Scholar] [CrossRef]
  3. da Silva, D.E.M.; Pires, E.J.S.; Reis, A.; de Moura Oliveira, P.B.; Barroso, J. Forecasting Students Dropout: A UTAD University Study. Future Internet 2022, 14, 1–14. [Google Scholar]
  4. Niyogisubizo, J.; Liao, L.; Nziyumva, E.; Murwanashyaka, E.; Nshimyumukiza, P.C. Predicting student’s dropout in university classes using two-layer ensemble machine learning approach: A novel stacked generalization. Comput. Educ. Artif. Intell. 2022, 3, 100066. [Google Scholar] [CrossRef]
  5. Čotić Poturić, V.; Bašić-Šiško, A.; Lulić, I. Artificial Neural Network Model for Forecasting Student Failure in Math Course. In Proceedings of the ICERI2022 Proceedings, IATED, 15th annual International Conference of Education, Research and Innovation, Seville, Spain, 7–9 November 2022; pp. 5872–5878. [Google Scholar] [CrossRef]
  6. Caicedo-Castro, I.; Macea-Anaya, M.; Rivera-Castaño, S. Early Forecasting of At-Risk Students of Failing or Dropping Out of a Bachelor’s Course Given Their Academic History—The Case Study of Numerical Methods. In Proceedings of the PATTERNS 2023: The Fifteenth International Conference on Pervasive Patterns and Applications. IARIA: International Academy, Research, and Industry Association, International Conferences on Pervasive Patterns and Applications, Nice, France, 26–30 June 2023; pp. 40–51. [Google Scholar]
  7. Zihan, S.; Sung, S.H.; Park, D.M.; Park, B.K. All-Year Dropout Prediction Modeling and Analysis for University Students. Appl. Sci. 2023, 13, 1143. [Google Scholar] [CrossRef]
  8. Čotić Poturić, V.; Dražić, I.; Čandrlić, S. Identification of Predictive Factors for Student Failure in STEM Oriented Course. In Proceedings of the ICERI2022 Proceedings. IATED, 2022, 15th annual International Conference of Education, Research and Innovation, Seville, Spain, 7–9 November 2022; pp. 5831–5837. [Google Scholar] [CrossRef]
  9. Dorogush, A.V.; Ershov, V.; Gulin, A. CatBoost: Gradient boosting with categorical features support. arXiv 2018, arXiv:1810.11363. [Google Scholar]
  10. Ke, G.; Meng, Q.; Finley, T.; Wang, T.; Chen, W.; Ma, W.; Ye, Q.; Liu, T.Y. LightGBM: A Highly Efficient Gradient Boosting Decision Tree. In Advances in Neural Information Processing Systems; Guyon, I., Luxburg, U.V., Bengio, S., Wallach, H., Fergus, R., Vishwanathan, S., Garnett, R., Eds.; Curran Associates, Inc.: Red Hook, NY, USA, 2017; Volume 30. [Google Scholar]
  11. Pacheco-Arrieta, I.; Petro, C.A.; Cabrales, L.J.L.; Chica, J.R.R.; Rondon, J.M.L.; Vertel, J.D.; Negrete, C.R.; Altamiranda, A.C.; Parra, C.S.; Vélez, L.T.M. Agreement No. 004: Student’s code at the University of Córdoba in Colombia. 2004. Available online: http://www.unicordoba.edu.co/wp-content/uploads/2018/12/reglamento-academico.pdf (accessed on 24 July 2023).
  12. Cox, D. The regression analysis of binary sequences. J. R. Stat. Soc. Ser. 1958, 20, 215–242. [Google Scholar] [CrossRef]
  13. Liu, D.C.; Nocedal, J. On the limited memory BFGS method for large scale optimization. Math. Program. 1989, 45, 503–528. [Google Scholar] [CrossRef]
  14. Byrd, R.; Lu, P.; Nocedal, J.; Zhu, C. A Limited Memory Algorithm for Bound Constrained Optimization. Siam J. Sci. Comput. 1995, 16, 1190–1208. [Google Scholar] [CrossRef]
  15. Williams, C.; Rasmussen, C. Gaussian Processes for Regression. In Advances in Neural Information Processing Systems; Touretzky, D., Mozer, M., Hasselmo, M., Eds.; MIT Press: Cambridge, MA, USA, 1995; Volume 8, pp. 514–520. [Google Scholar]
  16. Rasmussen, C.E.; Williams, C.K.I. Gaussian Processes for Machine Learning; MIT Press: Cambridge, MA, USA, 2006. [Google Scholar]
  17. Mohri, M.; Rostamizadeh, A.; Talwalkar, A. Foundations of Machine Learning, 2nd ed.; The MIT Press: Cambridge, MA, USA, 2018. [Google Scholar]
  18. Cortes, C.; Vapnik, V. Support Vector Networks. Mach. Learn. 1995, 20, 273–297. [Google Scholar] [CrossRef]
  19. Aggarwal, C.C. Neural Networks and Deep Learning; Springer: Berlin/Heidelberg, Germany, 2018; p. 497. [Google Scholar]
  20. Rumelhart, D.E.; Hinton, G.E.; Williams, R.J. Learning Representations by Back-propagating Errors. Nature 1986, 323, 533–536. [Google Scholar] [CrossRef]
  21. Kingma, D.P.; Ba, J. Adam: A Method for Stochastic Optimization. 2014. Available online: http://arxiv.org/abs/1412.6980 (accessed on 24 July 2023).
  22. Breiman, L.; Friedman, J.H.; Olshen, R.A.; Stone, C.J. Classification and Regression Trees; Wadsworth and Brooks: Monterey, CA, USA, 1984. [Google Scholar]
  23. Freund, Y.; Schapire, R.E. Experiments with a new boosting algorithm. ICML 1996, 96, 148–156. [Google Scholar]
  24. Breiman, L. Random forests. In Machine Learning; Springer: Berlin/Heidelberg, Germany, 2001; Volume 45, pp. 5–32. [Google Scholar]
  25. Chen, T.; Guestrin, C. Xgboost: A scalable tree boosting system. In Proceedings of the 22nd ACM SIGKDD International Conference on Knowledge Discovery and Data Mining, San Francisco, CA, USA, 13–17 August 2016; pp. 785–794. [Google Scholar]
  26. Pedregosa, F.; Varoquaux, G.; Gramfort, A.; Michel, V.; Thirion, B.; Grisel, O.; Blondel, M.; Prettenhofer, P.; Weiss, R.; Dubourg, V.; et al. Scikit-learn: Machine Learning in Python. J. Mach. Learn. Res. 2011, 12, 2825–2830. [Google Scholar]
  27. Google Colaboratory. 2017. Available online: https://colab.research.google.com/ (accessed on 24 July 2023).
  28. Caicedo-Castro, I. Dataset for Early Forecasting of At-Risk Students of Failing or Dropping Out of a Bachelor’s Course Given Their Academic History—The Case Study of Numerical Methods. 2023. Available online: https://sites.google.com/correo.unicordoba.edu.co/isacaic/research (accessed on 24 July 2023).
Figure 1. Course Prophet in a nutshell: The academic history is used to predict the probability of students failing the Numerical Methods course. In the prediction, items highlighted in red represent students at risk, including their respective risk probabilities.
Sustainability 15 13950 g001
Figure 2. Distribution of student outcomes in the numerical methods course dataset. The figure illustrates that 41 out of 103 students who participated in the study failed the numerical methods course (39.81% of the surveyed students), while 62 out of 103 students passed the course (60.19% of the sample).
Sustainability 15 13950 g002
Figure 3. Receiver operating characteristics (ROC) curve for the Gaussian process with the Matern kernel. The diagonal dashed line represents the performance of random guessing, where the classifier performs better than random chance.
Sustainability 15 13950 g003
Figure 4. Receiver operating characteristics (ROC) curve for the support vector machines with the radial basis function kernel. The ROC curve above the diagonal dashed line indicates that the aforementioned method outperforms guessing at random.
Sustainability 15 13950 g004
Table 1. Mean accuracy of the machine learning methods evaluated through ten-fold cross-validation. The table shows the methods in the first column, the mean accuracy in the second column, the accuracy variance in the third column, and the performance gain compared to the baseline in the last column.
MethodMean Accuracy (%)Variance (%)Gain (%)
Decision Tree—Gini index (baseline)60.273.23NA
Adaboost—Entropy index62.451.073.62
Decision Tree—Entropy index66.542.0210.40
Multilayer Perceptron with a single hidden layer67.091.0311.32
Multilayer Perceptron with five hidden layers68.181.1813.12
Gaussian Process with Dot Product Kernel71.181.2718.10
Random Forest—Entropy index73.911.9322.63
XGBoost74.000.8322.78
Logistic Regression75.730.8825.65
Support Vector Machines with Sigmoid Kernel75.911.1825.95
Support Vector Machines with Polynomial Kernel75.911.1725.95
Support Vector Machines with Radial Basis Function Kernel77.641.6628.82
Gaussian Process with the Radial Basis Function Kernel79.451.3831.82
Gaussian Process with the Sum of Radial Basis Function and Matern Kernels79.451.3831.82
Gaussian Process with the Rational Quadratic Kernel79.541.0031.97
Gaussian Process with Matern Kernel80.451.2833.48
Table 2. Mean precision of machine learning methods assessed via ten-fold cross-validation. The table presents the methods in the first column, the mean precision in the second column, the precision variance in the third column, and the performance gain compared to the baseline in the last column.
MethodMean Precision (%)Variance (%)Gain (%)
Decision Tree—Gini index (baseline)54.699.29NA
Adaboost—Entropy index57.333.874.60
Multilayer Perceptron with a single hidden layer60.451.0910.53
Multilayer Perceptron with five hidden layers61.679.1112.76
Gaussian Process with Dot Product Kernel64.832.6818.54
Decision Tree—Entropy index66.542.0221.67
Random Forest—Entropy index71.674.5331.05
XGBoost76.674.4140.19
Gaussian Process with the Radial Basis Function Kernel81.332.4748.71
Gaussian Process with the Sum of Radial Basis Function and Matern Kernels81.332.4748.71
Gaussian Process with the Rational Quadratic Kernel81.332.4748.71
Gaussian Process with the Matern Kernel83.332.7752.37
Logistic Regression84.169.2353.89
Support Vector Machines with Sigmoid Kernel85.0010.2555.42
Support Vector Machines with Polynomial Kernel85.0010.2555.42
Support Vector Machines with Radial Basis Function Kernel85.173.6355.73
Table 3. Mean recall of machine learning methods evaluated through ten-fold cross-validation. The table lists the methods in the first column, the mean recall in the second column, the recall variance in the third column, and the performance gain compared to the baseline in the last column.
MethodMean Recall (%)Variance (%)Gain (%)
Decision Tree—Gini index (baseline)41.506.25NA
Logistic Regression45.004.758.43
Support Vector Machines with Sigmoid Kernel45.004.758.43
Support Vector Machines with Polynomial Kernel45.004.758.43
Adaboost—Entropy index49.002.5918.07
Decision Tree—Entropy index51.501.9524.09
Multilayer Perceptron with five hidden layers54.507.5731.33
Support Vector Machines with Radial Basis Function Kernel57.007.9137.35
XGBoost59.001.7942.16
Multilayer Perceptron with a single hidden layer61.501.9048.19
Gaussian Process with the Radial Basis Function Kernel64.004.3954.22
Gaussian Process with the Sum of Radial Basis Function and Matern Kernels64.004.3954.22
Gaussian Process with the Rational Quadratic Kernel66.54.2560.24
Gaussian Process with the Matern Kernel66.54.2560.24
Random Forest - Entropy index66.53.0060.24
Gaussian Process with Dot Product Kernel67.005.5161.44
Table 4. Average harmonic mean ( F 1 ) of machine learning methods assessed via ten-fold cross-validation. The table displays the methods in the first column, the mean F 1 in the second column, the F 1 variance in the third column, and the performance gain compared to the baseline in the last column.
MethodMean F 1 (%)Variance (%)Gain (%)
Decision Tree—Gini index (baseline)44.425.85NA
Adaboost—Entropy index50.431.6513.53
Multilayer Perceptron with five hidden layers53.975.0421.49
Decision Tree—Entropy index55.732.1625.46
Logistic Regression56.455.3527.08
Support Vector Machines with Sigmoid Kernel56.815.8927.89
Support Vector Machines with Polynomial Kernel56.815.8927.89
Multilayer Perceptron with a single hidden layer59.810.8234.65
Gaussian Process with Dot Product Kernel63.402.7142.73
Support Vector Machines with Radial Basis Function Kernel63.885.2443.81
XGBoost64.331.2344.82
Random Forest—Entropy index67.472.3051.89
Gaussian Process with the Radial Basis Function Kernel70.562.8258.85
Gaussian Process with the Sum of Radial Basis Function and Matern Kernels70.562.8258.85
Gaussian Process with the Rational Quadratic Kernel71.412.0860.76
Gaussian Process with the Matern Kernel72.522.5863.26
Table 5. Confusion matrix illustrating the performance of Gaussian process classification using the Matern kernel.
Forecasted Class
True ClassStudent without RiskStudent at RiskTotal
Student without risk56662
Student at risk142741
Total7033103
Table 6. Confusion matrix depicting the performance of support vector machines using the radial basis function kernel.
Forecasted Class
True ClassStudent without RiskStudent at RiskTotal
Student without risk57562
Student at risk182341
Total7528103
Disclaimer/Publisher’s Note: The statements, opinions and data contained in all publications are solely those of the individual author(s) and contributor(s) and not of MDPI and/or the editor(s). MDPI and/or the editor(s) disclaim responsibility for any injury to people or property resulting from any ideas, methods, instructions or products referred to in the content.

