1. Introduction
Porous asphalt mixture is a type of functional pavement material composed of open-graded aggregate, also referred to as open-graded friction course (OGFC). It is commonly composed of high-performance asphalt binder and aggregates, and the increased proportion of coarse aggregates in porous asphalt mixture results in a pavement structure with a high proportion of interconnecting pores [
1,
2]. This feature enhances friction and drainage of the pavement and reduces the water film thickness to ensure comfort and safety. The application of porous asphalt mixture is highly advantageous in terms of both storm water management and road performance enhancement [
3,
4]. However, there are also many challenges in the production and construction of porous concrete that are worth considerable attention. For instance, the reduction of high temperature rutting resistance due to multiple air voids, and the improper design of aggregates resulting in durability diseases such as loose and pitted asphalt [
5,
6].
The process of transforming asphalt mixture from a loose granular state to a viscoelastic state is known as compaction [
7,
8]. The compaction process during construction is critical to the final performance of asphalt concrete pavements with quality materials and a reasonable gradation design. For normal dense-graded mixtures, insufficient compaction may cause structural loosening and water penetration, while over-compaction is not conducive to adequate bonding of the asphalt binder and aggregates [
9]. For porous asphalt mixtures, insufficient compaction leads to the failure of the structural strength of the asphalt mixture to meet the service requirements; meanwhile, excessive compaction tends to crush the aggregate and change the actual gradation, thereby losing its performance advantages of drainage and noise reduction. Therefore, proper compaction is important to control the road performance of porous asphalt mixture. However, it is difficult to quantify the quality of asphalt mixture compaction in actual engineering, and accurate visual feedback is not available. Additionally, the mechanisms involved in the compaction process and strength formation of porous asphalt mixtures is still unclear [
10]. Usually, laboratory experiments are used to simulate the practical compaction process and obtain the physical parameters and mechanical properties of samples to determine the optimal control parameters in the compaction process.
At present, compaction methods such as vibratory rolling, oscillatory rolling, and static rolling are widely used in the construction of asphalt mixture on site. Instead, Marshall hammer compaction (MHC) and Superpave gyratory compaction (SGC) are mostly used in the laboratory test [
11,
12,
13]. In comparison, the SGC method can reflect the mechanical state under real construction conditions more effectively. Since both the compression and shearing effects on the asphalt mixture during compaction can be simulated to some degree [
14]. As a result, numerous studies have shown that asphalt concrete specimens prepared by SGC perform better than MHC. For example, Tapkin and Keskin [
15] prepared samples and tested the rutting performance of MHC and SGC for dense-mix asphalt mixtures. The rutting performance of the SGC samples was significantly higher than that of the MHC samples. Chen and Li [
14] examined the compaction characteristics of SGC-formed asphalt mix samples. Additionally, the results of the SGC tests showed that the relationship between material composition and compaction characteristics can be used to predict the performance of asphalt mixes and to adjust design solutions. Several quantitative indicators can be used to describe the compaction performance of asphalt mixtures, including compaction curves, the compaction energy index, and locking point. These indicators are relatively simple to define and can be used to represent the compatibility of asphalt mixture in laboratory studies [
16,
17,
18].
However, when evaluating the compactibility of porous asphalt concrete using the above indicators, it is difficult to determine the skeleton structure, strength characteristics, and void distribution of asphalt mixtures during the compaction process. It is necessary to consider the characteristics and strength mechanism of the aggregate skeleton. This is determined by the large proportion of coarse aggregates (about 70%) and the high stress feature in the form of point contact between aggregates [
6,
19,
20].The research on aggregate shape and asphalt concrete strength has shown that the particle index (PI), which characterizes aggregate aspect ratio, particle number, and other shape indicators, has a significant effect on its skeletal strength [
21]. The relationship between asphalt mix compaction methods, void distribution characteristics, compaction work (rotary compaction forming), and volume characteristics can be investigated by using X-ray computed tomography and digital image processing techniques [
22,
23]. The research based on X-ray computed tomography (CT) images of porous asphalt concrete has indicated that the microscopic void features of porous asphalt concrete are related to the gradation design and nominal maximum aggregate size, and it directly affects the skeletal strength of porous asphalt concrete. Performance indicators such as Marshall stability and dynamic stability of asphalt concrete have been found to be linearly related to the equivalent diameter of its internal voids [
24]. Based on digital image processing techniques, Shi et al. analyzed the microstructure of the asphalt mixture skeleton, predicted the minimum voids in coarse aggregates (VCA
min), and proposed effective voids in coarse aggregates (VCA
effect) [
25,
26]. Cai et al. investigated the skeleton characteristics of asphalt mixtures at different compaction powers and used the VCA
effect parameter, which takes into account the effective contact characteristics, to evaluate the skeleton structure [
27].
From the results of the above study, it can be concluded that the investigation of compaction and strength characteristics of porous asphalt mixtures is very meaningful for the performance control of asphalt mixtures. SGC of porous asphalt mixtures not only reduces the impact damage to the aggregate during the forming process, but also results in a better skeletal embedding than MHC. Therefore, it is feasible to utilize SGC to form porous asphalt and explore its skeletal structural characteristics. CT scanning and image processing techniques can directly explore the aggregate contact state of porous asphalt mixture, but due to the expensive equipment price and testing cost, they are only suitable for laboratory use and are difficult to carry out in actual engineering construction. Therefore, it is necessary to propose a new simple compaction quality evaluation method and control method suitable for engineering based on the structural characteristics and strength theory of asphalt mixture.
Considering both quantitative analysis and practical engineering applications, this paper focuses on the analysis of the structural characteristics of the porous asphalt mixture skeleton. Superpave gyratory compaction (SGC) and skeleton penetration tests of porous asphalt mixtures were carried out using three engineering differentiated gradations. Compaction characteristics parameters such as compaction degree, void ratio, and voids in coarse aggregates (VCA) ratio curves for different compaction processes were obtained. The skeleton contact state of porous asphalt mixtures during penetration was analyzed based on key particle size breakage rates and a three-stage skeleton strength penetration model. The object of this paper is to propose a new method to investigate the internal skeletal characteristics and determine the corresponding target compaction number of porous asphalt mixtures more quickly through typical volume feature parameters such as porosity and the skeleton embedding ratio to facilitate practical engineering applications and ensure higher compaction evaluation accuracy, and to establish the relationship between gradation and skeleton strength, thus providing theoretical support for the establishment of aggregate gradation optimization methods.
3. Results
3.1. Gyratory Compaction Curve
The compaction curve is an important basis for investigating compaction characteristics of asphalt mixtures. Based on the volume method, the compactness ratio, which is the ratio of compaction density to the maximum theoretical density at different compaction times, can be calculated by recording the compaction height of the porous asphalt mixture during the gyratory compaction process. The curve formed by the number of compactions and the compactness ratio is the gyratory compaction curve.
Figure 3 shows the compaction curves of PAC-13 mixtures with three gradation types.
It can be seen from
Figure 3 that the compaction curve of porous asphalt mixture can be fitted as an exponential function. The slope of any point on the compaction curve represents the speed of the compaction rate. The compaction curves can be fitted by Equation (2):
where
γN is the compactness ratio of the specimen at the
Nth compaction, and
a and
b are fitting coefficients.
It can be seen from
Figure 3 that the change in the compaction curve shows three stages with the increase in compaction times, which can be divided into initial compaction stage, stable compaction stage, and maximum compaction stage. This reflects the change process in the compactness of porous asphalt mixture with the number of compactions.
The compaction curves show that the three characteristic gradations used in the research have a relatively obvious change process on the compaction curve. As shown in
Figure 3, when the target compactness ratio is designed to 76~82%, the asphalt mixture with medium or fine gradation can both achieve the compactness requirements within a reasonable compaction numbers, while the process for the coarse gradation takes too long to reach the target compactness. Additionally, analyzing the compaction process solely based on the compactness data is insufficient. Meeting the compactness requirements does not necessarily mean a skeleton extrusion structure has been formed. Therefore, the analysis of the skeleton contact state during the compaction process is necessary.
3.2. Volume Feature of Asphalt Mixture at Gyratory Compaction
3.2.1. Porosity
Based on the measured data during the compaction process, the change in porosity of the porous asphalt mixture during the compaction process can be calculated using the volumetric method, as shown in
Figure 4. The porosity decreases rapidly at the beginning of the compaction process. A stable skeleton is formed after the stable compaction stage and the porosity attenuation rate gradually approaches 0 with the increase in compaction times.
It can be seen from
Figure 4 that none of the specimens in this research can achieve the goal of the lower limit porosity of 18%. The number of compactions for the Z-gradation, C-gradation, and X-gradation asphalt mixtures to meet the upper limit of the target porosity (24%) are about 20–50 times, 42–82 times, and 16–32 times, respectively. Additionally, the lower limit of porosity of these asphalt mixtures are 19%, 20%, and 19%, respectively. This indicates that X-gradation can quickly reach the upper limit of the target porosity of 24% during the gyratory compaction process, followed by Z-gradation. The C-gradation asphalt mixture needs more compaction times to reach the porosity of 24%. The lower limit of porosity of the coarse gradation (C-gradation) asphalt mixture is 20%, which is slightly higher than the other two asphalt mixtures.
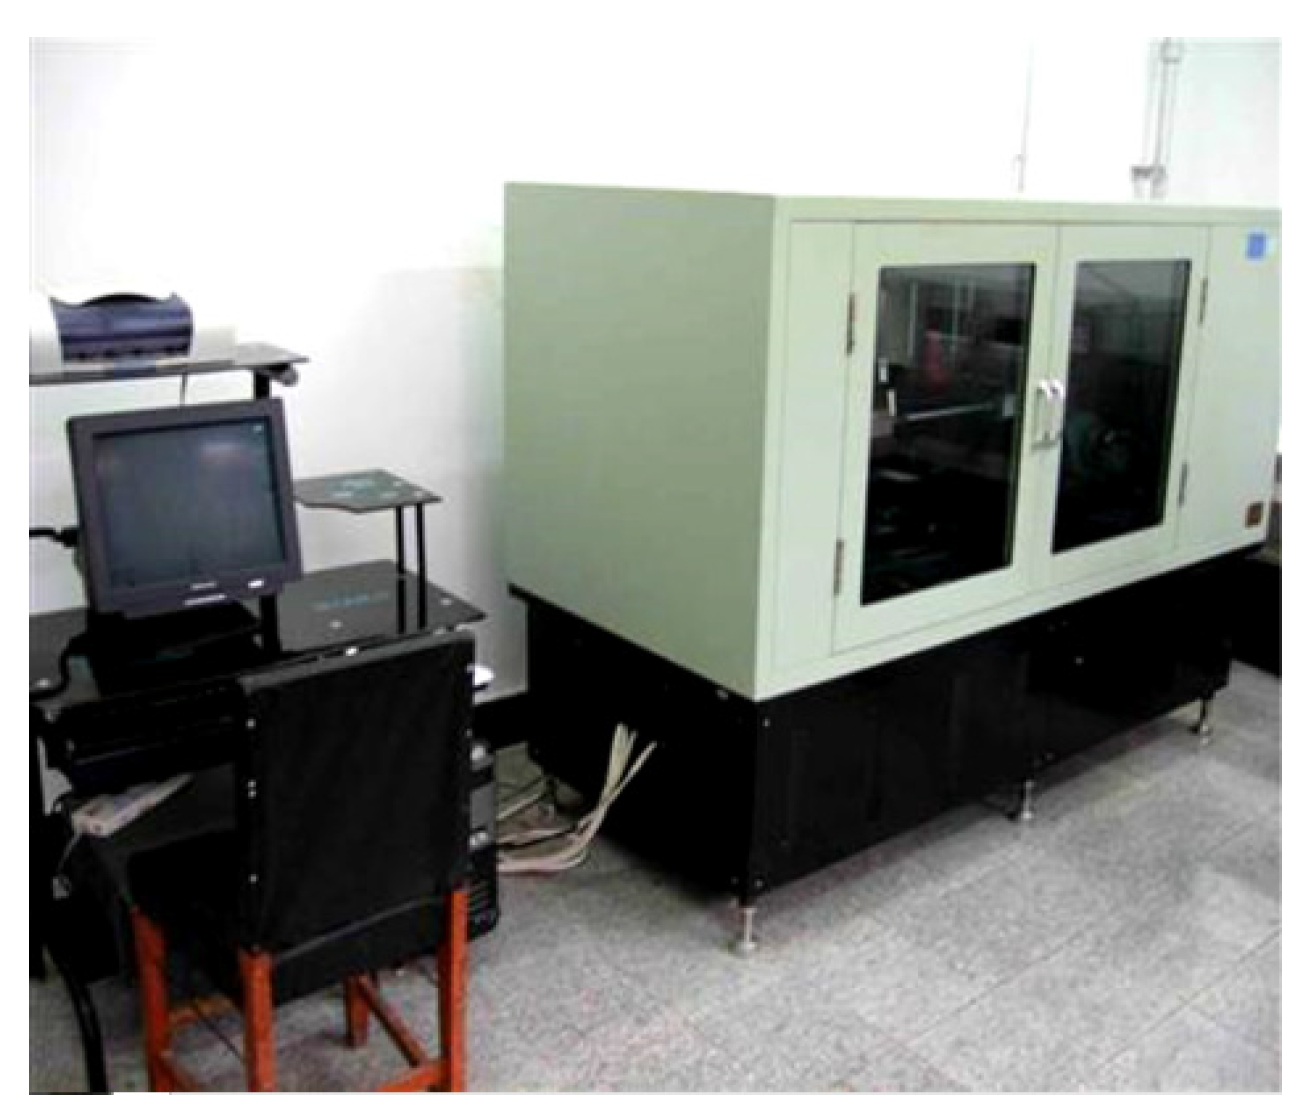
3.2.2. Fine Structure Analysis Based on CT
Figure 5 presents the void space distribution morphology based on CT scanning. In the figures, the gray indicates the connected voids, and other colors indicate the isolated voids. Based on the CT data, the air voids, connected voids, and the ratio between the air voids and connected voids were calculated.
Figure 6 shows the calculation results. From the figures, 70-C exhibits the highest proportion of air voids and connected voids, followed by the 70-X, with 70-Z having the lowest. Lower porosity generally means a denser asphalt mixture and better performance. In terms of the ratio between the air voids and connected voids, 70-C shows the highest, and the ratios of 70-X and 70-Z are close.
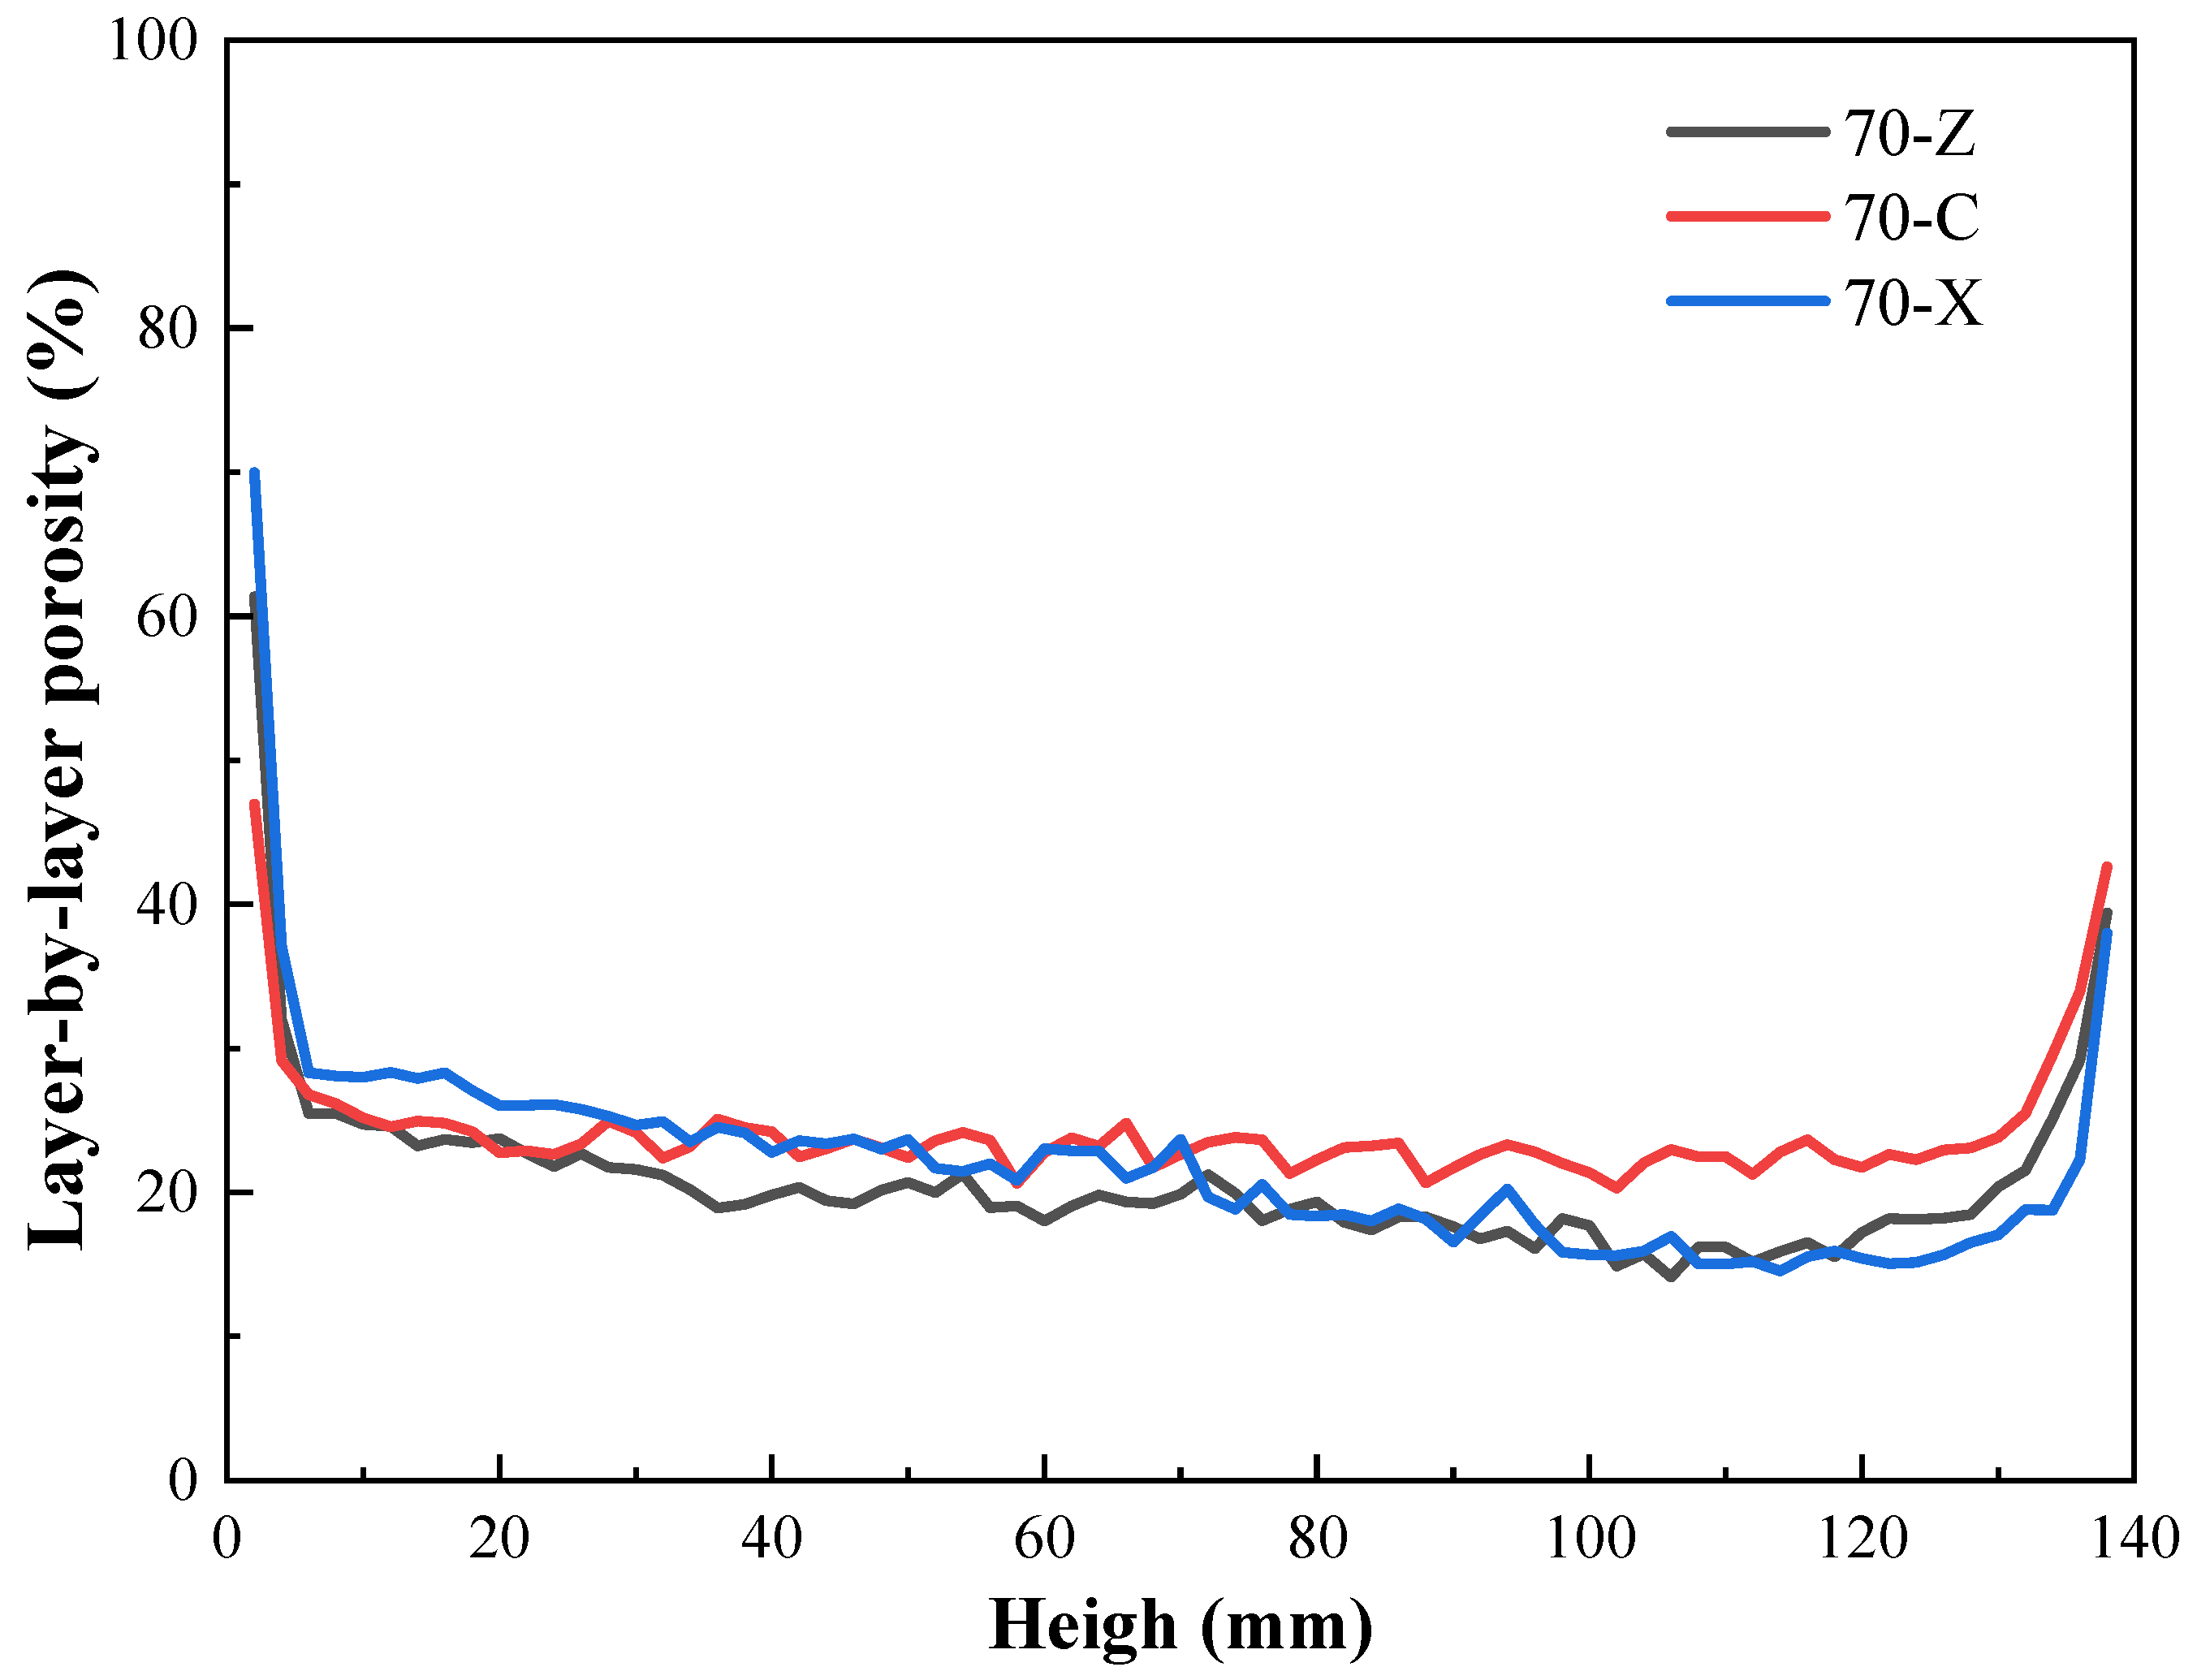
Figure 7 presents the layer-by-layer porosity for three gradations of asphalt mixtures based on CT scanning. From the figure, the variation trend of the porosity of the three asphalt mixtures is consistent. When the height is less than 6 mm, the porosity of the mixture drops sharply. When the height ranges from 6 mm to 120 mm, the porosity of the mixture tends to decrease slowly. In addition, 70-C exhibits the highest porosity, which also verifies the results of
Figure 6.
The correlations of the above three void indices were calculated and shown in
Figure 8. From the figure, the proportion of air voids and connected voids have an extremely high correlation, while the correlation between the air voids and the ratio between the air voids and connected voids is very low. This indicates that air voids and connected voids are highly correlated and affect each other, but the ratio of the two does not necessarily show the same change law as the two.
3.2.3. Skeleton Contact State
Porous asphalt mixture is essentially a skeletal embedded structure, and its strength is mainly provided by the coarse aggregate skeleton, which requires the formation of a stable stone–stone contact state. Currently, there is no uniform method for evaluating the skeletal structure of porous asphalt mixture. This study uses the VCA ratio to determine the skeletal contact state of a porous asphalt mixture. The VCA ratio (ΔVCA) is defined by the following Equation (3):
where
VCAmix is the coarse aggregate skeleton clearance rate in asphalt mixture and
VCADRC is the coarse aggregate skeleton clearance rate in dry pounded condition. The current research results show that, for the maximum nominal particle size of 13.2 mm porous asphalt mixture, 2.36 mm is generally considered as the key sieve hole [
33,
34]. After clarifying the key sieve hole of the mixture, when the ΔVCA of the test grade is less than 1, that is, the coarse aggregate skeleton gap rate is less than the coarse aggregate skeleton gap rate in the dry pounding state, the fine aggregate and asphalt fill in the voids of the skeleton structure formed by the coarse aggregate, which can be considered to form a stable skeleton structure.
VCAmix and
VCADRC can be calculated using Equations (4) and (5) referring to the specifications JTG E20 [
35].
where
γs is the gross bulk density of the coarse skeleton part of the mineral mixture in the dry pounding state,
γf is the gross bulk density obtained from the test specimen of the asphalt mixture,
γCA is the synthetic gross volume relative density of the coarse skeleton part, PCA is the proportion of the mixture accounted for by the coarse aggregate of the skeleton above 2.36 mm key sieve in the mixture.
To determine the
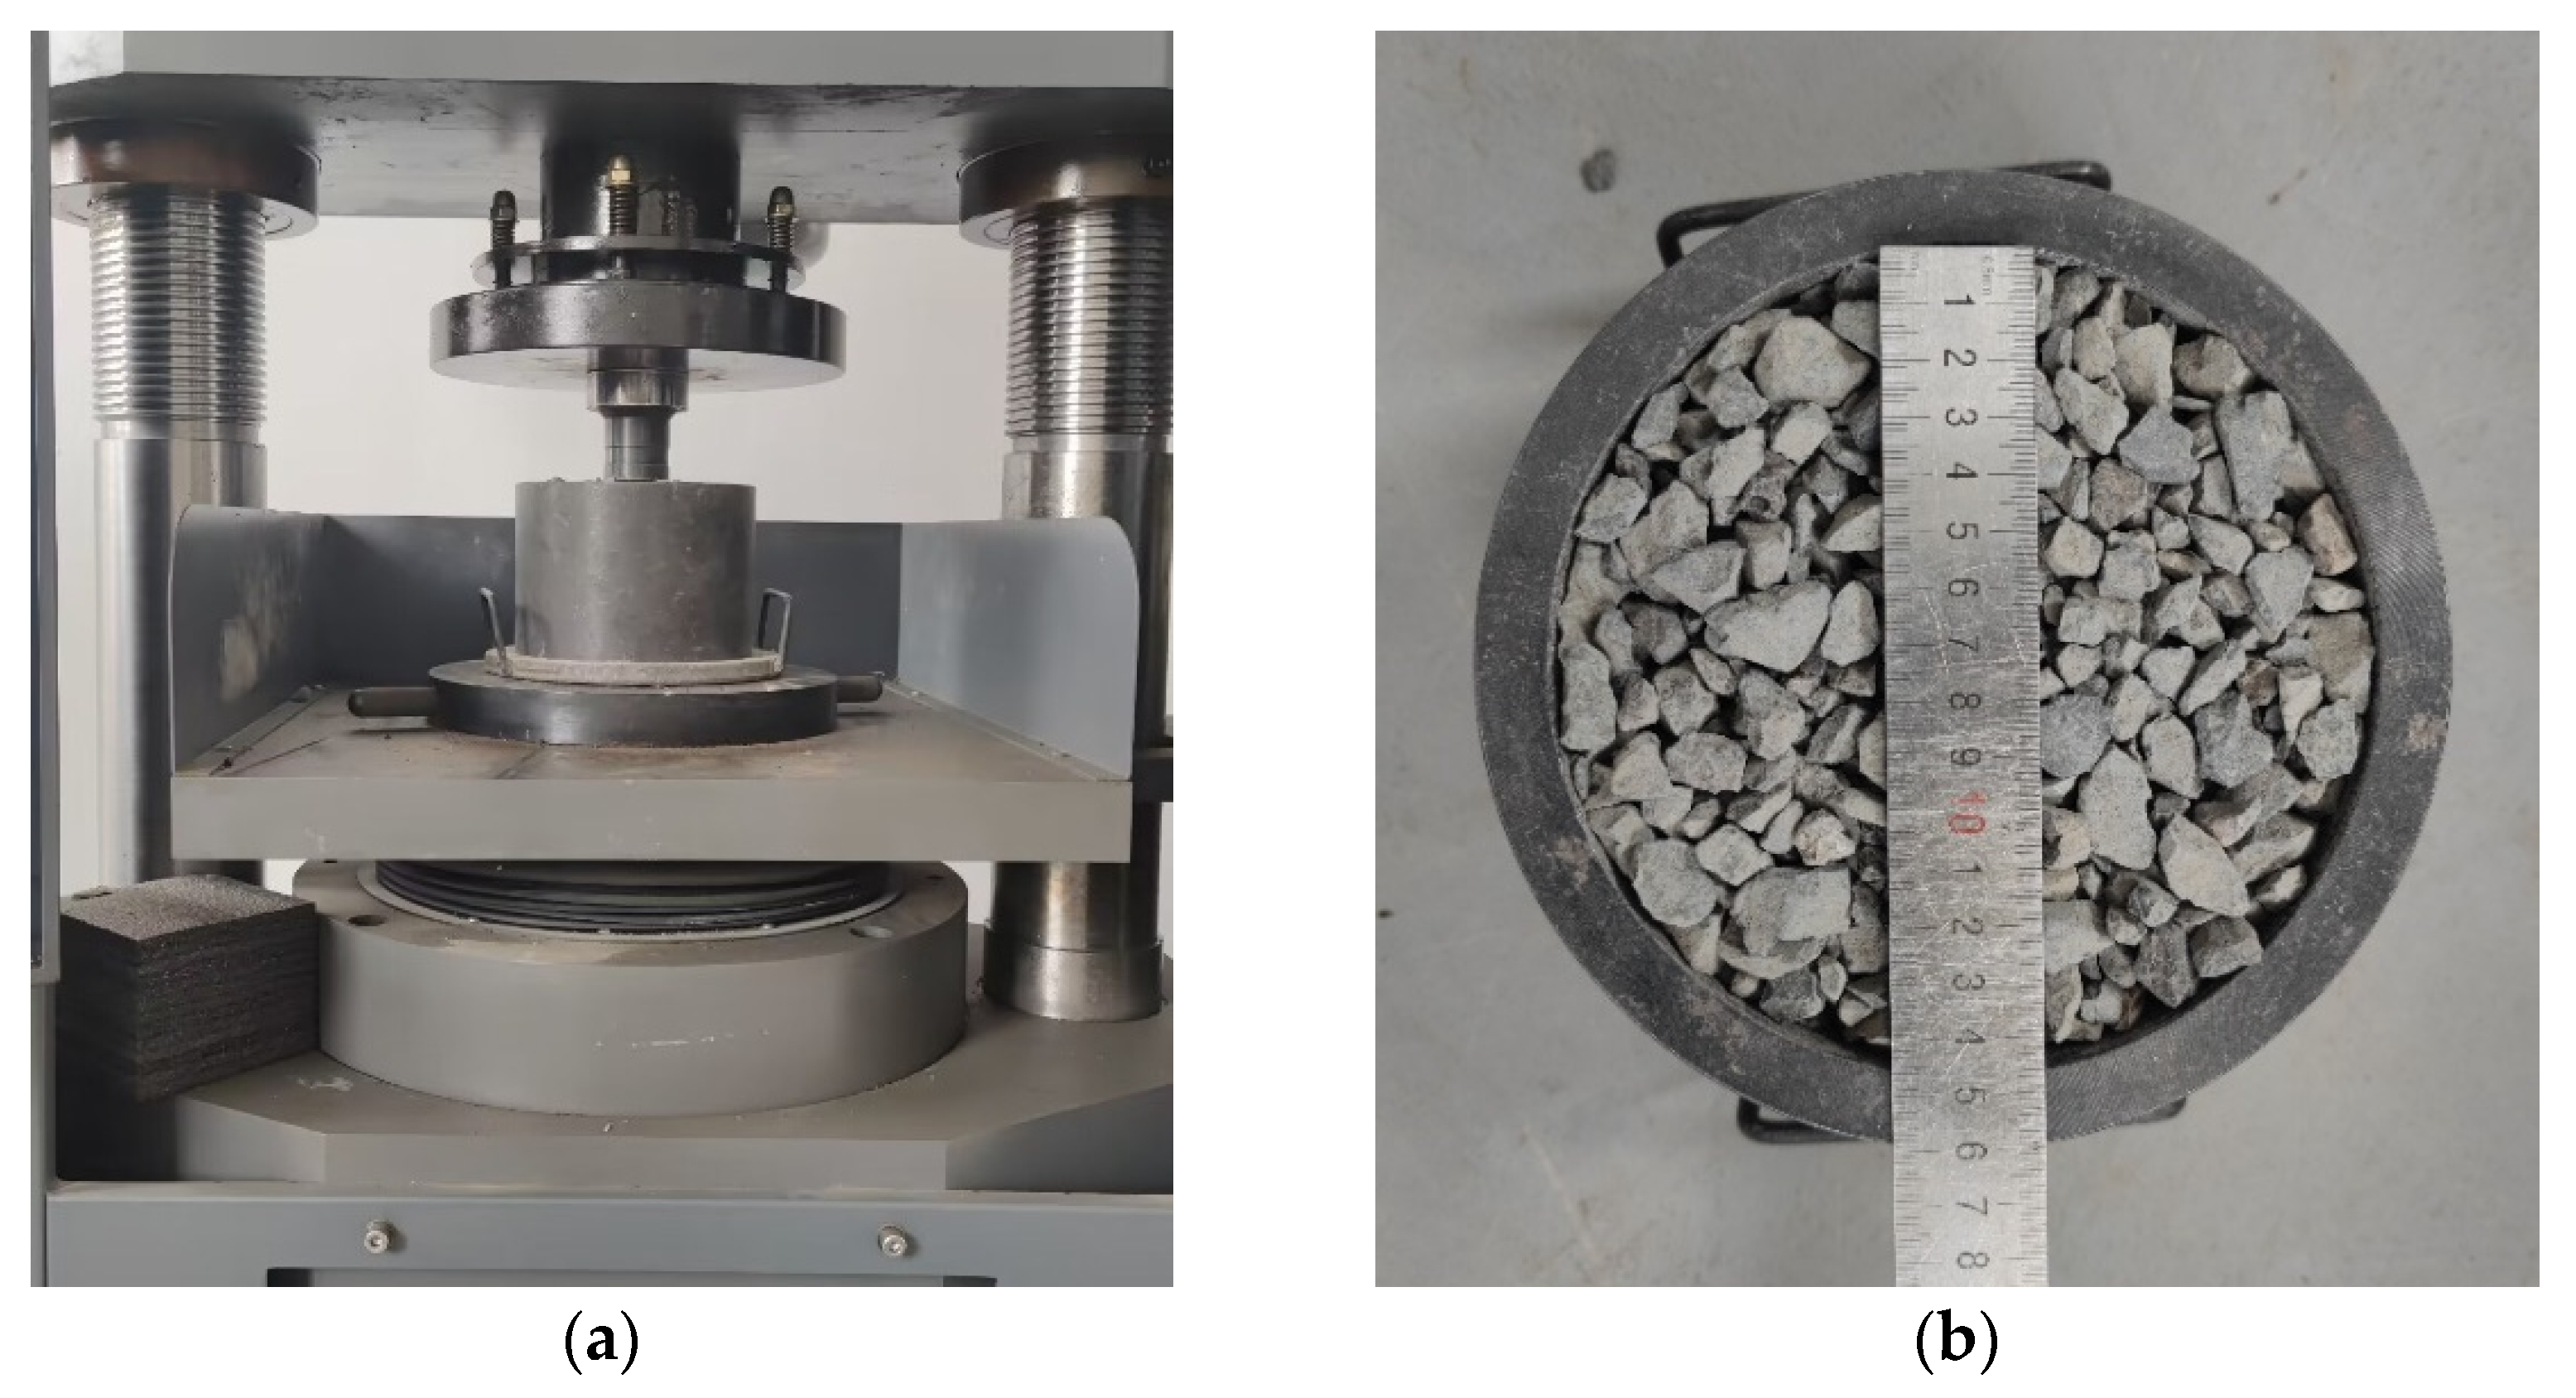
VCADRC under dry compaction conditions, 10 kg of aggregate was prepared according to each of the three gradations, sieved to remove the part below 2.36 mm, loaded into a capacity bucket in three layers, and compacted 25 times in each layer. The final compaction density
γs was determined, and
VCAmix could be calculated from the volume parameters of different gradations in the gyratory compaction process. Based on the results of the gyratory compaction process, the variation curve of ΔVCA during compaction was obtained, as shown in
Figure 9.
In general, there are some deviations in the parallel samples of the three different gradation types of asphalt mixtures. However, the results from the same type of asphalt mixture are consistent. As the loose mixture is gradually compacted, ΔVCA decreases rapidly and then tends to level off in the decay stage. ΔVCA curve and the compactness ratio curve show the corresponding three-stage development characteristics. With the increasing compaction, a low limit value of ΔVCA exists for all three graded mixes, representing the ultimate skeleton contact state of different gradations.
3.3. Compaction Characteristics under Rotational Compaction Conditions
From the analysis above of the void ratio and skeleton contact state of the asphalt mixture during the rotational compaction process, it can be seen that, from the perspective of controlling the void ratio of the design target, the three representative grades only have the minimum compaction times that meet the upper limit of the compaction to 24% void target. It is difficult to achieve the lower limit of the 18% void target under a reasonable compaction time.
Suppose 1.05, 1, and 0.95 are used as the ΔVCA characteristic values to judge the initial contact, full embedding, and overpressure of the skeleton during the compaction process, respectively. In that case, it can be seen from the test results that, in the process of rotational compaction, the compaction times of the three types of gradation reaching the initial contact state range are 10–24 times for Z grade, 7–12 times for C grade, and 19–36 times for X grade. The number of compaction times needed to achieve the full incubation state range from 30 to 80 times for the Z grade, 18 to 34 times for the C grade, and 61 times for the X grade (only one specimen was reached). The number of compaction times needed to reach the overpressure state range were 106 times for the Z grade (only 1 sample was reached), 56–107 times for the C grade, and no sample was reached for the X grade. It can be seen from the above that, according to the order of initial contact–full extrusion–overpressure three-skeleton contact development order, the C-grade mixture can quickly reach the three contact states due to the thick grading, resulting in the rapid formation of the skeleton. The X-grade mixture has more aggregate content below 2.36 mm particle size, resulting in more compaction times needed to reach the initial contact of the skeleton. It is quite challenging to achieve the full embedding state from the data, so it is almost impossible to reach the overpressure state with enough compaction times. The number of compaction times needed for the Z grade to reach the three contact states is in between, and it may enter an overpressure state if it reaches more than 106 contact states after reaching the initial skeleton contact state.
In general, according to the void ratio and skeleton strength range available in the project, the three typical graded porous mixtures were at the bottom limit for number of compactions; except for the overpressure state of the mixture using the C grade, the other two graded types cannot reach the overpressure state, and the X-grade mixture is even more challenging to achieve the full embedding state. From the comprehensive requirements of the two types of indicators, the number of times to meet the initial 24% void ratio requirement is 42–82 times for C grade, 20–50 times for Z grade, and 16–32 times for X grade. It can be seen from
Figure 4 that the C grade has reached the full embedding state when corresponding to the compaction number range-overpressure state, the X grade only enters the initial contact state when corresponding to the compaction number range. The Z grade match reaches the initial contact—full embedding state when corresponding to the compaction number range, which can be regarded as the ideal state of the three.
In summary, for different types of graded mixtures, if the design target value is provided, there are corresponding compaction standards for porosity and ΔVCA. Still, there are specific differences in the compaction standards corresponding to the two indicators of porosity and ΔVCA. Therefore, it is not reasonable to give a compaction number standard or range broadly, it should not be representative, and it is necessary to determine the compaction standard from the design target value.
The porosity–ΔVCA correlation curve during rotational compaction was plotted as shown in
Figure 10. It can be seen that, although there are different degrees of discreteness in the compactness curve, porosity curve, and ΔVCA curve, the porosity–ΔVCA curve of the three different gradation types forms three straight lines with different slopes, which have an apparent linear correlation.
Therefore, for the gradation selection of porous asphalt mixture, the basic rotational compaction data can be obtained through an initial pressure test under a small sample size. Then, the porosity–ΔVCA curve can be plotted. Through this curve, the void ratio requirements and the angle factors of the best skeleton compaction state can be comprehensively considered, and the target void value of asphalt mixture suitable for this type of gradation can be determined. Then, the compaction number can be determined according to the target void ratio–compaction number curve.
3.4. Skeleton Penetration Curves
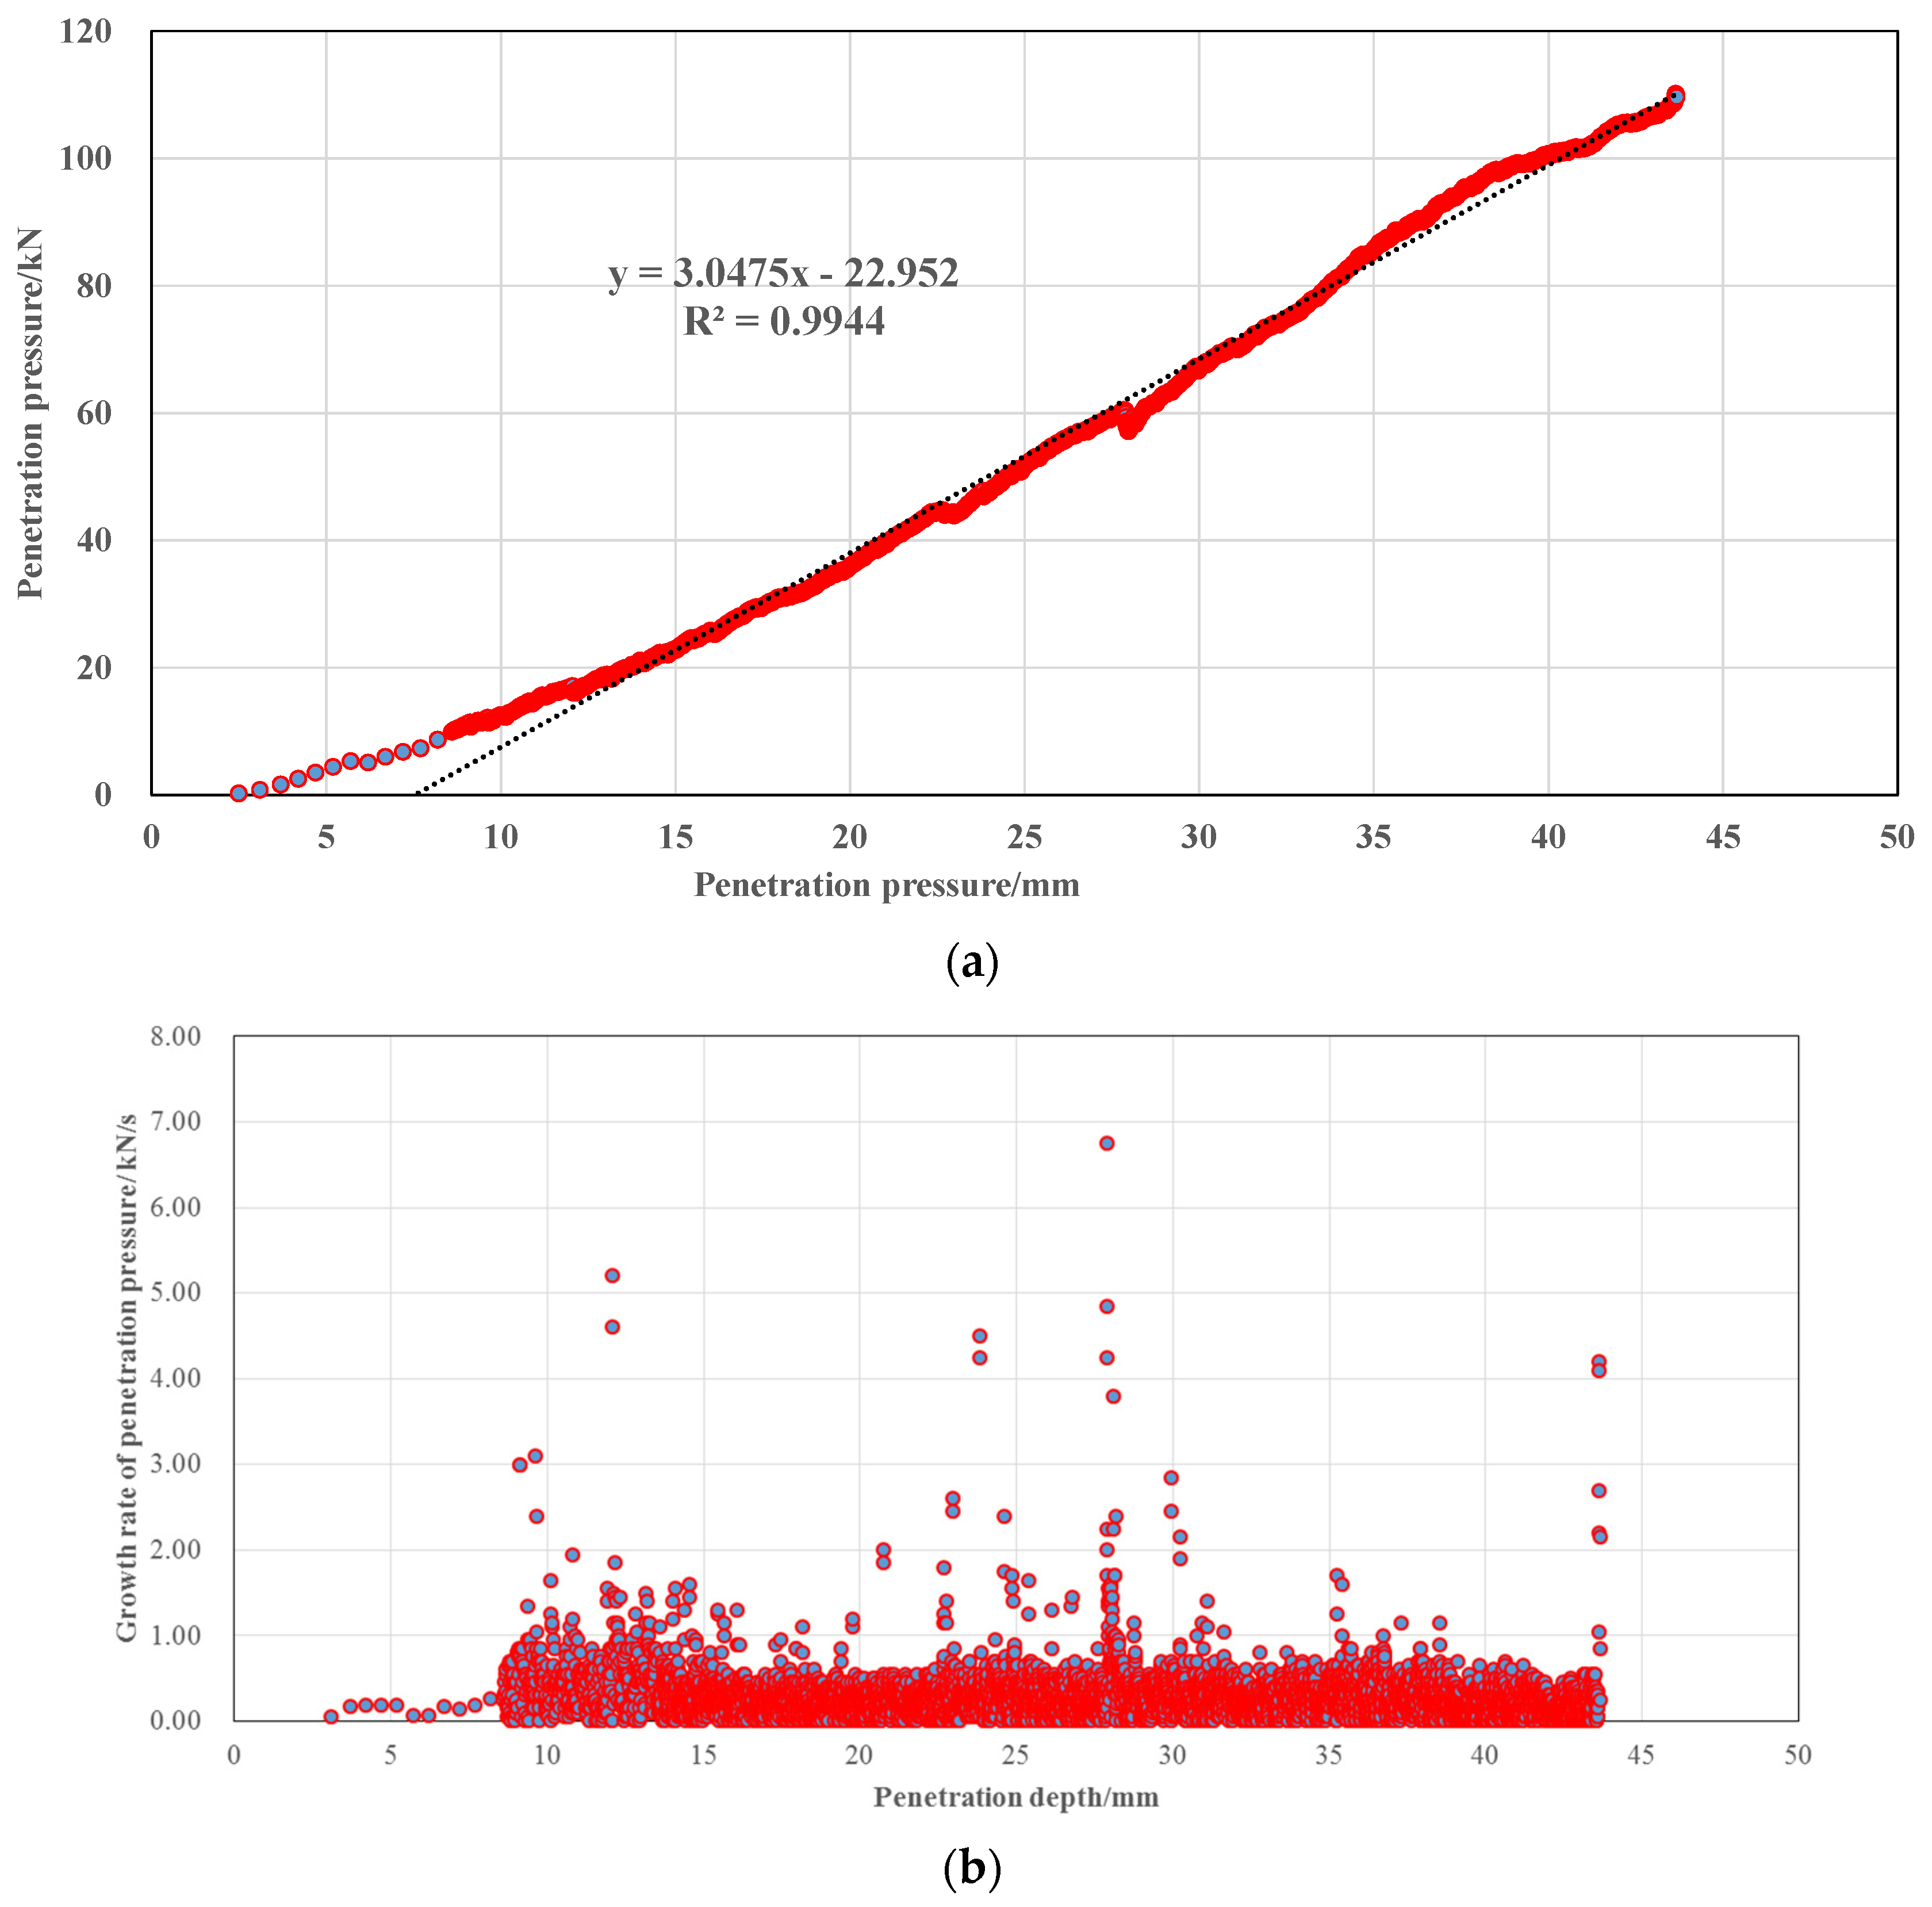
The analysis of the test results shows that the curve of penetration pressure (F)–penetration depth (l) presents obvious phased characteristics. Especially after calculating the corresponding growth rate curve, the whole test process presents three stages, as seen in
Figure 11. In the first stage, the penetration pressure (F) increases rapidly with penetration depth (l), and the aggregate rapidly reaches the skeleton contact stable state in this stage. In the second stage, the growth rate of penetration pressure fluctuates with the rapid extrusion and stabilization of the aggregate after crushing, but the overall change is nearly linear and stable. In the third stage, the growth rate of penetration pressure suddenly increases, and the skeleton contact state reaches an unstable state.
For the identification of the above three stages, some research results have proposed to use the error value between the fitting value and the measured value to determine the point position of
Lps and
Lst. However, this method is related to the performance of the test sample and the test method. To reduce the impact of factors such as the performance of the test sample, this study uses the pressure increment rate (Δ
Fi) of a single data point to distinguish the growth stages. The calculation method is shown in Equation (6):
where
Fi is the penetration pressure at the record point of
i, and
ti is the loading time corresponding to the record point of
i. The Δ
Fi curve of each sample during the infiltration process can be obtained using Equation (6), and the three stages can be distinguished from the sudden change in Δ
Fi value.
In the skeleton model of the penetration test, the critical point (
Fst) when damage appears and the work done by the internal pressure head penetration in the second stage (the penetration energy,
Ep) were used as the skeleton strength evaluation indices.
Ep is calculated as shown in Equation (7).
where,
f(
L) is the penetration pressure function,
L is the penetration depth,
Lps is the penetration depth at the end of the first stage, and
Lst is the penetration depth at the end of the second stage.
3.5. Skeleton Strength Evaluation
3.5.1. Broken Rate
Through the penetration tests, the breakage rate of each particle size can be obtained, as shown in
Figure 12. Overall, the breakage rate of the Z gradation is relatively large, followed by that of the C-gradation. The X-gradation is a fine gradation, and the skeleton is not embedded in the penetration process, so the breakage rate is relatively low. The aggregates with obvious breakage rate are three characteristic particle sizes of 2.36 mm, 4.75 mm, and 9.5 mm. The particle size of 4.75 mm in the three gradations has the largest breakage rate, followed by the particle sizes of 9.5 mm and 2.36 mm.
The passing rates of the size of 9.5 mm of three gradations were 55.9% (C gradation), 55.6% (Z gradation), and 61.1% (X gradation). From the perspective of breakage rate, the 9.5 mm aggregate obviously bears the bearing role of the first-level skeleton structure. With the increase in the passing rate of 9.5 mm, the breakage rate of this grade decreases and is significantly affected by the passing rate of this grade. The breakage rate of the 9.5 mm aggregate is more sensitive to the impact of the passing rate. With the increase in pressure in the process of penetration, some of the particles were crushed into the next level or the next sub-grade. It is generally recommended that a passing rate of this grade of 55–60% is more reasonable.
The passing rates of the size of 4.75 mm for the three gradations were 21.32% (C gradation), 22.99 (Z gradation), and 27.5 (X gradation). From the perspective of breakage rate, the 4.75 mm size aggregate mainly bears the bearing role of the secondary skeleton structure. The specification requires that the 4.75 mm particle size passing rate range is 10–30%. The more the selected value deviates from the median value, the weaker the skeleton role. The breakage rate of 4.75 mm decreases with the increase in passing rate of 4.75 mm, but it is not significant. When the 4.75 mm passing rate is selected near the median value, it can bear more secondary skeleton bearing capacity. It is suggested that the passing rate of 4.75 mm should be determined by 20 ± 3%. At the same time, the difference between the passing rates of 4.75 mm and 4.75–2.36 mm should be reduced as much as possible in the mixture design, so that the passing rate from 4.75 mm to 2.36 mm shows appropriate gap-gradation characteristics.
The passing rate of the size of 2.36 mm of three gradations is 10.92 (C gradation), 14.11 (Z gradation), and 17.13 (X gradation). From the perspective of breakage rate, the 2.36 mm aggregate also bears the bearing role of secondary skeleton structure. With the increase in passing rate of 2.36 mm, the breakage rate of 2.36 mm decreases. This means that the passing rate of 2.36 mm should not be too high, otherwise it will affect the formation of the skeleton. Generally, the range of 9–14.5% can be considered.
3.5.2. Skeleton Feature Parameters
According to the pressure–depth curve of each test, the three-stage parameter identification is completed, and the characteristic point data are shown in
Table 2.
From the test results of penetration pressure (F) and penetration energy (Ep), it can be seen that the skeleton strength of C gradation is not the largest. Aggregate of Z gradation with good skeleton structures has a stronger skeleton strength response than the other two types of gradation. Z gradation has the largest Ep and the largest Fps and Fst in each stage. The Z gradation has the maximum Ep and the maximum Fps and Fst at each stage.
The passing rate of the main characteristic size of 2.36 mm in these three gradations is 10.92%, 14.11%, and 17.13%, respectively. From
Figure 13,
Ep has no correlation with the passing rate of this sieve size, and the changing trend of
Fps and
Fst is similar to that of the penetration energy
Ep, which does not change with the increase in passing rate of 2.36 mm. The two-stage penetration pressure values of C gradation are less than that of X gradation, but both are far less than the characteristic values of the penetration pressure of Z gradation. The penetration energy (
Ep) of C gradation is greater than that of X gradation, and both are also far lower than that of Z gradation. It can be seen that the initial skeleton of C gradation is formed very quickly because it belongs to coarse gradation. A low penetration pressure can cause it to form a stable skeleton. Therefore, the pressure value of both stages is the smallest and the penetration energy value is only greater than that of finer-graded X-gradation.
The above characteristic parameters reflect the overall skeleton strength characteristics and are related to the overall aggregate gradation. Z gradation near the median value has better skeleton strength compared with the other two gradations in terms of penetration energy and two-stage penetration pressure.


 ,
, 


