1. Introduction
The Uma Expressway runs from north to south through the four provinces of Inner Mongolia, Ningxia, Gansu and Qinghai in China, which is an important part of the transportation construction in the western part of China, and it is also of great significance for the economic development and construction of the western region. At the same time, the Uma Expressway is also the first expressway across the Tengger Desert in China. The Tengger Desert region has a harsh natural environment and experiences frequent wind and sand disasters, so it is particularly important to adopt a suitable sand prevention and sand fixation system to ensure the normal operation of the highway under the wind and sand environment. The prevention and control methods of wind and sand disasters are mainly divided into chemical sand control, biological sand control and mechanical sand control [
1]. Chemical sand control is harmful to the permeability of the ground and needs to be replaced regularly; biological sand control is costly and slow to take effect [
2], especially in the extremely dry environment of the Tengger Desert region with a low survival rate; and mechanical sand control is widely used in desert expressways because of its low natural condition requirements and strong environmental adaptability [
3,
4,
5].
A wide range of scholars have studied sand barriers mainly through numerical simulation and wind tunnel tests. Packwood [
6] derived a calculation model suitable for barriers with different porosities from a theoretical perspective. Ding P [
7] started from the direction of the inclination angle of the insert plate and found that the inclination angle was positively correlated with the efficiency of sand control on windward slopes. Zhang N [
8] found that windbreak barriers could effectively reduce the wind speed at windward slopes through particle tracking velocimetry (PTV) studies. Li K [
9] studied different types of sand barriers and found that high vertical sand barriers have a better sand-blocking effect. Saif A M. [
10] simulated the performance of the windbreak fences of fixed or variable porosity. The highest rate of wind speed reduction along the optimal turbulence behavior was found to occur at a wind speed of 13 m/s. Xiong Z W. [
11] used numerical simulations to analyze the influence of sand barriers’ location on sand control effectiveness, and they showed that concrete sand barriers 40–45 m apart can effectively reduce the sediment deposition on railroads when the maximum wind speed is 18 m/s. Huang N. [
12] used discrete particle tracking to simulate wind-driven particle movement along the barriers. It was concluded that the transport rate of sand particles between the barriers was greatly reduced. Zhang C. [
13] found that high vertical barriers were effectively and extensively used to control sand flow near the bed.
Different scholars have also carried out rich research on the porosity of sand barriers, among which McClure S [
14] combined wind tunnel tests and numerical simulations to determine the wind protection performance of porous wind fence under different parameters such as its height and porosity. LV P. [
15] used a Reynolds’ equation to calculate the pressure field around the wind fence with different heights and porosities, and they analyzed the relationship between the pressure field, the porosity of the fence (i.e., β coefficient), the height of the fence and the free oncoming wind speed. The relationship between the pressure field, fence porosity (i.e., β coefficient), fence height, and free-flowing wind speed was analyzed. Zhang K [
16] studied different porosities of HDPE sheet sand barriers found that the wind protection efficiency of HDPE sheet sand barriers was optimal at a porosity of 50%. Bitog J P. [
17] simulated and investigated the quantitative effect of wind fences on wind speed and found that a fence with a porosity of 0.2 had the highest wind speed reduction of about 75%. Razi P [
18] studied the movement of grains and their deposition on a railroad track. The performance of different porous fences in terms of porosity and size was also evaluated. It was found that a 1 m height 20% porosity barrier positioned 3 m from the railroad could effectively prevent sediment deposition. Huang L M. [
19] simulated the effect of porous fences with inhomogeneous porosity on the flow field and found that the upper zero-porosity fence and the lower 30% porosity fence had the highest shading effect. Xu B [
20] investigated the machine sand barrier system and found that the machine sand barrier with grass squares had the best spinning sand barrier effect. Jing S [
21] used ANSYS to numerically simulate the change of wind flow field around the sand barrier dyke under different parameters and proposed an integrated wind and sand fixation system with sand fixing bricks.
The Uma Expressway is mainly surrounded by deserts, and the wind direction is variable and unstable, so its mechanical sand control system mainly adopts double rows of high vertical sand barriers. Double rows of high vertical sand barriers can block the incoming wind in all directions and fix the sand particles in the square grid, which is an important measure for expressway sand control and sand fixation in the desert area. At present, many scholars have conducted research on the changes of the wind and sand flow field around the high vertical sand barriers as well as the pore rate of the sand barriers. However, there are few studies on the flow field analysis of a single group of sand barriers under different parameters. The article primarily uses Fluent, through numerical simulation and on-site research, to study the influence of different heights and spacing on the sand barrier performance of vertical sand barriers, so as to provide a theoretical basis for the optimization of the sand barrier system of the Uma Expressway and at the same time provide data support for the ecological sustainability of the surrounding areas of the Uma Expressway.
2. Research Methodology
2.1. Overview of the Study Area
The total length of the section of the Uma Expressway from Qingtongxia to Zhongwei is 123 km, of which 18 km are deep in the hinterland of the desert, running through the Tengger Desert. It is located in a region with a harsh natural environment, large temperature difference in climate, abundant sand sources and frequent sandstorms, with mainly southeast wind in the spring and summer and northwest wind in the fall and winter; among which the wind is the strongest in the summer, with a maximum average wind speed of 4.88 m/s and a minimum average wind speed of 1.02 m/s. There are 47 d of strong winds exceeding level 6 (wind speed ≥ 10.8 m/s) on average throughout the year, and the maximum wind speed is 18 m/s. The section of the Uma Expressway from Qingtongxia to Zhongwei is 123 km long, of which 18 km is deep in the desert hinterland, running through the Tengger Desert.
The fixed height of the sand barriers in the study area is 1.2 m, the width is laid around the desert road with a total length of 18 km, and the sand barriers are shown in
Figure 1. Uma has a high speed limit around the main deployment of two rows of high vertical sand barriers; these sand barriers have a column and fiberglass mesh composition, in which the column at the lower end of the buried depth is 50 cm, and the fiberglass mesh porosity is 20%.
2.2. Wind and Sand Two-Phase Flow Modeling
2.2.1. Assumptions of the Model
(1) We do not consider the compressibility of the fluid.
In this paper, the wind speed is selected as the maximum wind speed of 18 m/s in the study area; at this time, the Mach number of the wind and sand flow is less than 0.3, and it can be considered that the wind and sand flow is an incompressible fluid.
(2) We do not consider the collision between sand particles.
In the study of sand flow as a discrete phase, the proportion of sand particles is small, mainly by gravity and drag force, and the collision between sand particles can be ignored.
(3) There is no consideration of sand energy loss.
As an incompressible fluid, the energy loss is small, so the energy loss caused by physical and chemical changes between sand particles is not considered in this study.
2.2.2. Model Building and Meshing
There is wind and sand movement in nature; the sand particles are subject to a variety of forces and produce a three-dimensional movement phenomenon, because the wind and sand in the movement are mainly subject to gravity and a drag force. The two forces basically act in the same plane. In the numerical simulation, we can look at the two-dimensional planar problem for calculation. Considering the actual situation of the study area and the research objectives of this paper, ICEM (2021, r1) CFD software is used to construct a two-dimensional simplified model, because this paper mainly studies the change of the flow field around the sand barriers, and the sand barriers are far away from the road base in the actual situation. This paper does not consider the road base model, and it only constructs the sand barriers model. In this study, the two-dimensional simplified model is used, and the height of the sand barriers and the influence of the spacing of the sand barriers are only taken into account in the computational domain.
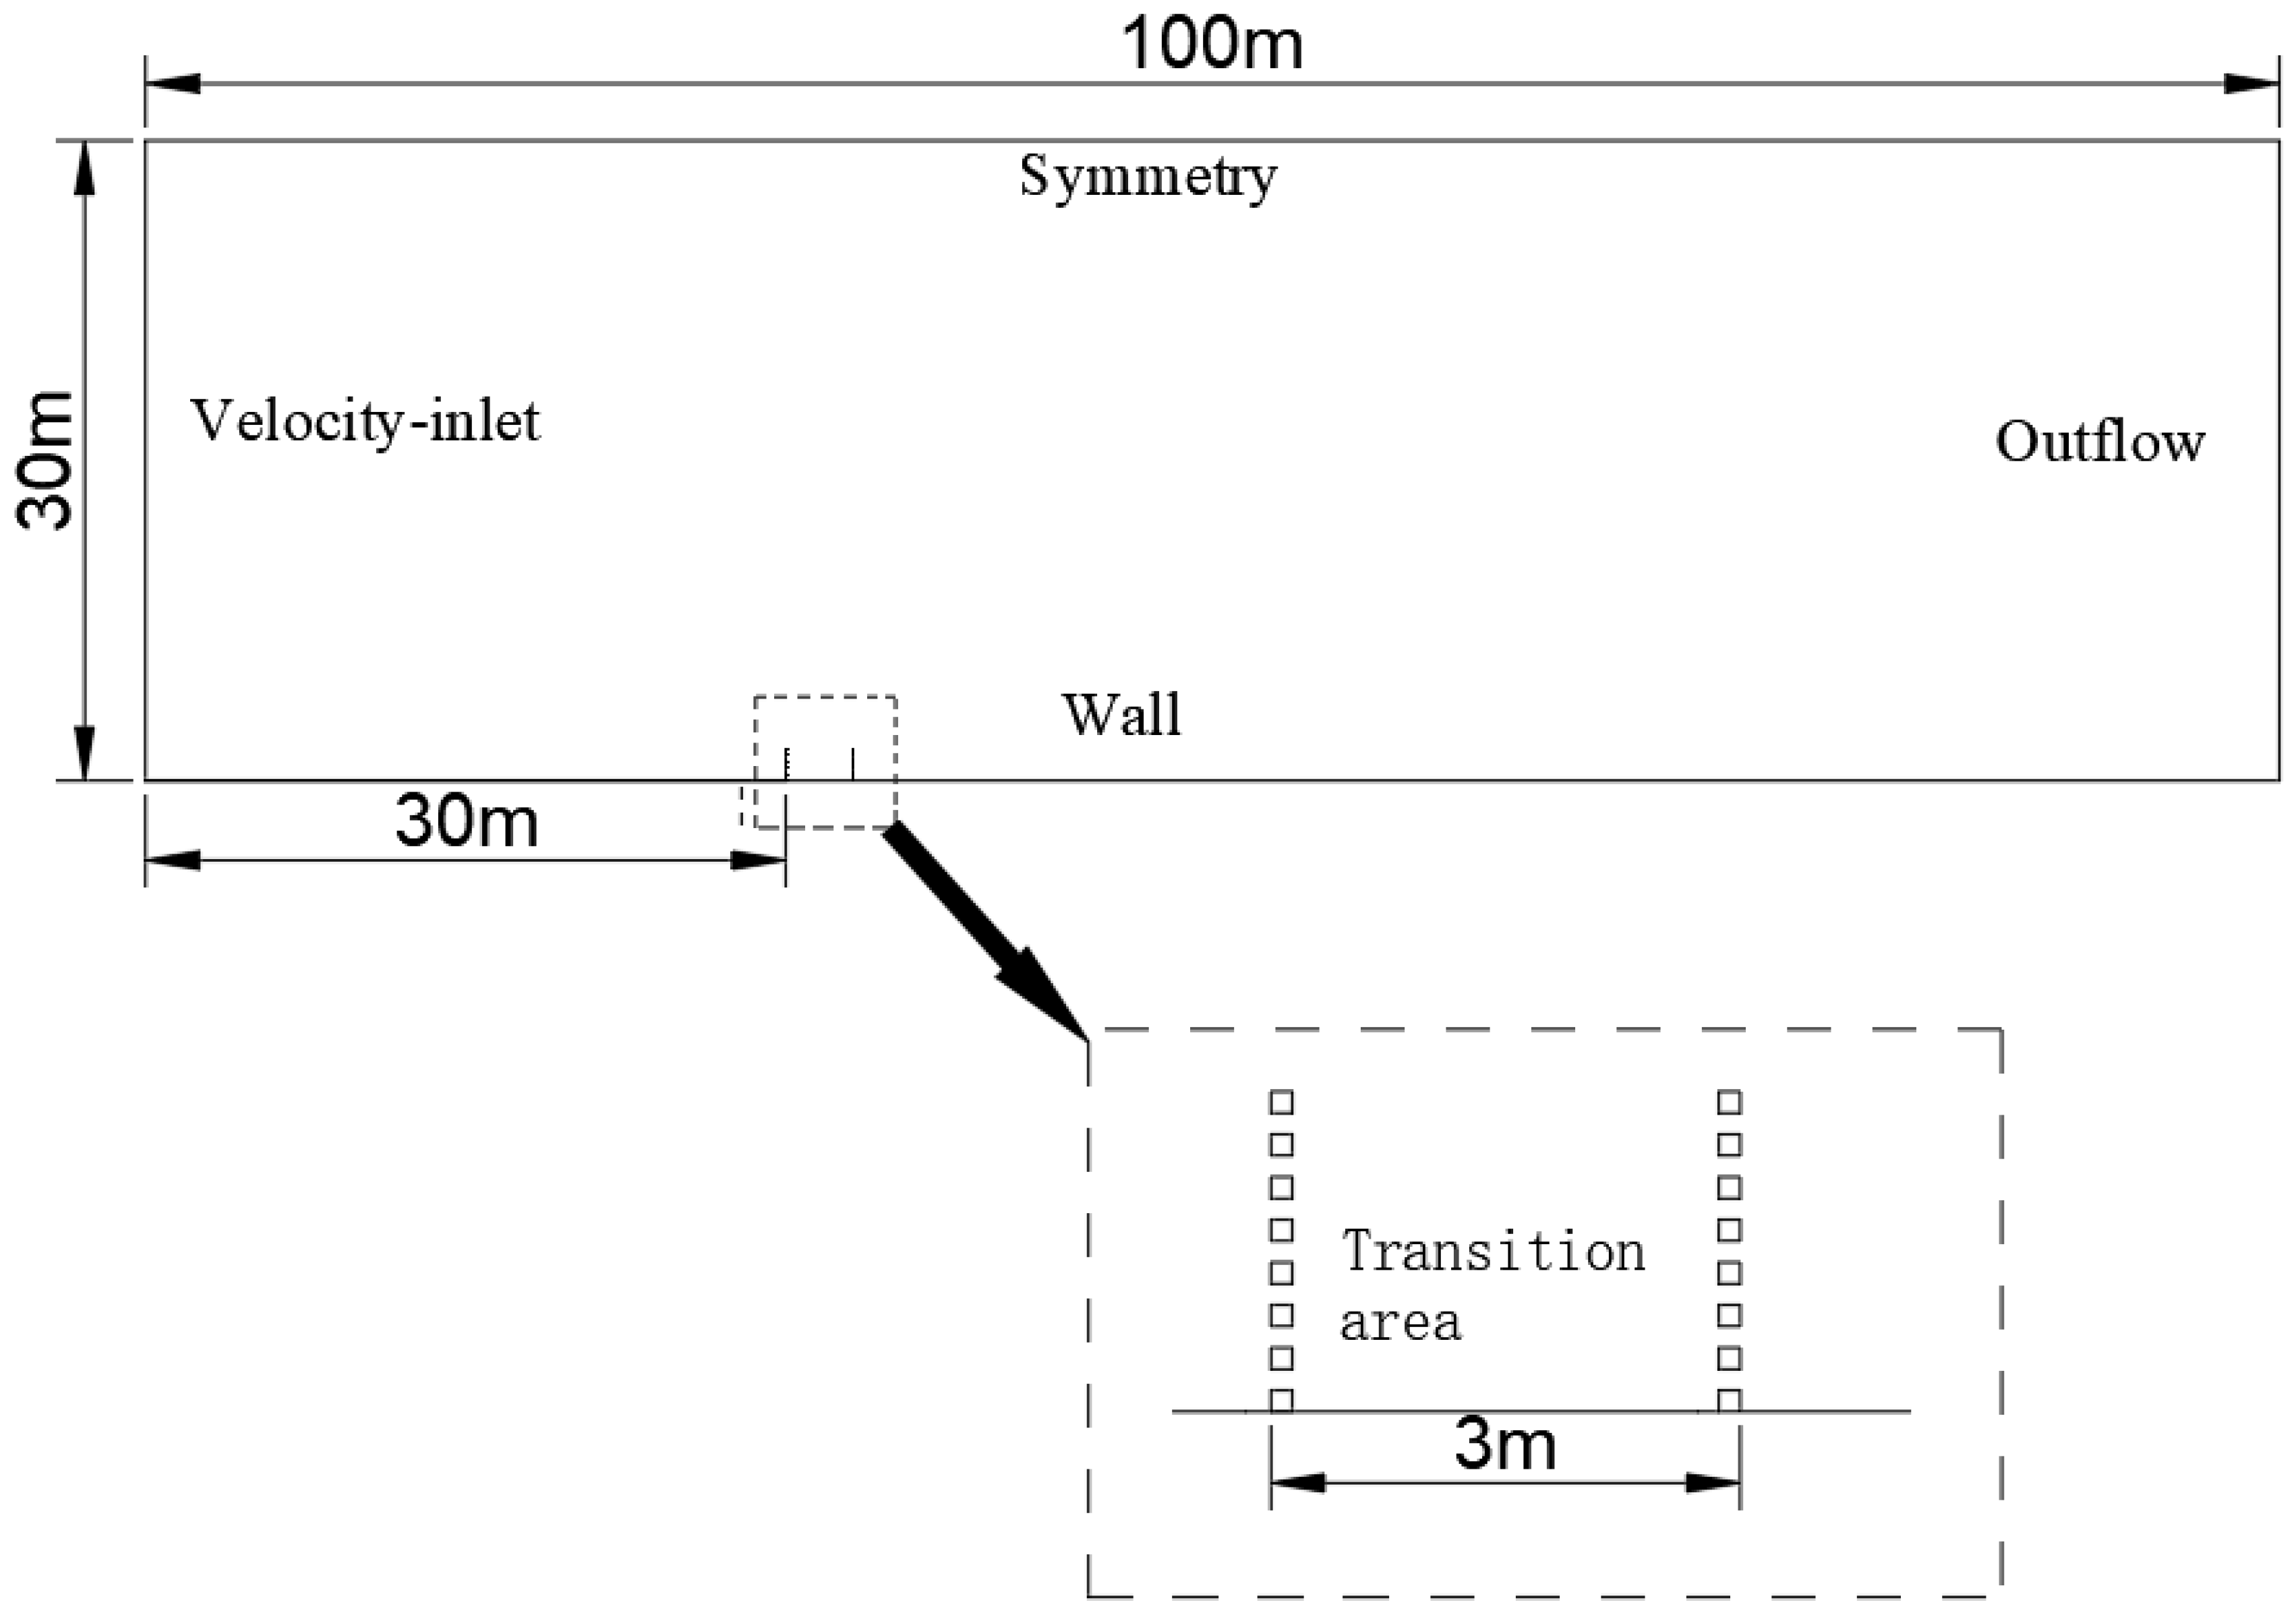
The computational model diagram is shown in
Figure 2. The length of the computational domain is 100 m and the height is 30 m. The first row of sand barriers is located 30 m from the inlet. According to the field study, the porosity of the sand barriers was fixed at 20%.
2.2.3. Meshing
The computational domain grid is structured with a quadrilateral grid. Since the sand particles in the wind–sand movement are mainly concentrated in the near-surface area, the grid is encrypted in the range below the height of the sand barrier to ensure the accuracy of the calculation results. The total number of grids is 5.6 × 10⁵, the qualities of the grids are all greater than 0.99, and the grid angles are all 90°, which meets the quality standards of the computational grid.
2.2.4. Boundary Conditions and Selection of Calculation Parameters
The left side of the computational domain is the air inlet, the boundary condition is set as the velocity inlet (Velocity inlet), the velocity contour line of the inlet boundary is selected as the following formula, the boundary condition of the right outlet is set as the free outlet (Outflow), the top is set as the symmetric boundary (Symmetry), the sand plane and the sand barriers are set as the non-slip wall (Wall), the roughness is K (the average diameter of the sand grains), and the roughness height is 0.02 m [
22,
23,
24]. The calculated parameters are shown in
Table 1.
2.2.5. Wind Protection Efficiency
The windproof efficiency is an important index reflecting the weakening effect of sand barriers on wind and sand flow. The larger the windbreak efficiency is, the more obvious the reduction in sand flow by sand barriers, and the formula is shown in (1) [
7,
25,
26].
2.2.6. Verification of the Reliability of the Results
In order to verify the accuracy of the numerical simulation results, the actual data of the experimental section of the Uma Expressway located in Zhongwei, Ningxia, were sampled and analyzed. It is located in an area with an intricate distribution of sand dunes and abundant sand sources, which can reflect the wind and sand hazard of the Wuma Expressway to the greatest extent. The data were sampled in mid-March, when there is a large temperature difference and frequent sand and wind activity. The sand barriers were selected as the sample area, with a height of 1.5 m and a spacing of 3 m, and the wind speed was measured at 0.6 m from the ground level at 1 m intervals on the windward side, transition area and leeward side of the sand barriers.
3. Results and Analysis
3.1. Characteristics of the Flow Field around the Sand Barrier
In order to obtain the movement pattern of the wind and sand flow after passing through a single set of high vertical sand barriers, the flow field around the sand barriers was studied and analyzed. The wind speed is 18 m/s, the sand barrier is 1.5 m high and the distance between the sand barriers is 3 m. The simulation analysis was carried out to obtain a cloud diagram of the change of the flow field as shown in
Figure 3. The red color of
Figure 3 represents the maximum wind speed, and the blue color represents the minimum wind speed. It can be seen from
Figure 3 that the sand barrier significantly changes the movement path of the sand flow, forming several airflow zones around the sand barrier. As the sand flow moves from left to right at the entrance, the speed changes from green to light blue as the distance to the sand barrier decreases, representing a decreasing wind speed, which drops to a minimum when it reaches the sand barrier (obstructed deceleration zone). As the height of the sand barrier rises, the color changes from green to yellow, representing an increasing wind speed, which reaches a maximum above the sand barrier (over the barrier acceleration zone). The color of the sand barrier transition zone changes from top to bottom between light blue and dark blue, which means that the wind speed in this zone changes several times. This changes is mainly due to the return flow of gas near the ground, which causes eddies in the sand barrier transition zone. The overall speed of the airflow is also low at this time, which is one of the main areas of sand accumulation (turbulent sand accumulation zone). After the second row of sand barriers, the color changes from blue to yellow. At this time, the airflow is gradually reduced by the influence of the sand barriers, and the wind speed gradually increases to the initial wind speed (stable recovery zone).
3.2. Analysis of Flow Field around Sand Barriers with Different Spacing
A sand barrier height of 2.0 m and four sand barrier transition zone intervals of 1 H, 2 H, 3 H and 4 H were selected (H is the height of the sand barrier). These intervals are located 30 m from the wind and sand inlet, in a wind field with a wind speed of 18 m/s, to study its influence on the wind and sand flow movement.
3.2.1. Analysis of Wind Speed Variation Characteristics
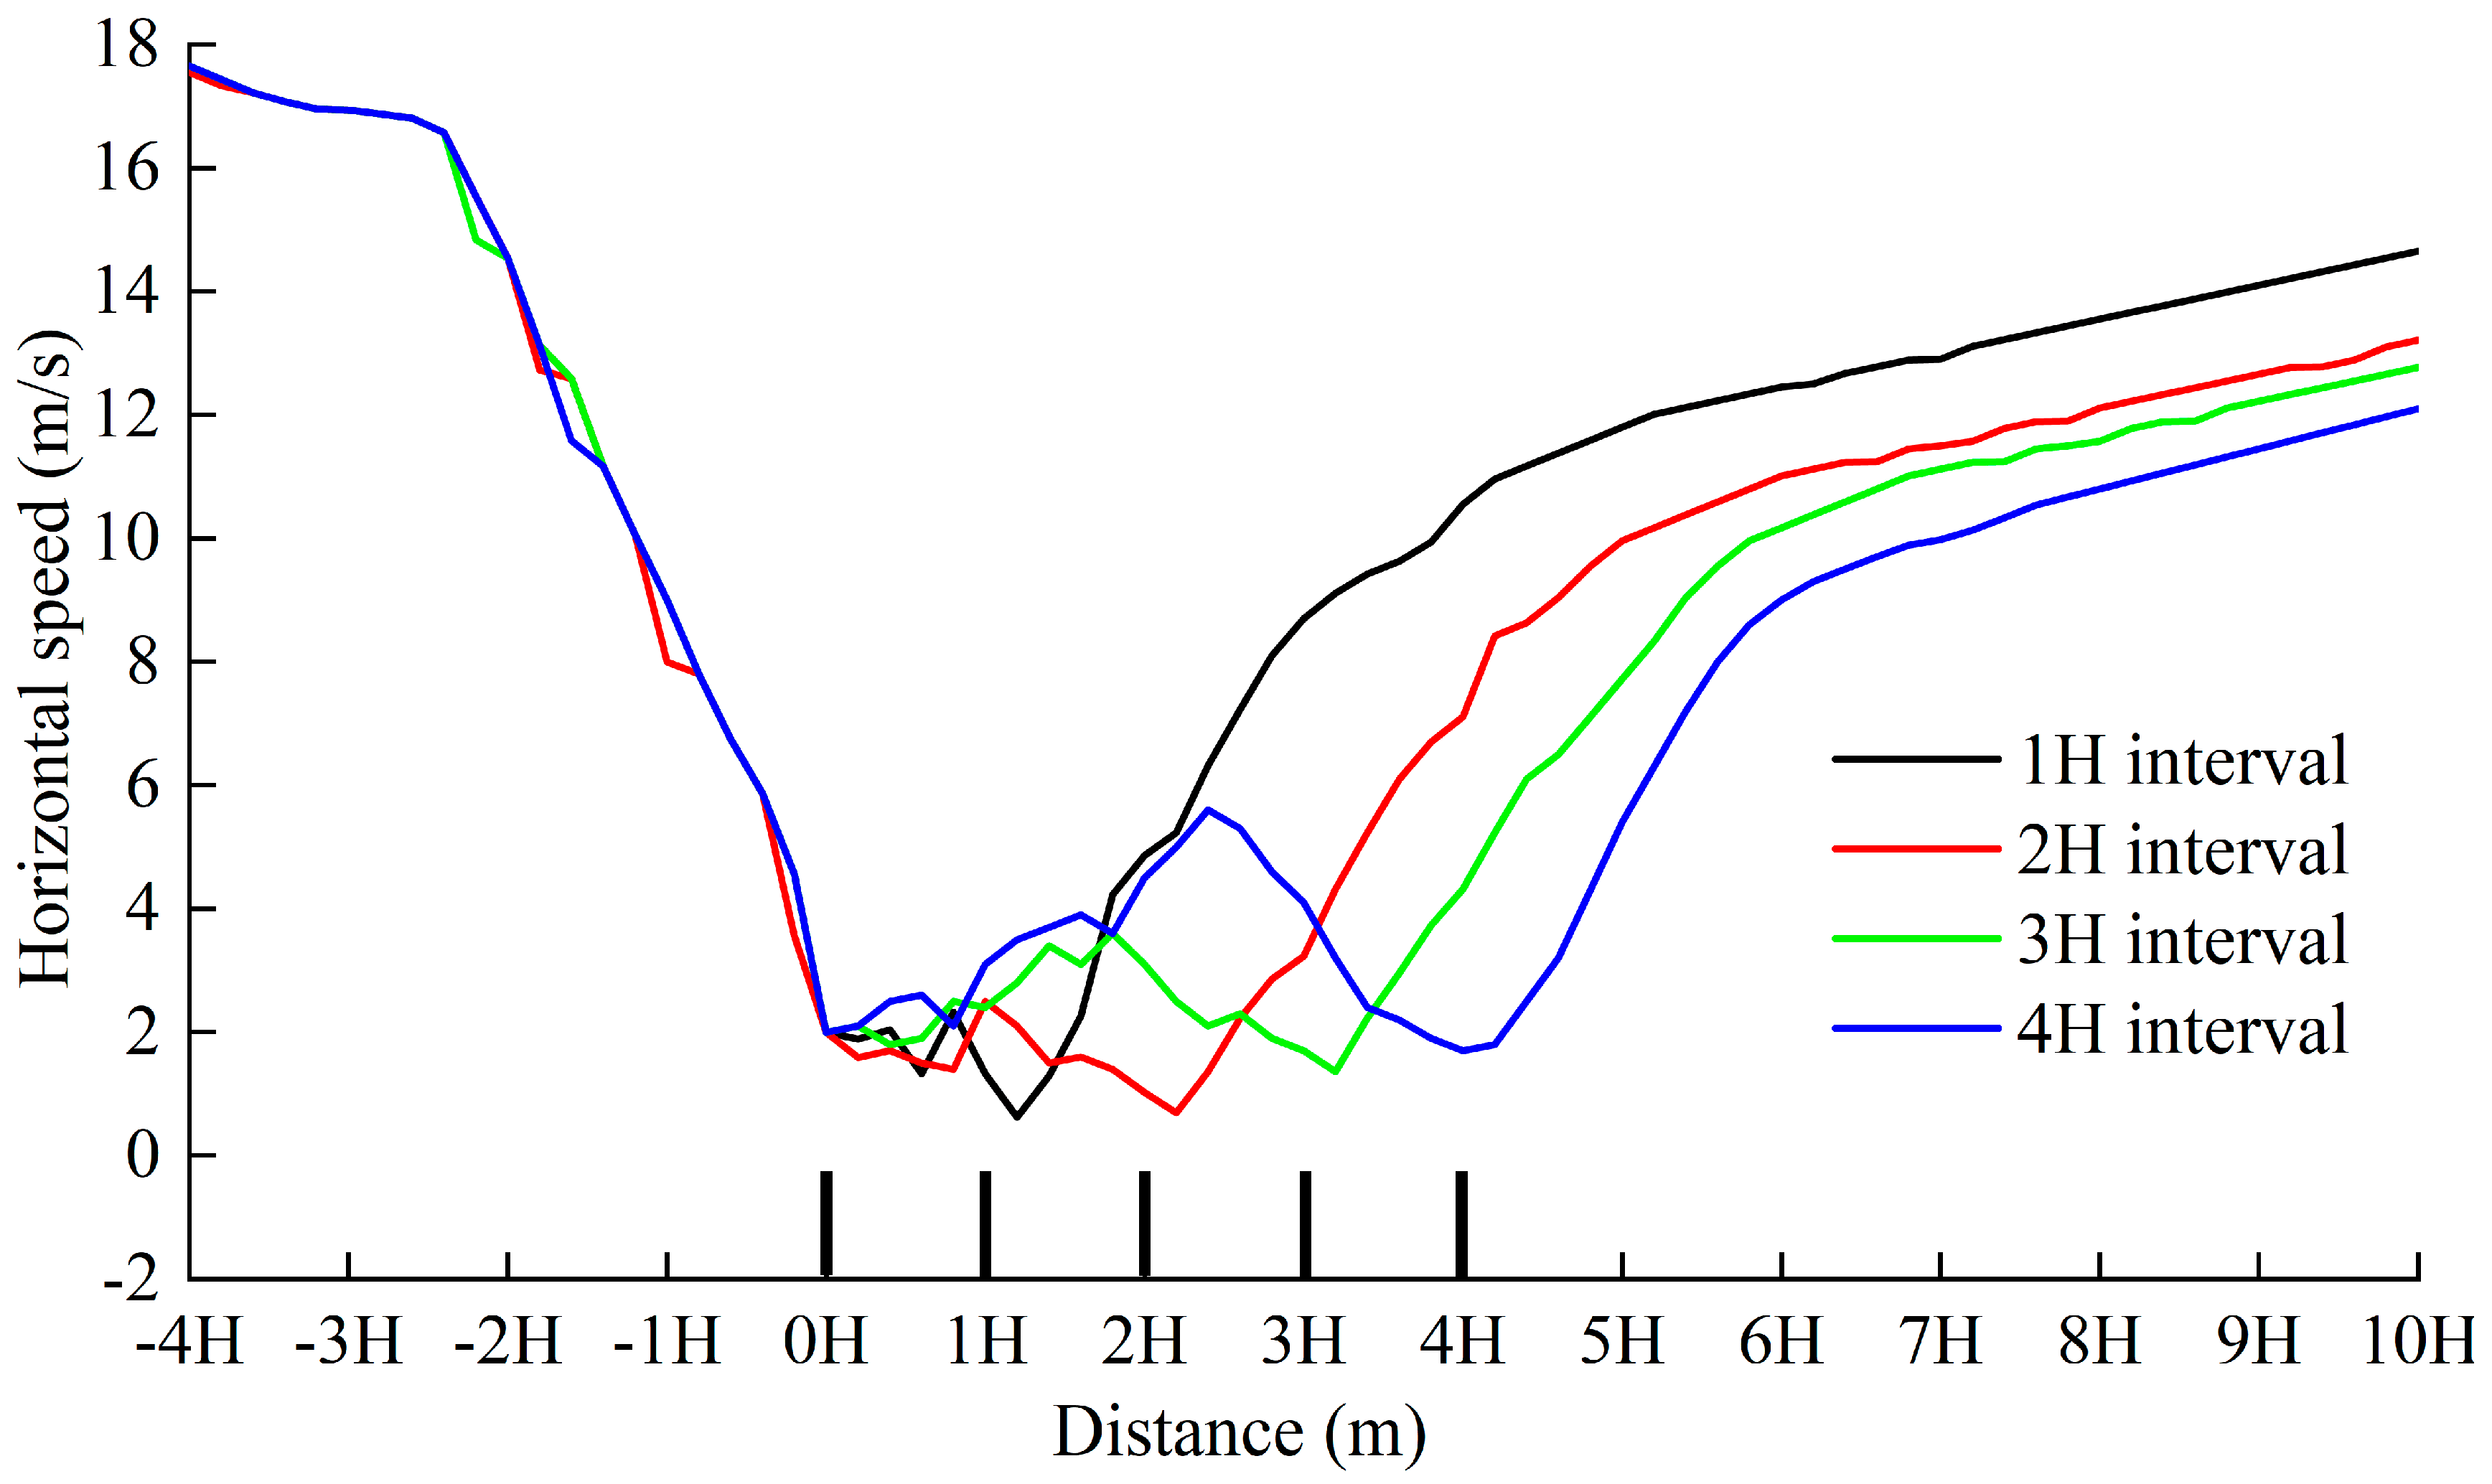
Extracting the wind–sand flow under the obstruction of the four spaced sand barriers, and examining the wind speed variation distribution along the course at 0.6 m from the ground (
Figure 4), it can be found that when the wind–sand flow reaches the four spaced sand barriers, the wind speed drops sharply. When passing through the transition zone of the sand barriers, the wind speed appears to fluctuate continuously due to the influence of the gas vortex, the energy consumption increases and sand particles accumulate in large quantities. After passing through the sand barriers, the wind speed starts to increase gradually until it returns to the initial wind speed, and the overall wind speed changes in a roughly “w” pattern. As can be seen from
Figure 4, before the sand flow reaches the four sand barriers, the wind speed decreases significantly and the speed changes are basically the same, indicating that the first row of sand barriers can effectively play the role of sand blocking, while the interval of sand barriers does not affect the efficiency of the first row of sand barriers to prevent wind and sand. When the sand flow reaches the sand barrier transition zone, the velocity of the airflow varies within 1–2 m/s when the spacing is 1 H, which keeps the wind speed low. When the spacing is expanded to 2 H, the highest wind speed in the transition zone is 2.5 m/s. When the spacing is 3 H and 4 H, it is 3.8 m/s and 5.1 m/s, respectively. It can be found that as the spacing increases, the velocity of the airflow in the sand barrier transition zone also increases, which is not conducive to the deposition of sand particles. The deposition of sand particles in the transition zone is unfavorable, weakening the protective effect of the sand barrier. The velocity of the sand flow decreases for the second time when it passes through the second row of sand barriers, and the wind speed does not change much with the increase in the interval.
3.2.2. Analysis of the Wind Protection Efficiency and Effective Protection Distance of the Sand Barriers
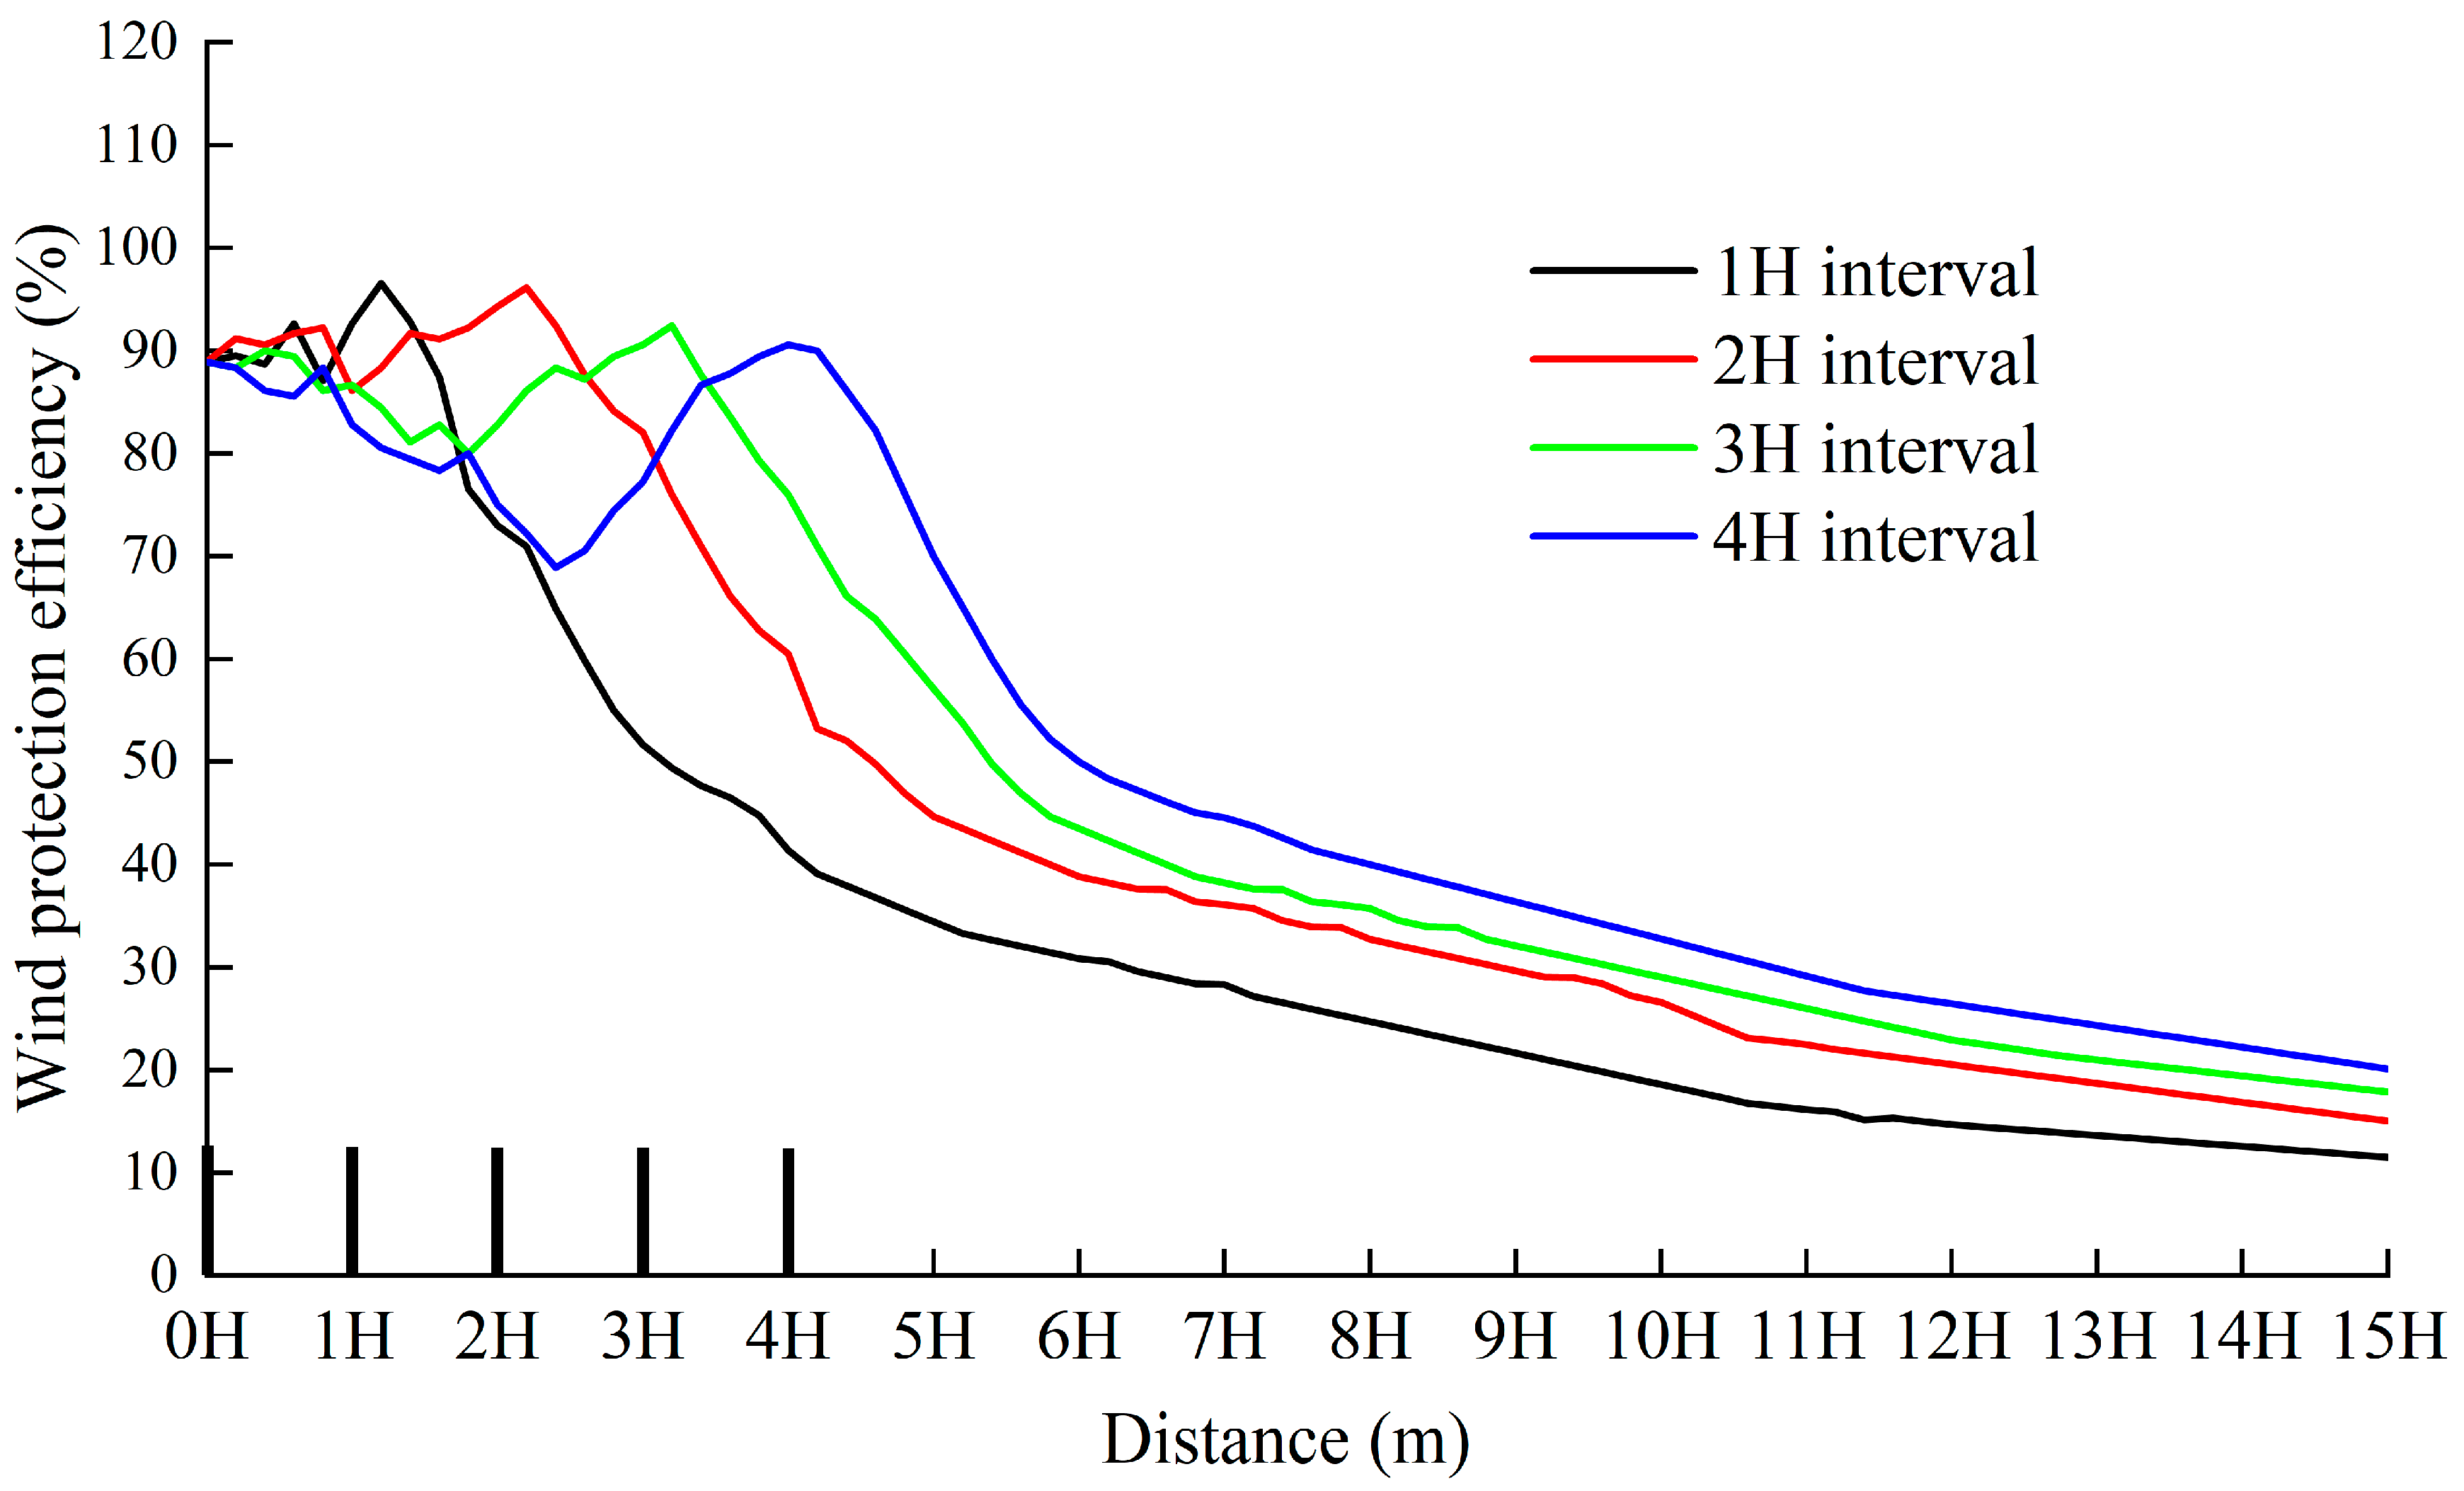
The wind protection efficiency of the four spaced sand barriers in
Figure 5 is basically the same, decreasing with increasing horizontal distance from the sand barrier. The wind protection efficiency of the sand barriers decreases to 50% at 2.2 H from the sand barrier behind the barrier and 20% at 10.3 H from the sand barrier at a spacing of 1 H; at 2 H, the wind protection efficiency decreases to 50% at 2.1 H from the sand barrier and 20% at 10.5 H; at 3 H and 4 H spacing, the wind protection efficiency of the sand barriers decreases to 50% at 2.3 H and 2.1 H from the sand barrier and 20%. The wind protection efficiency of the sand barriers decreased to 20% at 10.7 H and 11.2 H.
In order to better visualize the change in wind protection capacity of the sand barriers when the spacing is changed, the effective protection distance parameter of the sand barriers was used to determine the relationship between the protection effect of the sand barriers and the change in the parameters of the sand barriers. According to previous experience, the effective protection distance of a sand barrier against wind speed is the distance from the sand barrier to below the height of the sand barrier to recover to 0.8 times the entrance wind speed [
15], which is also the distance when the wind protection efficiency is reduced to 20% after the sand barrier. From the analysis in the above paragraph, it can be seen that the distance from the point where the wind protection efficiency of the sand barriers is reduced to 20% to the second row of sand barriers is basically the same for different spacings of sand barriers, but the game protection distance is 11.3 H, 12.5 H, 13.7 H and 15.2 H for 1 H, 2 H, 3 H and 4 H, respectively, due to the different spacings of sand barriers. It can be found that as the spacing of the sand barriers increases, the effective protection distance of the sand barriers also increases.
3.2.3. Analysis of Sand Accumulation Characteristics around Sand Barriers
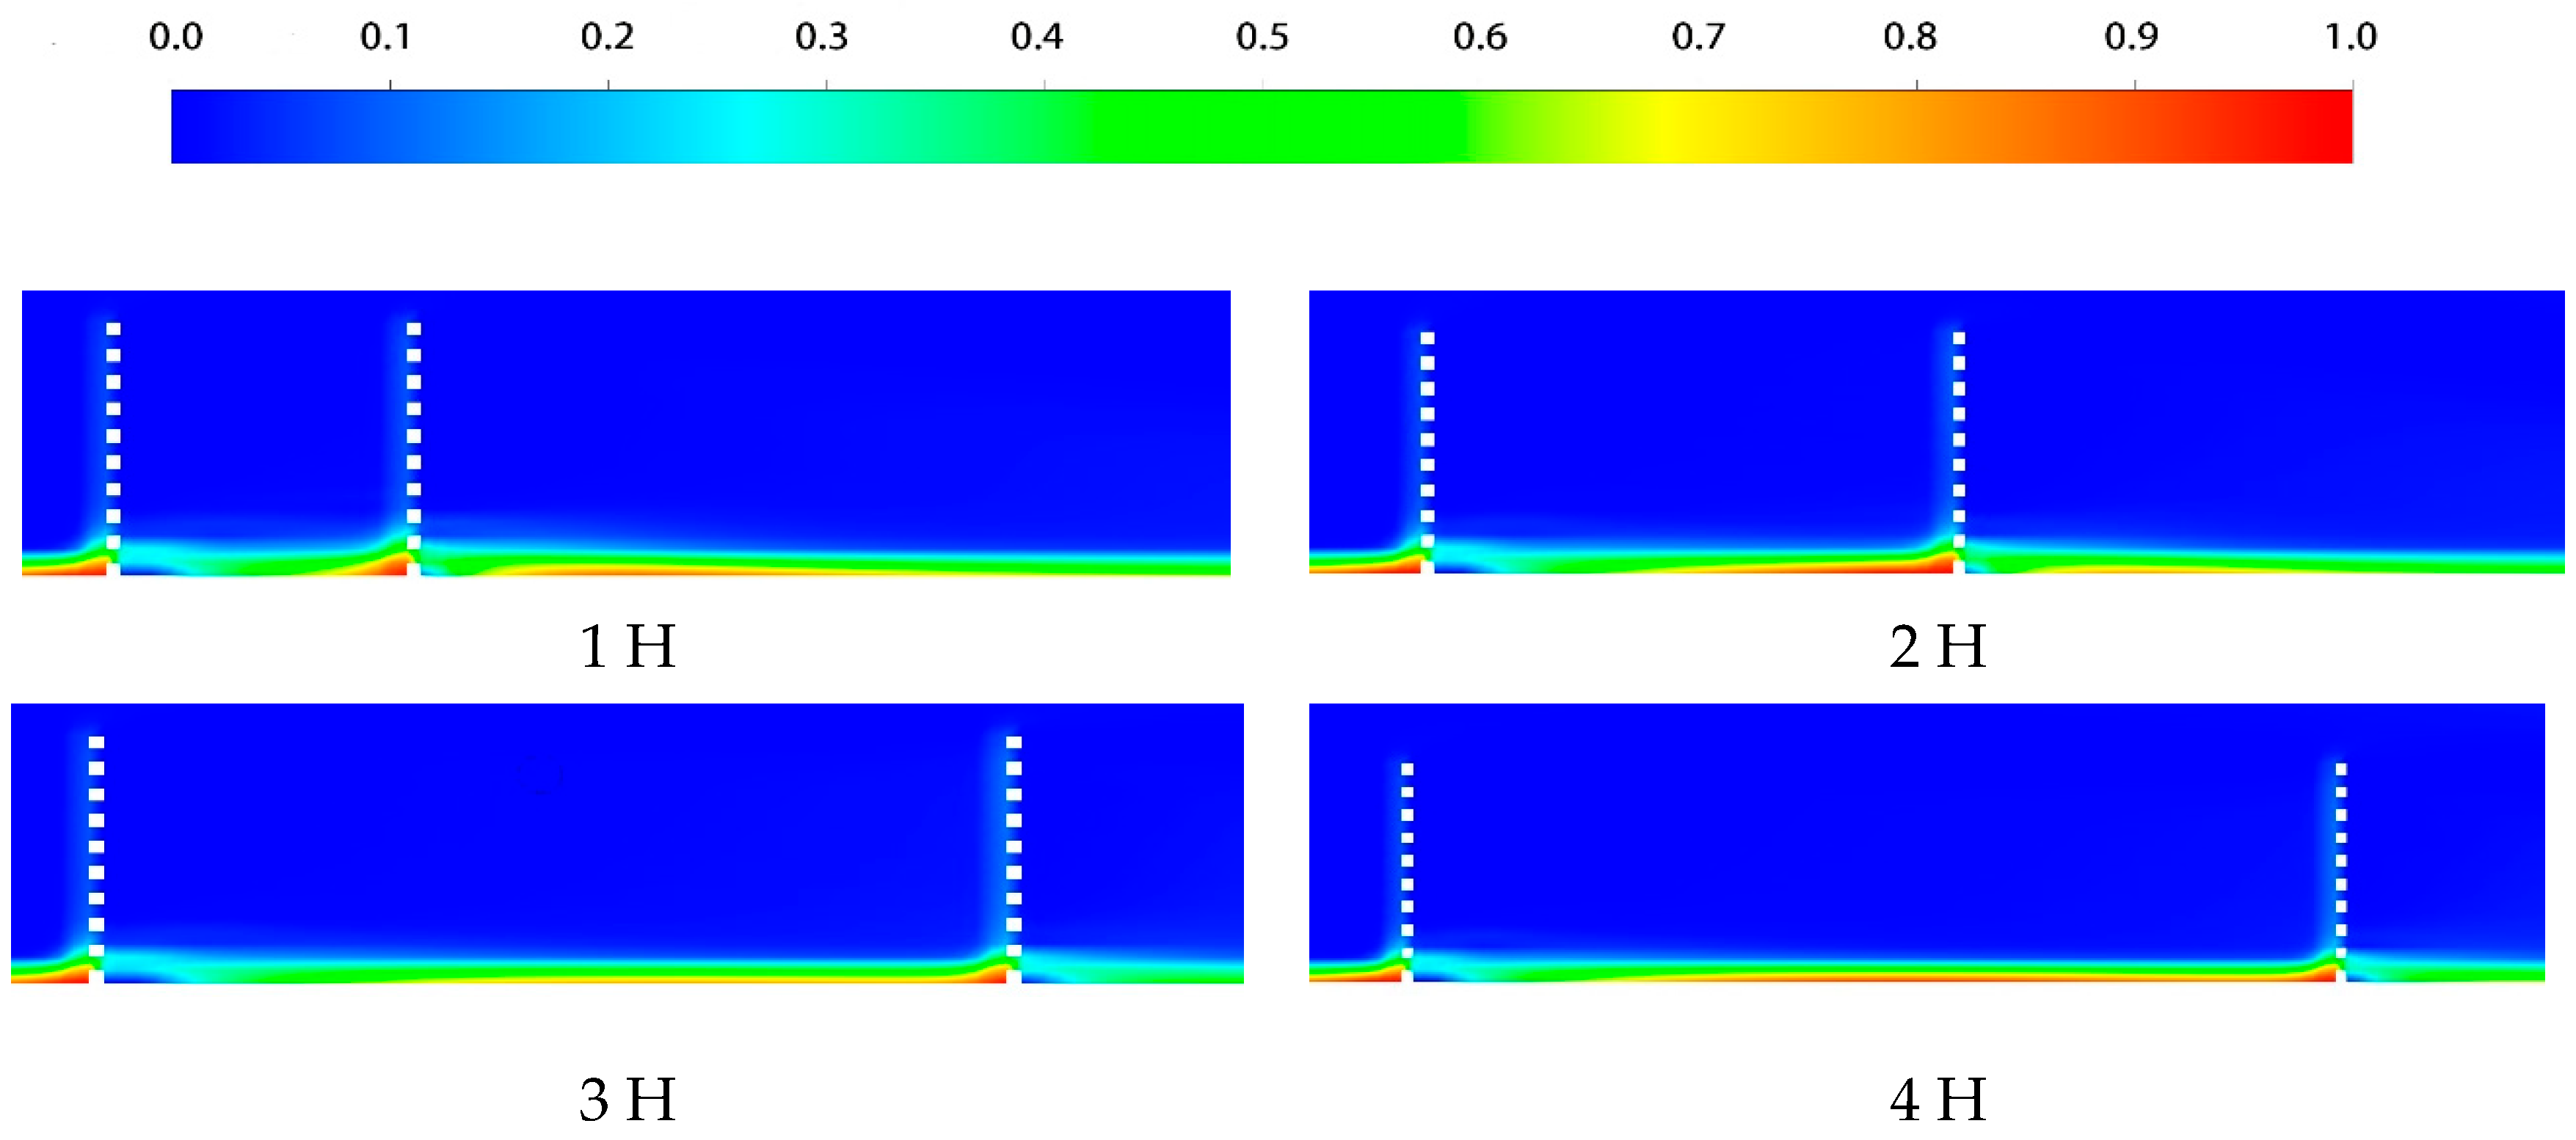
Wind creates the main driving force of sand movement, and the change of wind speed directly affects the deposition of sand particles in the wind–sand flow. As can be seen from
Figure 6, the wind–sand flow blows toward the sand barrier with a wind speed of 18 m/s. After reaching the first row of sand barriers, the sand particles will produce a large amount of accumulation due to the sharp decrease in wind speed. Then, it subsequently blows into the sand barrier transition zone. When the sand barrier interval is 1 H and 2 H, sand particles in the transition zone will accumulate more than 3 H and 4 H interval sand barriers. The main reason for this is that the increase in sand barrier spacing results in higher wind speeds in the sand barrier transition zone, preventing the sand particles from depositing and continuing their forward movement. Subsequently, deposition occurs when the second row of sand barriers is reached and the wind is again blocked. Comparing the sand accumulation around the sand barriers at the 1 H and 2 H intervals, it can be seen that the sand accumulation in the area behind the second row of sand barriers at the 1 H interval is higher than that at the 2 H interval, due to the overlap of the two rows of sand barriers on the wind and sand flow caused by the narrower spacing, resulting in more sand particles being able to cross the second row of sand barriers. As the spacing decreases, the overlap effect becomes more pronounced.
3.3. Analysis of the Flow Field around Sand Barriers of Different Heights
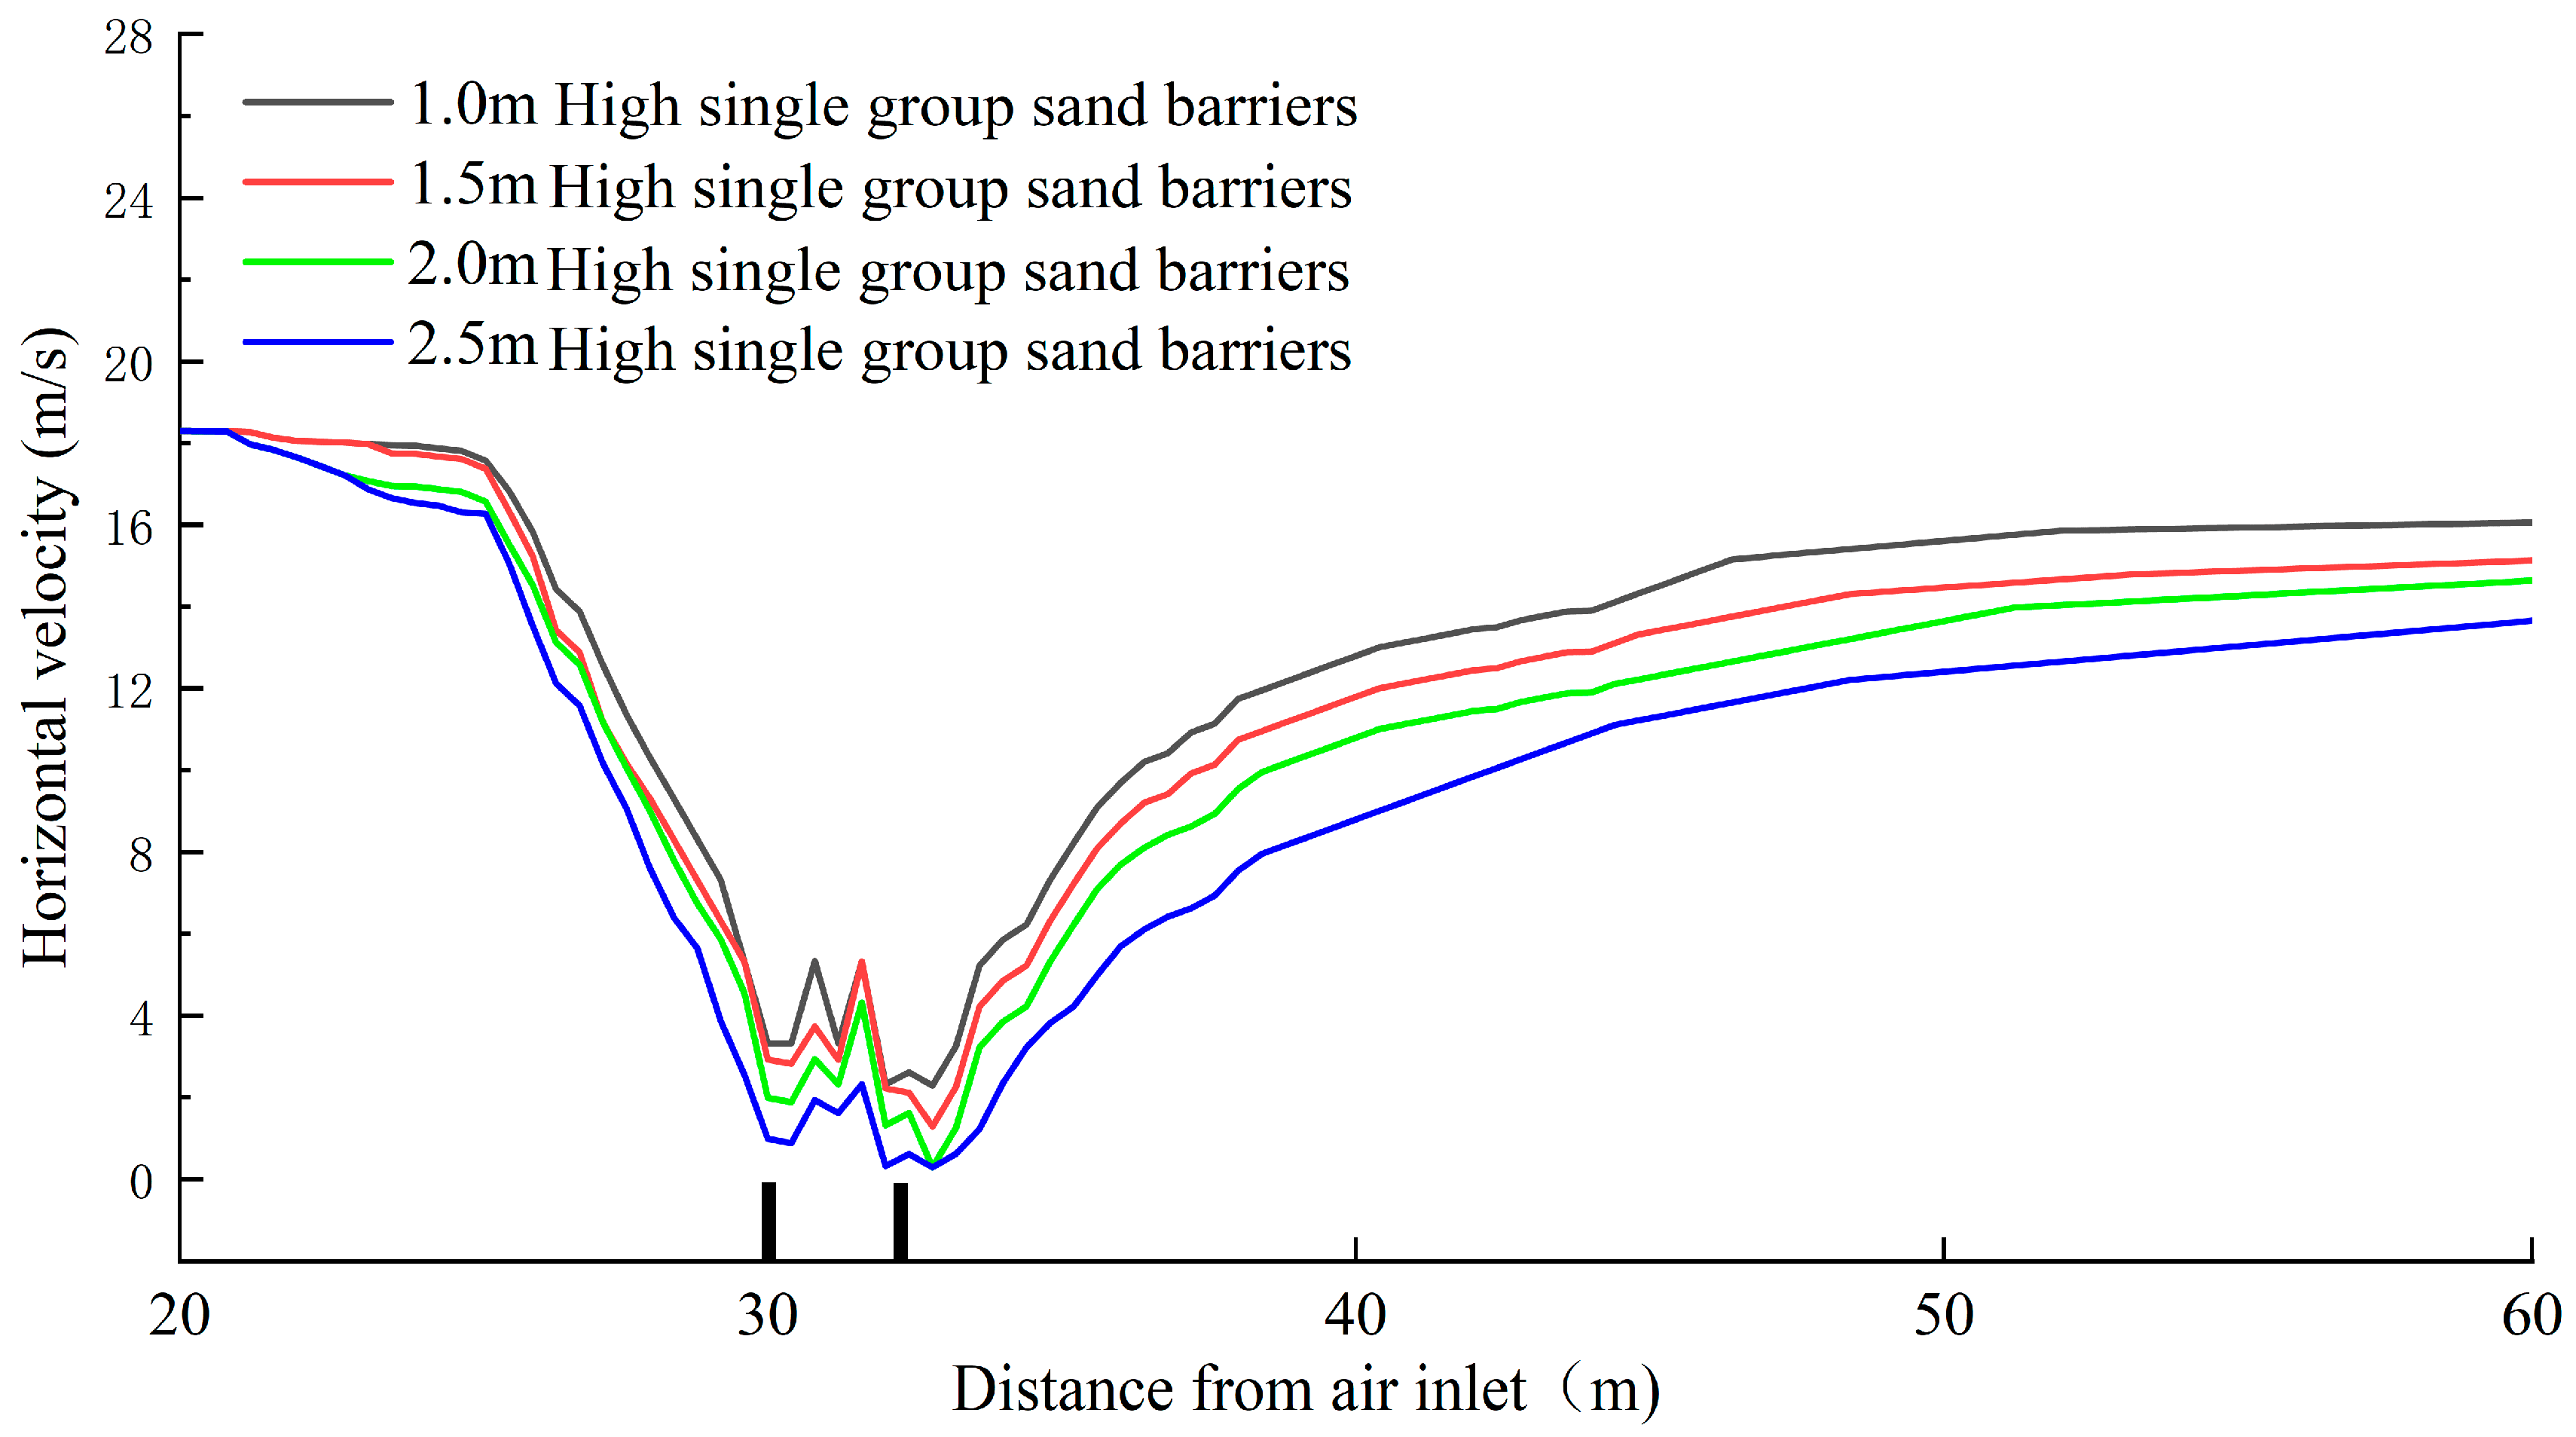
The initial wind speed is 18 m/s and the single sand barrier is located 30 m from the wind outlet; the sand barrier transition area is 3 m apart and the heights are 1 m, 1.5 m, 2 m and 2.5 m. When the sand flow passes through the sand barrier, the wind speed changes mainly in the near ground area, so the horizontal wind speed at a height of 0.6 m from the road surface is selected to analyze the flow field changes around the sand barrier at different heights.
3.3.1. Wind Speed Variation Characteristics Analysis
As can be seen from
Figure 7, the distribution of wind velocity changes around single-group sand barriers of different heights. When the sand-carrying airflow passes through the double-row sand barriers, the wind velocity changes show the largest change in wind velocity for the 2.5 m single-group sand barriers, followed by the wind velocity changes for the 2.0 m and 1.5 m single-group sand barriers, and the smallest change in velocity is shown for the 1.0 m single-group sand barriers. At the same position, the wind velocity under the 2.5 m sand barriers is 2–3 m/s lower than that under the 1.0 m sand barriers. It can be concluded that with the same initial wind speed, as the height of the sand barrier increases, the wind speed of the sand flow decreases more, and the corresponding sand barrier has a more pronounced effect on wind and sand fixation.
3.3.2. Analysis of the Wind Protection Efficiency and Effective Protection Distance of the Sand Barriers
Figure 8 shows that the wind protection efficiency of all four sand barriers is higher than 20% within 20.1 m behind the sand barrier. The 1 m sand barrier wind protection efficiency decreases rapidly within 10 m away from the sand barrier and reaches 20% at 20.1 m from the sand barrier with an effective protection distance of 22.1 m. The wind protection efficiency of 1.5 m and 2 m sand barriers varies to a similar extent, with a stable decreasing trend after moving away from the sand barrier and effective protection distances of 24.2 m and 25.8 m, respectively. The wind protection efficiency of the 2.5 m barricade is generally higher than the other heights, with the wind protection efficiency generally higher than 80% within 6.4 m behind the barricade, decreasing to 50% at 9.5 m, and 20% at 29.4 m away from the barricade, with an effective protection distance of 31.4 m. Overall, the wind protection efficiency increases with the height of the barricade. In general, the wind protection efficiency increases as the height of the sand barrier increases, and the effective protection distance also increases.
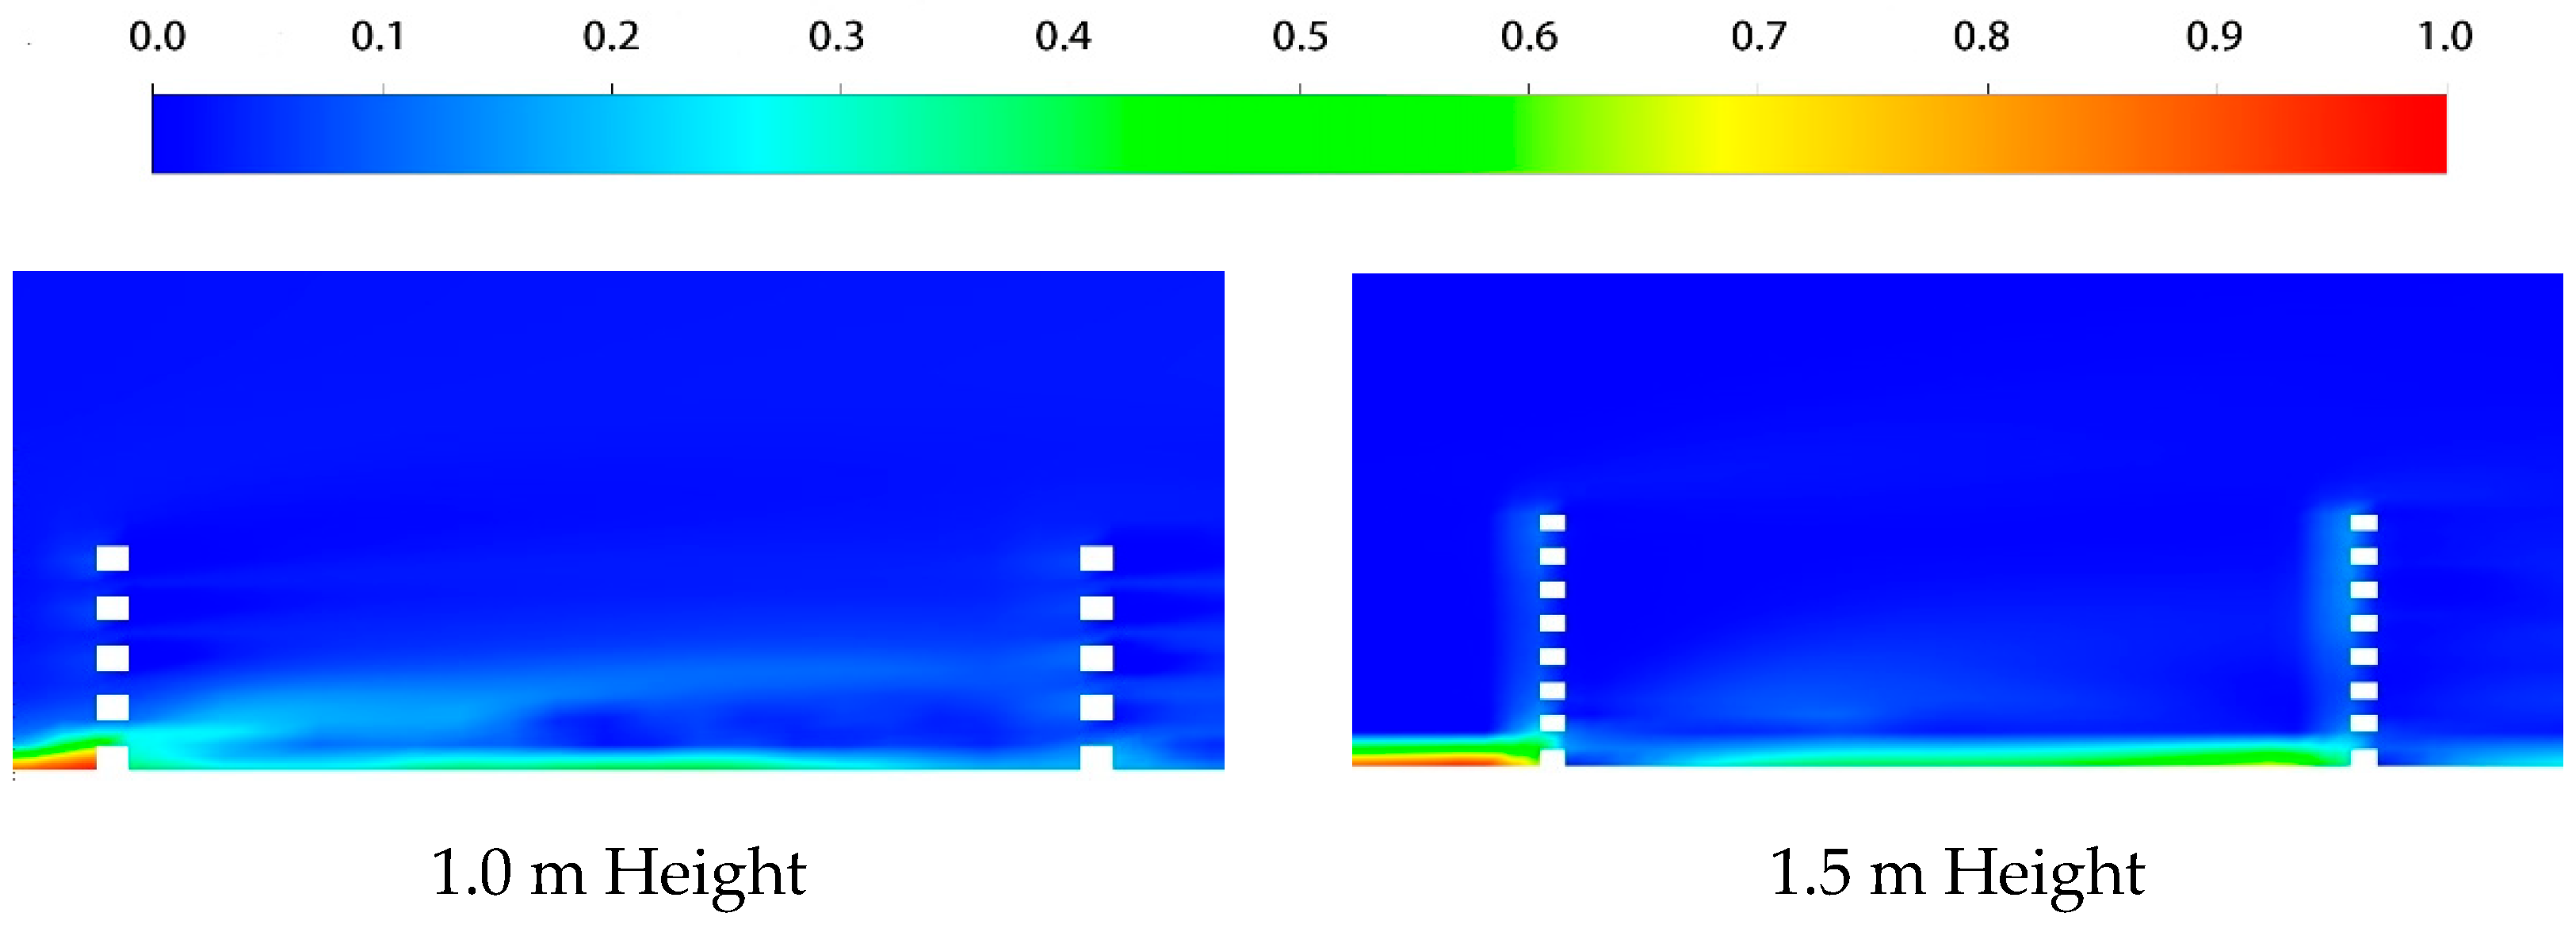
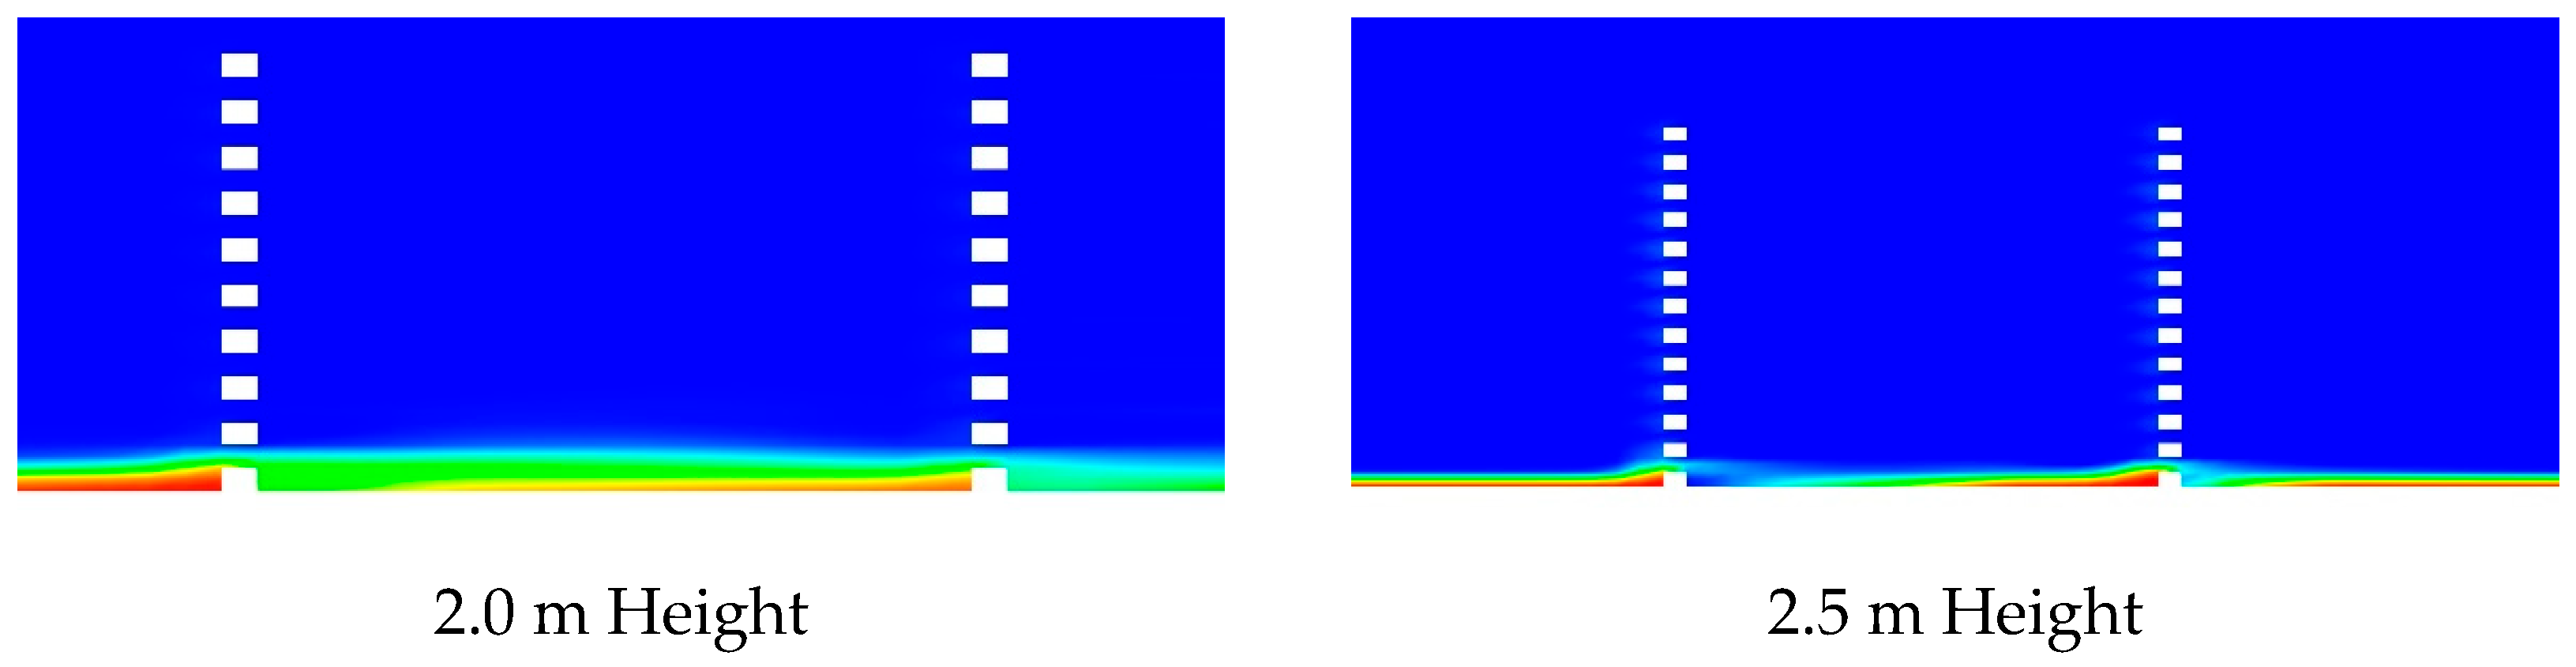
3.3.3. Analysis of Sand Accumulation Characteristics around the Sand Barrier
As can be seen from
Figure 9, the sand accumulation at the 1.0 m barrier is the smallest, followed by the 1.5 m barrier, which is mainly due to the fact that when the sand flow passes through the lower barrier, the wind speed slows down less, causing the sand particles to continue to move past the barrier and preventing effective sand accumulation. The 2.0 m and 2.5 m sand barriers accumulate similar amounts of sand, significantly more than the 1 m and 1.5 m barriers. However, there are significant differences in the sand accumulation areas, with more sand accumulating in the transition zone and on the windward side of the second row of sand barriers at 2 m than at 2.5 m. The 2.5 m sand barriers accumulate more sand at the first row of sand barriers than the 2.0 m sand barriers, because as the height of the sand barriers increases, the wind and sand flow is subjected to a significant reduction in wind speed as it passes through the first row of sand barriers, and the subsequent wind and sand flow does not have the capacity for a significant accumulation of sand.
3.3.4. Verification of Sand Accumulation on Site
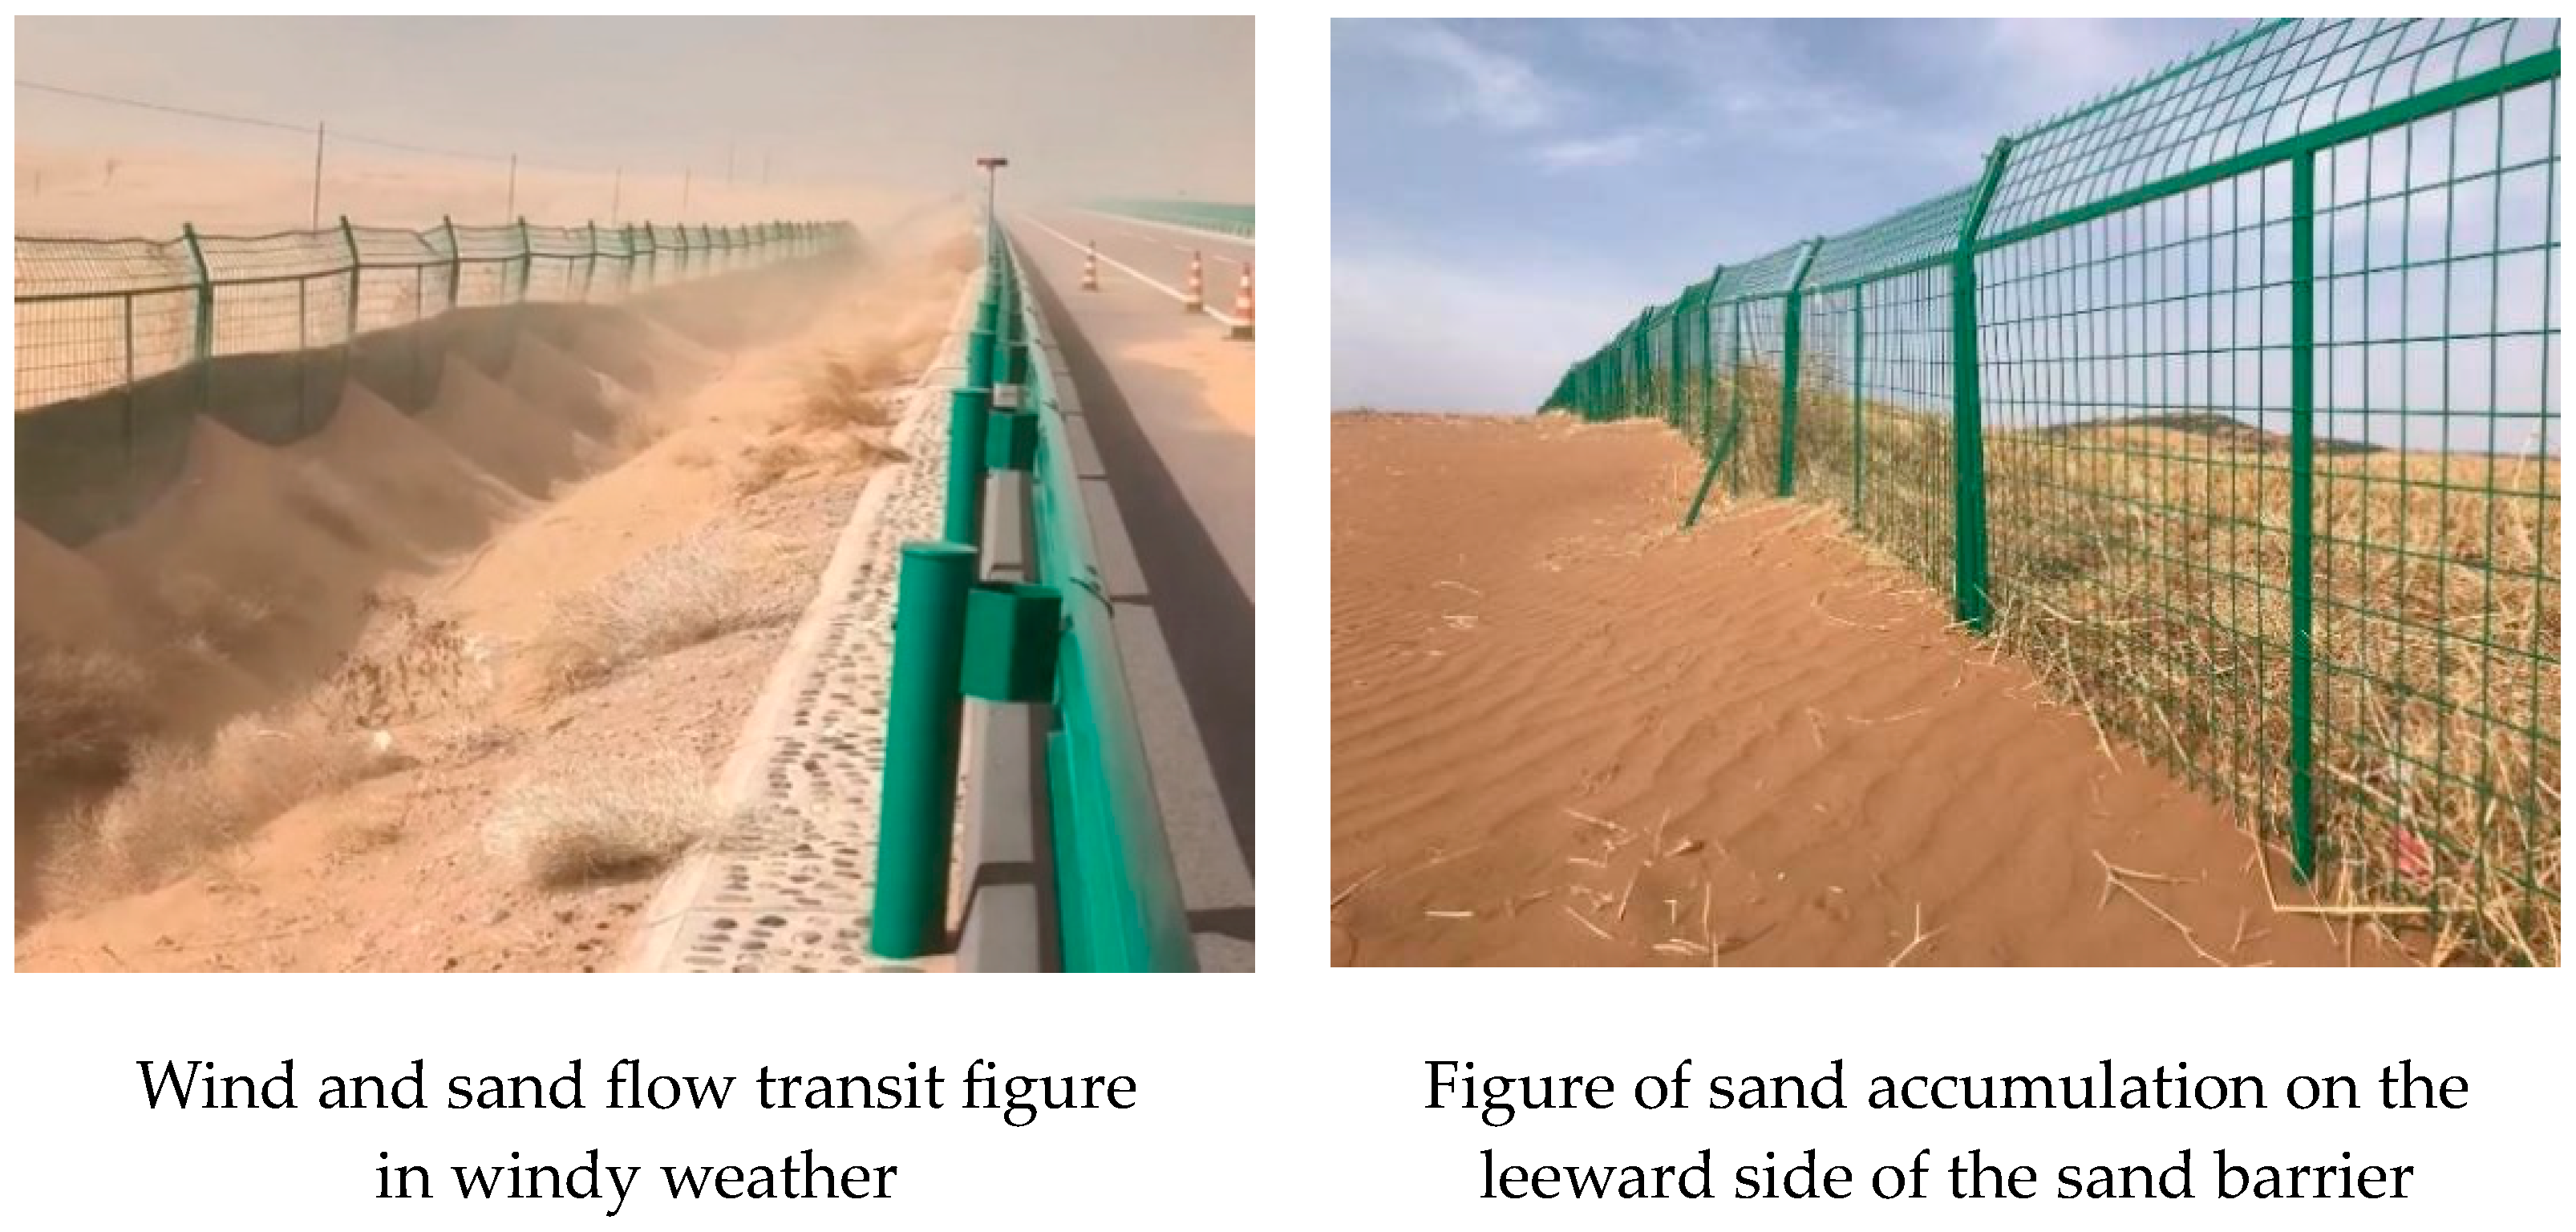
In order to verify the numerical simulation results, the sand accumulation situation near the sand barriers in the desert section of the Uma Highway was observed and analyzed in the field, and the form of sand accumulation in different sections varies.
As shown in
Figure 10, it can be seen that the sand flow under windy weather will cross the sand barriers, producing a large amount of sand accumulation in the leeward side of the sand barriers and other areas; at the same time, the sand barriers can cause significant blockage of the sand flow so that a large number of sand particles are deposited in the leeward side of the sand barriers. However, with the passage of time, the sand accumulated on the leeward side of the sand barriers increases continuously and moves with the wind to the road surface, resulting in a significant decline in the sand barrier performance.
3.3.5. Formatting of Mathematical Components
where
represents the horizontal distance from the sand barriers x and the height from the ground y at the wind efficiency;
represents the sand flow after the sand barriers (
x,
y) at the level of the wind speed; and
represents no sand barriers (
x,
y) at the level of the wind speed of the sand flow.
4. Discussion
This article mainly studies the two factors of sand barrier height and sand barrier spacing to analyze the degree of influence on the efficiency of wind protection. It is found that when the wind speed is constant, the deceleration ability of the sand barriers in front of the barriers to the wind and sand flow increases with the increase in the height of the sand barriers. At the same time, there is a combination of high vertical sand barriers that are mainly built in the form of a square grid, which we considered in a comprehensive manner. When the wind and sand come from one direction, it will be stopped by the front and back of the sand barriers twice. When the height of the sand barriers is sufficient, a certain amount of spacing will lead to the air velocity increasing around the sand barriers in the transition zone, making the sand particles unable to form significant deposits. At the same time, when the spacing is too small, it will lead to the overlap of the protective effect of the two rows of sand barriers, and the comprehensive protective performance of the sand barriers will be reduced. Comprehensive analysis shows that the decrease in the height of the sand barriers and the increase in the spacing between the sand barriers will reduce the protection ability of the transition zone of the sand barriers. From the distribution of sand accumulation around the sand barriers under different parameters, it can be seen that the amount of sand accumulation is distributed (in descending order) in front of the barriers, the transition zone of the sand barriers, and the back of the barriers. By comparing the total amount of sand around the sand barriers, it can be found that the amount of sand accumulation increases with the increase in the height of the sand barriers. The spacing of the sand barriers is too large to lead to a decrease in the intercepting effect of the sand barriers on the wind and sand, and the spacing of the sand barriers is too small to lead to overlapping effects, resulting in a waste of resources. The sand barriers are too high to lead to the unstable sand easily falling over the sand barriers, and at the same time, from the point of view of economic efficiency, it is recommended that the height of the sand barriers be 1.5–2.0 m, and the spacing of the layout be 2 H (H is the actual height of sand barriers).
5. Conclusions
In order to study the influence of different heights and spacing of sand barriers on the wind protection efficiency of sand barriers, the article launched numerical simulation research by Fluent for two factors of different heights of sand barriers and different spacing of sand barriers. It provides data support for the establishment of a desert highway sand protection system and increases the sustainability of the desert highway. We draw the following main conclusions:
(1) When the airflow passes through a single set of high vertical sand barriers, the airflow velocity decreases sharply in front of the windward side of the first row of sand barriers, increases slightly after the first row of sand barriers, and then decreases again when it reaches the second row of sand barriers. Then, it finally begins to rise to the prevailing wind speed behind the second row of sand barriers. The overall distribution of wind and sand flow speeds was in a “W” shape.
(2) Sand barrier spacing that is too large or too small will affect the wind performance of sand barriers. At a spacing of 4 H, the sand barriers transition zone has a maximum wind speed wind speed that is two to three times larger than the spacing of 2 H, which is not conducive to the accumulation of sand. At a spacing of 1 H, the transition area of the accumulation of sand is also smaller than the 2 H spacing, suggesting that the spacing is too small to lead to two rows of sand barriers that could protect the performance of the barriers and prevent them from overlapping, thus causing more sand particles to blow across the sand barriers into the mainstream wind. Therefore, it is recommended to use 2 H spacing in the actual deployment.
(3) As the height of the sand barriers continue to rise, the protective performance of the sand barriers is also enhanced. At the same position around the sand barriers, the wind speed under the 2.5 m sand barriers is lower than that under the 1.0 m sand barriers by 2–3 m/s. However, considering the weak stability of the sand barriers caused by the high sand barriers and the economic effect, it is recommended to control the height of the sand barriers in the actual deployment of the sand barriers at 1.5–2.0 m. The wind speed of the sand barriers is lower than that of the 1.0 m sand barriers.
Author Contributions
Conceptualization, S.L., Y.J. and W.D.; methodology, Y.J.; software, S.L. and Y.J.; validation, F.W.; formal analysis, S.L. and Y.J.; investigation, F.W., S.L., Y.J. and W.D.; resources, F.W., S.L. and Y.J.; data curation, F.W., S.L. and Y.J.; writing—original draft preparation, S.L. and Y.J.; writing—review and editing, S.L. and Y.J.; visualization, S.L., Y.J. and W.D.; supervision, F.W.; project administration, F.W.; funding acquisition, F.W. All authors have read and agreed to the published version of the manuscript.
Funding
This research was funded by the Ningxia Hui Autonomous Region Key Research and Development Program Project (2022BEG02017).
Institutional Review Board Statement
Not applicable.
Informed Consent Statement
The study did not involve humans.
Data Availability Statement
Data sharing not applicable. No new data were created or analyzed in this study. Data sharing is not applicable to this article.
Conflicts of Interest
The authors declare no conflict of interest.
References
- Wang, C.; Li, S.; Li, Z.; Lei, J.; Chen, J. Effects of windblown sand damage on desert highway guardrails. Nat. Hazards 2020, 103, 283–298. [Google Scholar] [CrossRef]
- Sun, T.; Liu, H.; Zhu, G.; Zhang, Y.; Ma, R.; Man, D. Timeliness of wind and sand stabilization functions of three types of mechanical sand barriers. J. Soil Water Conserv. 2012, 26, 12–16+22. [Google Scholar]
- Zhang, K.; An, Z.; He, M.; Xiao, J.; Zhang, H. Progress of research on wind-sand hazard and prevention on highways in sandy areas of China. China Desert 2022, 42, 222–232. [Google Scholar]
- Zhang, S.; Ding, G.; Gao, G.; Zhao, Y.; Yu, M.; Bao, Y.; Wang, C. Research on new type of guardrail to prevent sand accumulation on highway in wind-sand area. J. Beijing For. Univ. 2018, 40, 90–97. [Google Scholar]
- Wang, J. Introduction to desert highway design and sand prevention measures. Petrochem. Technol. 2015, 22, 74–75. [Google Scholar]
- Packwood, A.R. Flow through porous fences in thick boundary layers: Comparisons between laboratory and numerical experiments. J. Wind. Eng. Ind. Aerodyn. 2000, 88, 75–90. [Google Scholar] [CrossRef]
- Ding, P.; Gao, L.; Chen, J.; Chen, B. Numerical simulation of wind-sand flow characteristics under the influence of inclination angle of inclined-plate sand barriers. Soil Water Conserv. Bull. 2021, 41, 132–137. [Google Scholar]
- Zhang, N.; Kang, R.H.; Lee, R.J. Wind tunnel observation on the effect of a porous wind fence on shelter of saltating sand particles. Geomorphology 2010, 120, 224–232. [Google Scholar] [CrossRef]
- Li, K.; Xue, C.; Liu, H.; Jiang, F. Wind tunnel experimental study on wind-sand protection mechanism of different types of sand barrier walls. J. Railw. Eng. 2015, 196, 17–21. [Google Scholar]
- Saif, A.M.; Mohamed, A.; Alam Eldein, A.M. Variable porosity wind fences to control aeolian sand transport. In Proceedings of the Tenth International Congress of Fluid Dynamics (ICFD 10), Ain Soukhna, Egypt, 16–19 December 2010. [Google Scholar]
- Xiong, Z.W.; Jiang, C.; Xue, K. Research on the Positions of Various Kinds of Sand Barriers in Qinghai-Tibet Railway. Railw. Stand. Des. 2012, 4, 006. [Google Scholar]
- Huang, N.; Xia, X.; Tong, D. Numerical simulation of wind sand movement in straw checkerboard barriers. Eur. Phys. J. E 2013, 36, 1–7. [Google Scholar] [CrossRef]
- Zhang, C.; Li, Q.; Zhou, N.; Zhang, J.; Kang, L.; Shen, Y.; Jia, W. Field observations of wind profiles and sand fluxes above the windward slope of a sand dune before and after the establishment of semi-buried straw checkerboard barriers. Aeolian Res. 2016, 20, 59–70. [Google Scholar] [CrossRef]
- McClure, S.; Kim, J.J.; Lee, S.J.; Zhang, W. Shelter effects of porous multi-scale fractal fences. J. Wind. Eng. Ind. Aerodyn. 2017, 163, 6–14. [Google Scholar] [CrossRef]
- Lv, P.; Dong, Z.; Luo, W.; Qian, G. The pressure-field characteristics around porous wind fences: Results of a wind tunnel study. Environ. Earth Sci. 2013, 68, 947–953. [Google Scholar] [CrossRef]
- Zhang, K.; Wang, Q.; Yang, Z.; Liang, K.; Zhao, K.; Cui, X. Numerical simulation study on wind protection benefit of HDPE plate high vertical sand barriers for new Geku Railway. J. Railw. 2019, 41, 169–175. [Google Scholar]
- Bitog, J.P.; Lee, I.B.; Shin, M.H.; Hong, S.W.; Hwang, H.S.; Seo, I.H.; Yoo, J.-I.; Kwon, K.-S.; Kim, Y.-H.; Han, J.-W. Numerical simulation of an array of fences in Saemangeum reclaimed land. Atmos. Environ. 2009, 43, 4612–4621. [Google Scholar] [CrossRef]
- Razi, P.; Mirabdolah Lavasani, A.; Mehdipour, R. Numerical solution of fence performance for reduction of sand deposition on railway tracks. Int. J. Eng. 2016, 29, 1014–1021. [Google Scholar]
- Huang, L.M.; Chan, H.C.; Lee, J.T. A numerical study on flow around nonuniform porous fences. J. Appl. Math. 2012, 2012, 268371. [Google Scholar] [CrossRef]
- Xu, B. Numerical Simulation Study on the Mechanism of Sand Blocking and Sand Fixation by Mechanical Sand Barriers. Ph.D. Thesis, Lanzhou University, Lanzhou, China, 2018. [Google Scholar]
- Jing, S.; Jiang, L.; Liu, Y.; Zhang, S.; Liu, H.; Zheng, R. Numerical simulation of the effect of windbreak and sand fixation in the integrated type system of sand barrier dike-sand fixation brick. Soil Water Conserv. Bull. 2022, 42, 135–144+187. [Google Scholar]
- Horvat, M.; Bruno, L.; Khris, S.; Raffaele, L. Aerodynamic shape optimization of barriers for windblown sand mitigation using CFD analysis. J. Wind. Eng. Ind. Aerodyn. 2020, 197, 104058. [Google Scholar] [CrossRef]
- Zhang, K.; Wang, Q.C.; Zhang, X.X.; Zhao, P.W. Effective protection distance of HDPE sheet fencing for Geku Railway. J. Transp. Eng. 2020, 20, 105–115. [Google Scholar]
- Shi, L.; Jiang, F.; Han, F. Numerical simulation study on the response law of wind-sand two-phase flow on railroad embankment. J. Railw. 2014, 36, 82–87. [Google Scholar]
- Wu, Z.; Dong, Z.; Li, B. Wind-Sand Geomorphology and Sand Control Engineering; Science Press: Beijing, China, 2003. [Google Scholar]
- Jia, G. Fluent Numerical Simulation of the Protective Effectiveness of Double Row Nylon Sand Barrier Net. Ph.D. Thesis, Neimenggu Agricultural University, Hohhot, China, 2019. [Google Scholar]
| Disclaimer/Publisher’s Note: The statements, opinions and data contained in all publications are solely those of the individual author(s) and contributor(s) and not of MDPI and/or the editor(s). MDPI and/or the editor(s) disclaim responsibility for any injury to people or property resulting from any ideas, methods, instructions or products referred to in the content. |
© 2023 by the authors. Licensee MDPI, Basel, Switzerland. This article is an open access article distributed under the terms and conditions of the Creative Commons Attribution (CC BY) license (https://creativecommons.org/licenses/by/4.0/).


