Relationship between Alternated Current Impedance Spectrum and Microstructure of Graphene Enhanced Concrete


Abstract
:1. Introduction
2. Materials and Testing Methods
2.1. Materials
2.2. Mix Proportion and Sample Preparation
2.3. AC Impedance Spectrum Test
2.4. MIP (Mercury Intrusion Porosimetry)
3. Results
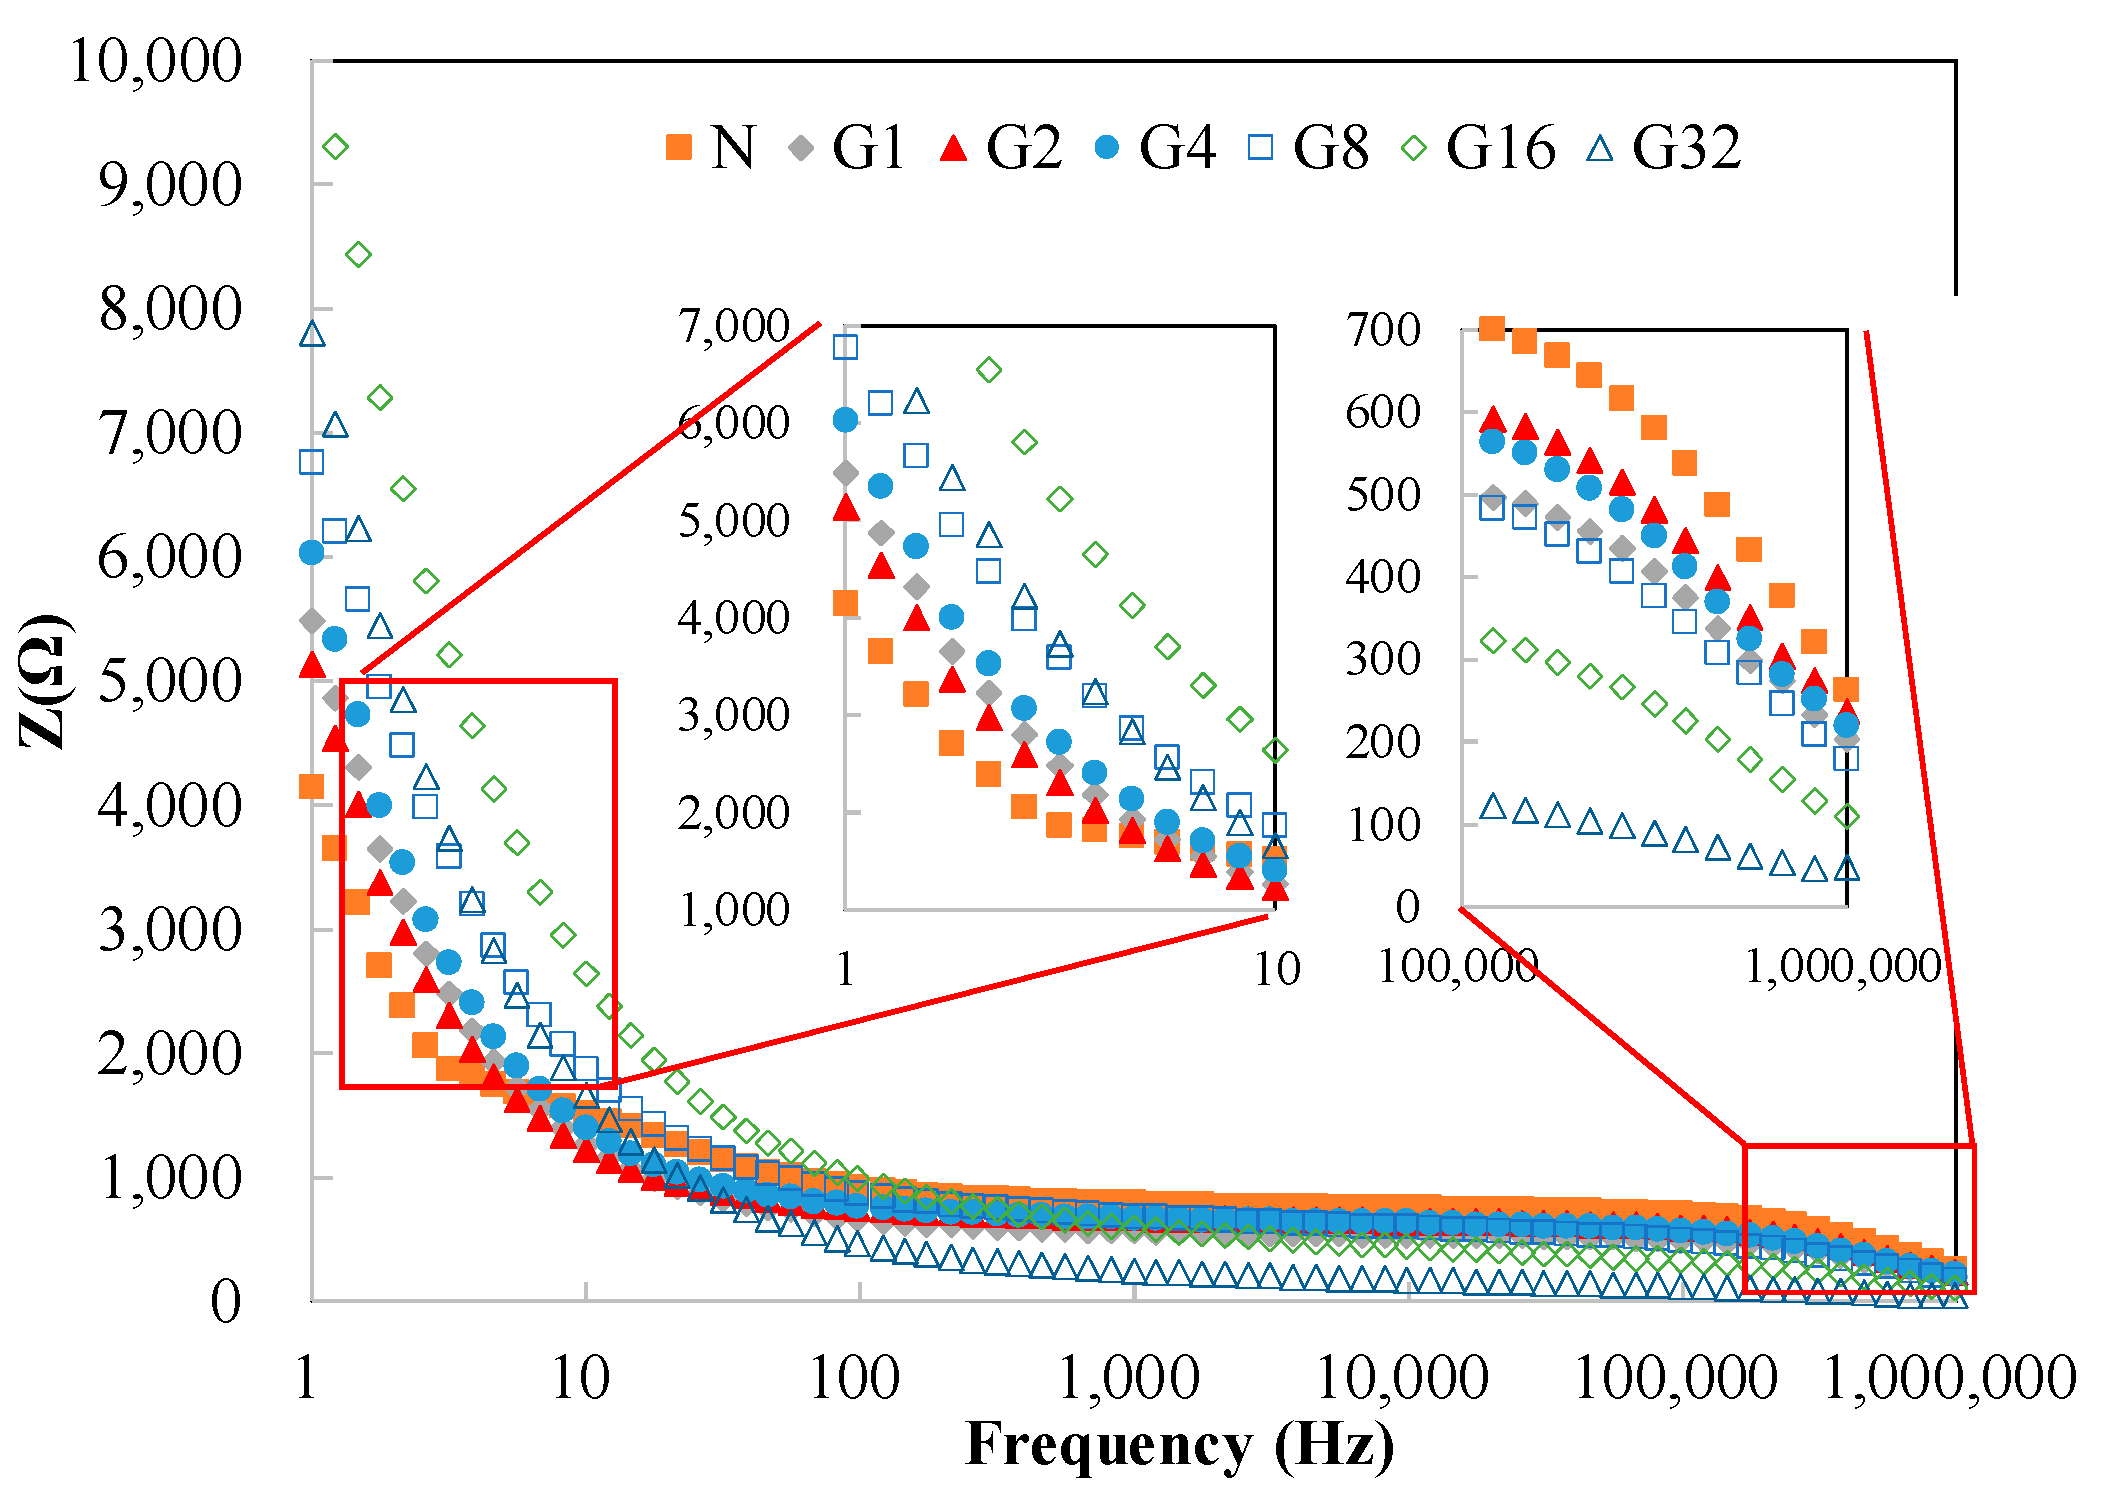
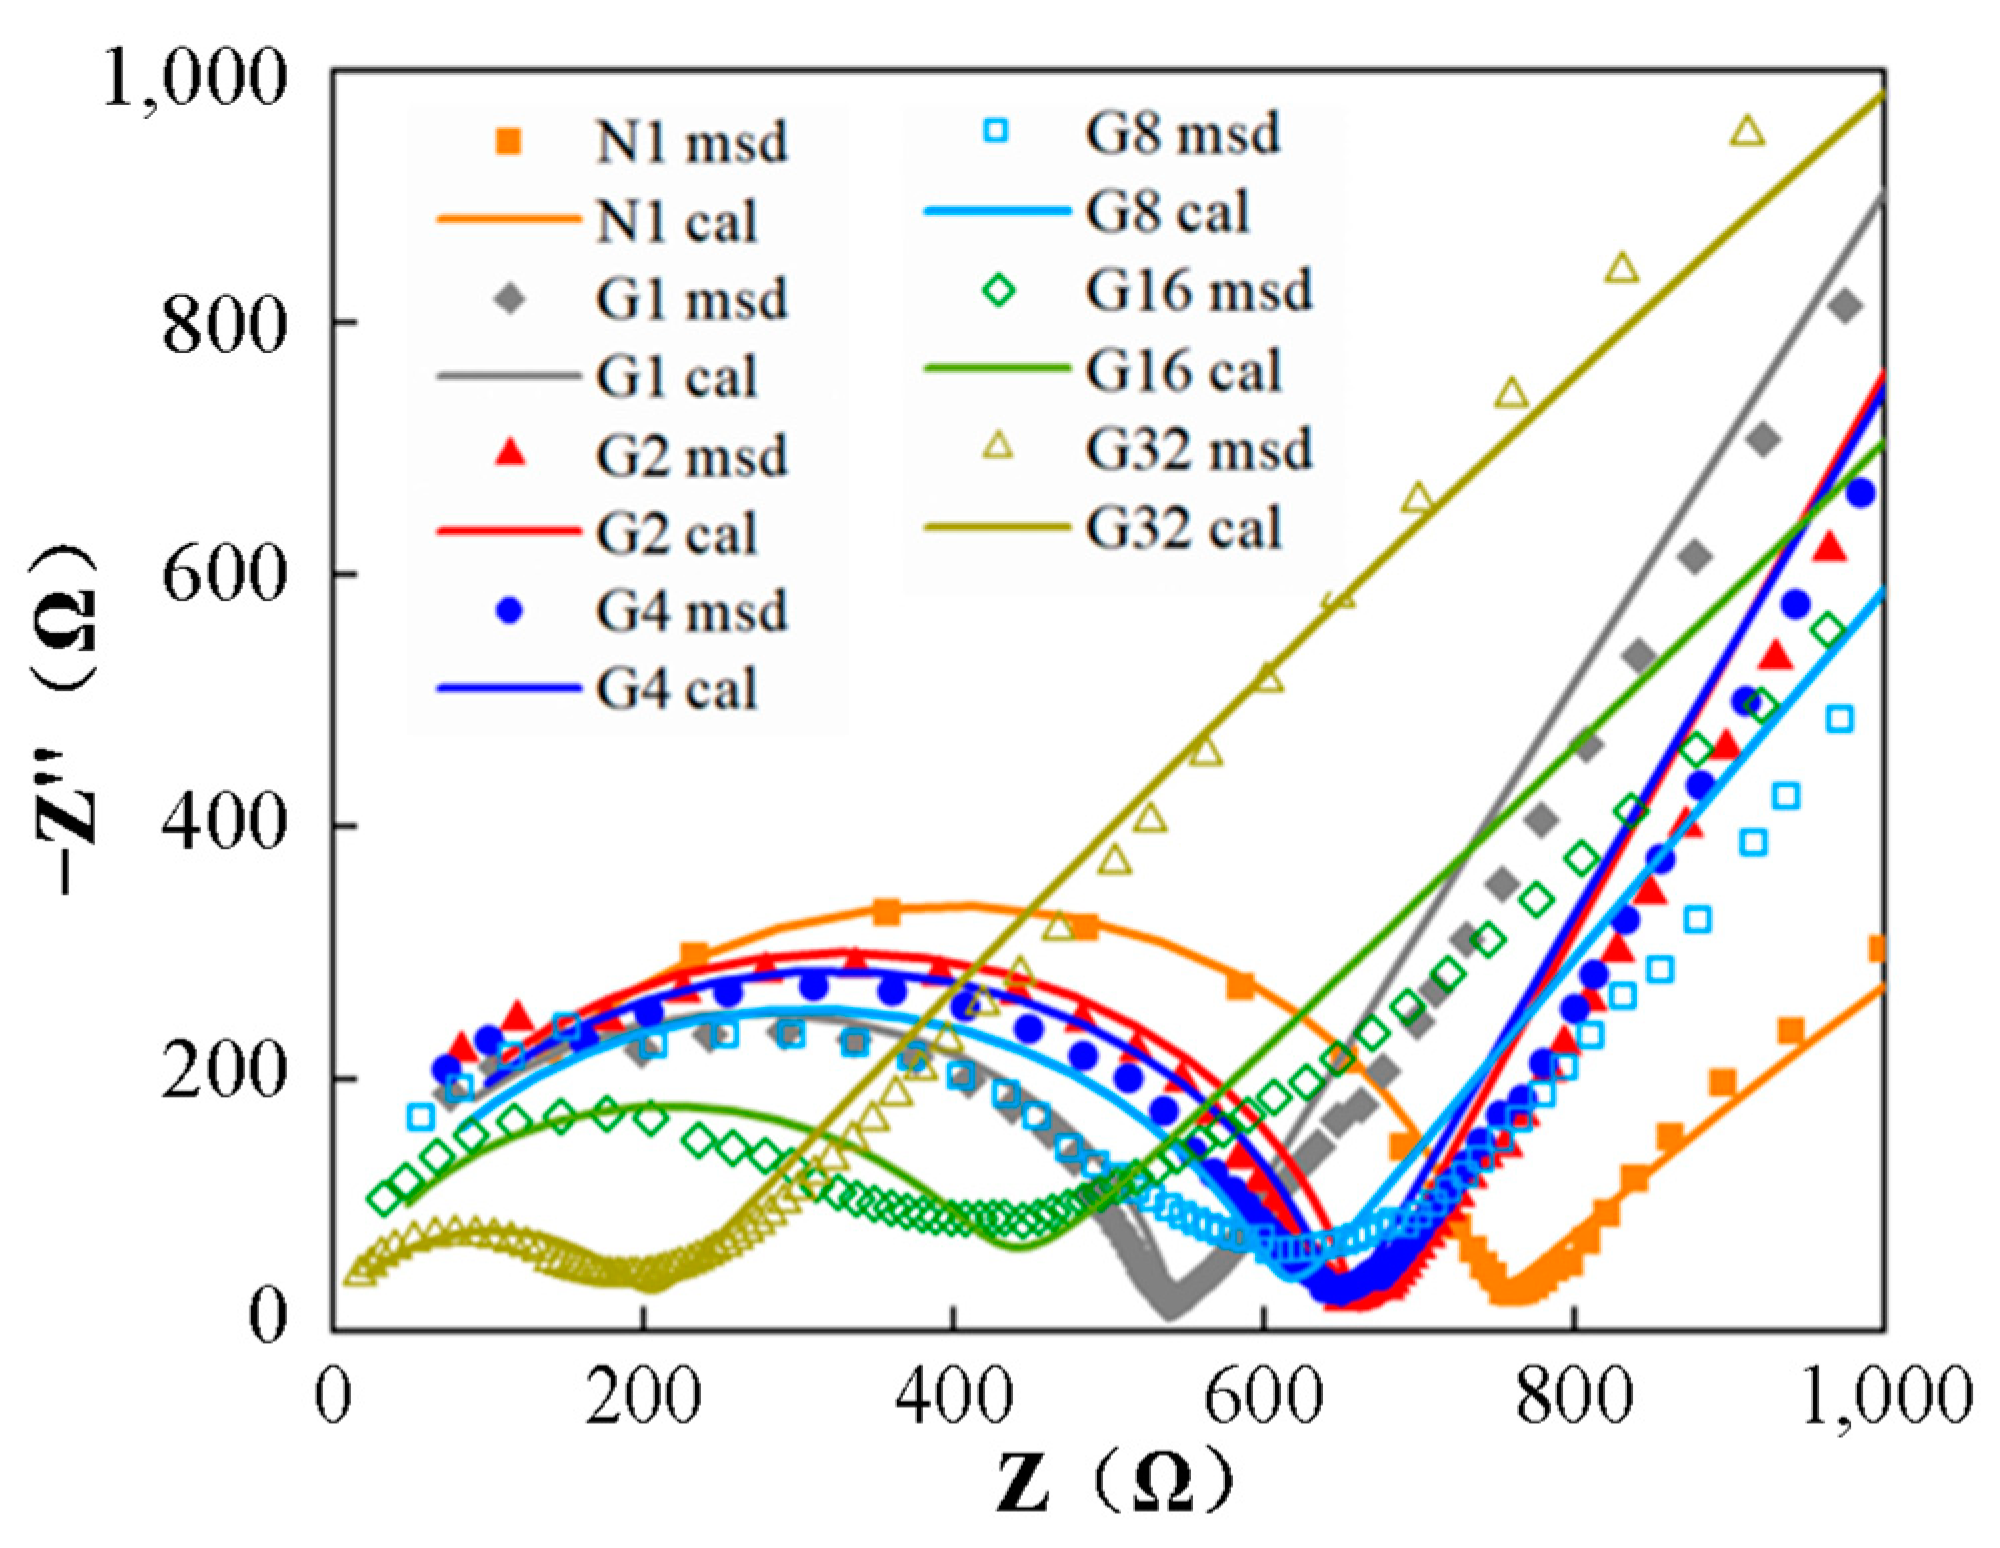
3.1. AC Impedance Spectrum
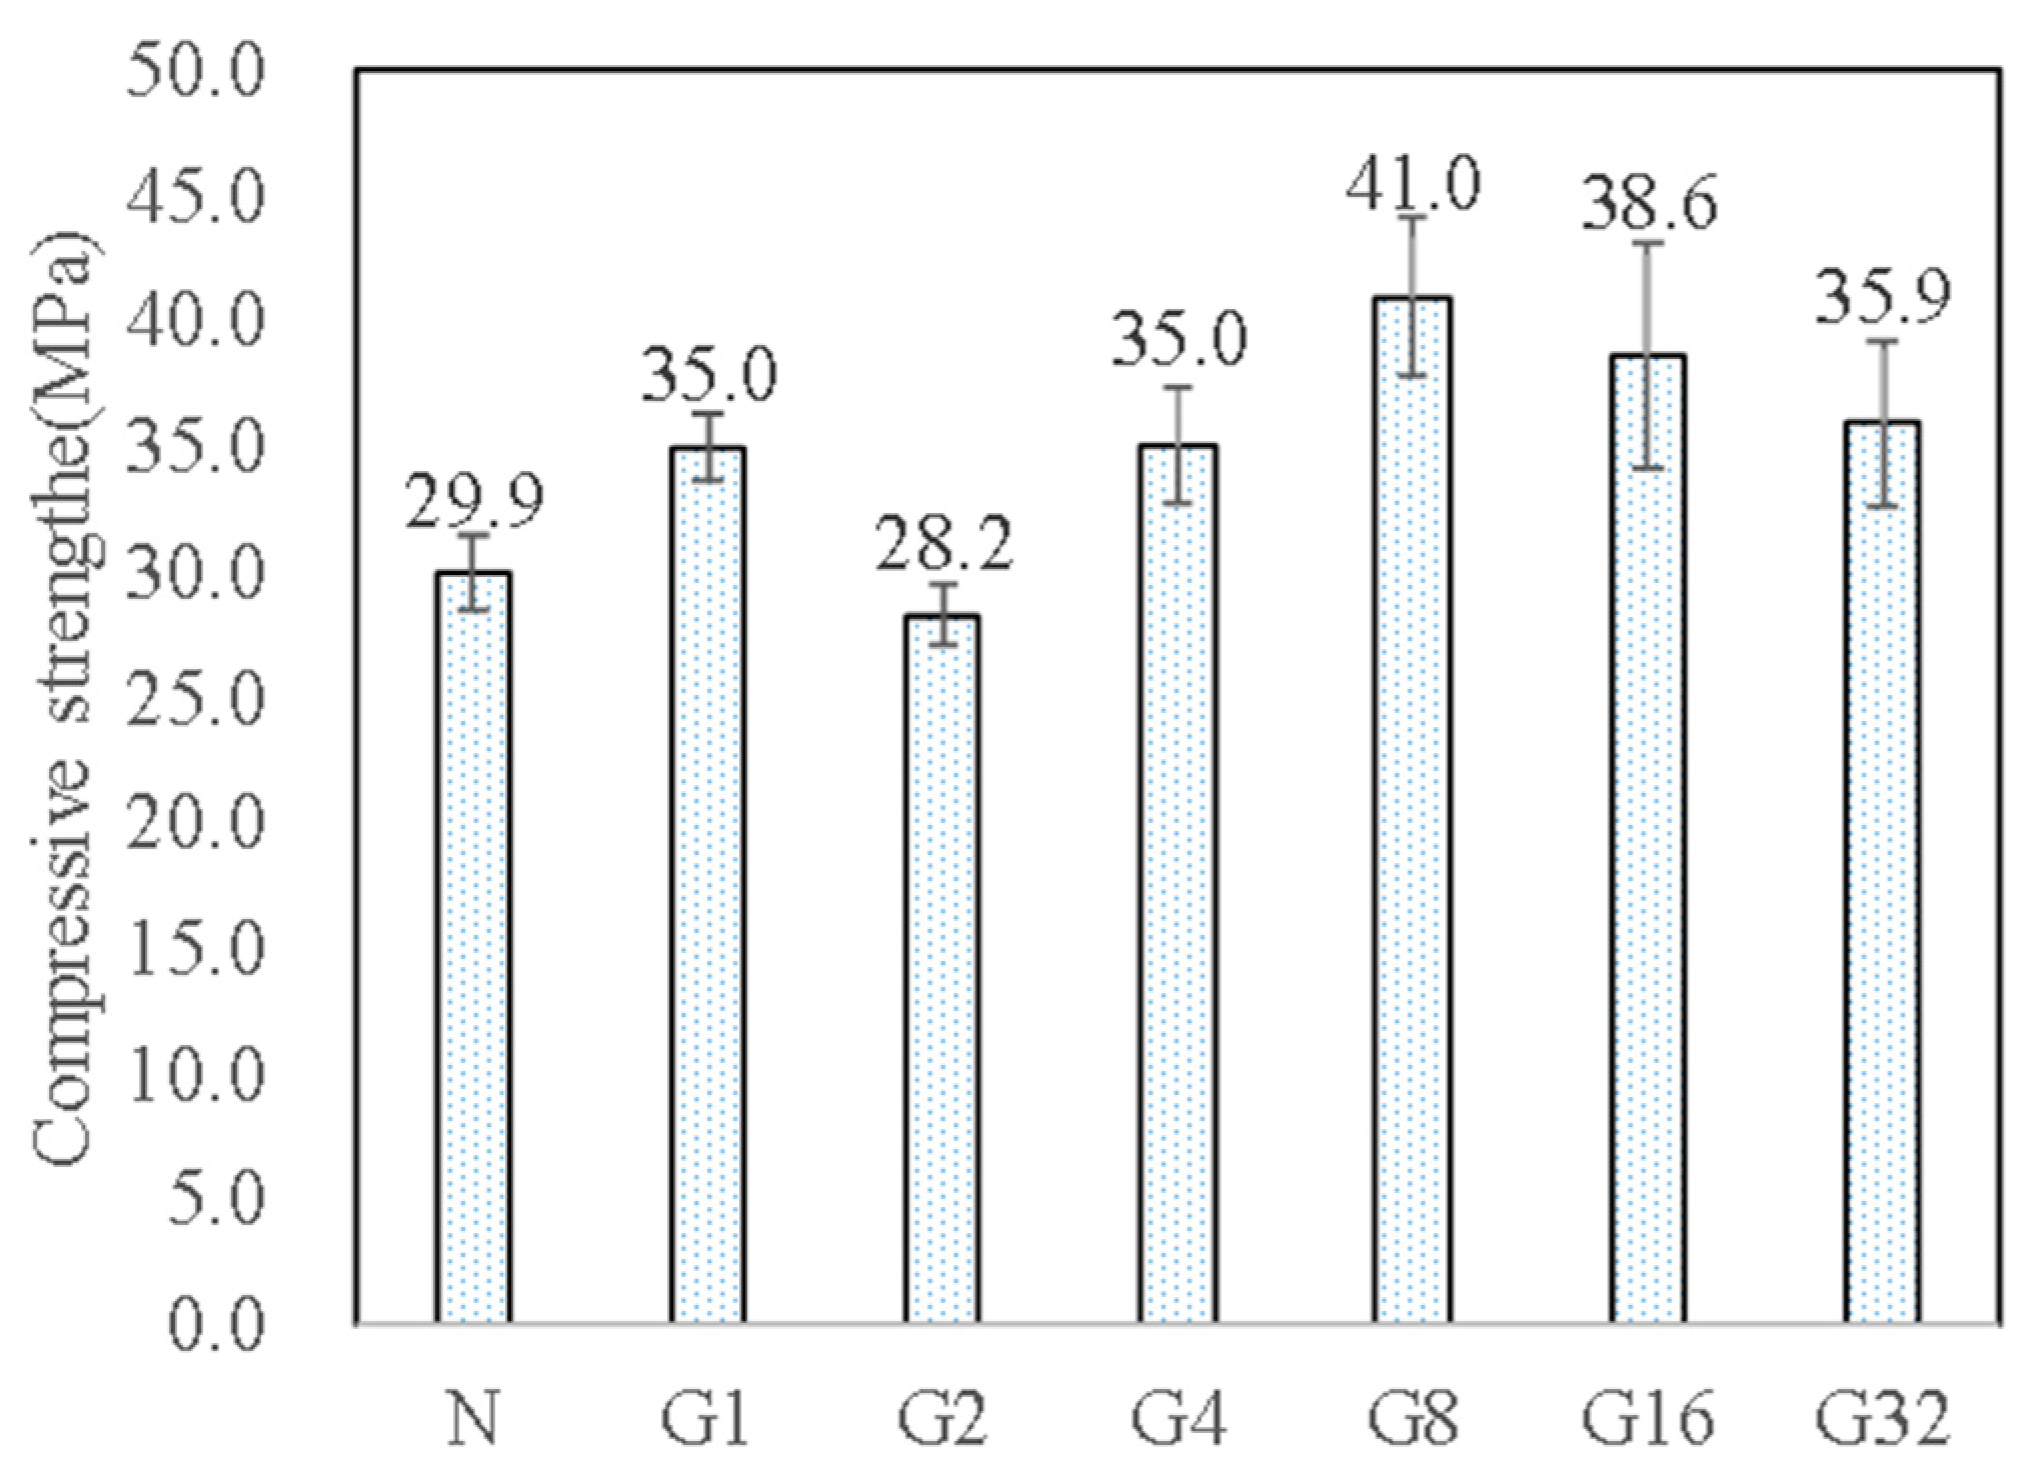
3.2. Compressive Strength
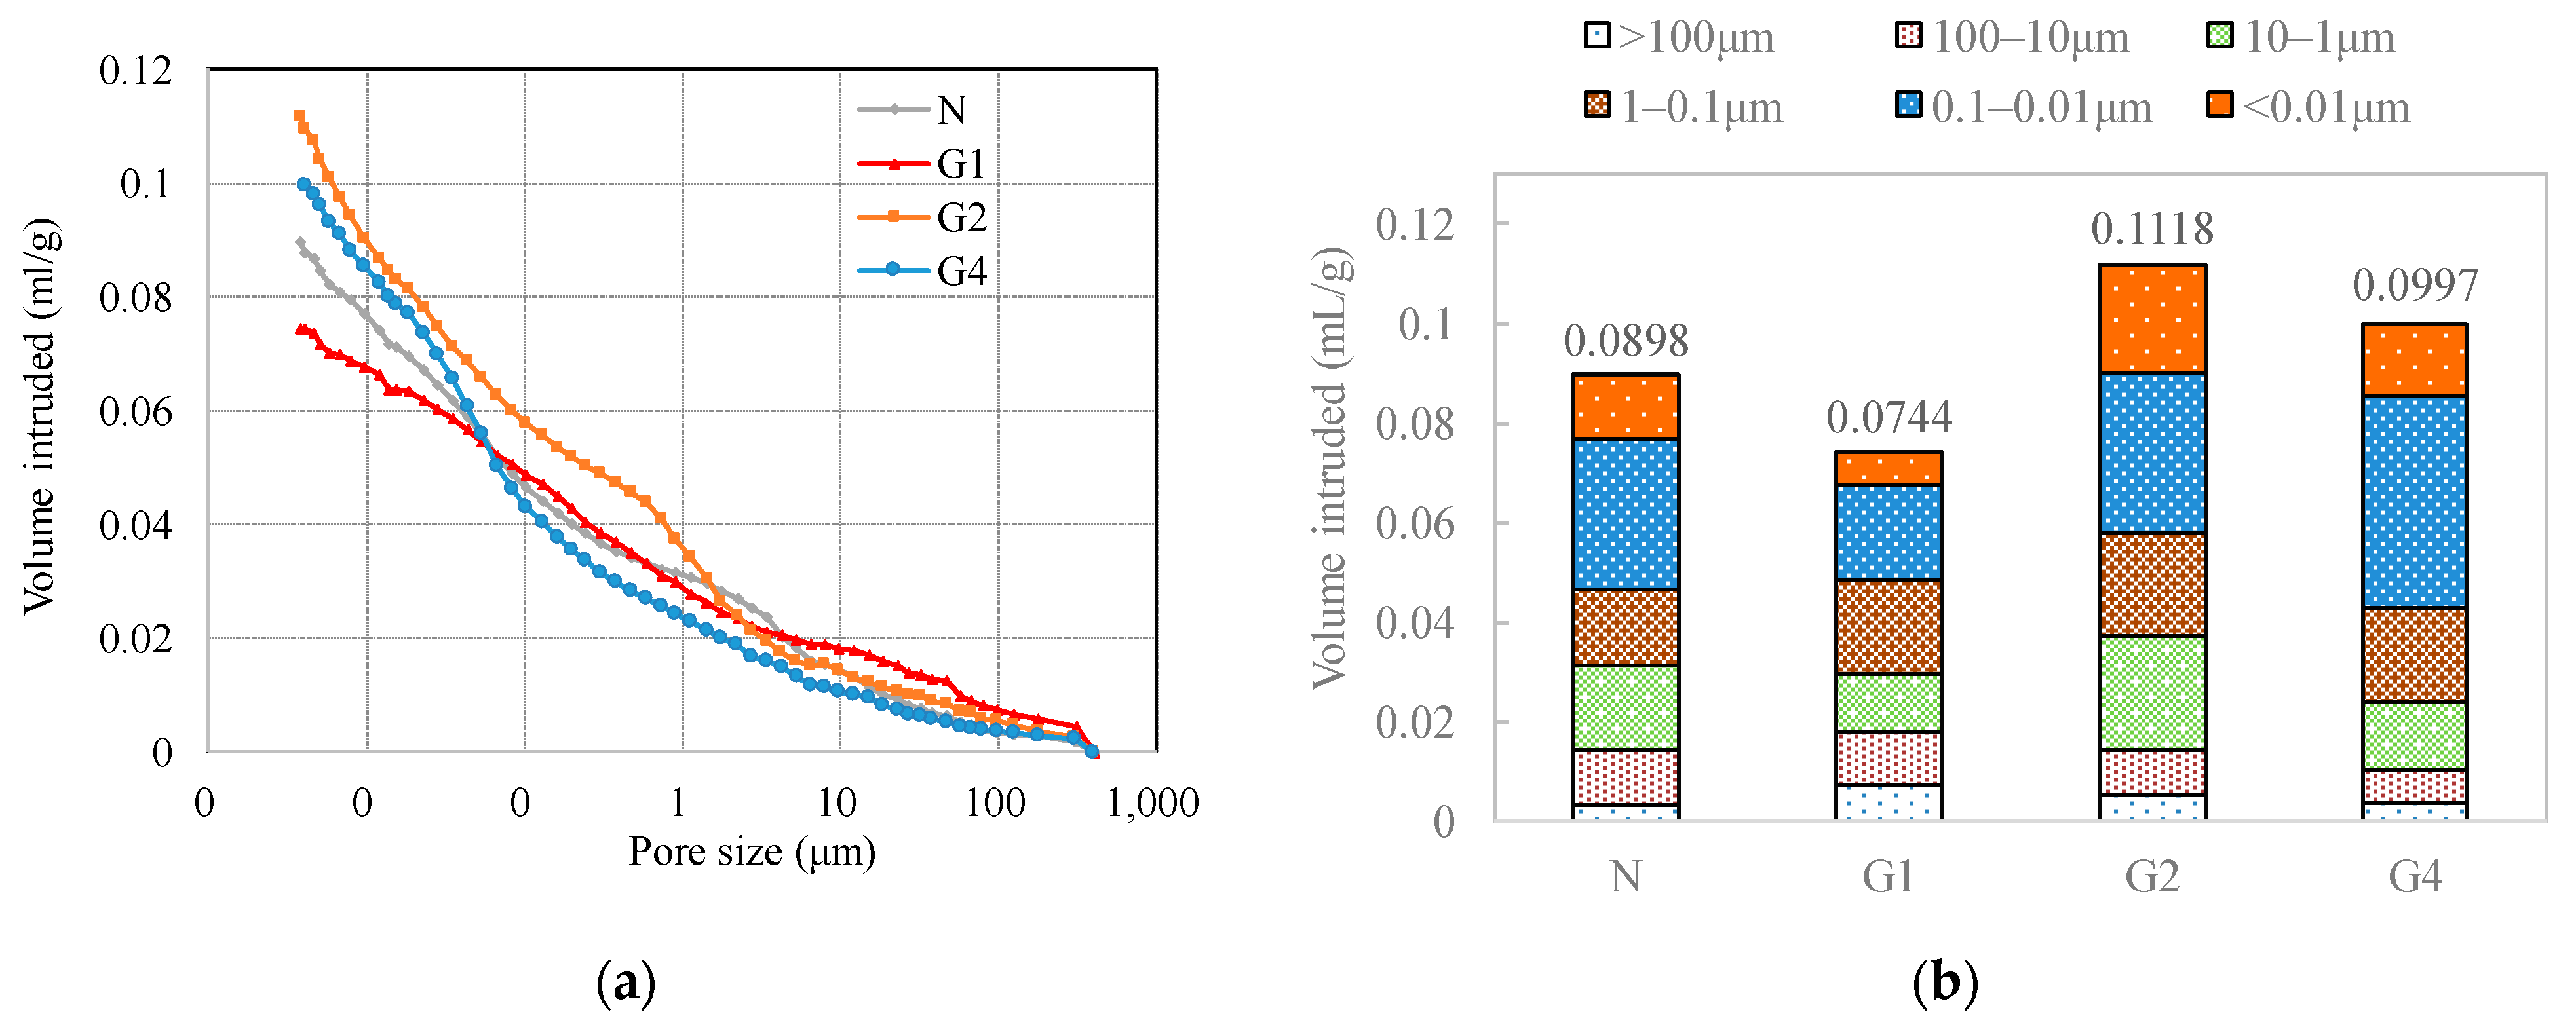
3.3. MIP
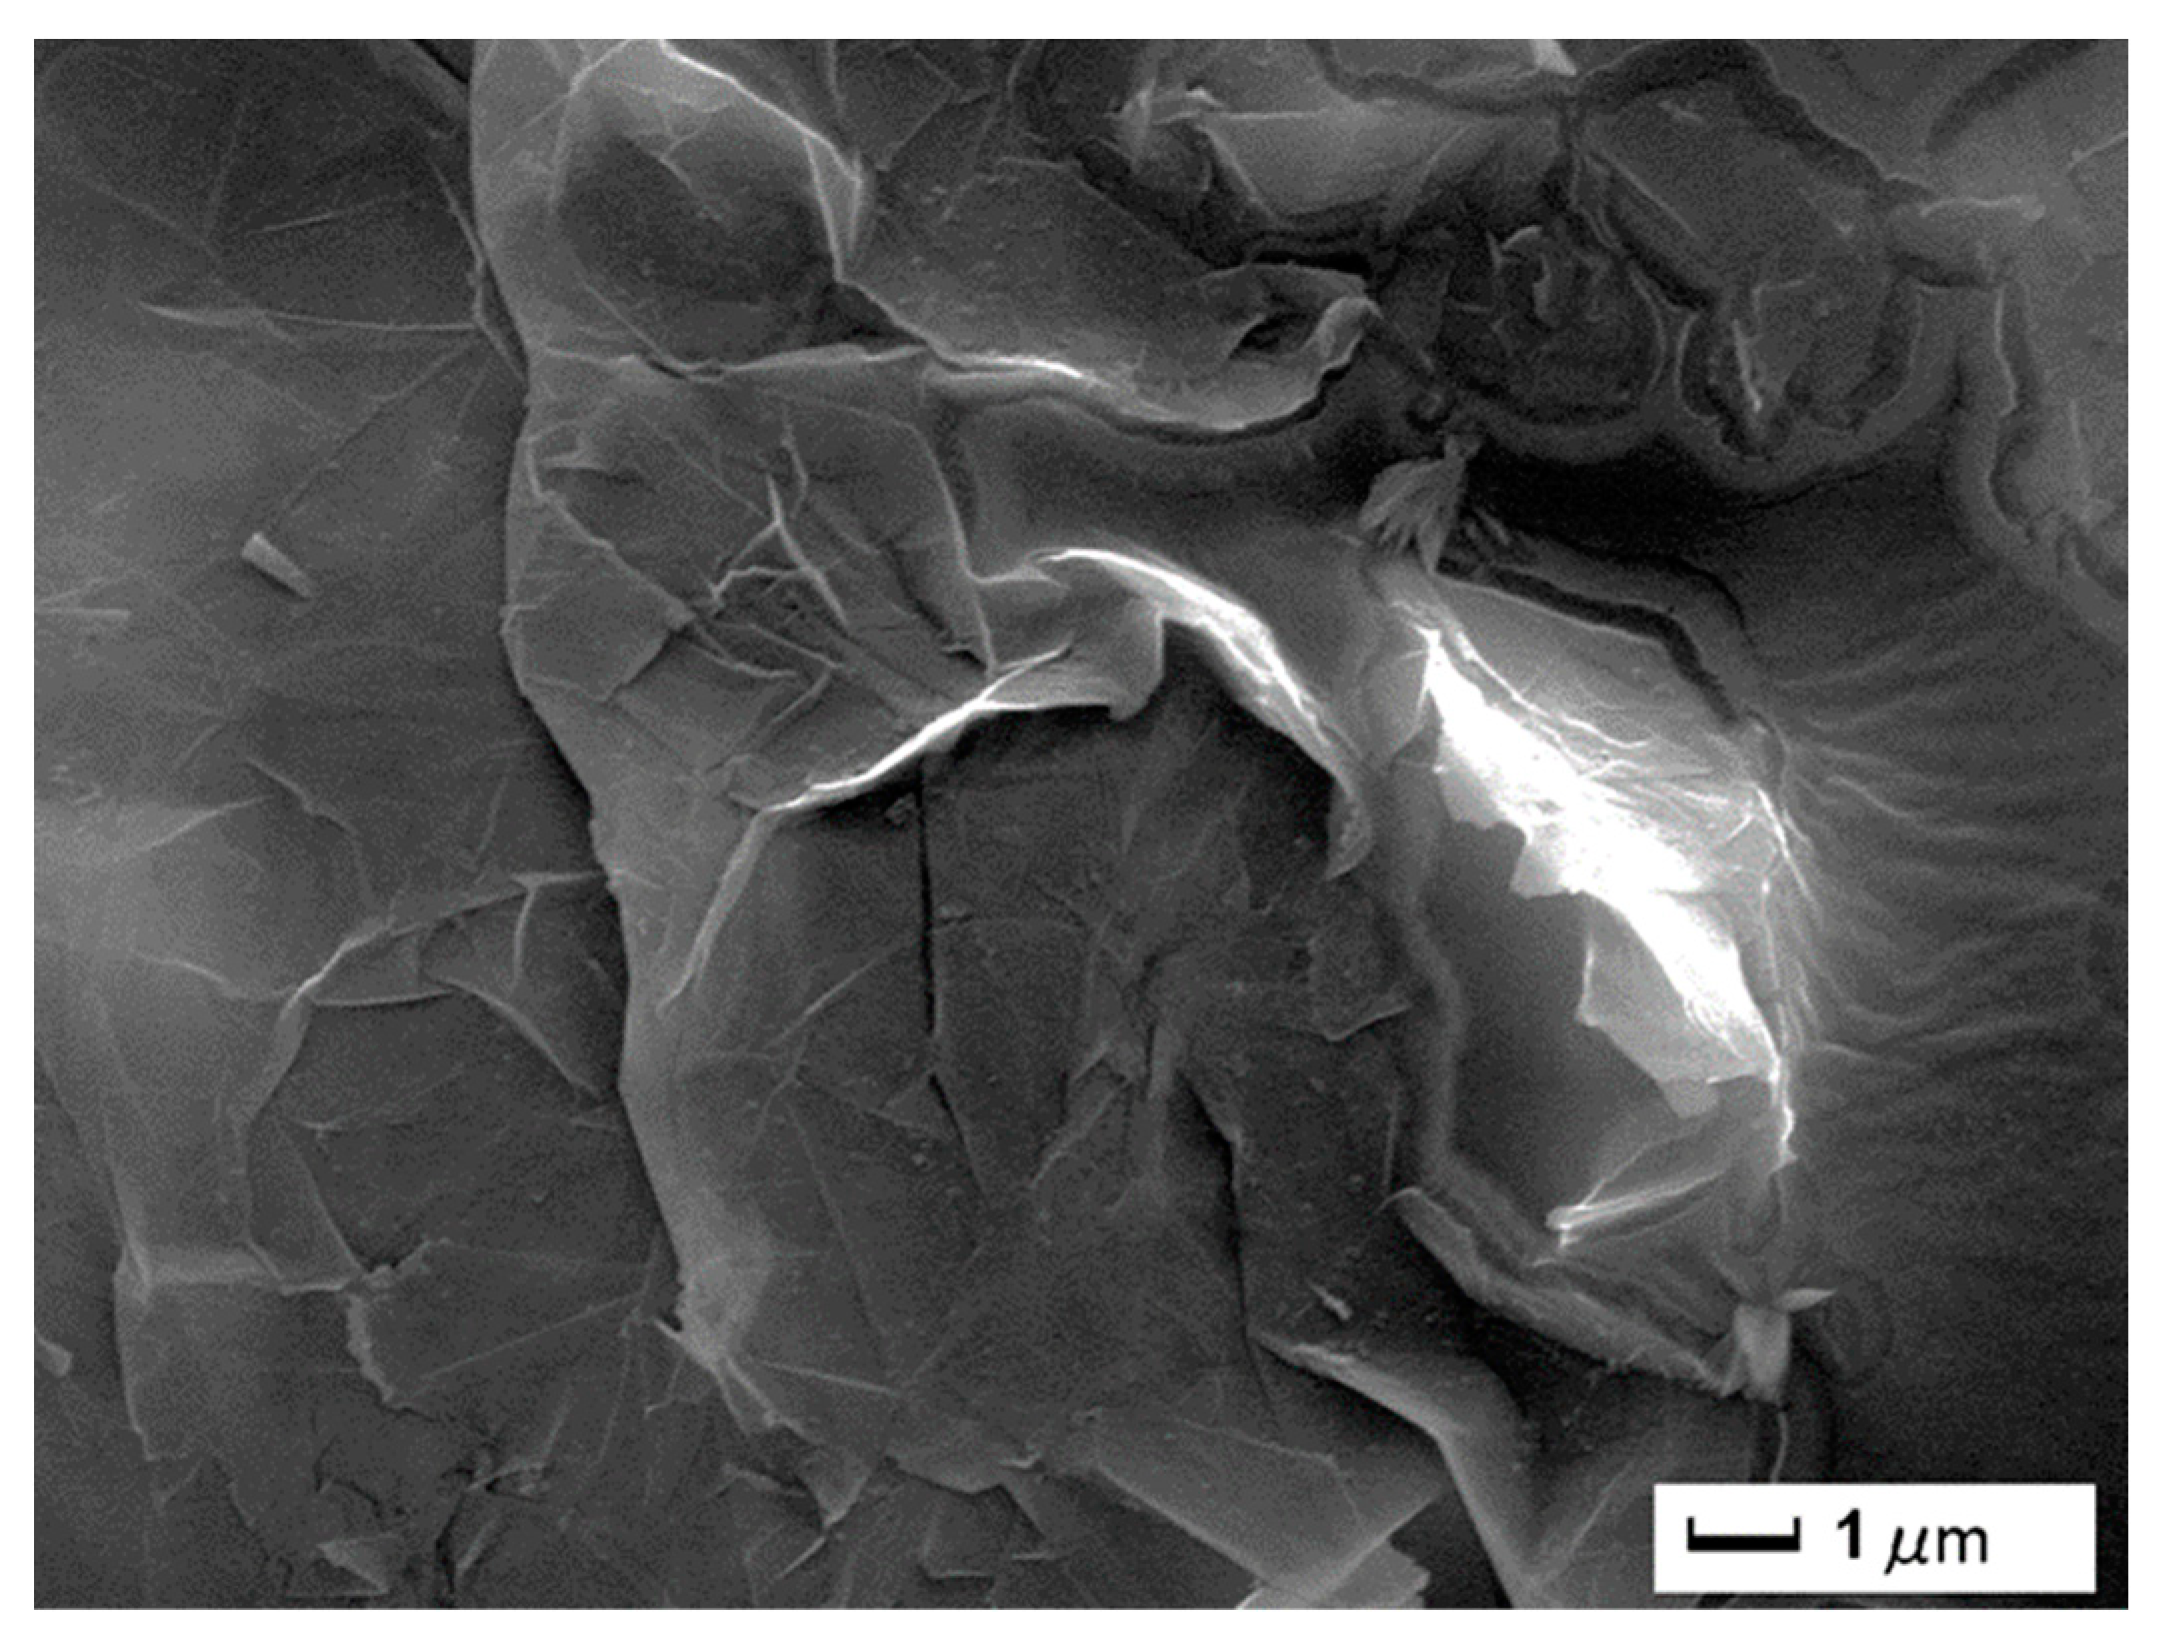
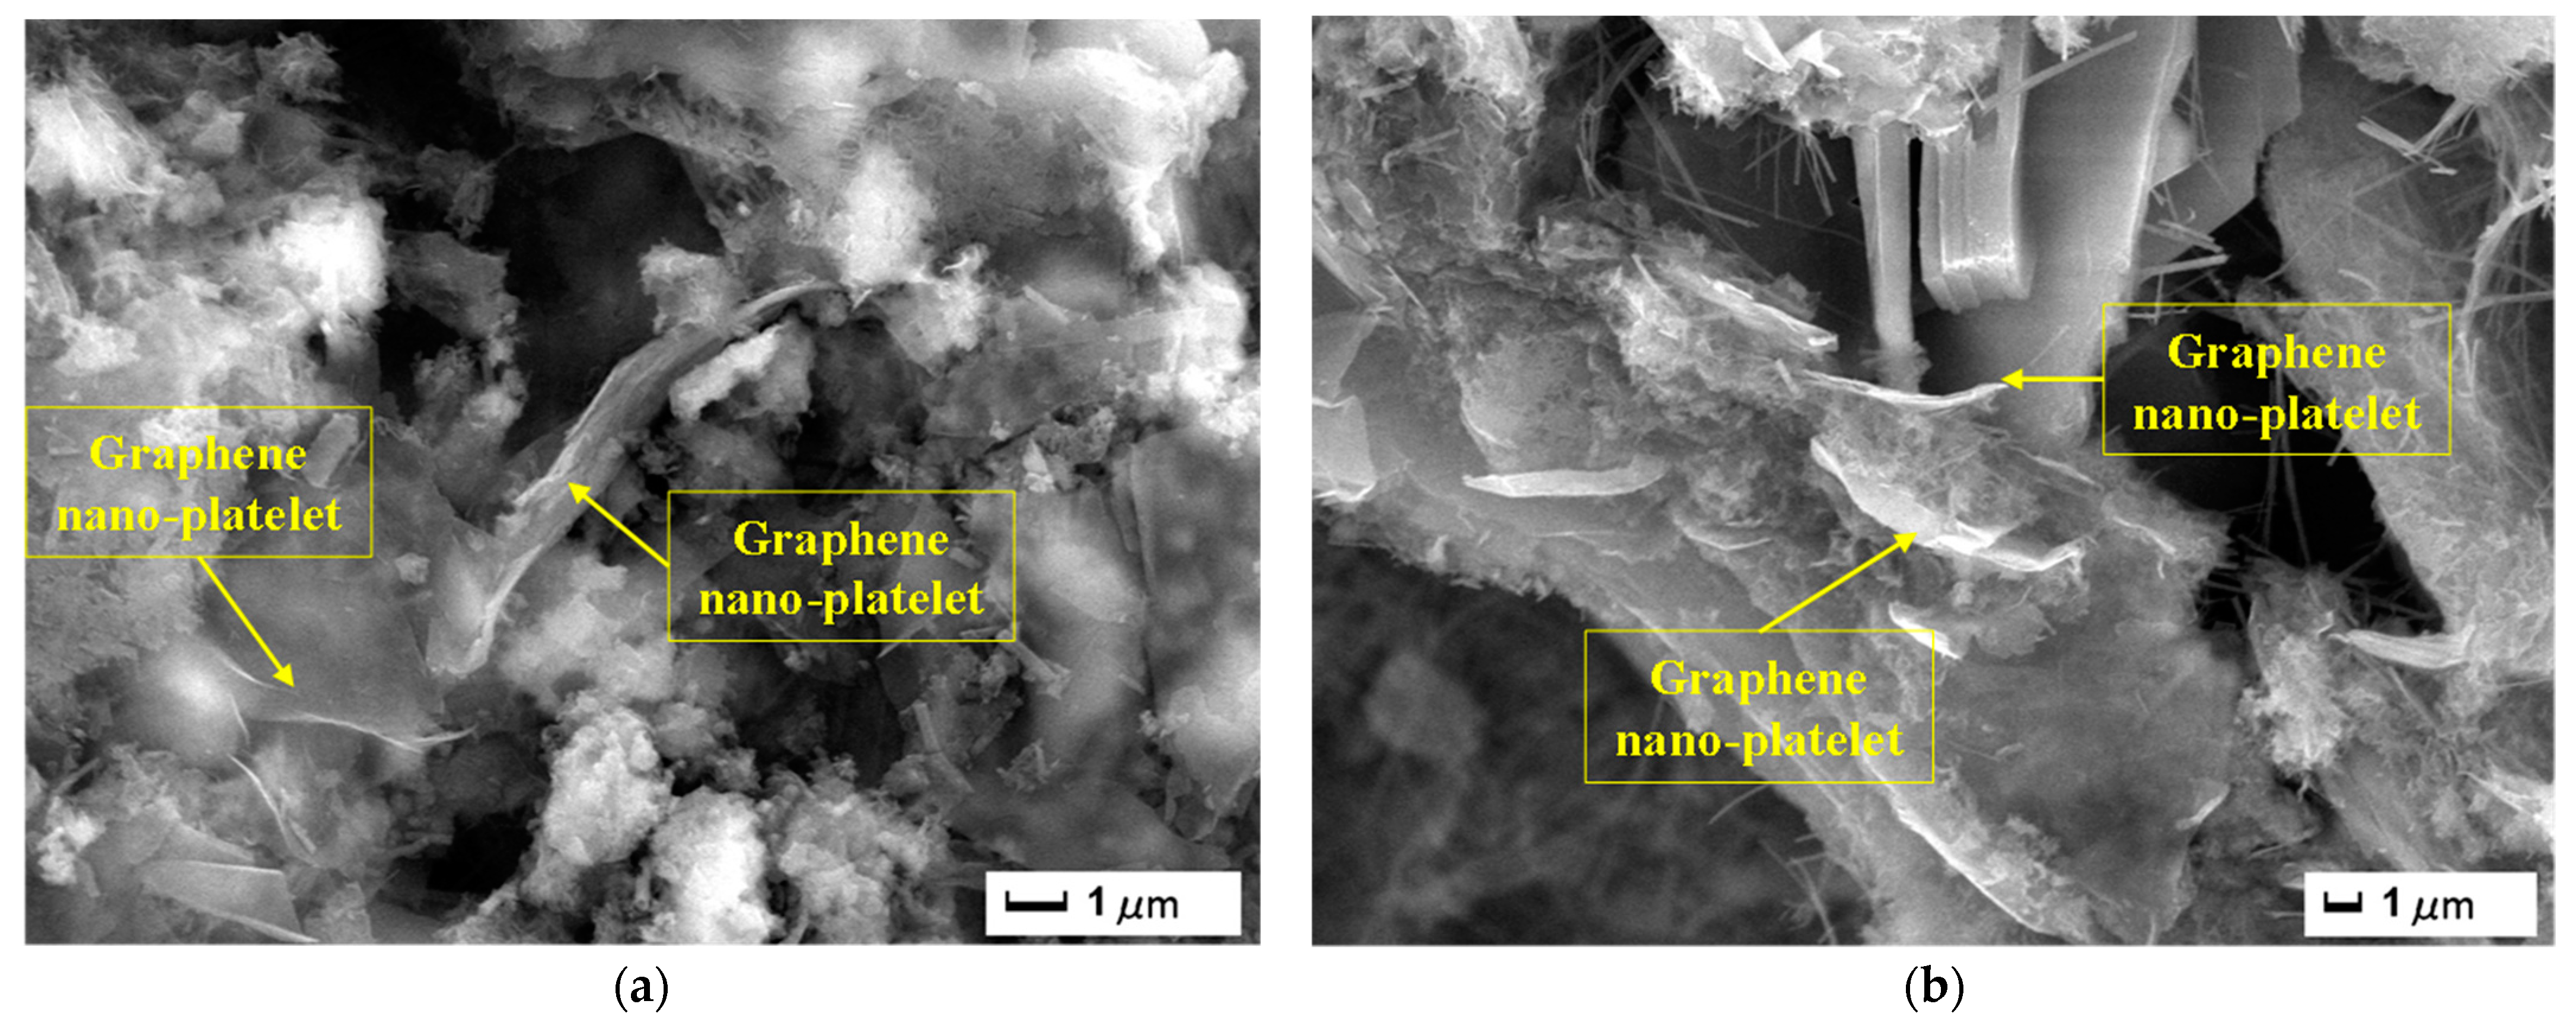
3.4. SEM
4. Discussion
4.1. Fitting Method and Fitting Parameters
4.2. Relationship between the Fitted Parameters and Microstructure
5. Conclusions
- (1)
- As the incorporated graphene content increases, the arc diameter of the impedance spectrum decreases, and the slope of the straight lines of the low-frequency region drops.
- (2)
- For the Bode curves, within low frequencies (1 Hz and 10 Hz), the impedance of the mortar gradually increases as the graphene dosage increases. However, when the frequency is between 100,000 Hz and 1,000,000 Hz), the impedance drops with a higher amount of graphene.
- (3)
- According to the MIP test results, the incorporation of graphene increases the proportion of pores below 0.1 μm. The SEM results show that the graphene nanosheets embedded in CSH can be in contact with each other to form conductive pathways, as well as parallel to each other, probably exhibiting capacitance characteristics.
- (4)
- There is a linear relationship between the double-layer capacitor Q and the microscopic pore content smaller than 0.1 μm.
Author Contributions
Funding
Institutional Review Board Statement
Informed Consent Statement
Conflicts of Interest
References
- Koenders, E.A.B.; Pepe, M.; Martinelli, E. Compressive strength and hydration processes of concrete with recycled aggregates. Cem. Concr. Res. 2014, 56, 203–212. [Google Scholar] [CrossRef]
- Valipour, M.; Yekkalar, M.; Shekarchi, M.; Panahi, S. Environmental assessment of green concrete containing natural zeolite on the global warming index in marine environments. J. Clean. Prod. 2014, 65, 418–423. [Google Scholar] [CrossRef]
- Nazar, S.; Yang, J.; Thomas, B.S.; Azim, I.; Ur Rehman, S.K. Rheological properties of cementitious composites with and without nano-materials: A comprehensive review. J. Clean. Prod. 2020, 272, 122701. [Google Scholar] [CrossRef]
- Chintalapudi, K.; Pannem, R.M.R. An intense review on the performance of graphene oxide and reduced graphene oxide in an admixed cement system. Constr. Build. Mater. 2020, 259, 120598. [Google Scholar] [CrossRef]
- Sharma, S.; Kothiyal, N.C. Comparative effects of pristine and ball-milled graphene oxide on physico-chemical characteristics of cement mortar nanocomposites. Constr. Build. Mater. 2016, 115, 256–268. [Google Scholar] [CrossRef]
- Pei, C.; Zhu, J.H.; Xing, F. Photocatalytic property of cement mortars coated with graphene/TiO2 nanocomposites synthesized via sol–gel assisted electrospray method. J. Clean. Prod. 2021, 279, 123590. [Google Scholar] [CrossRef]
- Sou, Y.; Guo, R.; Xia, H.; Yang, Y.; Zhou, B.; Zhao, Z. A review of graphene oxide/cement composites: Performance, functionality, mechanisms, and prospects. J. Build. Eng. 2022, 53, 104502. [Google Scholar]
- Musavi, S.M.; Barahuie, F.; Irani, M.; Safamanesh, A.; Malekpour, A. Enhanced properties of phase change material -SiO2-graphene nanocomposite for developing structural–functional integrated cement for solar energy absorption and storage. Renew. Energy 2021, 174, 918–927. [Google Scholar] [CrossRef]
- Hu, M.; Guo, J.; Li, P.; Chen, D.; Xu, Y.; Feng, Y.; Yu, Y.; Zhang, H. Effect of characteristics of chemical combined of graphene oxide-nanosilica nanocomposite fillers on properties of cement-based materials. Constr. Build. Mater. 2019, 225, 745–753. [Google Scholar] [CrossRef]
- Sharma, S.; Singh, S.; Khare, N. Enhanced photosensitization of zinc oxide nanorods using polyaniline for efficient photocatalytic and photoelectrochemical water splitting. Int. J. Hydrog. Energy 2016, 41, 21088–21098. [Google Scholar] [CrossRef]
- Yu, L.; Bai, S.; Guan, X. Graphene oxide–silica nanocomposites reinforced mortars: Mechanical properties, permeability and microstructure. Constr. Build. Mater. 2022, 344, 128290. [Google Scholar] [CrossRef]
- Liu, H.; Yu, Y.; Liu, H.; Jin, J.; Liu, S. Hybrid effects of nano-silica and graphene oxide on mechanical properties and hydration products of oil well cement. Constr. Build. Mater. 2018, 191, 311–319. [Google Scholar] [CrossRef]
- Huang, J.; Gao, Y.; Luo, J.; Wang, S.; Li, C.; Chen, S.; Zhang, J. Editors’ Choice—Review—Impedance Response of Porous Electrodes: Theoretical Framework, Physical Models and Applications. J. Electrochem. Soc. 2020, 167, 166503. [Google Scholar] [CrossRef]
- Chi, L.; Wang, Z.; Lu, S.; Zhao, D.; Yao, Y. Development of mathematical models for predicting the compressive strength and hydration process using the EIS impedance of cementitious materials. Constr. Build. Mater. 2019, 208, 659–668. [Google Scholar] [CrossRef]
- Maurya, K.K.; Rawat, A.; Jha, G. Smart materials and electro-mechanical impedance technique: A review. Mater. Today Proc. 2020, 33, 4993–5000. [Google Scholar] [CrossRef]
- Sánchez, M.; Gregori, J.; Alonso, C.; García-Jareño, J.J.; Takenouti, H.; Vicente, F. Electrochemical impedance spectroscopy for studying passive layers on steel rebars immersed in alkaline solutions simulating concrete pores. Electrochim. Acta 2007, 52, 7634–7641. [Google Scholar] [CrossRef]
- Pichór, W.; Frąc, M.; Radecka, M. Determination of percolation threshold in cement composites with expanded graphite by impedance spectroscopy. Cem. Concr. Compos. 2022, 125, 104328. [Google Scholar] [CrossRef]
- GB 175-2020; Common Portland Cement. Chinese National Standards: Beijing, China, 2020. (In Chinese)
- Liu, Q.; Tang, H.; Chi, L.; Chen, K.; Zhang, L.; Lu, C. Evolution of Electrochemical Impedance Spectra Characteristics of Cementitious Materials after Capturing Carbon Dioxide. Sustainability 2023, 15, 2460. [Google Scholar] [CrossRef]
- Tang, H.; Qian, J.; Qin, J.; Li, Z.; Jia, X.; Yue, Y.; Dai, F. Electrochemical behavior of steel bars in magnesium phosphate cement. Cem. Concr. Res. 2023, 169, 107167. [Google Scholar] [CrossRef]
- He, F.; Wang, R.; Shi, C.; Chen, C.; Lin, L.; An, X. Error evaluation and correction of stray impedance during measurement and interpretation of AC impedance of cement-based materials. Cem. Concr. Compos. 2016, 72, 190–200. [Google Scholar] [CrossRef]
- Hu, X.; Shi, C.; Liu, X.; Zhang, J.; de Schutter, G. A review on microstructural characterization of cement-based materials by AC impedance spectroscopy. Cem. Concr. Compos. 2019, 100, 1–14. [Google Scholar] [CrossRef]
- Shi, M.; Chen, Z.; Sun, J. Determination of chloride diffusivity in concrete by AC impedance spectroscopy. Cem. Concr. Res. 1999, 29, 1111–1115. [Google Scholar] [CrossRef]
- Dhouibi, L.; Triki, E.; Raharinaivo, A. The application of electrochemical impedance spectroscopy to determine the long-term effectiveness of corrosion inhibitors for steel in concrete. Cem. Concr. Compos. 2002, 24, 35–43. [Google Scholar] [CrossRef]
- Gu, P.; Xu, Z.; Xie, P.; Beaudoin, J.J. Application of A.C. impedance techniques in studies of porous cementitious materials. (I): Influence of solid phase and pore solution on high frequency resistance. Cem. Concr. Res. 1993, 23, 1007–1015. [Google Scholar] [CrossRef]
- McCarter, W.J.; Chrisp, T.M.; Starrs, G.; Adamson, A.; Basheer, P.A.M.; Nanukuttan, S.V.; Srinivasan, S.; Green, C. Characterization of physio-chemical processes and hydration kinetics in concretes containing supplementary cementitious materials using electrical property measurements. Cem. Concr. Res. 2013, 50, 26–33. [Google Scholar] [CrossRef]
- Dalal, S.P.; Dalal, P. Experimental investigation on strength and durability of graphene nanoengineered concrete. Constr. Build. Mater. 2021, 276, 122236. [Google Scholar] [CrossRef]
- Raj, A.; Sathyan, D.; Mini, K.M. Physical and functional characteristics of foam concrete: A review. Constr. Build. Mater. 2019, 221, 787–799. [Google Scholar] [CrossRef]
- Diamond, S. Aspects of concrete porosity revisited. Cem. Concr. Res. 1999, 29, 1181–1188. [Google Scholar] [CrossRef]
- Kong, L.; Hou, L.; Bao, X. Application of AC impedance technique in study of lightweight aggregate-paste interface. Constr. Build. Mater. 2015, 82, 332–340. [Google Scholar] [CrossRef]
- Vicente, C.; Castela, A.S.; Neves, R.; Montemor, M.F. Assessment of the influence of concrete modification in the water uptake/evaporation kinetics by electrochemical impedance spectroscopy. Electrochim. Acta 2017, 247, 50–62. [Google Scholar] [CrossRef]
- Sánchez, I.; Nóvoa, X.R.; de Vera, G.; Climent, M.A. Microstructural modifications in Portland cement concrete due to forced ionic migration tests. Study by impedance spectroscopy. Cem. Concr. Res. 2008, 38, 1015–1025. [Google Scholar] [CrossRef]


| In-Plane Diameter (μm) | Thickness (nm) | Density (kg/m3) | Specific Surface Area (m2/g) | Appearance |
|---|---|---|---|---|
| 5–15 | 2–3 | 1400 | 190 | Dark powder |
| Name | Cement | Sand | Water | Graphene | Superplasticizer |
|---|---|---|---|---|---|
| Grams | %Mass of Cement | ||||
| N | 100 | 300 | 60 | 0 | 0 |
| G1 | 100 | 300 | 60 | 0.1 | 0.1 |
| G2 | 100 | 300 | 60 | 0.2 | 0.2 |
| G4 | 100 | 300 | 60 | 0.4 | 0.4 |
| G8 | 100 | 300 | 60 | 0.8 | 0.8 |
| G16 | 100 | 300 | 60 | 1.6 | 1.6 |
| G32 | 100 | 300 | 60 | 3.2 | 3.2 |
| 1/Q (μF/cm2) | R1 (Ω) | R2 (Ω) | |
|---|---|---|---|
| N | 117.3 | 671.2 | 5.953 × 10⁴ |
| G1 | 56.9 | 540.5 | 1.362 × 10⁵ |
| G2 | 53.5 | 658.3 | 1.259 × 10⁵ |
| G4 | 48.1 | 645.2 | 1.674 × 10⁵ |
| G8 | 49.2 | 607.4 | 3.031 × 10⁵ |
| G16 | 39.0 | 417.6 | 1.015 × 10⁵ |
| G32 | 42.0 | 193.0 | 1.959 × 10⁵ |
Disclaimer/Publisher’s Note: The statements, opinions and data contained in all publications are solely those of the individual author(s) and contributor(s) and not of MDPI and/or the editor(s). MDPI and/or the editor(s) disclaim responsibility for any injury to people or property resulting from any ideas, methods, instructions or products referred to in the content. |
© 2023 by the authors. Licensee MDPI, Basel, Switzerland. This article is an open access article distributed under the terms and conditions of the Creative Commons Attribution (CC BY) license (https://creativecommons.org/licenses/by/4.0/).
Share and Cite
Wang, S.; Cheng, Z.; Liu, Q.; Huang, Y.; Liang, K.; Wang, X. Relationship between Alternated Current Impedance Spectrum and Microstructure of Graphene Enhanced Concrete. Sustainability 2023, 15, 13894. https://doi.org/10.3390/su151813894
Wang S, Cheng Z, Liu Q, Huang Y, Liang K, Wang X. Relationship between Alternated Current Impedance Spectrum and Microstructure of Graphene Enhanced Concrete. Sustainability. 2023; 15(18):13894. https://doi.org/10.3390/su151813894
Chicago/Turabian StyleWang, Shijun, Ziyun Cheng, Qiong Liu, Yuwen Huang, Kui Liang, and Xing Wang. 2023. "Relationship between Alternated Current Impedance Spectrum and Microstructure of Graphene Enhanced Concrete" Sustainability 15, no. 18: 13894. https://doi.org/10.3390/su151813894
APA StyleWang, S., Cheng, Z., Liu, Q., Huang, Y., Liang, K., & Wang, X. (2023). Relationship between Alternated Current Impedance Spectrum and Microstructure of Graphene Enhanced Concrete. Sustainability, 15(18), 13894. https://doi.org/10.3390/su151813894