Article

Reinventing the Urban Neighborhood Green Index in the Context of Urban Ecology as a Conceptual Framework in Northern Nicosia, Cyprus

1
Department of Architecture, Faculty of Architecture, Near East University, Nicosia 99138, Turkey
2
Department of Landscape Architecture, Faculty of Agriculture, Near East University, Nicosia 99138, Turkey
*
Author to whom correspondence should be addressed.
Sustainability 2023, 15(18), 13880; https://doi.org/10.3390/su151813880
Submission received: 27 June 2023 / Revised: 6 September 2023 / Accepted: 8 September 2023 / Published: 18 September 2023

Abstract

:
Today, one in two people live in urban environments, and this number is expected to rise. Urban ecology is among the main concepts of the ecological urban planning agenda for cities where the consequences of global warming and climate change are increasing day by day. Urban open green spaces provide a variety of ecosystem services for city dwellers. It is important that green spaces are accessible, efficient, walkable and properly planned in the city. Within this framework, via the relevant theoretical evaluation, a conceptual framework was constructed to redefine the urban neighborhood green index. Regarding the existing definitions within the related literature, this developed index includes quantitative, qualitative and perceptual parameters and has been newly introduced to measure and analyze green spaces in a more comprehensive layout. There is also a need to establish an ecological approach to urban planning to increase the quantity and quality of urban green spaces in Cyprus, including in Northern Nicosia. Therefore, Northern Nicosia, with its three selected neighborhoods, was chosen as the study area. As the main methodology of the study, a thorough assessment of the quantitative component of the developed index with its four parameters of per-capita green space, proximity to green space, area percentages and type of green spaces is made. Maps from the Town Planning Department and satellite images from the Nicosia Turkish Municipality and GIS were used for this quantitative measurement. Based on the findings, it can be argued that the urban green spaces are not sufficient when assessed based on most of the parameters evaluated within the study to construct a comprehensive green space index. It was found that the green spaces in the city are accessible, being within 337 m, which is reasonable. However, there are very few active and accessible open green areas in these neighborhoods within the 300 and 500 m buffers, as a remarkable number of the green spaces, which are shown on the map, are in an abandoned condition. In addition, the amount of active green space per capita is 3.35 m2, which is well below the 9 m2 predicted by WHO. The area percentages of the neighborhoods are also below the required standards. Therefore, the findings show that Northern Nicosia can benefit by addressing these deficiencies to achieve a higher urban neighborhood green index. Furthermore, the theoretical model is efficient for the assessment of urban spaces at the neighborhood scale and can be used in other cities worldwide, especially in cities with a relatively low density. In sum, this study, which considered not only the quantitative parameters but also the qualitative and perceptual features, has the potential to expand scientific knowledge on measuring and analyzing urban neighborhood green spaces.

1. Introduction

The world is becoming an increasingly urban place, with approximately 65% of its population expected to reside in urban areas by 2025. Due to this rapid urbanization, natural ecosystems are increasingly being replaced by urban development. In this urbanization era, all four pillars of sustainability have been acknowledged to provide solutions to the challenges occurring at an accelerated rate [1]. Sustainability is a widely recognized common goal for humanity and has become an increasingly dominant theme in design and planning. Although the term has been defined in various ways, sustainability often refers to the ability of a coupled human–nature system that can persist in a desirable state for multiple generations in the face of anthropogenic and environmental perturbations and uncertainties [2].
Sustainable development requires improving the quality of life of all individuals without exceeding the world’s capacity to exploit natural resources. Therefore, it seems appropriate to change the existing urban and regional administrative system to cope with the challenges faced by urban planning and to achieve the goal of urban sustainability [3].
For this reason, planning and design principles based on an ecological approach should be established from the top to the urban scale in the planning process. Furthermore, the ecological, economic and sociocultural services of this approach should be reflected at all levels. In urban planning, it is necessary to ensure the continuity of the natural ecosystem in the city on the basis that a city is an ecosystem that cannot be separated from natural and rural areas [4].
In line with this information, the concept of urban ecology has become increasingly important for cities. According to [5], urban ecology has emerged as an integrated science aiming to examine and evaluate large urban areas that include not only biological and physical features but also built and social components. It can be argued that urban green spaces are one of the main features of this term.
Urban green spaces significantly affect both the capacity to support biodiversity and the provision of critical ecosystem services [6]. Spaces such as parks, forests, green roofs, streams, and community gardens not only provide critical ecosystem services but also support the physical activity, psychological well-being, and public health of city dwellers [7]. In other words, improving access to green areas, increasing the quality of these areas and protecting ecological values play an important role in the planning of cities [8].
Within this framework, Northern Nicosia was chosen as the study area. There is an urbanization trend in Cyprus, including in Northern Nicosia. This trend has required establishing an ecological approach to urban planning to increase the quantity and quality of urban green spaces. Therefore, this study aims to make a thorough assessment of green spaces in the chosen neighborhoods of the city in relation to the conceptual framework developed as the urban neighborhood green index (UNGI).
The following section summarizes the relevant literature on urban ecology, urban green spaces and UNGI. Within the relevant theoretical evaluation, a conceptual framework was created to determine the main characteristics and their measures as an index for the neighborhood urban green spaces in the city. Following this, a quantitative analysis of the specific parameters was conducted in selected neighborhoods of Northern Nicosia after the evaluation of the research area. The final section includes conclusions based on the literature review, analyses, evaluations and recommendations.

2. Literature Review

2.1. Urban Ecology as the Main Feature of Ecological Planning

Cities are complex dynamic systems in constant change. They develop and grow in complex ways due to their size, social structures, economic systems, geopolitical environments and ecological evolution [9]. The ecological environment is a very important part of the development of cities and has a great impact on human survival and development. Therefore, planning cities with an ecological approach is important for the survival of the city. Within this framework, from the late 1960s onwards, scientists, scholars and decision makers, beginning with those in developed countries, began to adopt an ecological approach to urban planning and design. Thus, several thriving urban planning movements, such as ecological cities, smart cities, green cities and sustainable cities, have emerged worldwide.
One of these important movements is the concept of a ‘smart city’. Smart cities provide microlevel monitoring of urban systems. The purpose of the development of these cities is to provide quality and innovative services to citizens, economic activities, institutions and visitors, along with the production of a safe and comprehensive urban environment [10]. This concept is becoming increasingly central to debates on urban development and sustainability, and consequently, cities are now embracing this concept as a way to improve energy efficiency, transport, and public services [11].
Another movement developed as a concept with the basis of an ecological approach is the ‘green city’. This concept is one of the terms developed to address the problems caused by dispersed developing cities and to help cities become more sustainable (greener), less dispersed and more livable [12]. Green cities are defined as cities that try to reduce waste, expand recycling and reduce their environmental impact. These cities reduce emissions, increase housing density while expanding open space and encourage the development of sustainable local businesses [13].
Another concept aiming to adopt ecological principles for the planning and design of cities is ‘ecological cities’. Ecological cities emerging with the target of adding a new meaning to the city in an ecological sense are considered as a new solution proposal. Therefore, cities that produce their own energy and are respectful to nature can be created. The concept of an ecological city is an approach to urban design and application where the city and the environment interact. This approach aims to provide a healthy human settlement where living organisms and natural ecosystems can continue their functions in harmony [14]. Eco-cities are accessible for all, balanced with nature. Reducing waste, reusing and recycling, developing integrated transportation policies and integrating with nature are the principles of this term [15].
Furthermore, a ‘sustainable’ city is another remarkable concept developed within the discourse of the ecological approach. A sustainable city can achieve economic development, social development and environmental development together [16]. In addition to environmental dimensions, economic growth, governance, transparency, social justice and participation fall within the dimensions of this movement.
In conclusion, urban ecology is a key feature for all these planning and design movements. The concept of urban ecology has become increasingly important for cities as a part of complex landscape ecology or even as a separate discipline [17]. Urban ecology includes “spatial and temporal patterns, environmental effects and sustainability of urbanization” and “urban sustainability, with an emphasis on biological diversity, ecosystem processes and ecosystem services”. It is an adaptive process that facilitates and maintains a virtuous cycle between ecosystem services and human well-being through harmonious ecological, economic and social actions in response to changes within and beyond the urban landscape [18].
Urban ecology, which is an important term in this context, prioritizes the methods and practices that take into account the environmental sensitivities in the planning of the new developing areas of cities and support ‘urban efficiency’, ‘productivity’, ‘protection’ and ‘reuse’ within the urban economic development model. Urban ecology can also be defined as all the efforts to create healthy and livable islets within existing urban areas. Briefly, urban ecology involves planning urban growth with an ecological approach [19].
The conservation and enhancement of biodiversity in cities are core issues within the term urban ecology. The protection of biodiversity is crucial to issues such as providing vital resources (food and medicine), economic income and stability, ensuring the existence of ecosystems in the long term and intrinsic value. Landscape ecology provides a scientific framework on which biodiversity planning can be based [20].
Well-designed open green areas are an important factor in protecting habitats and biodiversity [21]. Urban green spaces are a key element of urban ecology. In other words, urban green space is a vital component of cities. There is much empirical evidence indicating that urban parks and green spaces foster a wide array of species, stimulate a large range of roles for the human population and are beneficial in terms of social, economic and environmental sustainability in cities [22].

2.2. Urban Green Spaces

The increasing need for residential areas with urbanization has caused a decrease in the amount of greenery. Greenery has an important role as an indicator of environmental conditions in urban areas [23]. Cities that provide more green spaces for every individual can offer more opportunities for recreation, thereby improving the quality of life of their residents. The nature of green spaces in a city is an important factor in determining the benefits for people. For example, cities with more clustered green spaces provide greater cooling effects than smaller parts with similar area coverage.
In other words, rapidly increasing urbanization continues to have a negative impact on green spaces in cities. As such, the importance of urban green areas is increasing. Urban green spaces are defined as open areas with a significant amount of vegetation and are mostly found as seminatural areas. Urban green spaces exist as the last remnant of nature in urban areas and typically perform important functions such as conserving biodiversity, preventing erosion that absorbs rainwater and pollutants and mitigating urban heat island effects [24].
Initially, being only a decorative element in urban environments, green spaces have now acquired a new value and function that is widely accepted within sustainable development parameters [25]. Given the diverse ecosystem services they provide, urban green spaces have been integrated into urban planning and design, especially in developed countries [26]. The existence of urban green spaces has become increasingly important in ecological urban planning and research due to the well-being of city dwellers [27]. According to Taylor and Hochuli [28], green areas mostly consist of vegetation and are associated with natural elements, see Table 1.
Urban open and green spaces provide local climate stabilization through air filtration or shade provision, which is particularly important for strategies to mitigate urban heat island impacts within the framework of environmental benefits [29]. In addition, urban green spaces offer recreation and the opportunity to experience nature and these functions are important factors for improving the quality of life of citizens. Furthermore, urban green space is an important component of an ecological and livable environment. Absorbing carbon dioxide, increasing air humidity, protecting water and soil, reducing noise and preventing urban heat island effects are among the ecological functions of urban green spaces [30]. In other words, open green spaces also provide a variety of ecosystem services for city dwellers (e.g., climate regulation, rainwater regulation, recreation opportunities and aesthetic quality).
Social perspectives such as employment, education and security have recently been attached great importance in terms of urban livability. Furthermore, there is growing focus on environmental factors such as healthy air, a quiet neighborhood, an attractive street view and green areas within walking distance. This can be achieved by the presence of urban green areas [31]. These spaces also have the potential to reduce work-related stress and increase property values with the recreational facilities they provide as significant socioeconomic benefits.
Depending on their use, we can classify green spaces into three groups: public, semiprivate and private [32]. Public green spaces can also provide health benefits by providing a place for residents to participate in recreational physical activity within their boundaries and facilitate contact with nature and social interaction [33]. Semiprivate open green spaces cannot be used by the whole of society and are only open to use by the employees of institutions and organizations, their families or a certain group under certain conditions. Schools, public institutions and organizations, military areas and factory gardens are examples of this type [34]. Private open green spaces include gardens of residences and public housing [35].
The World Health Organization (WHO) advocates the necessity of 9 square meters of open space per person within a 15 min walk, and UN-Habitat recommends that open spaces are accessible within 800 m [36]. In addition to the amount of open and green space required per capita, there are several other standards, such as travel distance, for the application of green spaces, see Table 2.
In the city, open green areas are mostly classified within four scales based on their functions and activities: building level, neighborhood level, district level and city level. These urban green spaces form an integral part of any urban space, and the quantity and quality of urban green spaces are a primary concern for planners and city managers. It is important to measure urban green spaces at the neighborhood level, as the neighborhood scale is an important level of work for implementing greening strategies [38].

Green Spaces at the Neighborhood Scale

The neighborhood, which is a basic planning unit, has been used since ancient times. Human settlements are spatially divided into districts and neighborhoods, which expresses the importance of neighborhoods in the urban fabric [39].
A neighborhood is defined as an area that is homogeneous or has the same distinctive features in terms of ethnic origin, housing and development type. The term neighborhood is also synonymous with the environment; as such, it can be defined as the green area near a residential area and its distribution [38]. Neighborhood-scale small green spaces can respond to daily needs for contact with nature and the most valuable open green spaces are intimate and familiar spaces that play a role in people’s daily lives rather than remote ones [40].
On the neighborhood scale, the demand for green spaces from homes should be within a 400 m or 10 min walk. For example, the Berlin Ministry of Urban Development and Environment recommends that every resident has access to at least 0.5 hectares of open green space within 500 m from their home. In the UK, Natural England, a nonministerial government agency that advises the UK government on the natural environment, recommends that residents should have access to at least 2 hectares of natural green space 300 m from their home [27].
Neighborhood units are spaces that contain approximately 6 to 400 residences in scale and can accommodate 30 to 5000 inhabitants, covering an area of at most 15 ha. Areas such as green areas, children’s gardens or parks, sports and playgrounds and residential compound gardens are green area components at the scale of the neighborhood unit [32], see Table 3.
Focusing on a world-class living environment, a quality residential area stands out as an important issue in creating a sustainable living environment, and the landscape, which includes topography, vegetation, related plants, soil, water bodies and their spatial configuration, becomes one of the most visual needs of people [44].
Vegetation is a factor that changes the local climate [45]. It is also considered an important element of design in increasing the urban microclimate and outdoor thermal comfort in urban areas. However, vegetation is typically used in urban areas for aesthetic, utility and recreational purposes. There are two main elements in urban green spaces: hard landscapes and soft landscapes. Hardscapes are man-made and include paved spaces such as terraces, benches, their proportions and other artificial materials. Soft landscapes, on the other hand, are soft materials containing plants, flowers and water elements [46].

2.3. Urban Neighborhood Green Index (UNGI)

Most people live in cities, and urban green spaces are the primary source of contact with nature. Accessibility, walkability and usability to ecosystem services provided by urban green spaces are increasingly perceived as important factors for quality of life and have become key components of sustainable urban design and planning [47]. In other words, there are important studies showing that green spaces in the living environment can positively contribute to the overall quality of life of city residents. In particular, the amount of green space in the living environment and the effects of this amount have been associated with health and well-being benefits [48].
In line with this information, an index for urban neighborhood green spaces is vital for establishing a comprehensive, efficient and viable network of greenery, boosting urban design and planning in diverse dimensions. The UNGI evaluates the spatial distribution of urban green areas around urban development. Here, the term neighborhood is used as a spatial concept because the analysis is partly based on neighborhood characteristics. The characteristics of urban structuring at the neighborhood level are defined by parameters such as proximity to green, building density, per capita green space and building height.
Accessibility, which is typically defined as the proximity (linear distance or walking distance) of urban green spaces to residences, is one of the most important factors affecting the frequent use of open green spaces and increasing well-being among users. Therefore, it is crucial that all residential areas have accessible open green spaces at various hierarchical levels to improve the quality of urban life [49]. According to Zhu et al. [50], the proximity to green spaces acts as an accessibility indicator for urban green space, indicating the distance from a building to the nearest green space. The proximity to green space affects the purpose and frequency of visits and the social role of these spaces is affected by their optimal distribution.
Furthermore, the proximity to urban green spaces comes to the fore as one of the most discussed issues in sustainable urban planning [51]. It is one of the main factors affecting the frequent use of urban green spaces and improving people’s quality of life. In addition, proximity refers to the distance from a resident’s home to the recreation area or trail, in addition to how safe and easily accessible the recreation area is. In terms of available time during the week, most working people have somewhat limited opportunities to engage in recreational activities outside of their residential areas. Therefore, near-home recreation opportunities are crucial to meeting daily recreational needs [52].
It is necessary to analyze the existing green cover distribution in the city repeatedly to meet the social and psychological needs of the residents and to ensure a quality environment for a better and healthier life. As such, the percentage of green space coverage, green coverage per capita and the degree of green space agglomeration in a city are likely to have significant effects on the urban ecosystem services provided and the net benefits gained by people [53]. Furthermore, Veal [54] explains ‘area percentages’ as ‘a certain percentage of land to be allocated for open space’ and this area percentage is estimated and evaluated by remote sensing methods. Remote sensing and GIS (geographical information systems) provide new tools for the assessment and mapping of advanced natural resources and estimation of the green percentage in the study area [23].
Such an analysis should also focus on the amount of green space per capita available to every citizen [55]. The standard approach has traditionally been used to ensure consistency and precision in urban space planning. This approach also answers the question of how much green space is sufficient for a person [56]. In other words, another indicator of the green city index is the amount of area per capita. Decreased urban green space per capita results in decreased daily exposure to more natural environments [57].
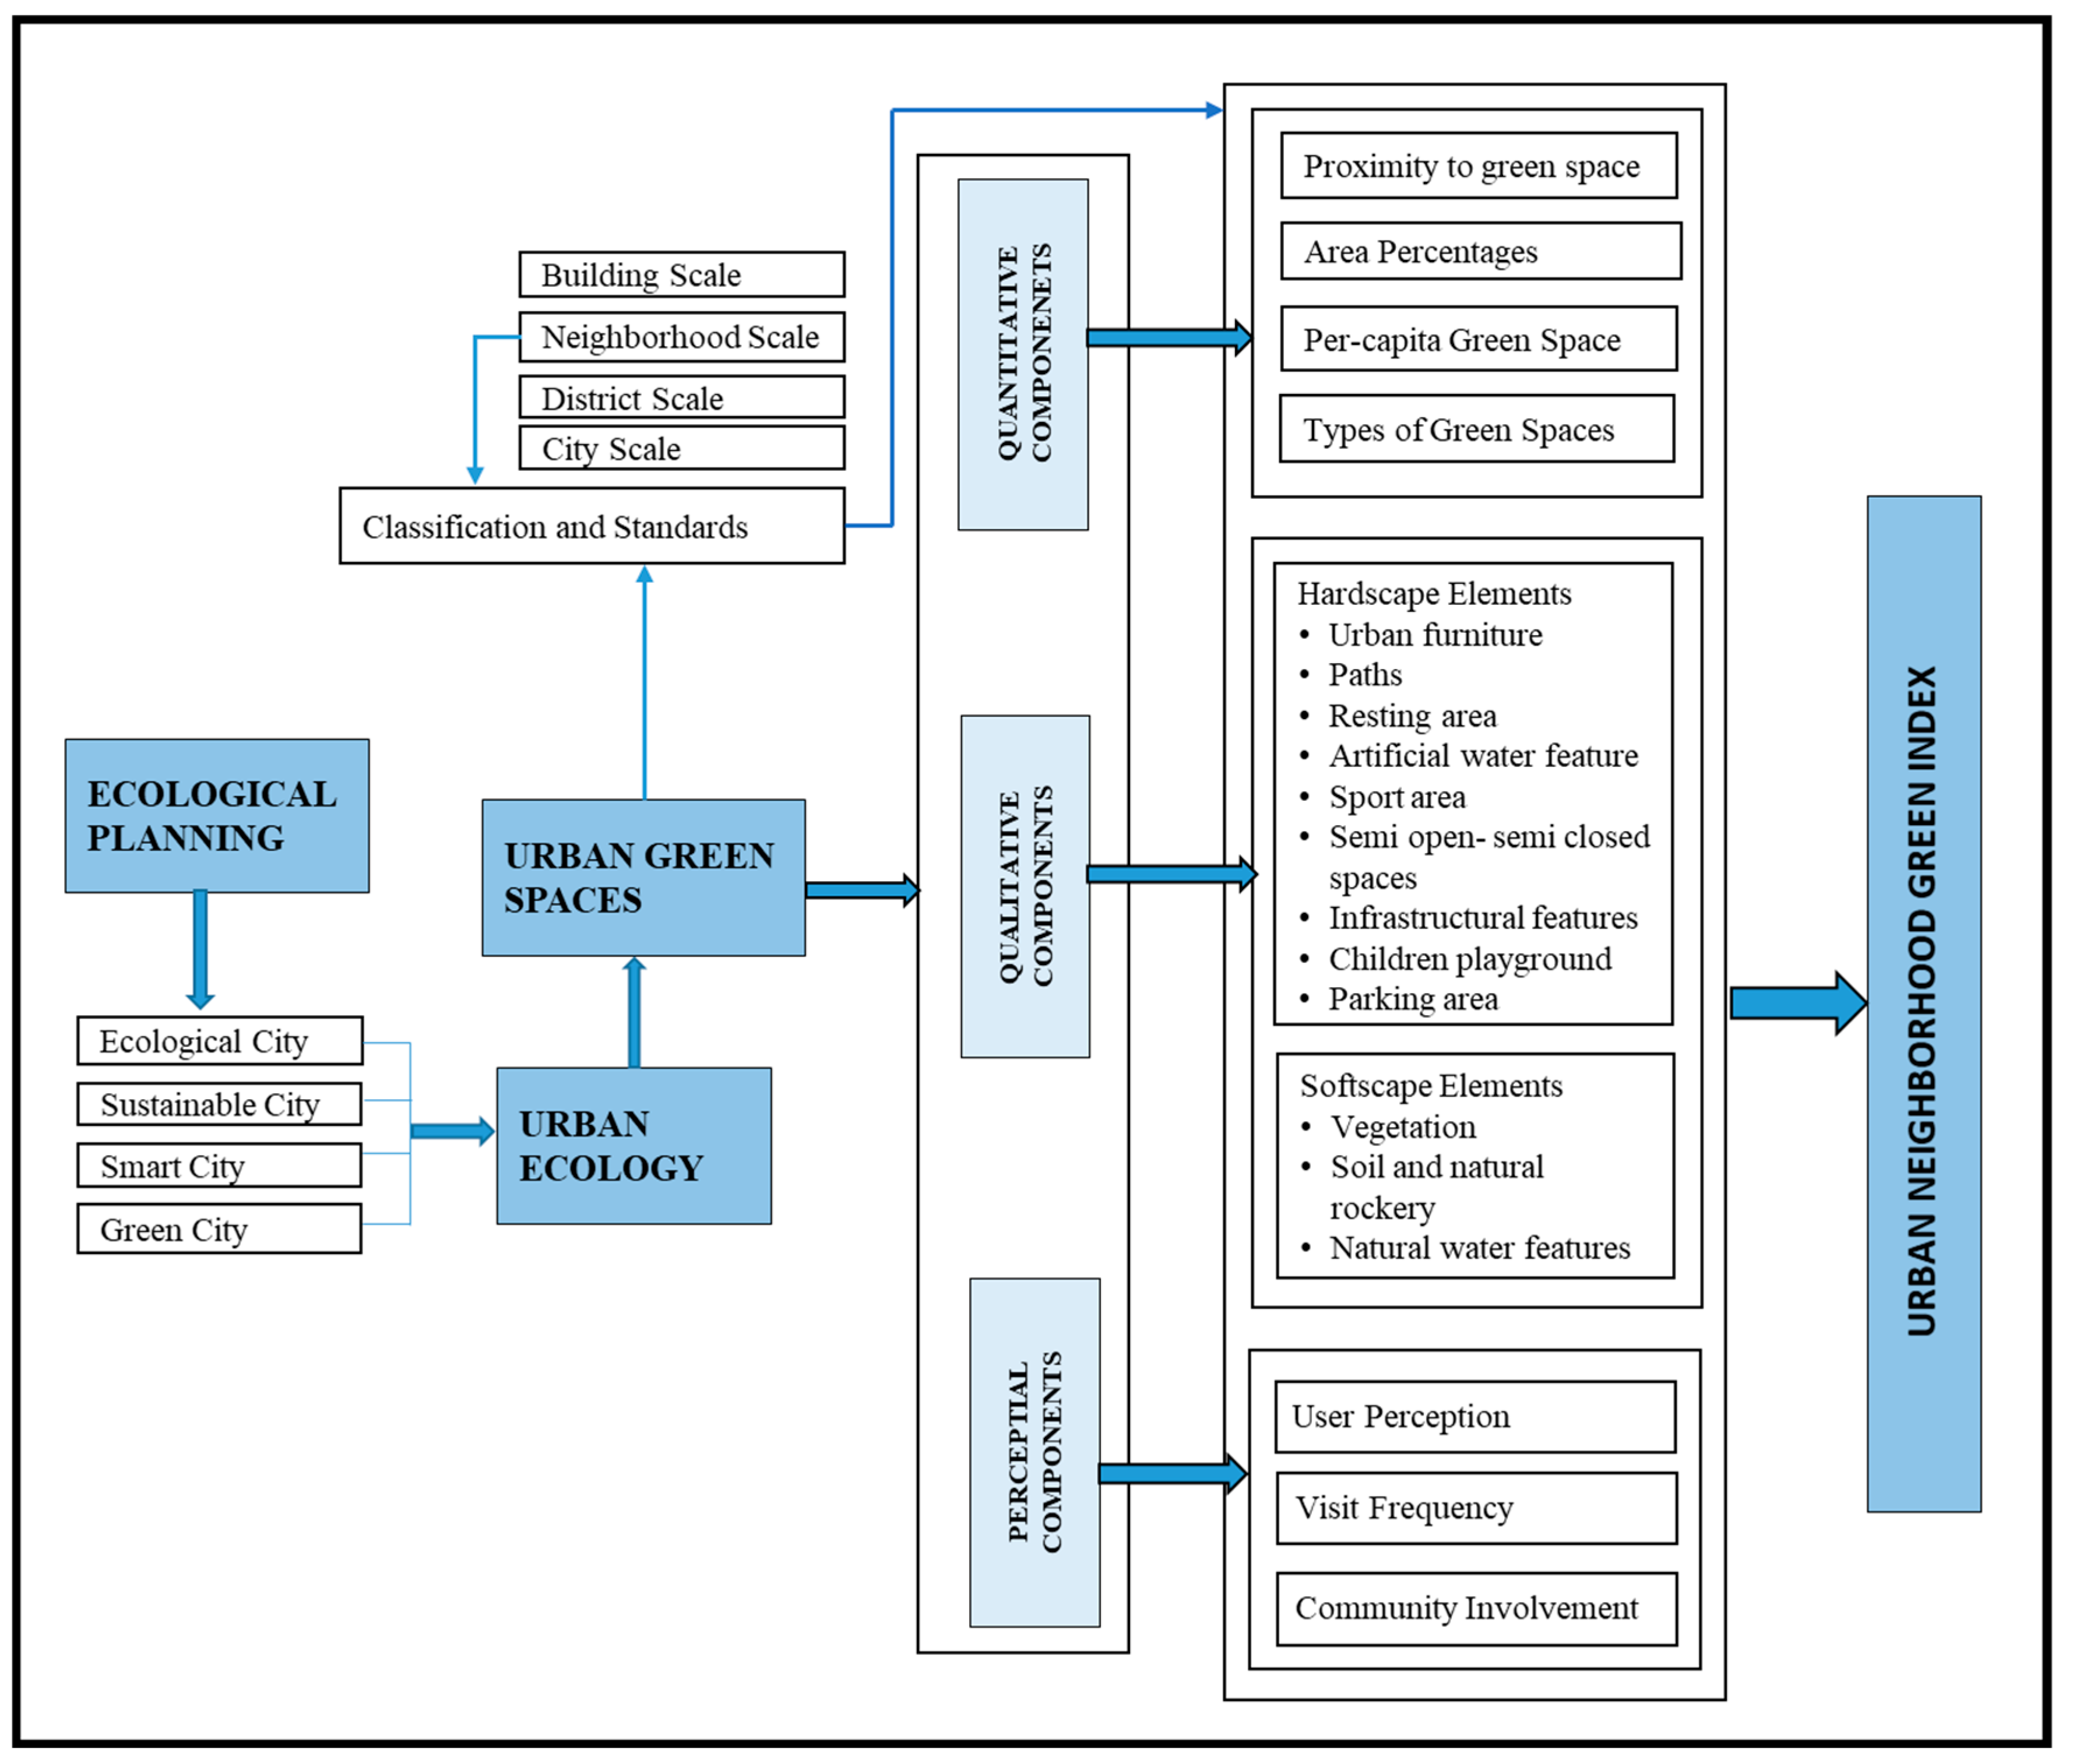
Furthermore, the types of green spaces also play a vital role as a parameter of urban green spaces. A neighborhood is required to have diverse properties of green spaces for facilitating all age groups and profile groups, such as children and elderly people. These types of green areas are playgrounds, local or neighborhood parks, residential compound gardens, sport areas and other active passive greenery, such as street trees and plantations. The hardscape and softscape features form green spaces as physical design domains. Figure 1 displays these items, which can be defined as qualitative measures.
The user perception should not be ignored as another component for defining an index. Many studies of landscape assessments have shown that a number of landscape features are related to human perception, such as vegetation presence, vegetation height, artificiality, water availability, human presence, slope and strength. Features such as complexity, novelty, incongruity, surprise, coherence, readability, mystery, expectation and shelter are variables that explain landscape preference, as predicted by various landscape preference models [58].
The characteristics of such places and the satisfaction of users with these places determine the type and frequency of the activities held in the parks. Understanding user satisfaction and opinions is crucial to promoting the correct and adequate design of these spaces. In addition, user characteristics such as age, education and gender are directly related to the use of green areas. However, the relatively unchangeable nature of these demographics is leading to an increased focus on modifiable green space features [59]. In this context, the user survey is a valuable tool that can be used to obtain and measure careful information about the characteristics and needs of park visitors to help improve existing urban parks or develop new public parks while ensuring good usability of the space.
Furthermore, active participation, which can be defined as the frequency of visits to neighborhood green spaces [60], and community involvement can also play a vital organic role in green spaces [61,62]. In addition, watching and observing natural features in the environment or watching people’s activities and sports can fulfil the need for passive participation. Active participation, on the other hand, includes socializing by talking or playing with other people in a recreation area. Therefore, meeting the different needs and preferences of park users enables parks to better serve communities [63].
In conclusion, in line with the literature, a UNGI was created for Nicosia to evaluate the existing green on the neighborhood scale with its quantitative, qualitative and perceptual components from a holistic perspective. Three parameters for perceptual characteristics (user perception, visit frequency and community involvement), two parameters for qualitative characteristics (hardscape elements and softscape elements) and four more parameters for the quantitative components (types of green spaces, proximity to green space, area percentages and per-capita green space) were determined to construct the UNGI, as displayed below in Figure 2.

3. Material and Methodology

3.1. Research Area

Cyprus is the third largest island in the Eastern Mediterranean Basin following Sicily and Sardinia [64]. This island has a diverse geography, climate, flora and fauna as well as a rich history and culture. In addition, the human presence on the island dates to prehistoric times (10,000–12,000 years) [65].
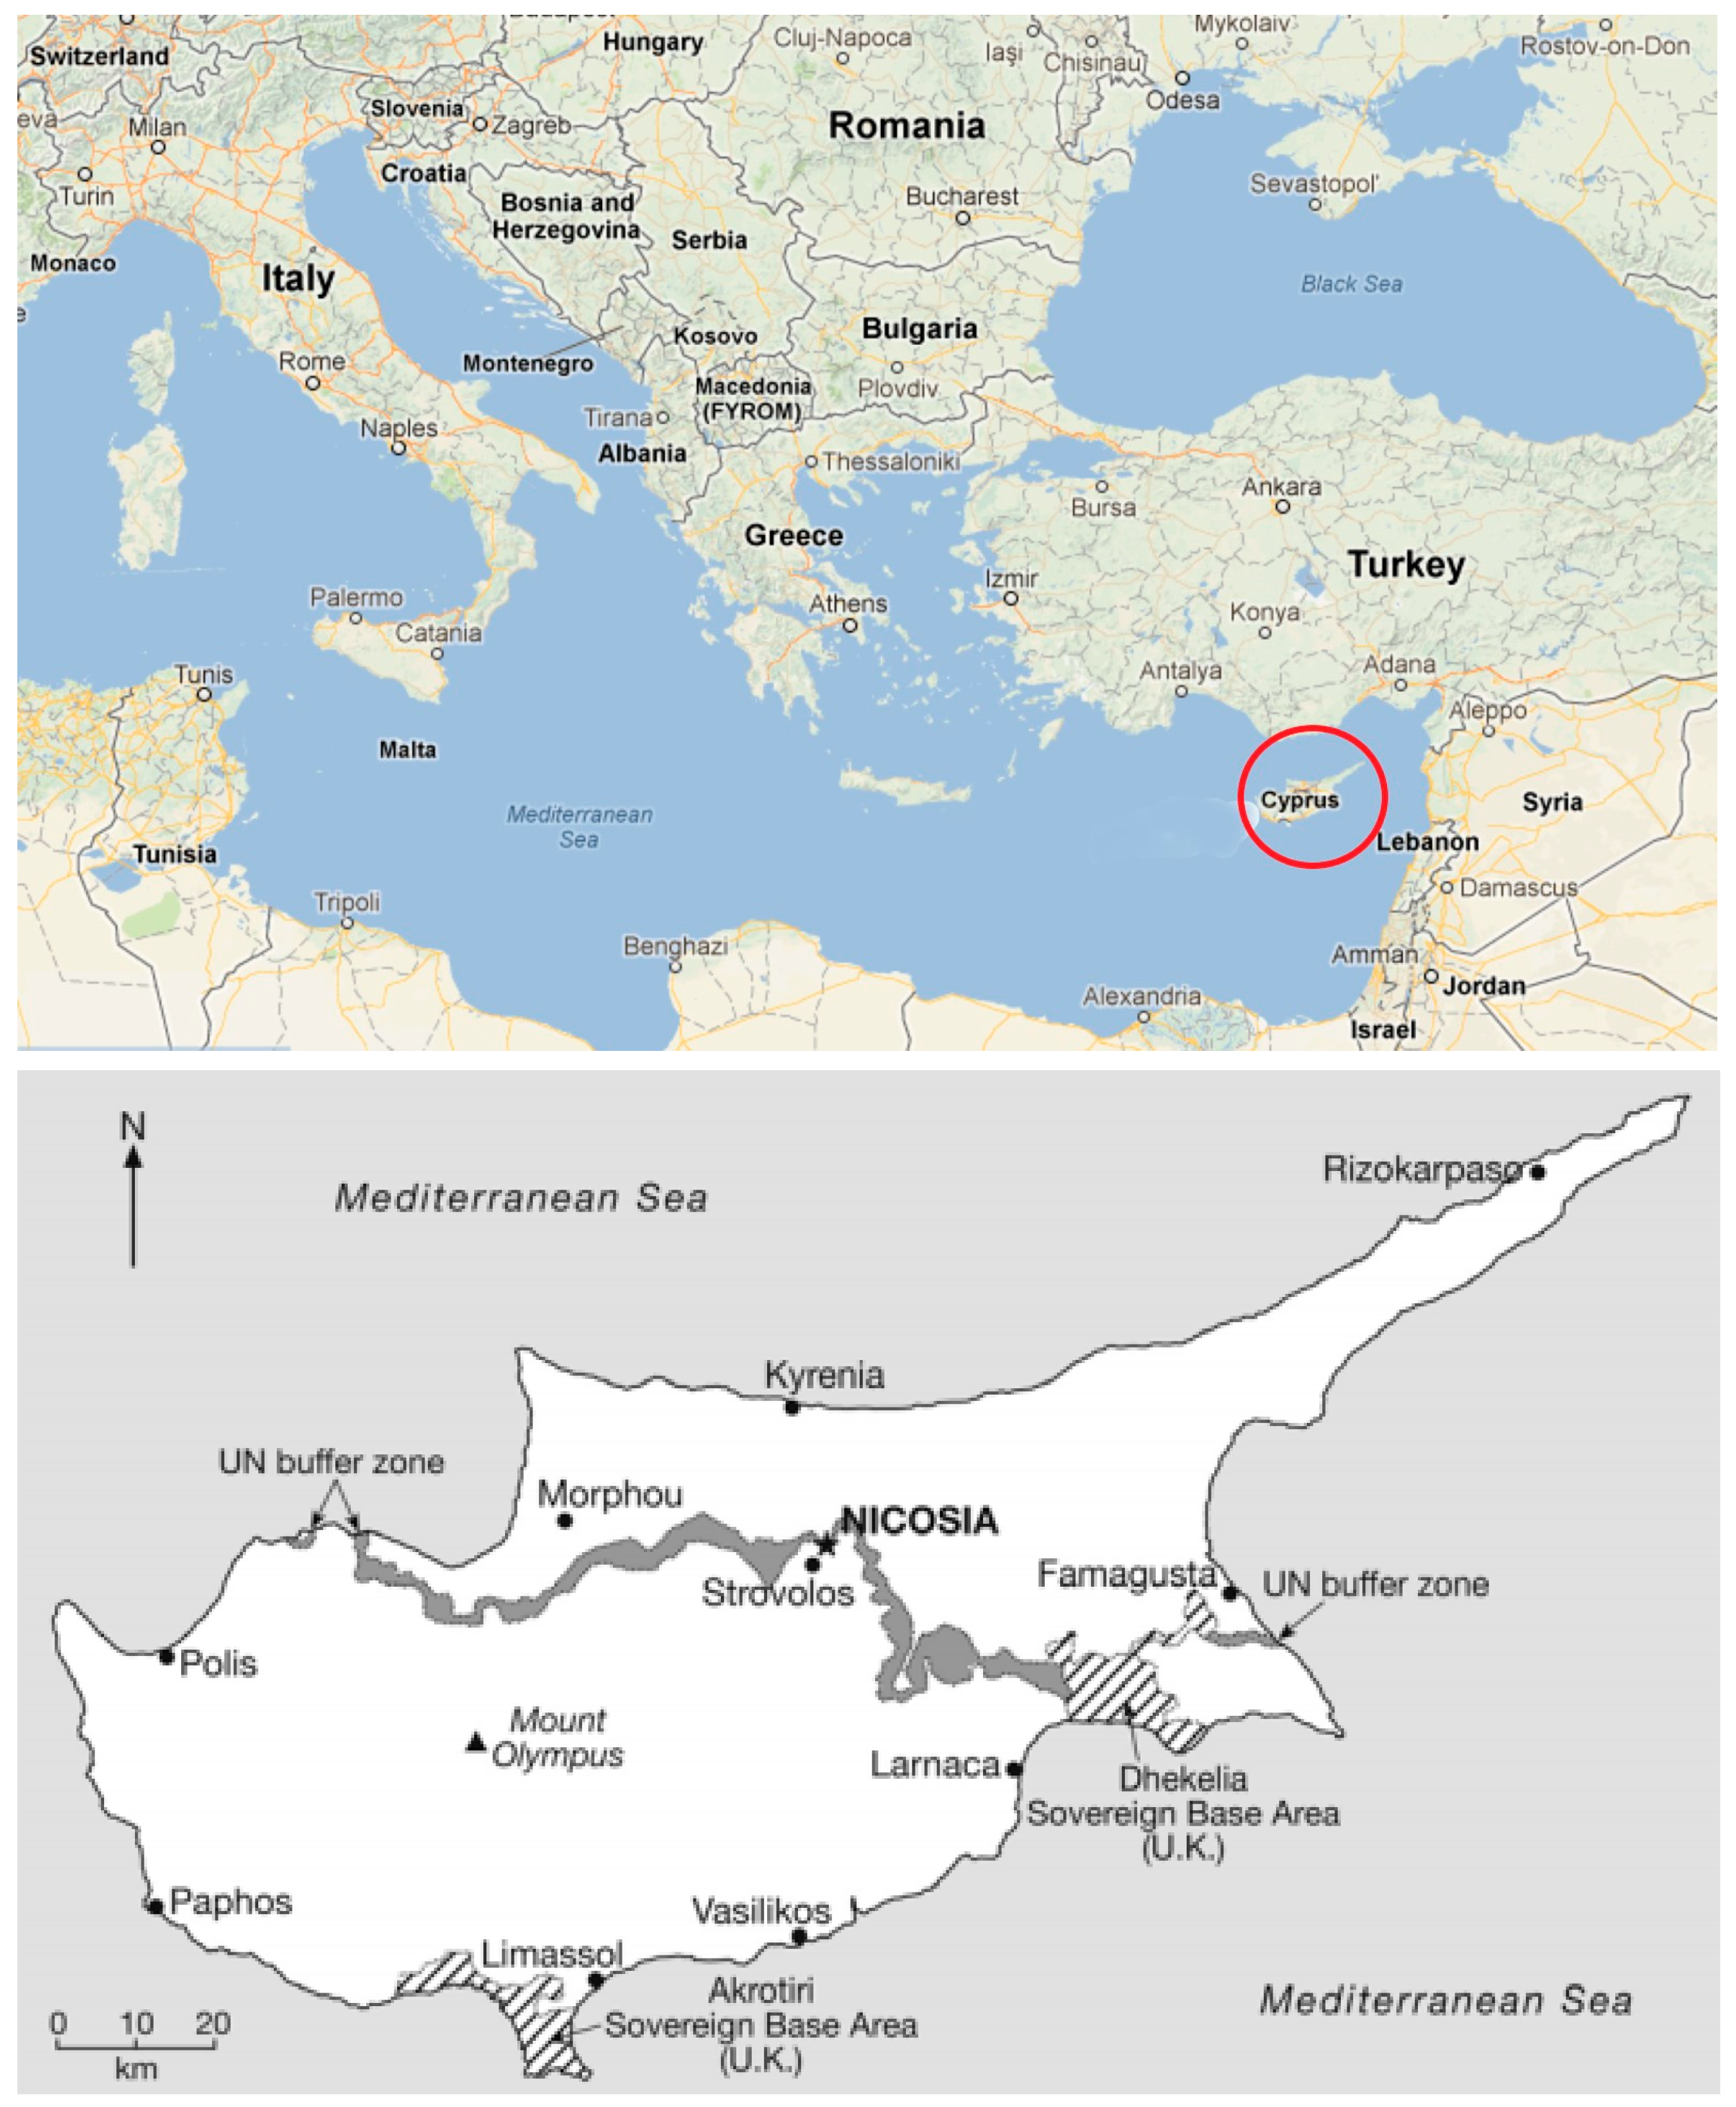
The island was divided into two between Turkish Cypriots and Greek Cypriots in 1974. Nicosia, the capital of Cyprus Island, is an old city located in the middle of the Mesarya Plain and features Pedieos River, which is locally called Kanlıdere [66]. Nicosia city is the only divided capital in Europe. The city is divided into two by the border Green Line as the UN buffer zone. The buffer zone cuts through the city of Nicosia and divides the entire island. A 180 km border line from northwest to southeast separates Greek and Turkish Cypriots [67].
The city of Nicosia, which is in the geometric center of the country, is located at the intersection of the mainland transportation network, connecting Famagusta, Kyrenia and Güzelyurt. Nicosia remains the center of the country in terms of business, administration, education, culture and various other activities due to its proximity to the sea and the country’s air gates. Nicosia, the most populous and most important cultural city and the industry, trade and transportation center of Cyprus, is located at 35°10′ N, 33°21′ E, with an area of 111 km2 [68], see Figure 3.
After the division, the center and a large part of the city of Nicosia remained in the Greek part. Later, the city expanded and grew spontaneously as a result of merging with the surrounding villages. The Nicosia Master Plan (NMP) was prepared in 1984 to plan city development and the Nicosia Master Plan was put into practice in 2001 [70].
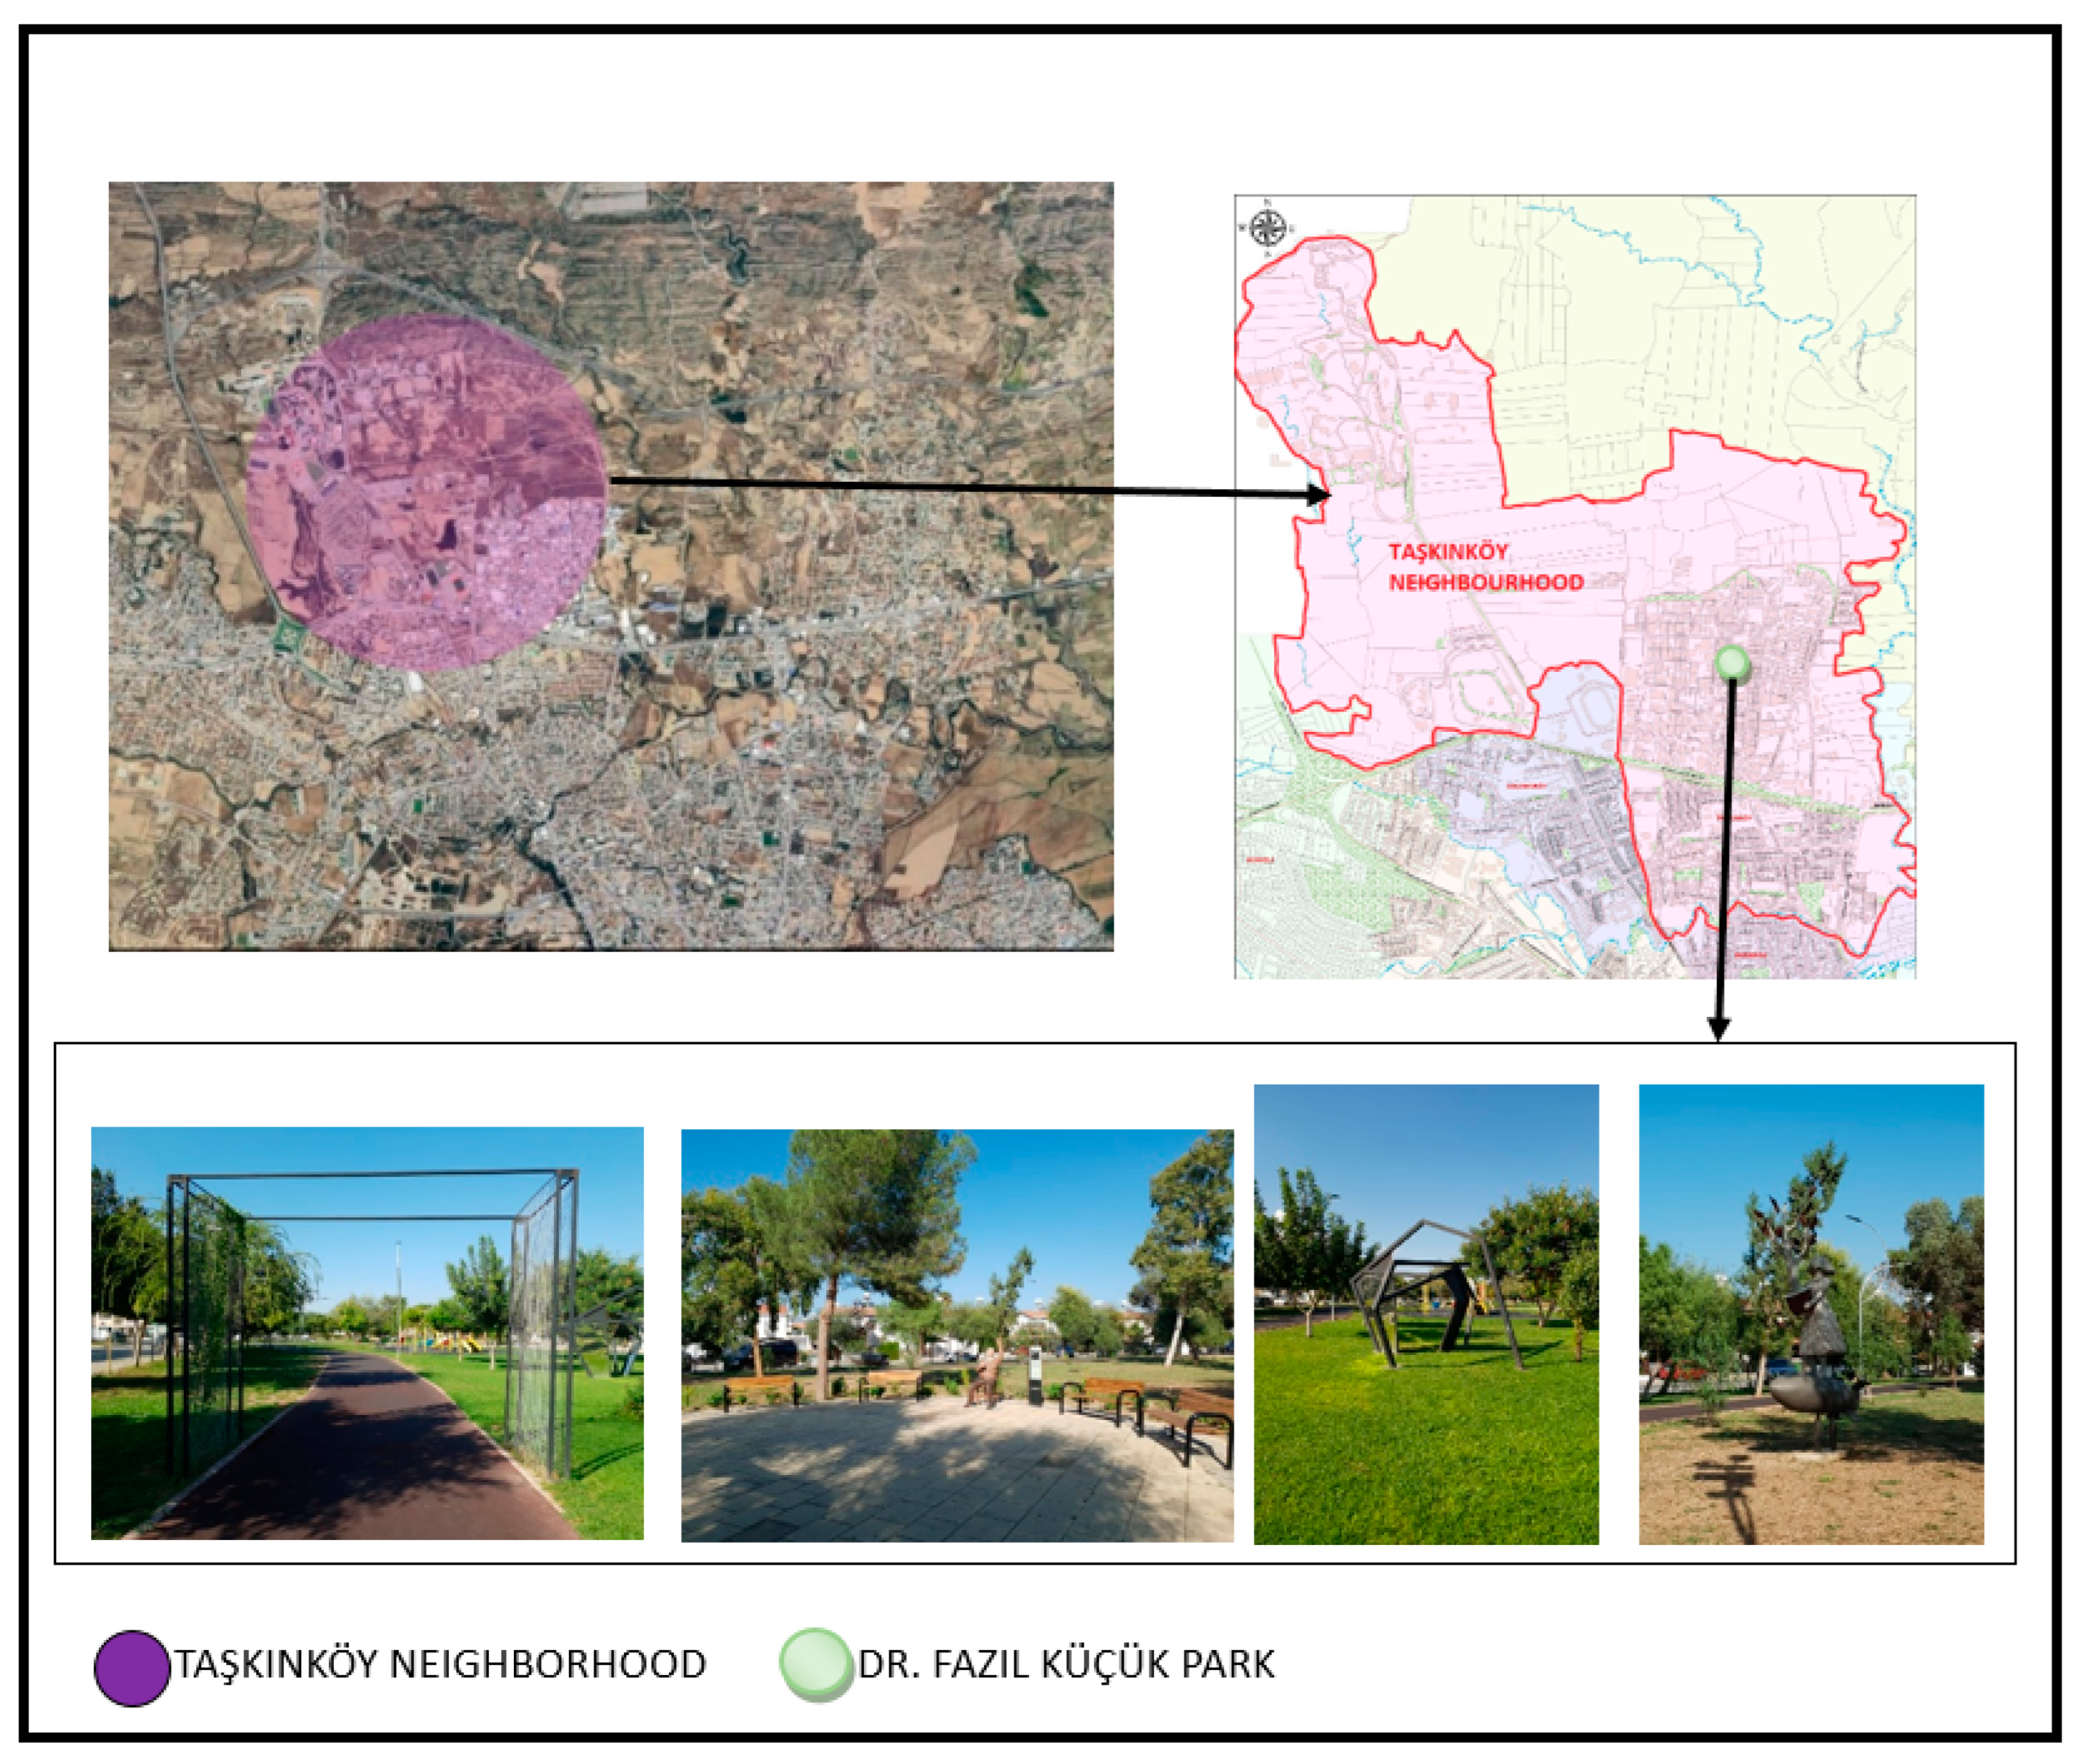
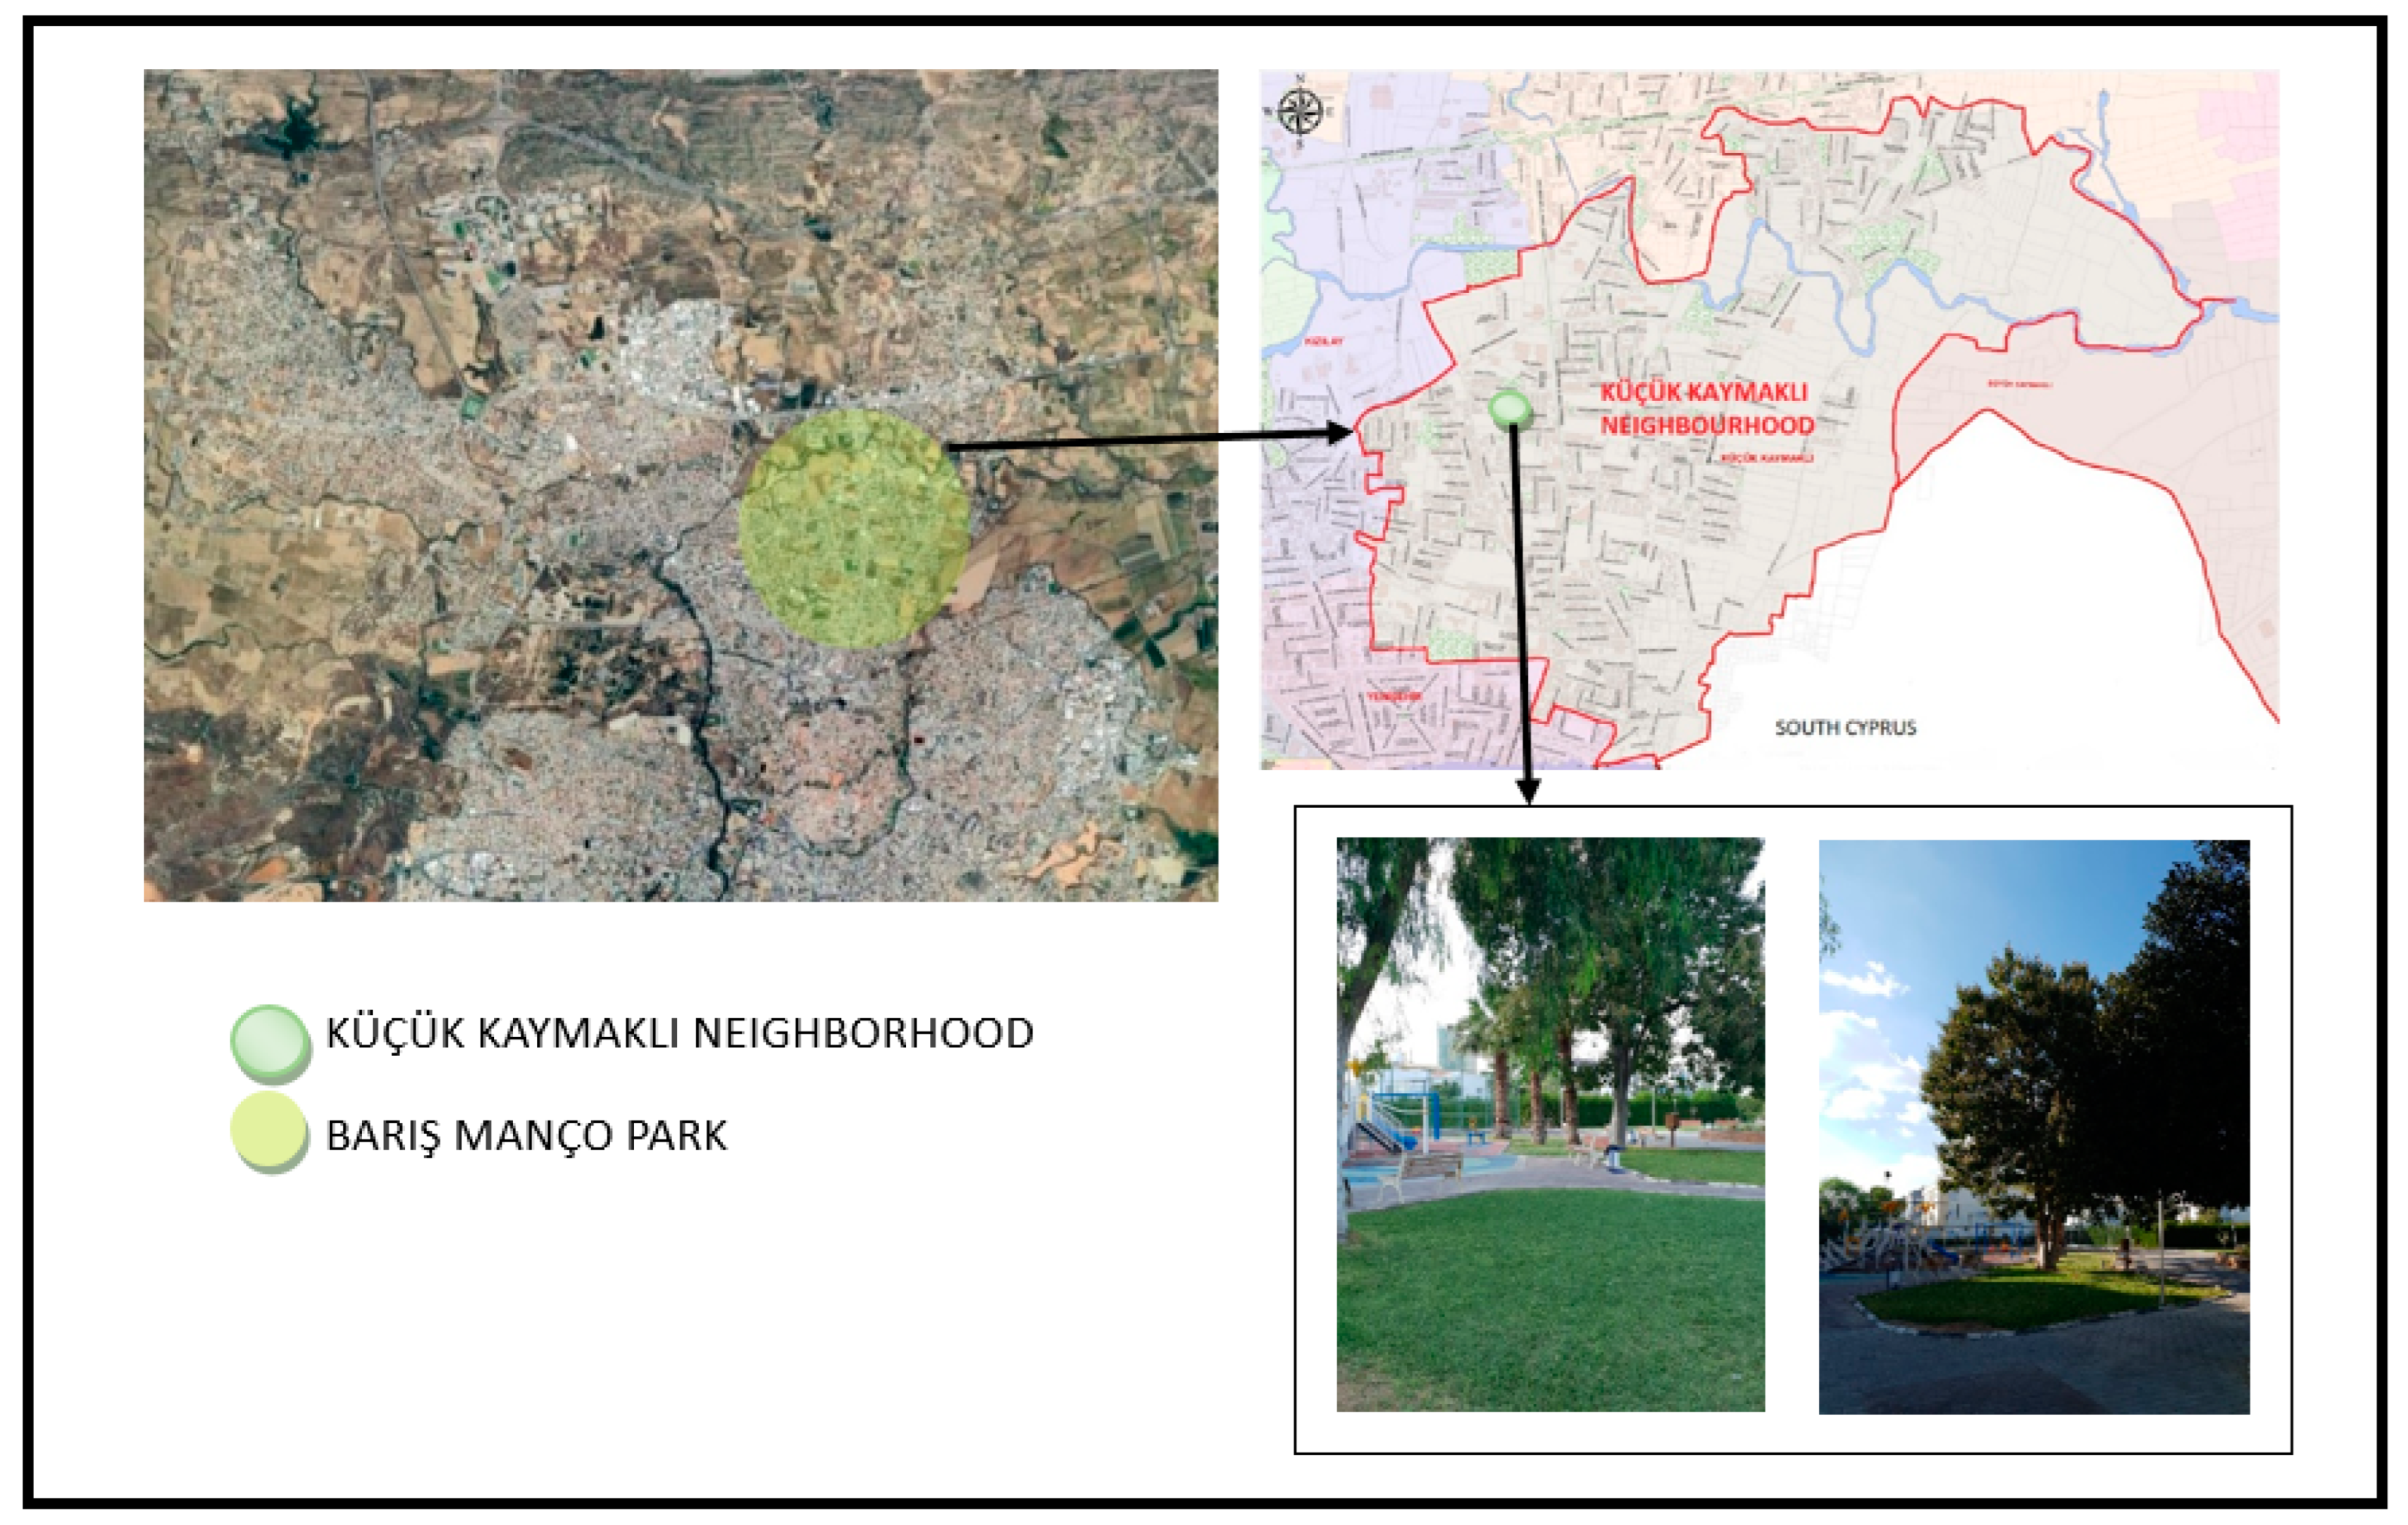
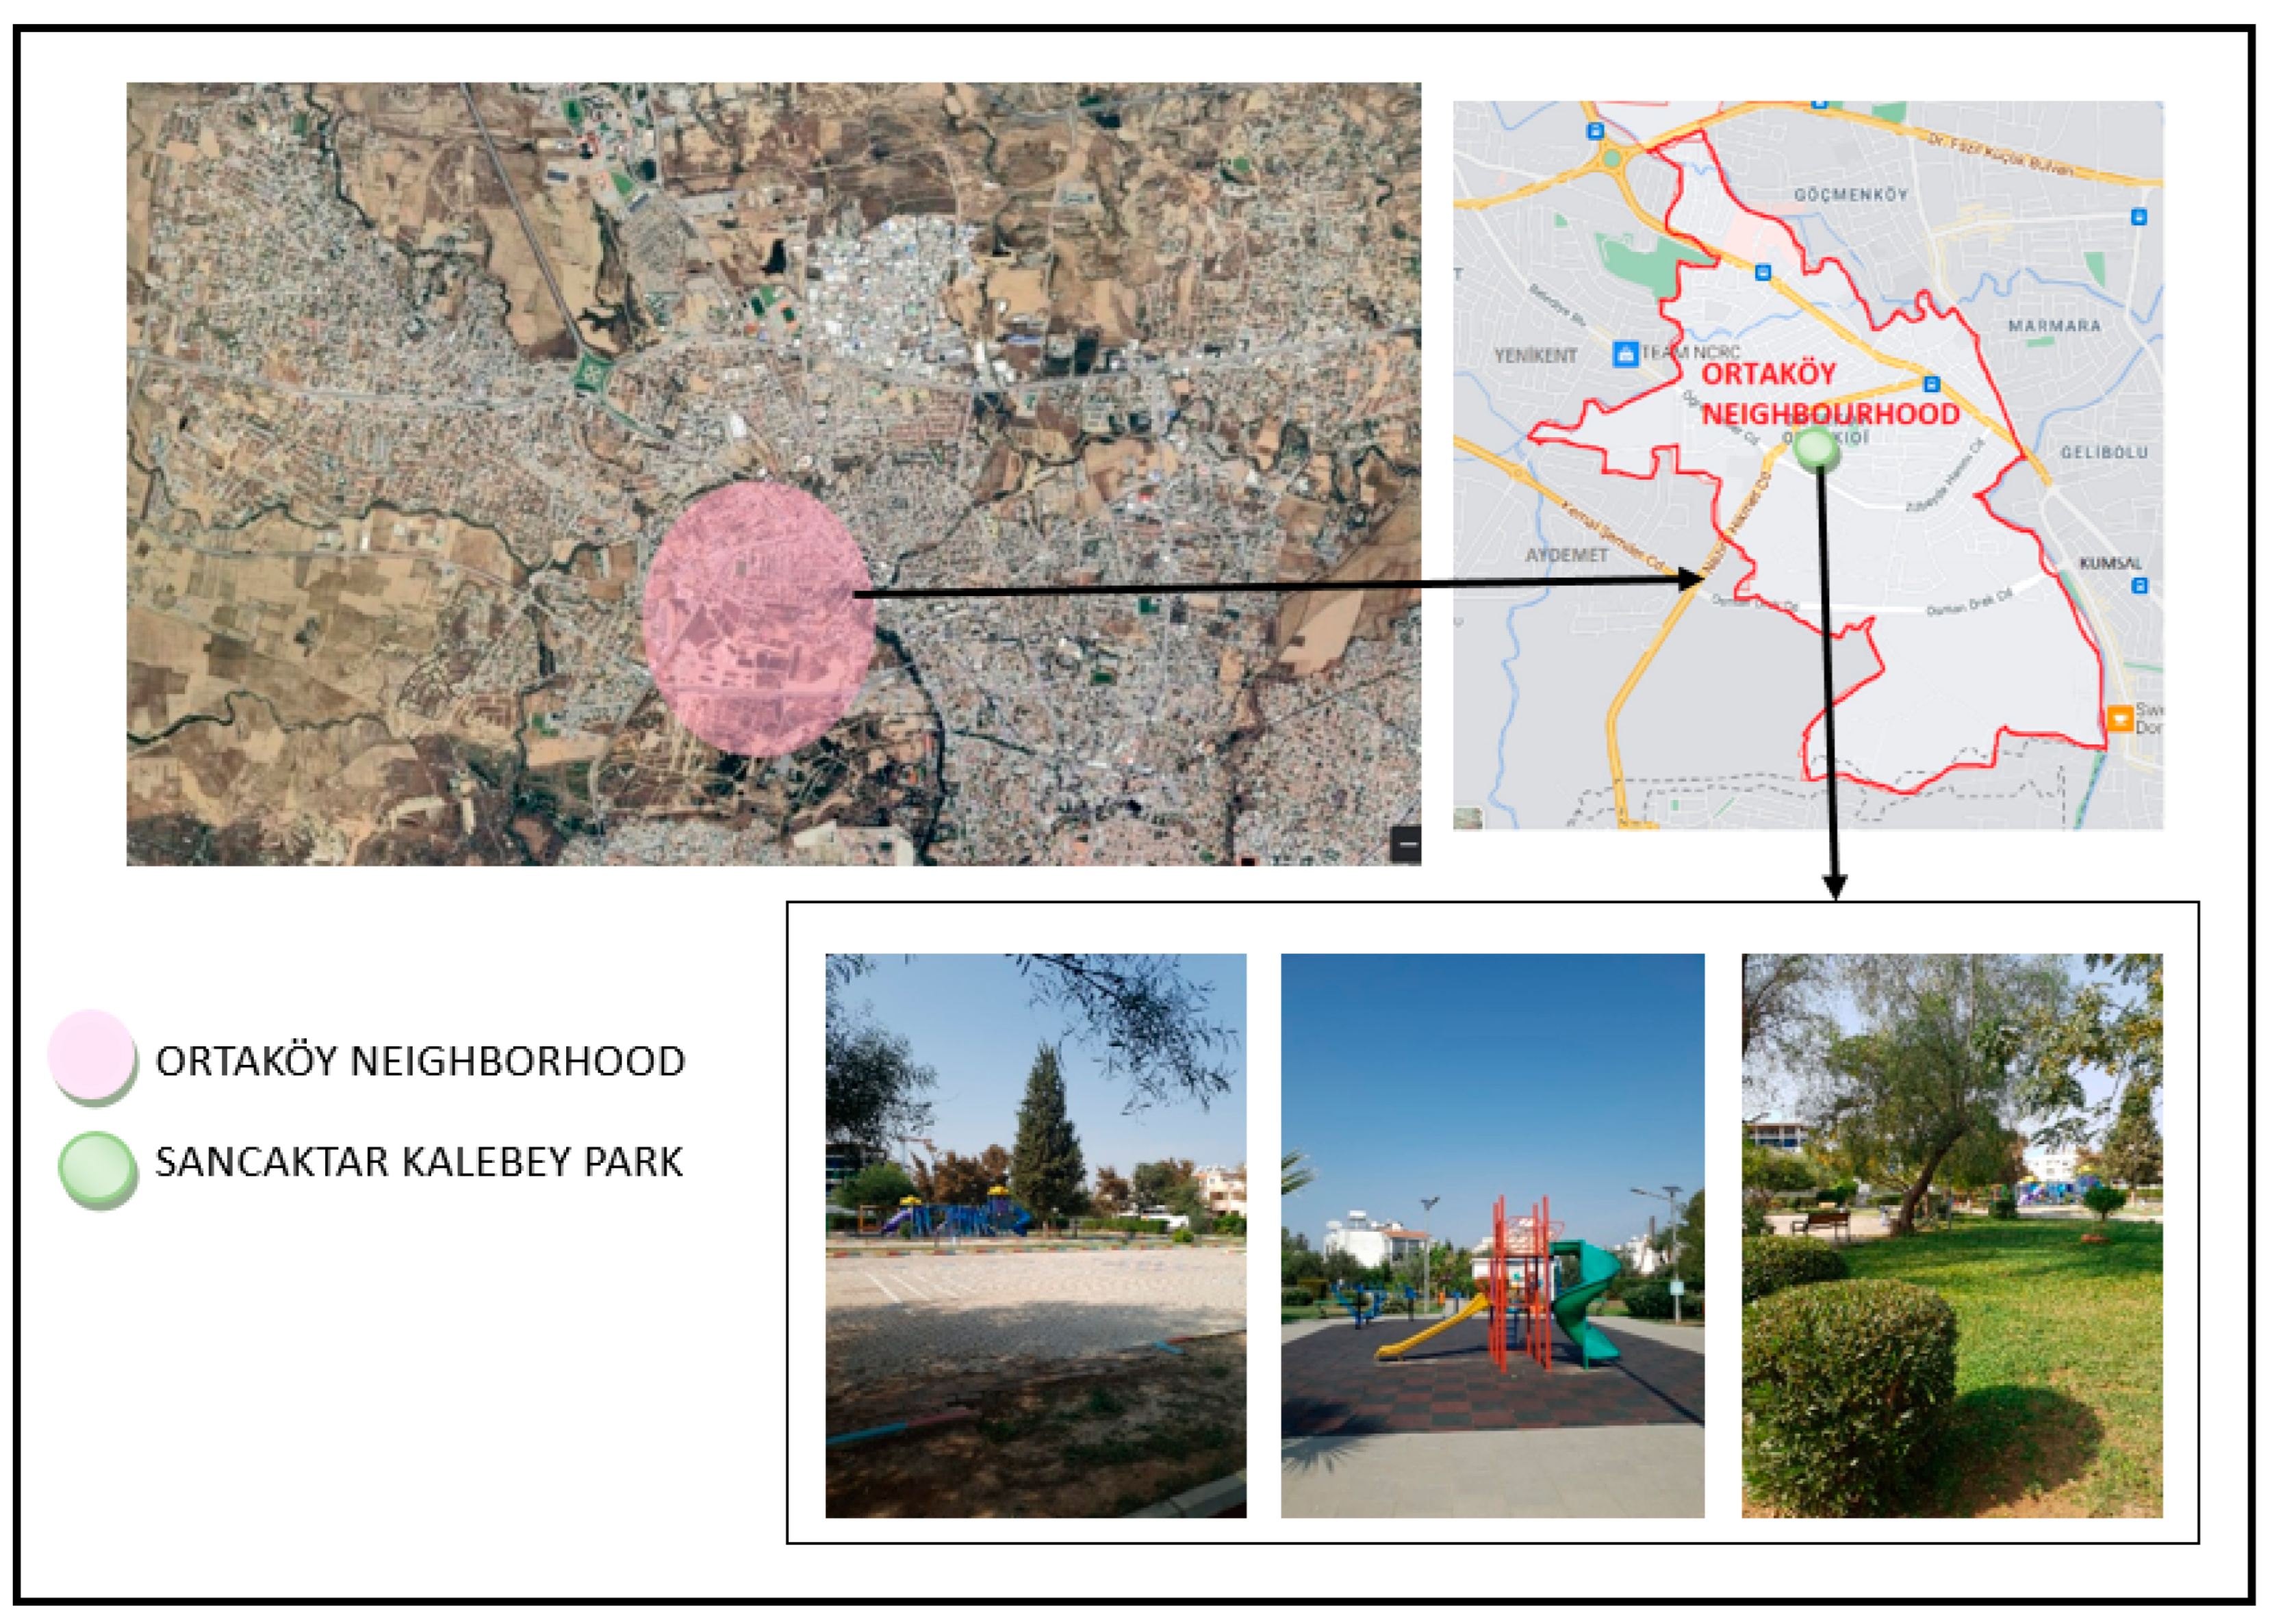
In accordance with the literature review, the neighborhoods to be studied were decided as Ortaköy neighborhood and Küçük Kaymaklı neighborhood, which are the largest neighborhoods with the highest population and number of houses, as well as Taşkınköy neighborhood, where there is intense construction, according to the 2011 population and housing census. See Figure 4, Figure 5 and Figure 6 for the locations of the neighborhoods chosen to be studied.

3.2. Research Design

Based on the literature review, three main components with their individual parameters were determined to define the UNGI in Nicosia. These were perceptual, qualitative and quantitative characteristics. This study used merely quantitative characteristics. For the quantitative component, four parameters were determined within the neighborhood green index. These are per-capita green space, proximity to green space, area percentages and types of green spaces. Maps, satellite images obtained from the Nicosia Turkish Municipality and GIS were used for this quantitative measurement. The neighborhood areas, all green areas, including the active and abandoned ones within the chosen neighborhoods, and population data were compared for the measurement of the chosen parameters.

3.2.1. Per-Capita Open Green Space

The amount of green space per capita for Nicosia was obtained by dividing the total amount of green space by the total population. In addition, the distribution of open green areas per neighborhood was analyzed. The number of open green areas per capita per neighborhood was calculated by dividing the amount of open green areas in each neighborhood by the population of the neighborhood.

3.2.2. Proximity to Green Space

To measure proximity, the green areas (active and abandoned) in the selected neighborhoods were determined individually. These areas include neighborhood (local) parks, playgrounds, outdoor sports areas, residential compound gardens and other greenery such as street plantations. By using a GIS (Arc Map) for presence calculations, 500 m and 300 m buffers were created around the open green areas within the administrative boundaries of the neighborhoods; all grid cells with centers of gravity in the area were selected.

3.2.3. Area Percentages

After calculating the active and abandoned open green area distributions in the maps and on-site, the percentages were calculated by comparing the total area of the urban green spaces to the area covered by the city. To calculate the area percentages of the neighborhoods, the total area of the urban green spaces in the neighborhoods was compared to the area of each of the chosen neighborhoods.

3.2.4. Types of Green Spaces

In this context, to determine the amount of green area by their type (neighborhood parks, playgrounds, outdoor sports areas, residential compound gardens and other greenery such as street plantations) at the neighborhood level, these urban green spaces were determined on the maps and checked on site one by one. See Table 4 for the research measures and the tools used for each one.

4. Findings

4.1. Per Capita Open Green Spaces

The amount of green space per capita for North Nicosia was calculated by taking measurements in line with the 2011 Census obtained from the Nicosia Municipality and the TRNC State Planning Organization.
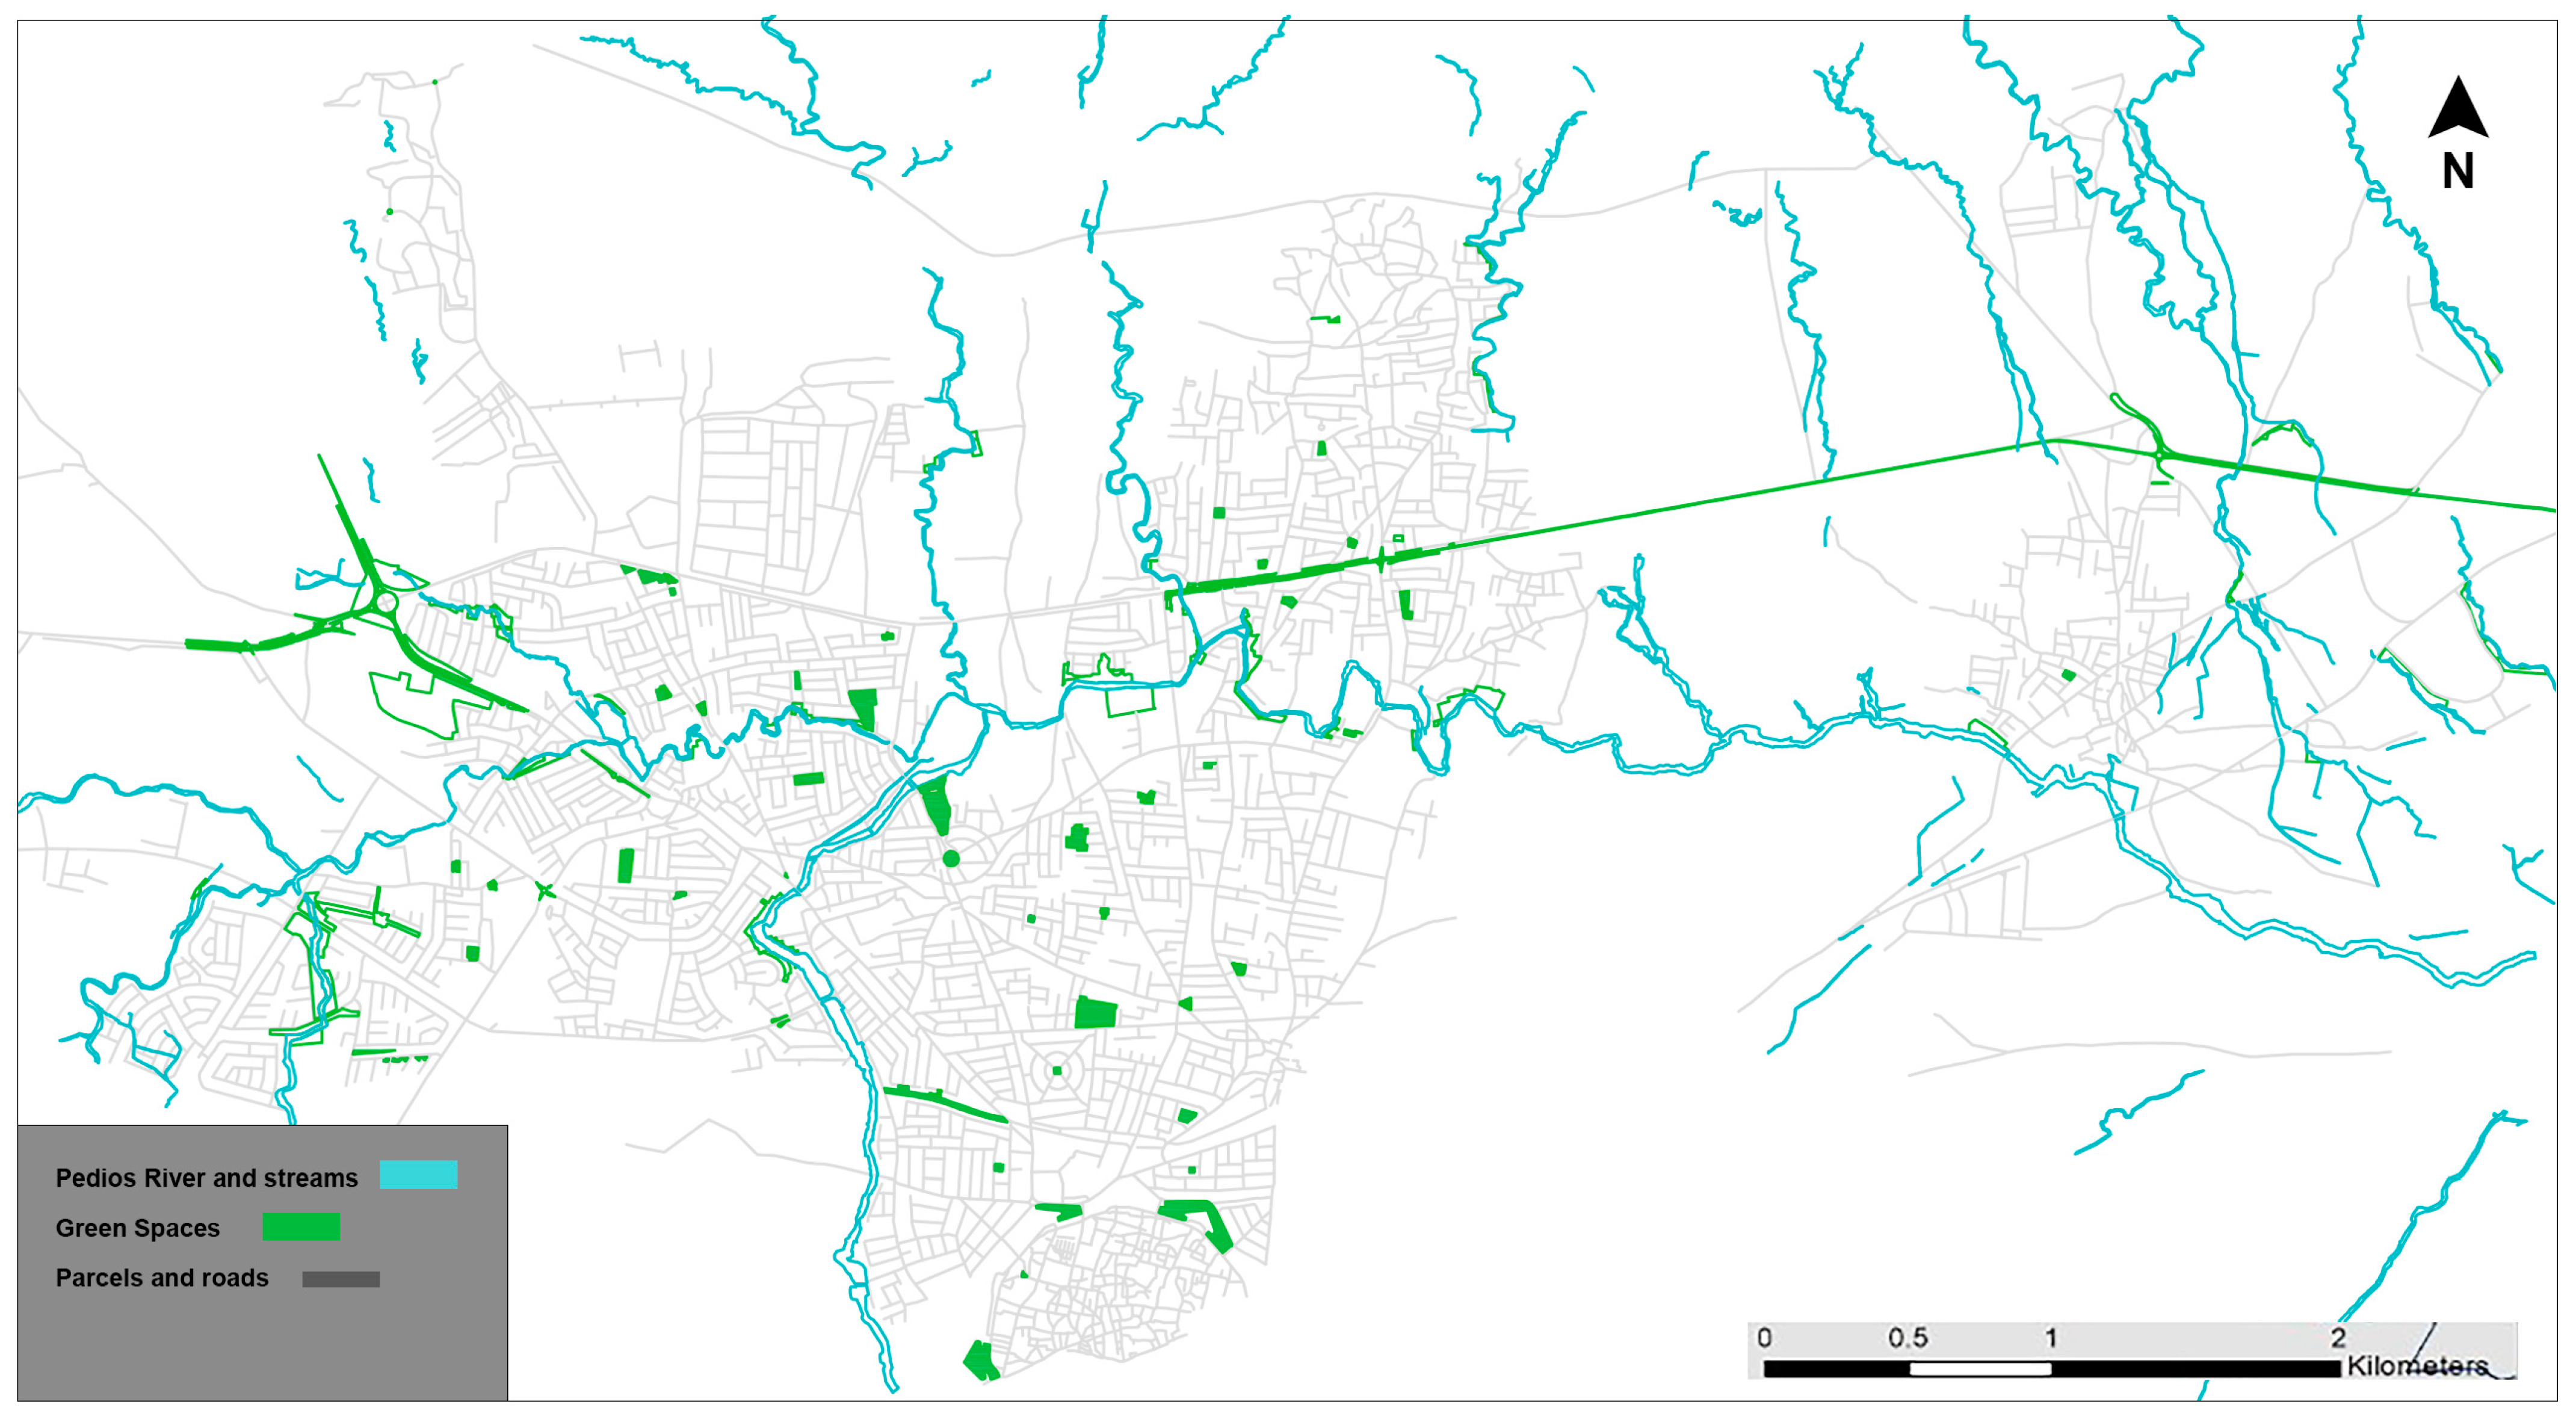
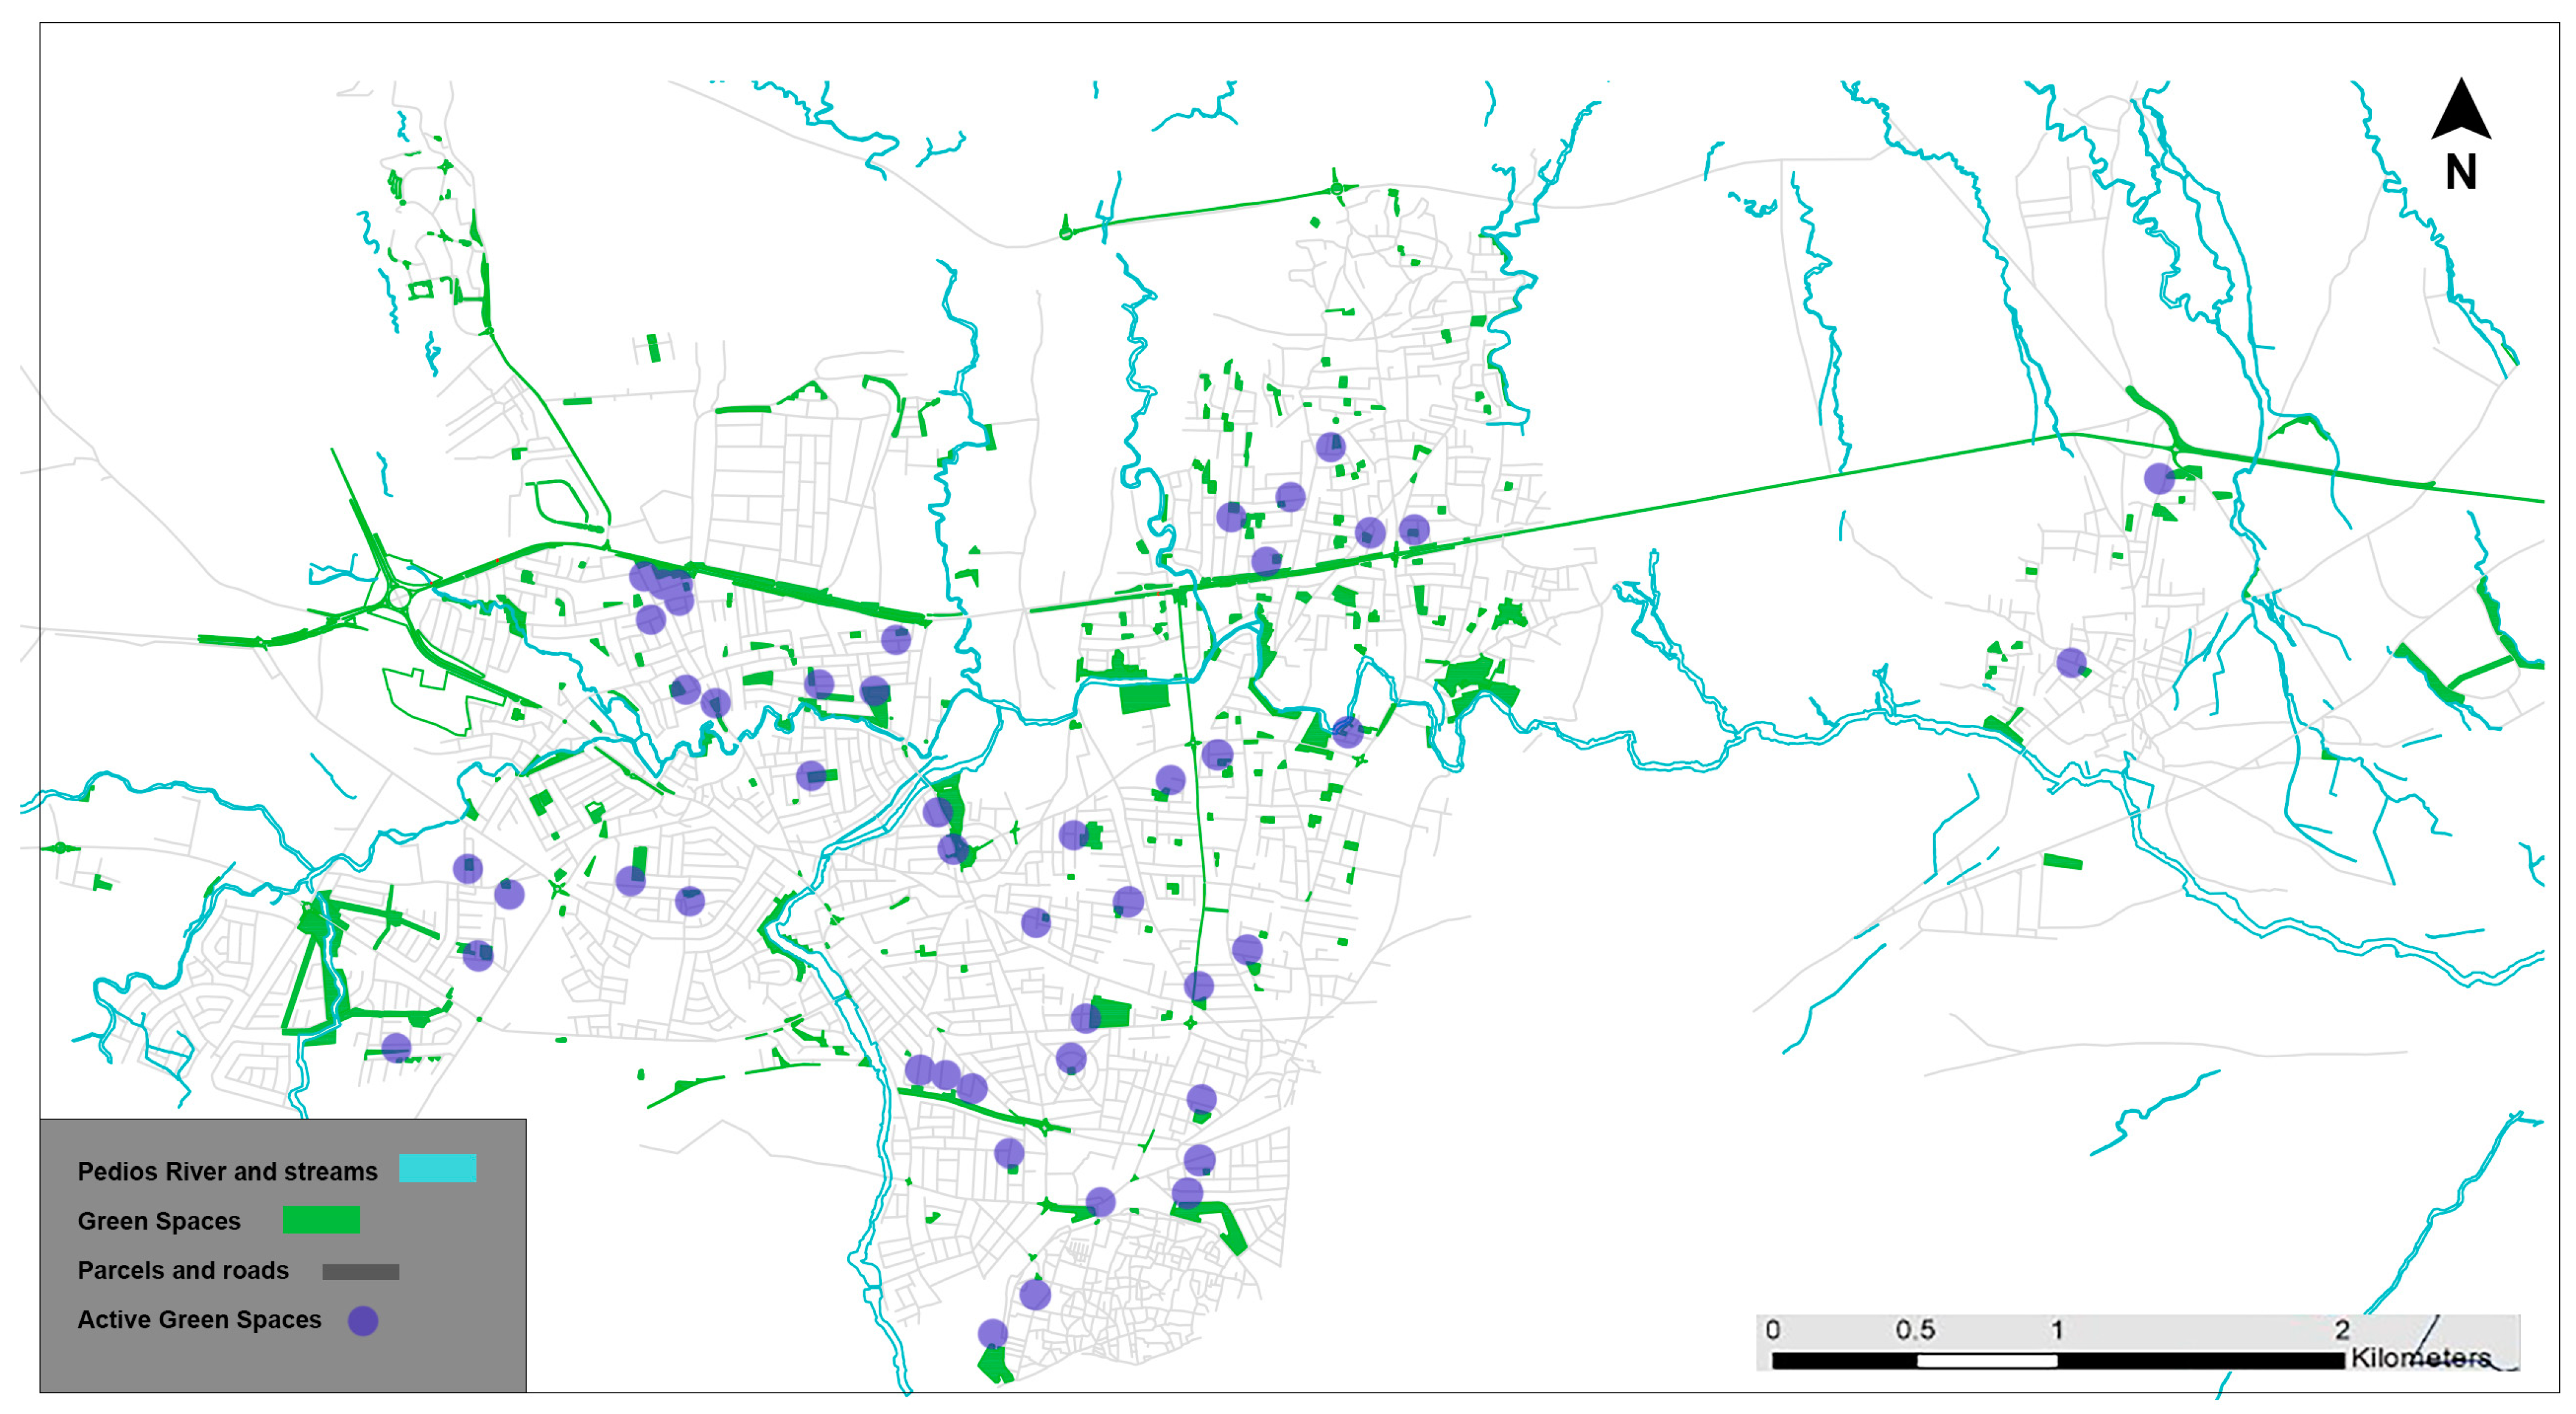
In accordance with the literature review and field work, there are 25 neighborhoods in North Nicosia within the borders of Nicosia Municipality, 12 of which are in the Walled City. According to the 2011 census, the total population of these 25 neighborhoods is 61,378,000. In the field study, the distribution and number of green areas in the city were first calculated and the active and passive green areas were determined on the maps (Figure 7).
The amount of green space per capita for Nicosia was obtained by dividing the total amount of green space by the total population. A total of 1,065,954.581 m2 of green area was measured according to the map measurements. A total of 205,819.081 m2 of these green areas was determined as active green areas and 860,135.5 m2 was categorized as passive green areas based on on-site observations and satellite images.
The study determined that there are 314 open green areas in the Nicosia region, excluding roadsides, intersections and medians, and 53 of them are active. All these open green areas, which appear as green areas on the maps, have been checked to see if they are functional or in use. As a result of the observations, it was found that there are only trees planted in some areas, while there are many empty areas. Some green areas are used by residences or as parking areas built by the municipality and many areas along streams are left in an abandoned state. Therefore, these areas are classified as passive green areas. In line with the calculations, the total amount of green space per capita for North Nicosia was calculated as 17.367 m2, while the total amount of active green space per capita was calculated as 3.353 m2 (Table 5).
Then, the distribution of open green areas according to the neighborhoods was calculated and the amount of active open green areas per person was measured. This measurement was determined by dividing the amount of open green space in the neighborhoods by the population, see Table 6 and Figure 8.
Although Taşkınköy neighborhood is one of the most dense and crowded areas of Nicosia City, the measurements indicated that the open green areas in the region are insufficient. In line with the fieldwork, a total of 19,471.744 m2 of active open green area was measured in this region and the total active green area per capita was calculated as 5.062 m2 by dividing by the current population of the region (3847 people).
Küçük Kaymaklı neighborhood, which is the largest and most crowded of the 25 neighborhoods, has the most active green space according to the measurements. While a total of 45,466.385 m2 of active open green area was measured in the neighborhood, the total population of the region was determined to be 10,572 people. Accordingly, the total active green area per person was calculated as 4.301 m2.
Although Ortaköy neighborhood is also one of the densest and most crowded areas of Nicosia, similar to Taşkınköy neighborhood, the measurements showed that the active open green areas in the region are insufficient. In line with the fieldwork, only 12,850.499 m2 of the total green area of 110,660.44 m2 in this region was measured as active open green area. In line with the 2011 census, the current population of the region was determined to be 8868 people and the total active green area per capita was calculated to be 1.449 m2.

4.2. Proximity to Green Space

In this study, to measure the urban space parameters determined for the green area index, the proximity and accessibility of active green areas within the borders of Nicosia Municipality were measured. These measurements were made at the neighborhood scale using fieldwork, GIS and numerical data.
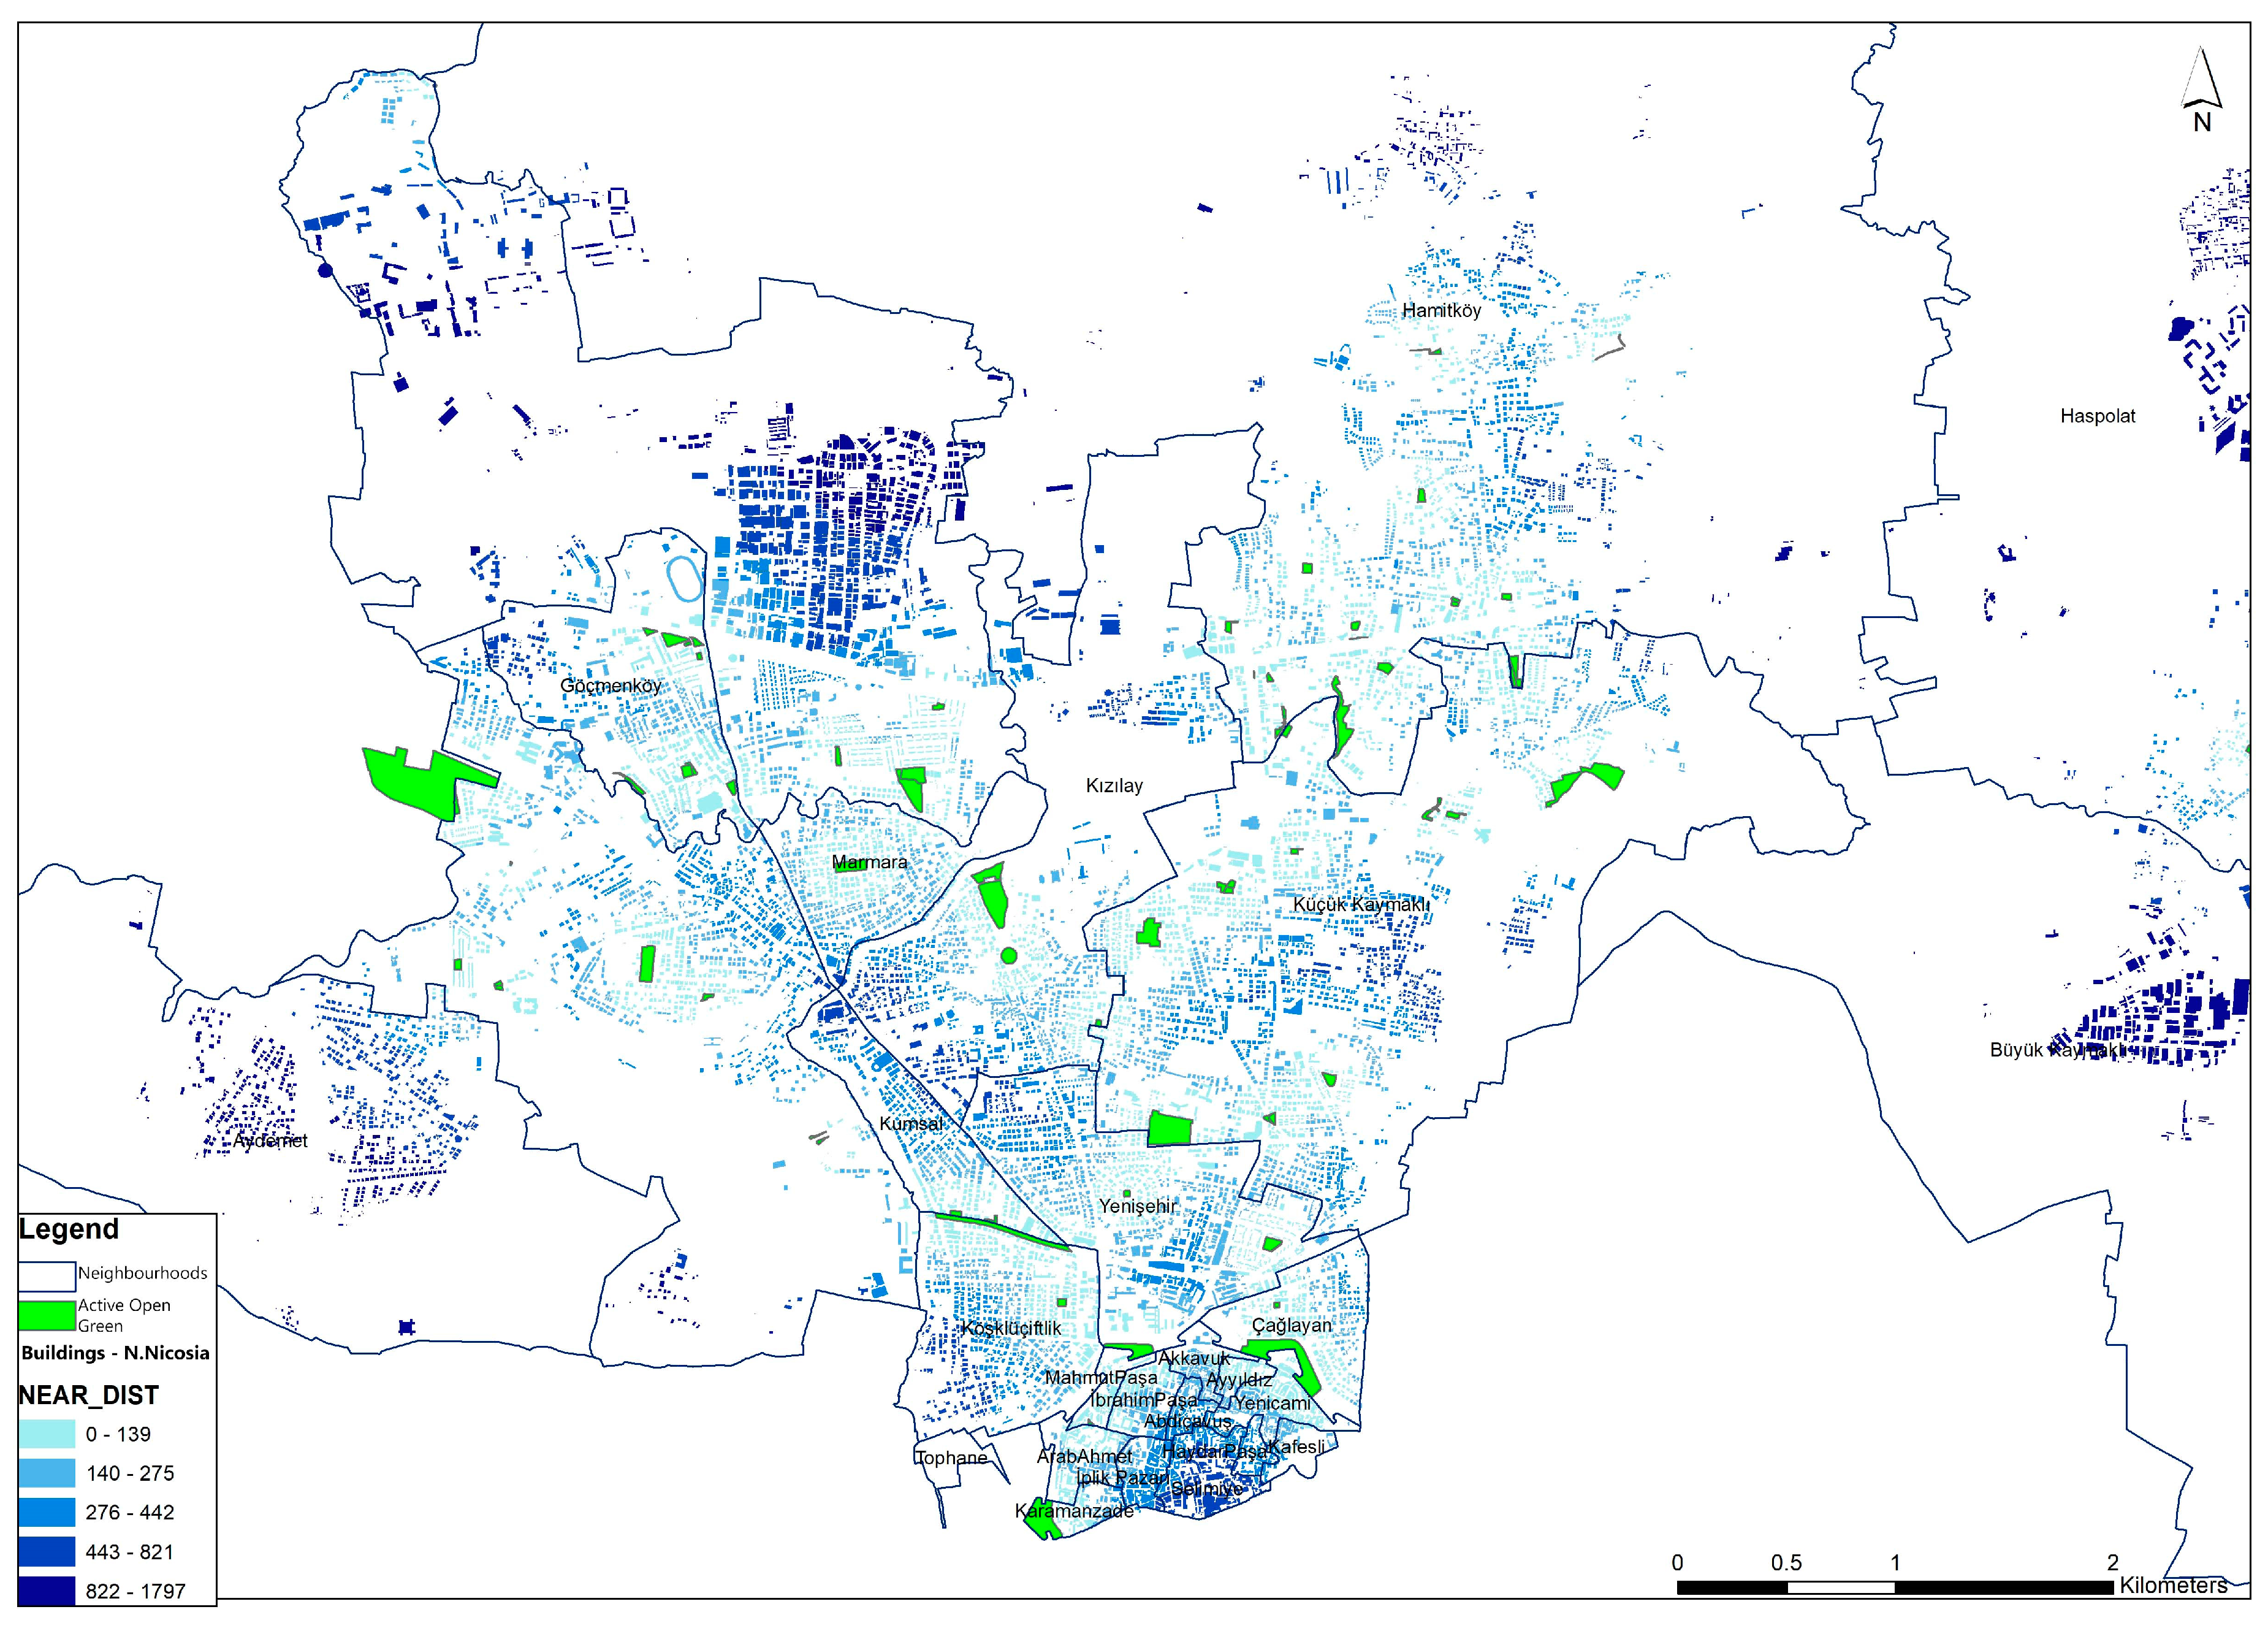
First, the active green areas in each chosen neighborhood within the borders of Nicosia Municipality were determined individually. These areas were neighborhood parks, playgrounds, open sports fields, residential compound gardens and other greenery, such as street trees and plantations. Then, the neighborhood areas where the active green areas are located, the population data and the face measurements of the active green areas were compared and their closeness, adequacy and compliance with the green area standards were determined, see Figure 9.
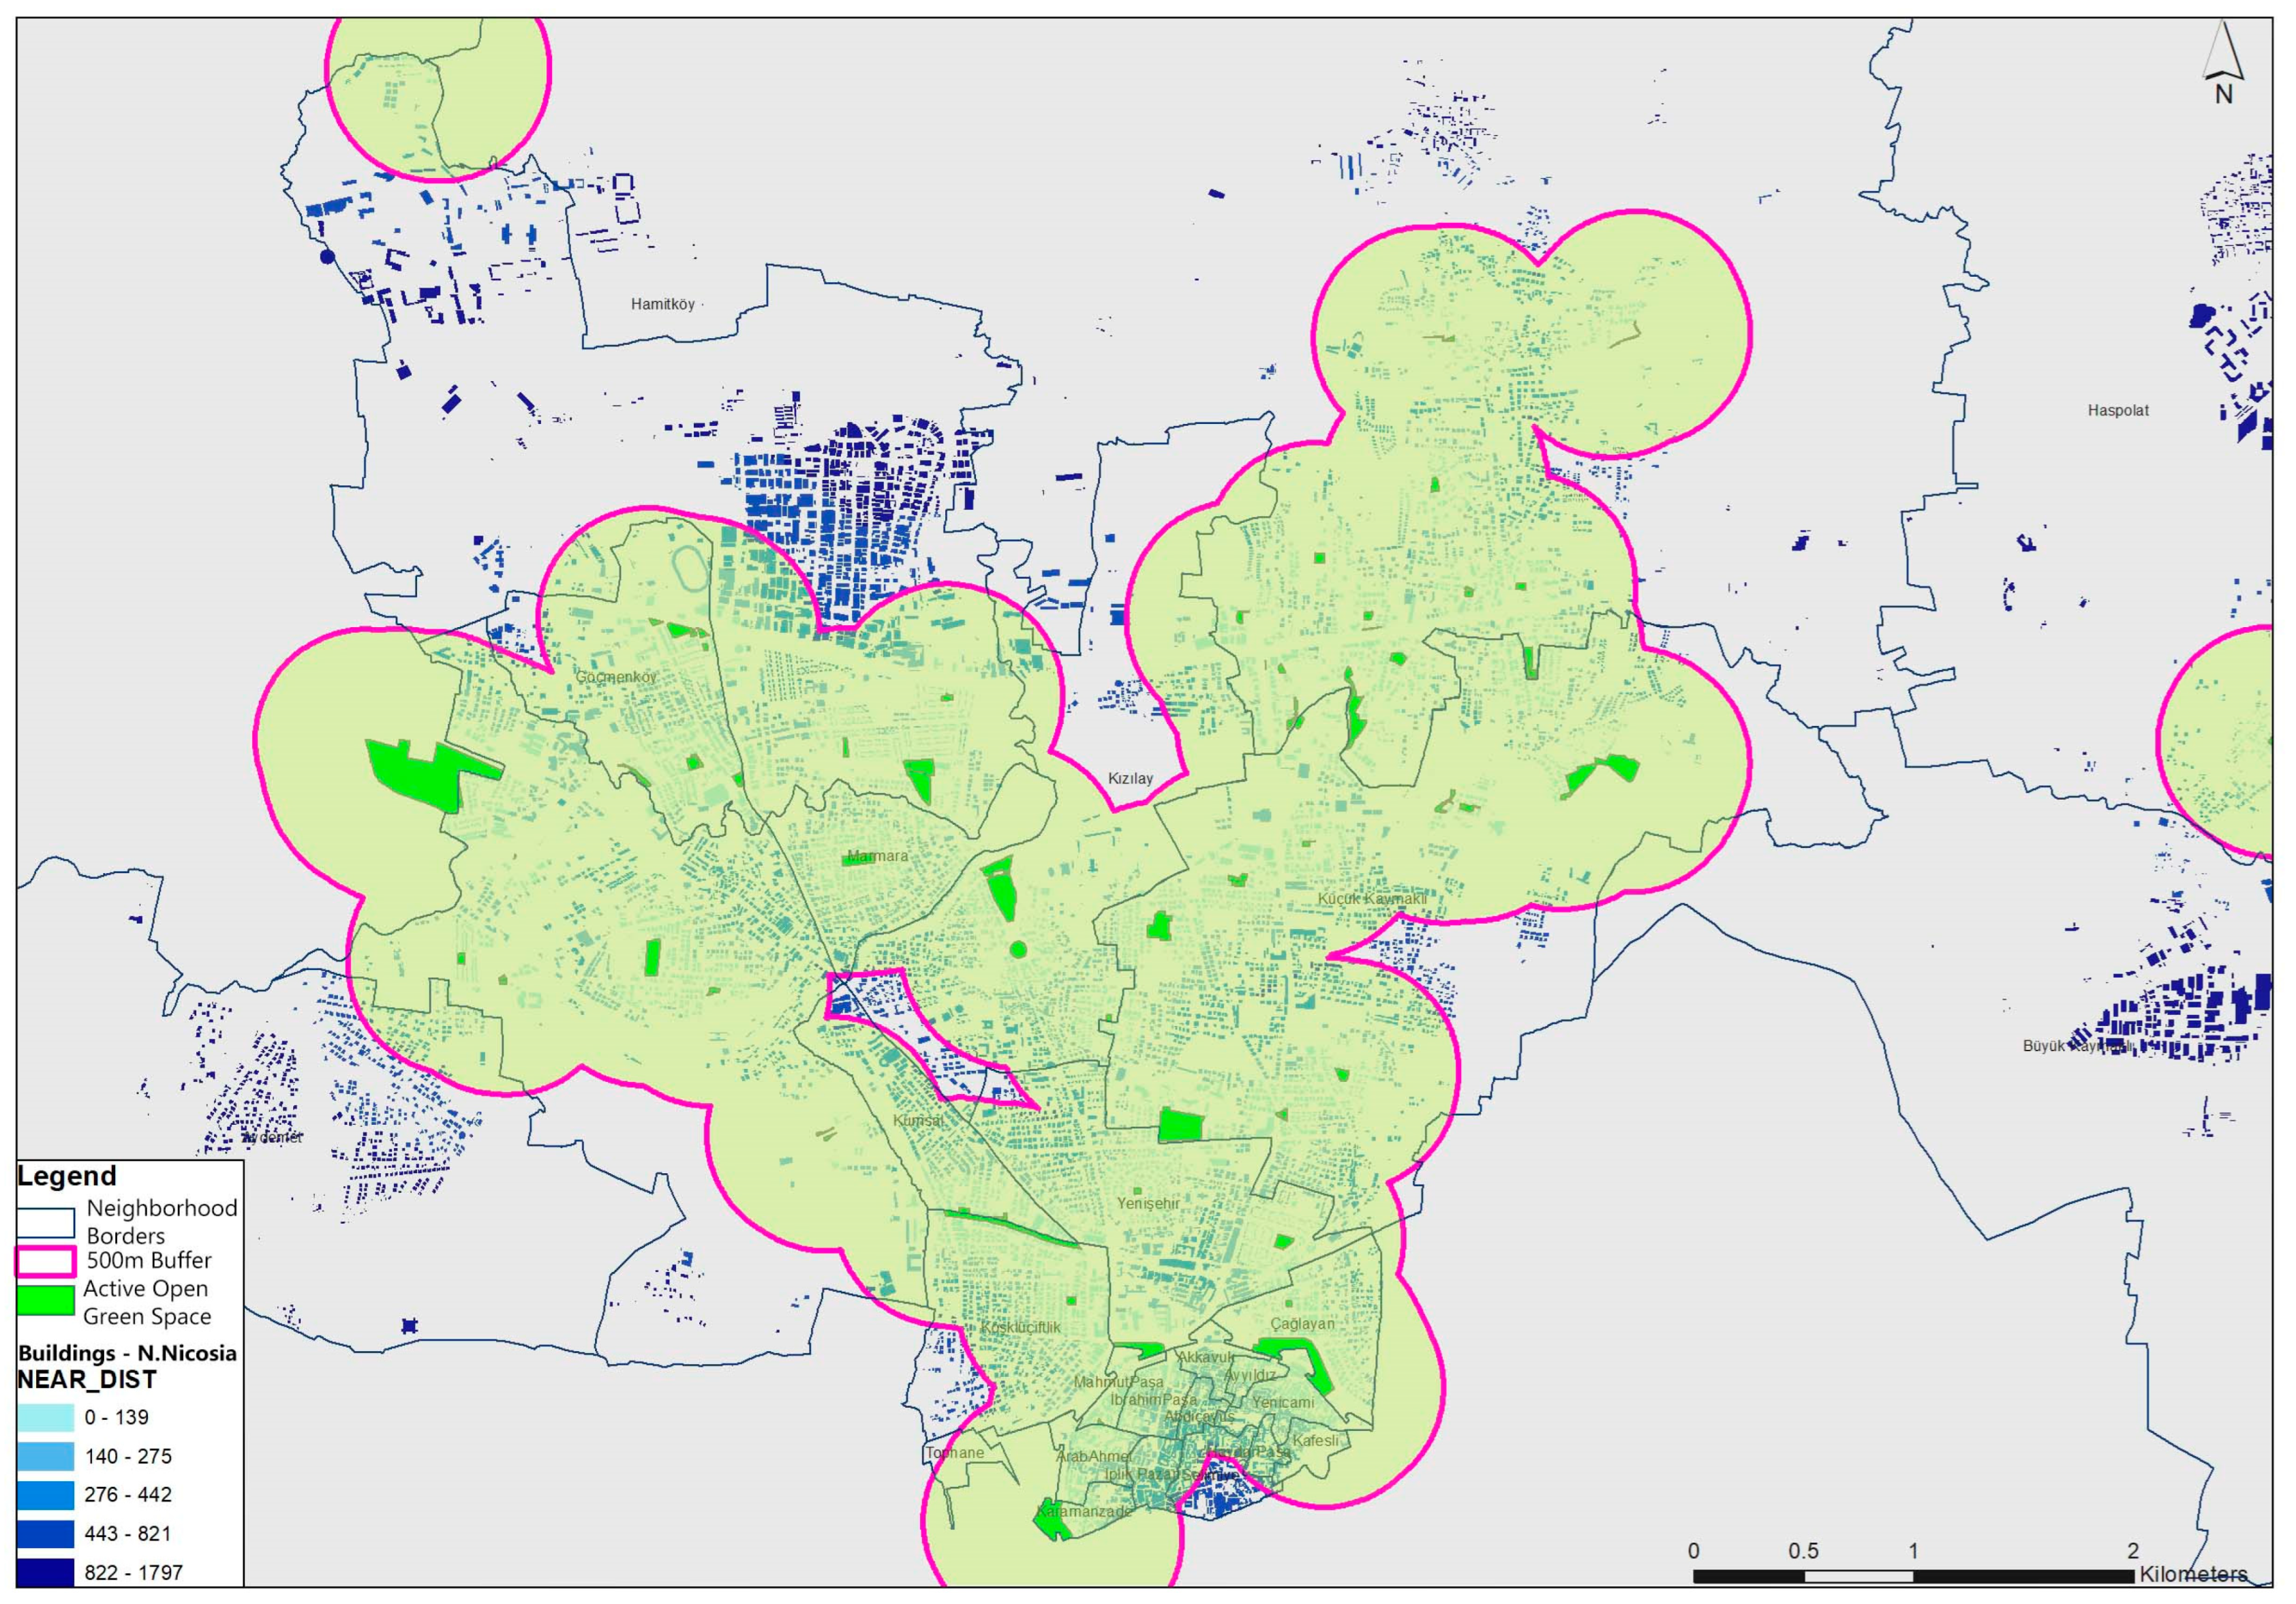
As mentioned before, a 300 m distance is used for the neighborhood level of accessibility of open green spaces in many case studies from different countries. GIS measurements made in the area showed that there is an accessible active green area at an average of 337 m from each building (Figure 9). In this context, regarding proximity, actively accessible green areas at the neighborhood level have a moderate standard in Nicosia.
Small green spaces at the neighborhood scale can meet the daily needs for contact with nature, and the most valuable open green spaces are intimate and familiar spaces that play a role in people’s daily lives rather than remote ones [40]. For this reason, 300 m proximity analysis was chosen primarily for GIS analysis based on the literature review.
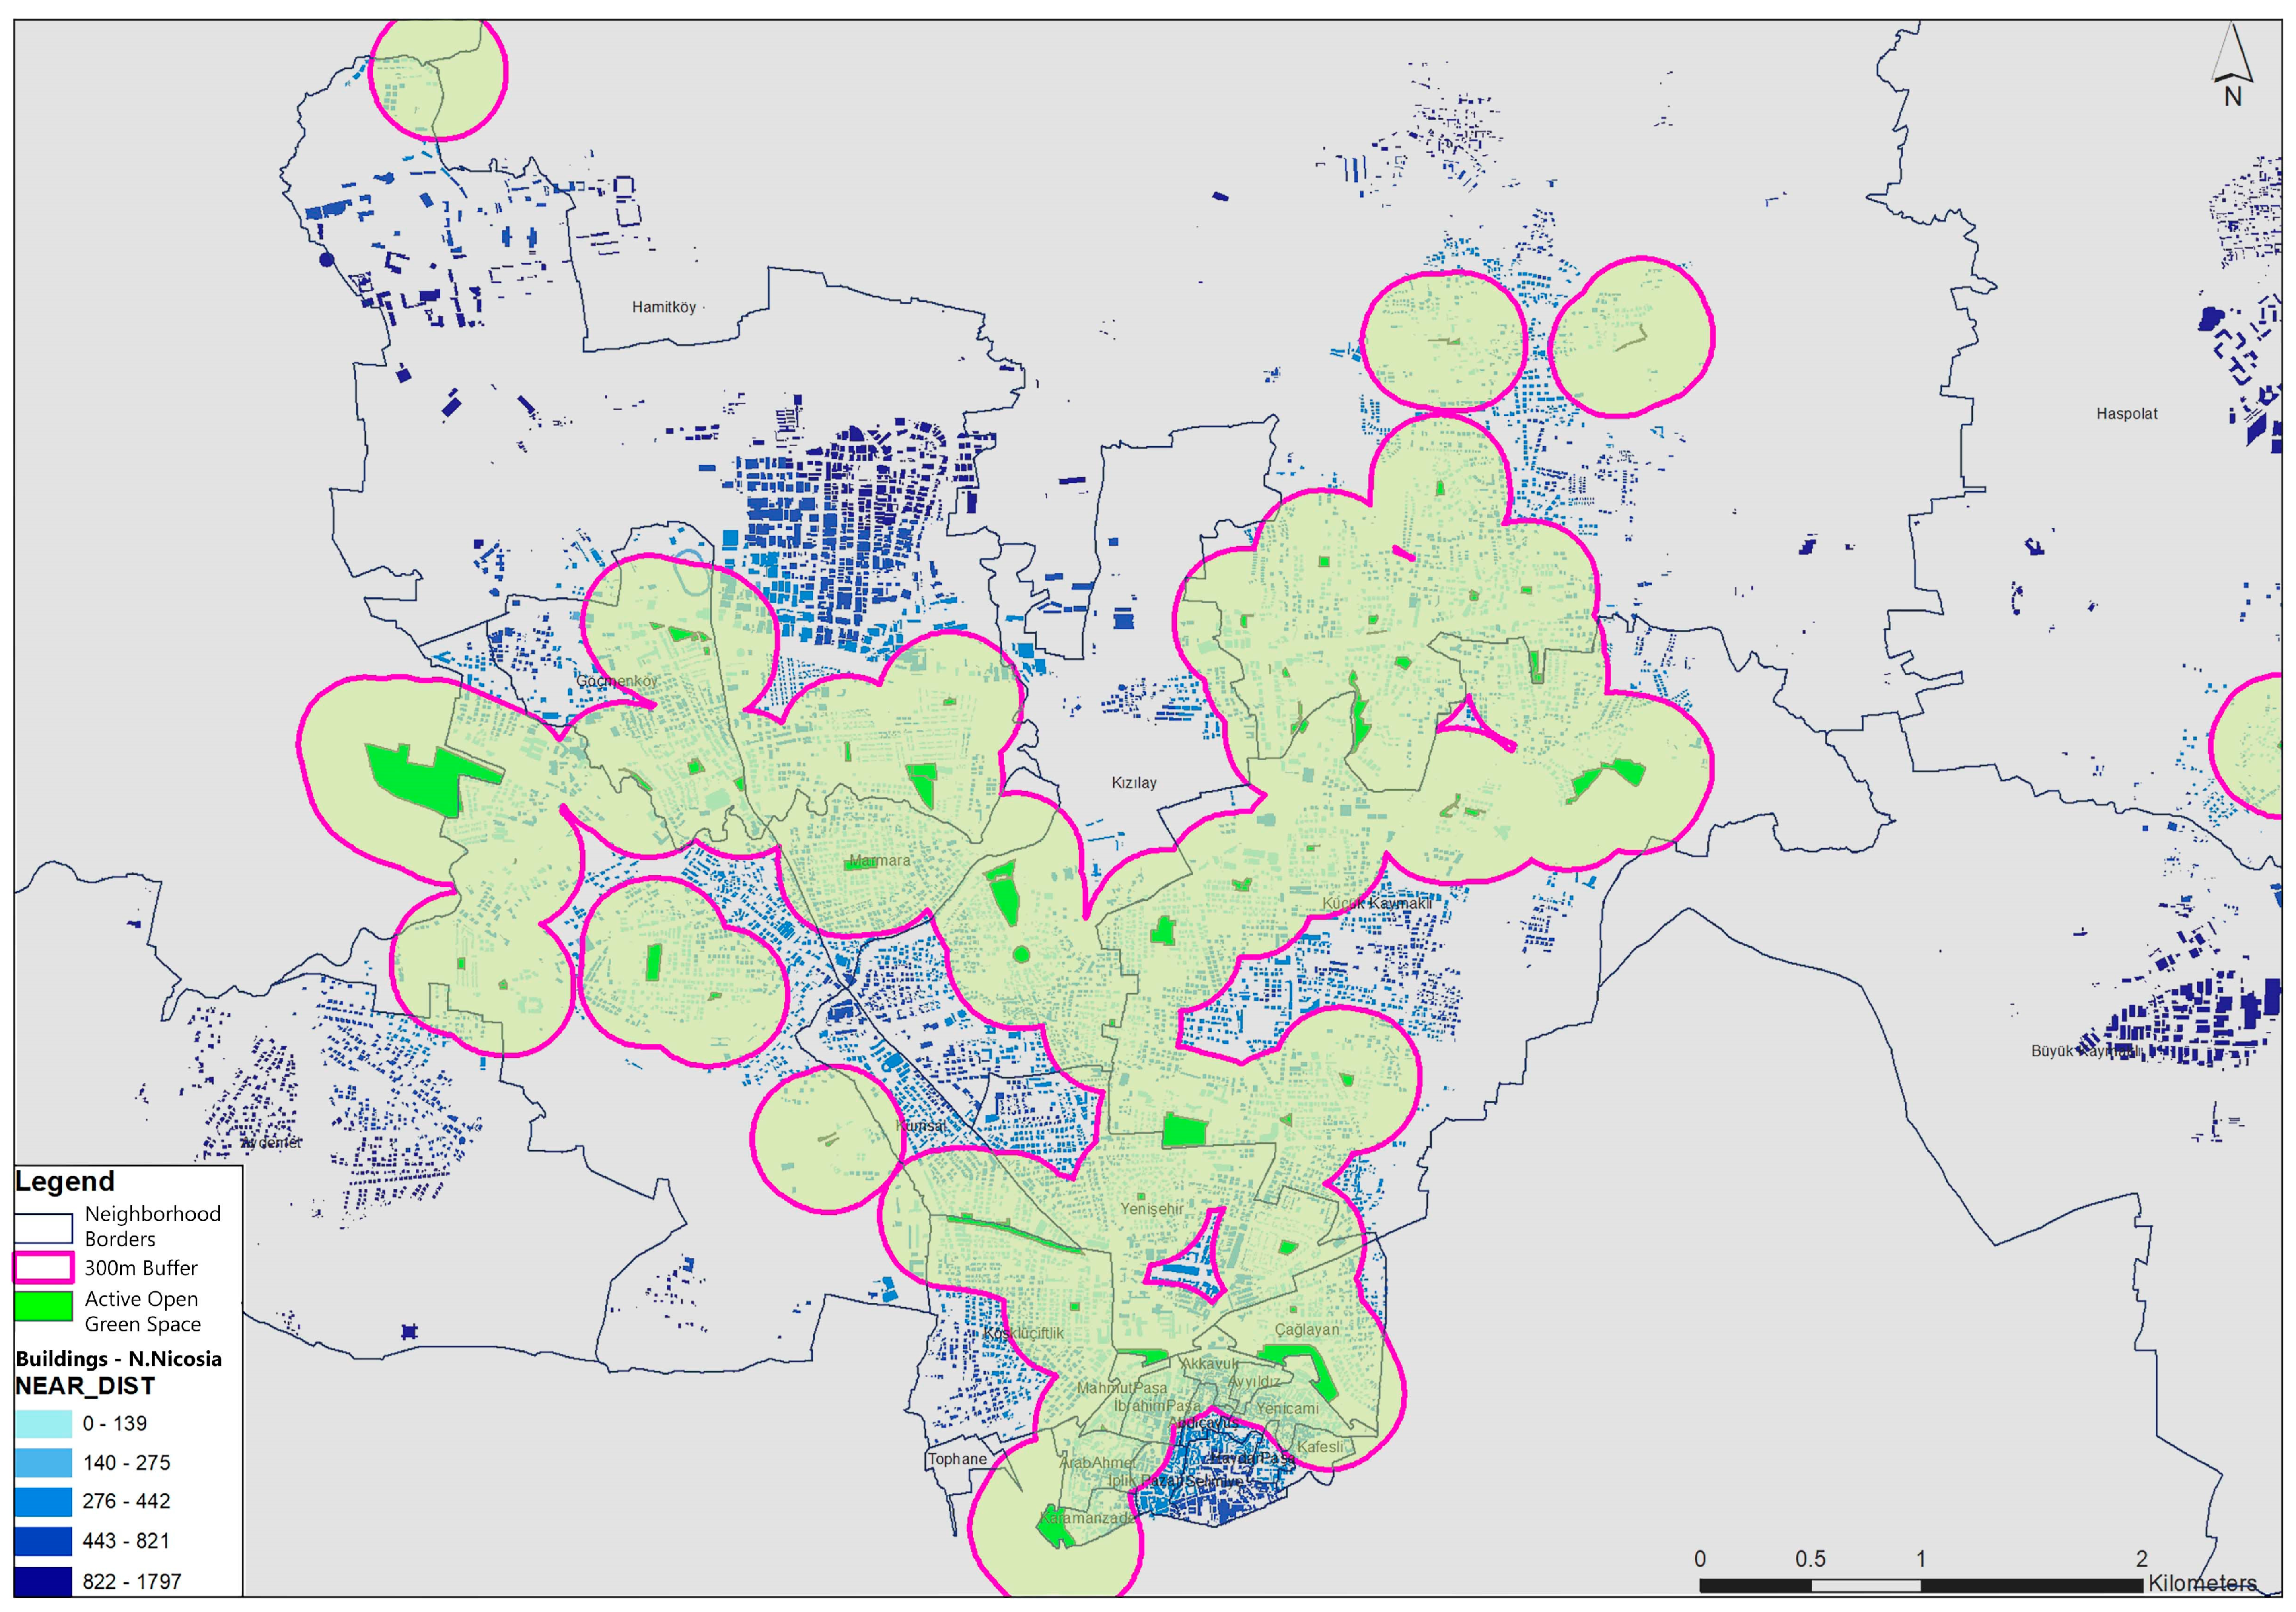
The accessibility of neighborhood parks, playgrounds and sports fields was measured using GIS software 10.1 and 300 and 500 m buffer spatial location analyses. For Northern Nicosia, the accessibility of active open green spaces was calculated using buffers of 300 and 500 m (Figure 10 and Figure 11). As a result of the measurements, the active and accessible green areas within 300 m in Northern Nicosia are very limited.
Measurements conducted in the Taşkınköy neighborhood, one of the largest neighborhoods in Nicosia, showed that the active and accessible green areas within 300 m are very limited. In Küçük Kaymaklı and Ortaköy neighborhoods, there are few active open green areas and active and accessible green areas within 300 m are also very limited. GIS measurements show that the active and accessible open green areas within the 500 m buffer in these neighborhoods are very few.

4.3. Area Percentages

According to the measurements made on the maps, a total of 1,065,954.581 m2 of open green area was calculated in the Nicosia region. A total of 205,819.081 m2 of these calculated open green areas was categorized as active green areas, while 860,135.5 m2 was measured as passive green areas.
In the study conducted in Northern Nicosia, covering an area of 92.8 km2, only 1.15% of the total is green areas, and particularly, only 0.22% of them are active green areas. In the selected neighborhoods, green areas make up 3.43% of the total in the Küçük Kaymaklı neighborhood, which covers an area of 4.94 km2, with 0.90% of them being active. In Ortaköy neighborhood, which covers an area of 4.07 km2, 2.76% is green areas and 0.03% of this is active. In the Taşkınköy neighborhood, which has an area of 5.87 km2, green areas constitute 2.88% of the total and 0.33% of it is active.

4.4. Types of Green Spaces

There are different types of open green areas in the Nicosia Region, such as sports fields, playgrounds or parks and residential mass housing gardens. According to field work and field measurements, 205,819.081 m2 of active open green area has been determined in the region. Approximately 61% of these areas are playgrounds or parks, while 17% are sports fields and playgrounds (Table 7).
To determine the green areas at the neighborhood level, these green areas were determined on the maps and they were observed on-site in line with the field work. The green area types (green spaces, playgrounds, neighborhood parks, sports fields and residential mass housing gardens) detected according to the previous literature review are all listed, see Table 8.
The green area types in the Taşkınköy neighborhood were calculated on the maps and in line with on-site observations (green areas, playgrounds or parks, sports fields and playgrounds and mass housing gardens). Of the 19,471.744 m2 of active open green area, 16,610.937 m2 consists of sports areas and playgrounds and 2860.807 m2 is composed of green areas (hobby gardens).
According to the measurements in the Küçük Kaymaklı neighborhood, there was 171,837.932 m2 of open green areas on the map, and field work was carried out in the neighborhood for only 45,466.385 m2 of active open green areas. It was observed that these active green areas are sports fields, 11,177.735 m2 is sports and playgrounds, 4441.039 m2 is playgrounds or parks and 5132.294 m2 is green areas.
In line with the fieldwork, only 12,850.499 m2 of the total green area of 110,660.44 m2 in the Ortaköy neighborhood was measured as active open green areas. According to the measurements, there are only five active green areas in this neighborhood, four of which are playgrounds or parks and one of which is a sports area and playground, see Table 9.

5. Discussion

Urban green space, at the neighborhood scale in particular, is a vital feature for planning and design attempts to boost urban ecology. An urban neighborhood green space index can be highly efficient for obtaining comprehensive data and performing a thorough analysis of urban green spaces for all cities. The related literature provides various methods to evaluate urban green spaces with different components and parameters [71,72,73].
Considering these previous urban green space index models, scholars have mostly focused on quantitative parameters such as proximity to green spaces, area percentages, building characteristics, accessibility, etc. [74,75]. This type of green index is highly based on remotely sensed imagery and geographic information systems (GISs) by determining greenery in relation to building density, height of structures, etc. There is also a significant amount of research based on subjective methods such as visual perception and self-reporting involving questionnaires [74]. Qualitative and perceptual components are highly excluded. However, an index that aims to evaluate and assess urban neighborhood green space needs to be evaluated in a more comprehensive way adopting a multidimensional perspective. Therefore, in this study, a new index with three main components was developed for Northern Nicosia, given the absence of ecological planning and a design agenda in the city. Based on the related scientific work, in addition to the quantitative components, qualitative and perceptual components were added to redefine the index for the city from a diverse perspective. Within the quantitative component, the building density and height of structures are deliberately excluded, as the city has a relatively high low-rise density.
Four parameters were determined for the quantitative dimension of the index. From the quantitative aspect of the study, based on measurements made in the three selected neighborhoods, there is an insufficient amount of active green space, and the amount of active green space per capita calculated throughout Nicosia (3.35 m2) is well below the amount predicted by WHO. WHO determined the ideal per capita amount to be 50 m2, with a minimum value of 9 m2. This value varies among different countries of Europe. In some countries, such as Belgium, Germany and Australia, it is almost 200 m2 per person, whereas in other countries, including Spain and Macedonia, and southern cities of Italy, it is approximately 4 m2, as cited in [76,77]. Furthermore, in the selected neighborhoods, this amount was calculated as 5.062 m2 in Taşkınköy, 1.449 m2 in Ortaköy and 4.301 m2 in the Küçük Kaymaklı neighborhood.
Secondly, in the GIS measurements, 300 and 500 m buffers were created, finding that the active green areas were accessible within 337 m in the neighborhoods. As WHO recommends a maximum distance of 300 m to a residence, the proximity is somewhat sufficient. However, the active and accessible open green areas in these neighborhoods are very few in the 300 and 500 m buffers, as a remarkable number of them were vacant or misused.
In addition, regarding the area percentages, only 1.15% of the total is green areas and only 0.22% of them are active green areas in the city. Furthermore, the percentage of green space is 3.43% in Küçük Kaymaklı. There is a total of 2.76% green area in Ortaköy and there is a total green area of 2.88% in Taşkınköy. The area percentages of active green spaces of these neighborhoods are all lower. This amount is very low considering the standards proposed. As such, it is recommended to have a minimum of 25% of green urban land.
Regarding the quantity of green spaces based on the type, active green areas are not regularly distributed among neighborhoods and most of the green areas on the map are not actively used because they are vacant and abandoned areas. They are in an abandoned state, and in some neighborhoods, there are no playgrounds, sports fields or neighborhood parks.
The study aimed to conduct an assessment and thorough analysis of Nicosia city and its chosen three neighborhoods regarding four parameters of the quantitative characteristics. As a limitation of this research, only three large neighborhoods were chosen as the study areas. The quantity of analyzed neighborhoods could be increased. Furthermore, the other defined components of the UNGI, which are defined as perceptual and qualitative, can also be measured in the same or other neighborhoods.

6. Conclusions

Urban environments are enlarging day by day. Consequently, contemporary cities are expanding rapidly [78]. In today’s world, cities are increasingly expansive and dispersed landscapes [79]. Challenges are increasing in managing and reducing human influences on the natural environment in cities, as vegetation areas are decreasing. This negative trend contributes significantly to global warming and climate change phenomena. Therefore, the significance of the existence of open green spaces is increasing worldwide as part of the discourse on ecological urban planning.
Urban green spaces form an integral and important part of an urban area. These spaces have gained popularity in the interdisciplinary domains of ecology, medicine, psychology, economics, sociology and geography due to the growing demands associated with urbanization. Research on UGSs is still developing in these fields [80].
The quantity and quality of these areas at every scale of the urban environment are a primary concern for planners and decision makers. A neighborhood is synonymous with proximity and can be defined as an area with homogeneous properties. The neighborhood level is particularly important because it is the core working level for implementing ecological planning and design strategies. Thus, developing an index that is specific for the urban environment with standards and classifications can be vital for the establishment of a thorough network of green space, leading to efficient functioning for urban ecology. In other words, the Urban Neighborhood Green Index aims to assess green spaces at the neighborhood level both qualitatively and quantitatively with the help of disparate parameters combined as one unit. This measurement can help identify critical issues with challenges and opportunities that can be used to operate comprehensive ecological planning and design decisions.
Northern Nicosia also requires an increasing ecological urban planning and design approach. The city has significant deficiencies with regard to the quality and quantity of urban environments, including urban green spaces such as parks and playgrounds. Within this framework, through a theoretical review, this study first develops an urban neighborhood green index as the theoretical model with three main components (quantitative, qualitative and perceptual), including parameters for each. The quantitative component consists of four parameters: ‘per capita green spaces’, ‘proximity to green spaces’, ‘area percentages of green spaces’ and ‘types of green spaces’. Secondly, the qualitative component of the index consists of ‘hardscape elements’ and ‘softscape elements’. Hardscape elements involve features such as urban furniture, sport areas, semi-open/semi-closed spaces, artificial water items, infrastructural features, paths, resting areas, playgrounds and parking areas. On the other hand, softscape elements include vegetation such as trees, shrubs and ground coverings; soil and natural rockery; and natural water features. Furthermore, the perceptual component consists of user perception and community involvement, which means the frequency of visits to urban spaces. In conclusion, the aim is that this index, developed for Nicosia city in particular, can be efficiently applied in various cities of the world for quantitative and qualitative measurements and analysis of urban green spaces.
Later, in the methodology part of this study, the city of Northern Nicosia and its three neighborhoods, Ortaköy, Küçük Kaymaklı and Taşkınköy, were chosen as the study areas. In this study, only the quantitative component with its four parameters was measured and analyzed, which is a limitation of this research. Based on the findings, urban green spaces are not sufficient regarding three of the four parameters evaluated within this study to construct a comprehensive green space index.
As concluding remarks, the authors aimed to propose an index at the neighborhood level as a new paradigm to be used for ecological urban planning and design, with a focus on UGSs based on sustainability. In conclusion, this study, which involves not only quantitative parameters but also qualitative and perceptual features, has the potential to contribute to expanding the scientific knowledge on measuring and analyzing urban neighborhood green spaces.

Author Contributions

Conceptualization, M.K.B. and B.A.; methodology, M.K.B. and B.A.; formal analysis, M.K.B.; resources, M.K.B.; data curation, M.K.B.; writing—original draft preparation, M.K.B. and B.A.; writing—review and editing, M.K.B. and B.A.; visualization, M.K.B.; supervision, B.A. All authors have read and agreed to the published version of the manuscript.

Funding

This research received no external funding.

Institutional Review Board Statement

The study did not require ethical approval.

Informed Consent Statement

Not applicable.

Data Availability Statement

The corresponding author can provide data upon reasonable request.

Conflicts of Interest

The authors declare no conflict of interest.

References

  1. Duman, Ü.; Asilsoy, B. Developing an Evidence-Based Framework of Universal Design in the Context of Sustainable Urban Planning in Northern Nicosia. Sustainability 2022, 14, 13377. [Google Scholar] [CrossRef]
  2. Chen, X.; Wu, J. Sustainable landscape architecture: Implications of the Chinese philosophy of “unity of man with nature” and beyond. Landsc. Ecol. 2009, 24, 1015–1026. [Google Scholar] [CrossRef]
  3. He, J.; Bao, C.-K.; Shu, T.-F.; Yun, X.-X.; Jiang, D.; Brown, L. Framework for integration of urban planning, strategic environmental assessment and ecological planning for urban sustainability within the context of China. Environ. Impact Assess. Rev. 2011, 31, 549–560. [Google Scholar] [CrossRef]
  4. Çoban, A.; Yücel, M. Kent Planlamasında Ekosistem Hizmetlerinin Rolü. Düzce Üniv. Bilim Teknol. Derg. 2018, 6, 444–454. [Google Scholar]
  5. Pickett, S.T.A.; Cadenasso, M.L.; Grove, J.M.; Groffman, P.M.; Band, L.E.; Boone, C.G.; Burch, W.R.; Grimmond, C.S.B.; Hom, J.; Jenkins, J.C.; et al. Beyond Urban Legends: An Emerging Framework of Urban Ecology, as Illustrated by the Baltimore Ecosystem Study. BioScience 2008, 58, 139–150. [Google Scholar] [CrossRef]
  6. Aronson, M.F.; Lepczyk, C.A.; Evans, K.L.; Goddard, M.A.; Lerman, S.B.; MacIvor, J.S.; Nilon, C.H.; Vargo, T. Biodiversity in the city: Key challenges for urban green space management. Front. Ecol. Environ. 2017, 15, 189–196. [Google Scholar] [CrossRef]
  7. Wolch, J.R.; Byrne, J.; Newell, J.P. Urban green space, public health, and environmental justice: The challenge of making cities ‘just green enough’. Landsc. Urban Plan. 2014, 125, 234–244. [Google Scholar] [CrossRef]
  8. Wendel, H.E.W.; Zarger, R.K.; Mihelcic, J.R. Accessibility and usability: Green space preferences, perceptions, and barriers in a rapidly urbanizing city in Latin America. Landsc. Urban Plan. 2012, 107, 272–282. [Google Scholar] [CrossRef]
  9. Agudelo-Vera, C.M.; Mels, A.R.; Keesman, K.J.; Rijnaarts, H.H. Resource management as a key factor for sustainable urban planning. J. Environ. Manag. 2011, 92, 2295–2303. [Google Scholar] [CrossRef]
  10. Stratigea, A.; Papadopoulou, C.-A.; Panagiotopoulou, M. Tools and Technologies for Planning the Development of Smart Cities. J. Urban Technol. 2015, 22, 43–62. [Google Scholar] [CrossRef]
  11. Haarstad, H. Constructing the sustainable city: Examining the role of sustainability in the ‘smart city’ discourse. J. Environ. Policy Plan. 2017, 19, 423–437. [Google Scholar] [CrossRef]
  12. Brilhante, O.; Klaas, J. Green City Concept and a Method to Measure Green City Performance over Time Applied to Fifty Cities Globally: Influence of GDP, Population Size and Energy Efficiency. Sustainability 2018, 10, 2031. [Google Scholar] [CrossRef]
  13. El Ghorab, H.K.; Shalaby, H.A. Eco and Green cities as new approaches for planning and developing cities in Egypt. Alex. Eng. J. 2016, 55, 495–503. [Google Scholar] [CrossRef]
  14. Çetinkaya, Ç. Eko-Kentler: Kent Ve Doğa İlişkisinde Yeni Bir Sistem Tasarımı. Türk Bilimsel Derlemeler Derg. 2013, 6, 12–16. [Google Scholar]
  15. Van Dijk, P.M. Beijing and Rotterdam Eco Cities? Using 100 Criteria for a Classification of Ecological Cities Paper; TU Delft: Delft, The Netherlands, 2010. [Google Scholar]
  16. Choon, S.W.; Siwar, C.; Pereira, J.J.; Jemain, A.A.; Hashim, H.S.; Hadi, A.S. A sustainable city index for Malaysia. Int. J. Sustain. Dev. World Ecol. 2011, 18, 28–35. [Google Scholar] [CrossRef]
  17. Breuste, J.; Qureshi, S. Urban sustainability, urban ecology and the Society for Urban Ecology (SURE). Urban Ecosyst. 2011, 14, 313–317. [Google Scholar] [CrossRef]
  18. Wu, J.; Xiang, W.-N.; Zhao, J. Urban ecology in China: Historical developments and future directions. Landsc. Urban Plan. 2014, 125, 222–233. [Google Scholar] [CrossRef]
  19. Karadağ, A. Kentsel Ekoloji: Kentsel Çevre Analizlerinde Coğrafi Yaklaşım. Ege Coğrafya Derg. 2009, 18, 31–47. [Google Scholar]
  20. Leitao, A.B.; Ahern, J. Applying landscape ecological concepts and metrics in sustainable landscape planning. Landsc. Urban Plan. 2002, 59, 65–93. [Google Scholar] [CrossRef]
  21. Wilby, R.L.; Perry, G.L. Climate change, biodiversity and the urban environment: A critical review based on London, UK. Prog. Phys. Geogr. Earth Environ. 2006, 30, 73–98. [Google Scholar] [CrossRef]
  22. Yıldırım, S.; Asilsoy, B.; Özden, Ö. Urban Resident Views about Open Green Spaces: A Study in Güzelyurt (Morphou), Cyprus. Eur. J. Sustain. Dev. 2020, 9, 441–450. [Google Scholar] [CrossRef]
  23. Pirasteh, S.; Ali, S.A.; Hussain, H.J. Greenrey (Green Space) Percentage Estimation Using Band Ratio, NDVI from Landsat Enhanced Thematic Mapper (ETM)-2002 & An Application of Geographic Information System (GIS) Techniques, Dezful-Andimeshk, Khuzestan South-West Iran. In Proceedings of the 8th Annual International Conference, New Delhi, India, 7–9 February 2005. [Google Scholar]
  24. Kong, F.; Nakagoshi, N. Spatial-temporal gradient analysis of urban green spaces in Jinan, China. Landsc. Urban Plan. 2006, 78, 147–164. [Google Scholar] [CrossRef]
  25. Sanesi, G.; Chiarello, F. Residents and urban green spaces: The case of Bari. Urban For. Urban Green. 2006, 4, 125–134. [Google Scholar] [CrossRef]
  26. Cilliers, S.; Cilliers, J.; Lubbe, R.; Siebert, S. Ecosystem services of urban green spaces in African countries—perspectives and challenges. Urban Ecosyst. 2013, 16, 681–702. [Google Scholar] [CrossRef]
  27. Kabisch, N.; Strohbach, M.; Haase, D.; Kronenberg, J. Urban green space availability in European cities. Ecol. Indic. 2016, 70, 586–596. [Google Scholar] [CrossRef]
  28. Taylor, L.; Hochuli, D.F. Defining greenspace: Multiple uses across multiple disciplines. Landsc. Urban Plan. 2017, 158, 25–38. [Google Scholar] [CrossRef]
  29. Kabisch, N.; Haase, D. Green justice or just green? Provision of urban green spaces in Berlin, Germany. Landsc. Urban Plan. 2014, 122, 129–139. [Google Scholar] [CrossRef]
  30. Di, S.; Li, Z.-L.; Tang, R.; Pan, X.; Liu, H.; Niu, Y. Urban green space classification and water consumption analysis with remote-sensing technology: A case study in Beijing, China. Int. J. Remote Sens. 2019, 40, 1909–1929. [Google Scholar] [CrossRef]
  31. Van Herzele, A.; Wiedemann, T. A monitoring tool for the provision of accessible and attractive urban green spaces. Landsc. Urban Plan. 2003, 63, 109–126. [Google Scholar] [CrossRef]
  32. Atila, G.; Küçük, V. Kentsel Açik-Yeşil Alanlar Ve Isparta Kenti Örneğinde İrdelenmesi. Türkiye Orman. Derg. 2001, 2, 27–48. [Google Scholar]
  33. Sugiyama, T.; Carver, A.; Koohsari, M.J.; Veitch, J. Advantages of public green spaces in enhancing population health. Landsc. Urban Plan. 2018, 178, 12–17. [Google Scholar] [CrossRef]
  34. Körmeçli, P.Ş. Kentsel Alanlarda Erişilebilirlik ve Sosyal Etkileşim İlişkisinin Irdelenmesi: Ankara Çukurambar Mahallesi Örneği; Ankara University: Ankara, Turkey, 2019. [Google Scholar]
  35. Erdönmez, M.E.; Akı, A. Açık kamusal kent mekanlarının toplum ilişkilerindeki etkileri. Megaron 2005, 1, 67. [Google Scholar]
  36. Khan, A.M.; Rana, M.S.; Rashied, M.; Mahmud, M.A.; Pramanik, M.A.; Rahman MS, U.; Rashid MH, O. Revisiting Planning Standards for Open Spaces in Urban Areas from Global and National Perspectives. J. Bangladesh Inst. Plan. ISSN 2019, 2075, 9363. [Google Scholar]
  37. Moseley, D.; Marzano, M.; Chetcuti, J.; Watts, K. Green networks for people: Application of a functional approach to support the planning and management of greenspace. Landsc. Urban Plan. 2013, 116, 1–12. [Google Scholar] [CrossRef]
  38. Gupta, K.; Kumar, P.; Pathan, S.K.; Sharma, K.P. Urban Neighborhood Green Index—A measure of green spaces in urban areas. Landsc. Urban Plan. 2012, 105, 325–335. [Google Scholar] [CrossRef]
  39. Sharifi, A. From Garden City to Eco-urbanism: The quest for sustainable neighborhood development. Sustain. Cities Soc. 2016, 20, 1–16. [Google Scholar] [CrossRef]
  40. Jim, C.; Chen, S.S. Comprehensive greenspace planning based on landscape ecology principles in compact Nanjing city, China. Landsc. Urban Plan. 2003, 65, 95–116. [Google Scholar] [CrossRef]
  41. Perry, M.A.; Devan, H.; Fitzgerald, H.; Han, K.; Liu, L.T.; Rouse, J. Accessibility and usability of parks and playgrounds. Disabil. Health J. 2018, 11, 221–229. [Google Scholar] [CrossRef]
  42. Akbulut, Ç.D.; Önder, S. Aksaray Kenti Açık-Yeşil Alanlarının Nitelik Ve Nicelik Yönünden İncelenmesi. Selcuk. J. Agric. Food Sci. 2011, 25, 90–95. [Google Scholar]
  43. Van Helden, B.E.; Close, P.G.; Stewart, B.A.; Speldewinde, P.C.; Comer, S.J. An underrated habitat: Residential gardens support similar mammal assemblages to urban remnant vegetation. Biol. Conserv. 2020, 250, 108760. [Google Scholar] [CrossRef]
  44. Hussain, M.R.M.; Tukiman, I.; Zen, I.H.; Shahli, F.M. The Impact of Landscape Design on House Prices and Values in Residential Development in Urban Areas. APCBEE Procedia 2014, 10, 316–320. [Google Scholar] [CrossRef]
  45. Mahmoud, A.H.A. Analysis of the microclimatic and human comfort conditions in an urban park in hot and arid regions. Build. Environ. 2011, 46, 2641–2656. [Google Scholar] [CrossRef]
  46. Shahli, F.M.; Hussain MR, M. Implementation of Landscape Design as Elements in Creating Values for Housing Areas in Klang Valley, Malaysia. Am. Trans. Eng. Appl. Sci. 2015, 4, 219–230. [Google Scholar]
  47. Stessens, P.; Khan, A.Z.; Huysmans, M.; Canters, F. Analysing urban green space accessibility and quality: A GIS-based model as spatial decision support for urban ecosystem services in Brussels. Ecosyst. Serv. 2017, 28, 328–340. [Google Scholar] [CrossRef]
  48. Zhang, Y.; Van den Berg, A.E.; Van Dijk, T.; Weitkamp, G. Quality over Quantity: Contribution of Urban Green Space to Neighborhood Satisfaction. Int. J. Environ. Res. Public Health 2017, 14, 535. [Google Scholar] [CrossRef]
  49. Gupta, K.; Roy, A.; Luthra, K.; Maithani, S. Mahavir GIS based analysis for assessing the accessibility at hierarchical levels of urban green spaces. Urban For. Urban Green. 2016, 18, 198–211. [Google Scholar] [CrossRef]
  50. Zhu, Z.; Lang, W.; Tao, X.; Feng, J.; Liu, K. Exploring the Quality of Urban Green Spaces Based on Urban Neighborhood Green Index—A Case Study of Guangzhou City. Sustainability 2019, 11, 5507. [Google Scholar] [CrossRef]
  51. La Rosa, D. Accessibility to greenspaces: GIS based indicators for sustainable planning in a dense urban context. Ecol. Indic. 2014, 42, 122–134. [Google Scholar] [CrossRef]
  52. Neuvonen, M.; Sievänen, T.; Tönnes, S.; Koskela, T. Access to green areas and the frequency of visits—A case study in Helsinki. Urban For. Urban Green. 2007, 6, 235–247. [Google Scholar] [CrossRef]
  53. Richards, D.R.; Passy, P.; Oh, R.R. Impacts of population density and wealth on the quantity and structure of urban green space in tropical Southeast Asia. Landsc. Urban Plan. 2017, 157, 553–560. [Google Scholar] [CrossRef]
  54. Veal, A. Open space planning standards in Australia: In search of origins. Aust. Plan. 2013, 50, 224–232. [Google Scholar] [CrossRef]
  55. Anguluri, R.; Narayanan, P. Role of green space in urban planning: Outlook towards smart cities. Urban For. Urban Green. 2017, 25, 58–65. [Google Scholar] [CrossRef]
  56. Maryanti, M.; Khadijah, H.; Uzair, A.M.; Ghazali, M.M.M. The urban green space provision using the standards approach: Issues and challenges of its implementation in Malaysia. WIT Trans. Ecol. Environ. 2017, 210, 369–379. [Google Scholar]
  57. Khalil, R. Quantitative evaluation of distribution and accessibility of urban green spaces (Case study: City of Jeddah). Int. J. Geomat. Geosci. 2014, 4, 526–535. [Google Scholar]
  58. Hofmann, M.; Westermann, J.R.; Kowarik, I.; van der Meer, E. Perceptions of parks and urban derelict land by landscape planners and residents. Urban For. Urban Green. 2012, 11, 303–312. [Google Scholar] [CrossRef]
  59. Gozalo, G.R.; Morillas, J.M.B.; González, D.M. Perceptions and use of urban green spaces on the basis of size. Urban For. Urban Green. 2019, 46, 126470. [Google Scholar] [CrossRef]
  60. Christoforidi, I.; Kollaros, D.; Papadakaki, M.; Psaroudaki, A.; Antoniou, T.; Daliakopoulos, I.N. A novel index for assessing perceived availability and public demand for urban green space: Application in a Mediterranean island. Urban For. Urban Green. 2022, 69, 127498. [Google Scholar] [CrossRef]
  61. Rosol, M. Public Participation in Post-Fordist Urban Green Space Governance: The Case of Community Gardens in Berlin. Int. J. Urban Reg. Res. 2010, 34, 548–563. [Google Scholar] [CrossRef]
  62. Vargas-Hernández, J.G.; Pallagst, K.; Zdunek-Wielgołaska, J. Urban green spaces as a component of an ecosystem. Functions, services, users, community involvement, initiatives and actions. Rev. Urban. 2017, 37, 1–26. [Google Scholar] [CrossRef]
  63. Abdelhamid, M.M.; Elfakharany, M.M. Improving urban park usability in developing countries: Case study of Al-Shalalat Park in Alexandria. Alex. Eng. J. 2020, 59, 311–321. [Google Scholar] [CrossRef]
  64. Delipetrou, P.; Makhzoumi, J.; Dimopoulos, P.; Georghiou, K. Cyprus. In Mediterranean Island Landscapes; Springer: Dordrecht, The Netherlands, 2008; pp. 170–203. [Google Scholar]
  65. Della, A.; Paraskeva-Hadjichambi, D.; Hadjichambis, A.C. An ethnobotanical survey of wild edible plants of Paphos and Larnaca countryside of Cyprus. J. Ethnobiol. Ethnomed. 2006, 2, 34. [Google Scholar] [CrossRef]
  66. Gürkan, H. Dünkü ve Bügünkü Lefkoşa Toplu Eserler 3; Galeri Kültür Yayınları: Lefkoşa, Cyprus, 1996; pp. 11–85. [Google Scholar]
  67. Günçe, K.; Mısırlısoy, D. Assessment of Adaptive Reuse Practices through User Experiences: Traditional Houses in the Walled City of Nicosia. Sustainability 2019, 11, 540. [Google Scholar] [CrossRef]
  68. Bolkaner, M.K.; Asilsoy, B.; Uzunoğlu, S.S. A Study about Urban Design Schemes: Walled City of Nicosia. Eur. J. Sustain. Dev. 2020, 9, 549. [Google Scholar] [CrossRef]
  69. Ciftcioglu, G.C.; Aydin, A. Urban ecosystem services delivered by green open spaces: An example from Nicosia City in North Cyprus. Environ. Monit. Assess. 2018, 190, 613. [Google Scholar] [CrossRef] [PubMed]
  70. Zafersoy, H.; Batırbaygil, H. Urban Integrity: The City of Nicosia, Turkish Republic of Northern Cyprus/Kentsel Bütünleşiklik: Kuzey Kıbrıs Türk Cumhuriyeti Lefkoşa Kenti Örneği. Megaron 2014, 9, 289. [Google Scholar] [CrossRef]
  71. Jia, J.; Zlatanova, S.; Liu, H.; Aleksandrov, M.; Zhang, K. A design-support framework to assess urban green spaces for human wellbeing. Sustain. Cities Soc. 2023, 98, 104779. [Google Scholar] [CrossRef]
  72. Xu, C.; Chen, G.; Huang, Q.; Su, M.; Rong, Q.; Yue, W.; Haase, D. Can improving the spatial equity of urban green space mitigate the effect of urban heat islands? An empirical study. Sci. Total. Environ. 2022, 841, 156687. [Google Scholar] [CrossRef]
  73. Chen, J.; Kinoshita, T.; Li, H.; Luo, S.; Su, D.; Yang, X.; Hu, Y. Toward green equity: An extensive study on urban form and green space equity for shrinking cities. Sustain. Cities Soc. 2023, 90, 104395. [Google Scholar] [CrossRef]
  74. Liu, Y.; Meng, Q.; Zhang, J.; Zhang, L.; Jancso, T.; Vatseva, R. An effective Building Neighborhood Green Index model for measuring urban green space. Int. J. Digit. Earth 2016, 9, 387–409. [Google Scholar] [CrossRef]
  75. Jang, K.M.; Kim, J.; Lee, H.-Y.; Cho, H.; Kim, Y. Urban Green Accessibility Index: A Measure of Pedestrian-Centered Accessibility to Every Green Point in an Urban Area. ISPRS Int. J. Geo-Inf. 2020, 9, 586. [Google Scholar] [CrossRef]
  76. Pouya, S.; Aghlmand, M. Evaluation of urban green space per capita with new remote sensing and geographic information system techniques and the importance of urban green space during the COVID-19 pandemic. Environ. Monit. Assess. 2022, 194, 633. [Google Scholar] [CrossRef] [PubMed]
  77. Badiu, D.L.; Iojă, C.I.; Pătroescu, M.; Breuste, J.; Artmann, M.; Niță, M.R.; Grădinaru, S.R.; Hossu, C.A.; Onose, D.A. Is urban green space per capita a valuable target to achieve cities’ sustainability goals? Romania as a case study. Ecol. Indic. 2016, 70, 53–66. [Google Scholar] [CrossRef]
  78. Ramalho, C.E.; Hobbs, R.J. Time for a change: Dynamic urban ecology. Trends Ecol. Evol. 2012, 27, 179–188. [Google Scholar] [CrossRef] [PubMed]
  79. Seto, K.C.; Satterthwaite, D. Interactions between urbanization and global environmental change. Curr. Opin. Environ. Sustain. 2010, 2, 127–128. [Google Scholar] [CrossRef]
  80. Gulsrud, N.M.; Gooding, S.; Konijnendijk van den Bosch, C.C. Green space branding in Denmark in an era of neoliberal governance. Urban For. Urban Green. 2013, 12, 330–337. [Google Scholar] [CrossRef]
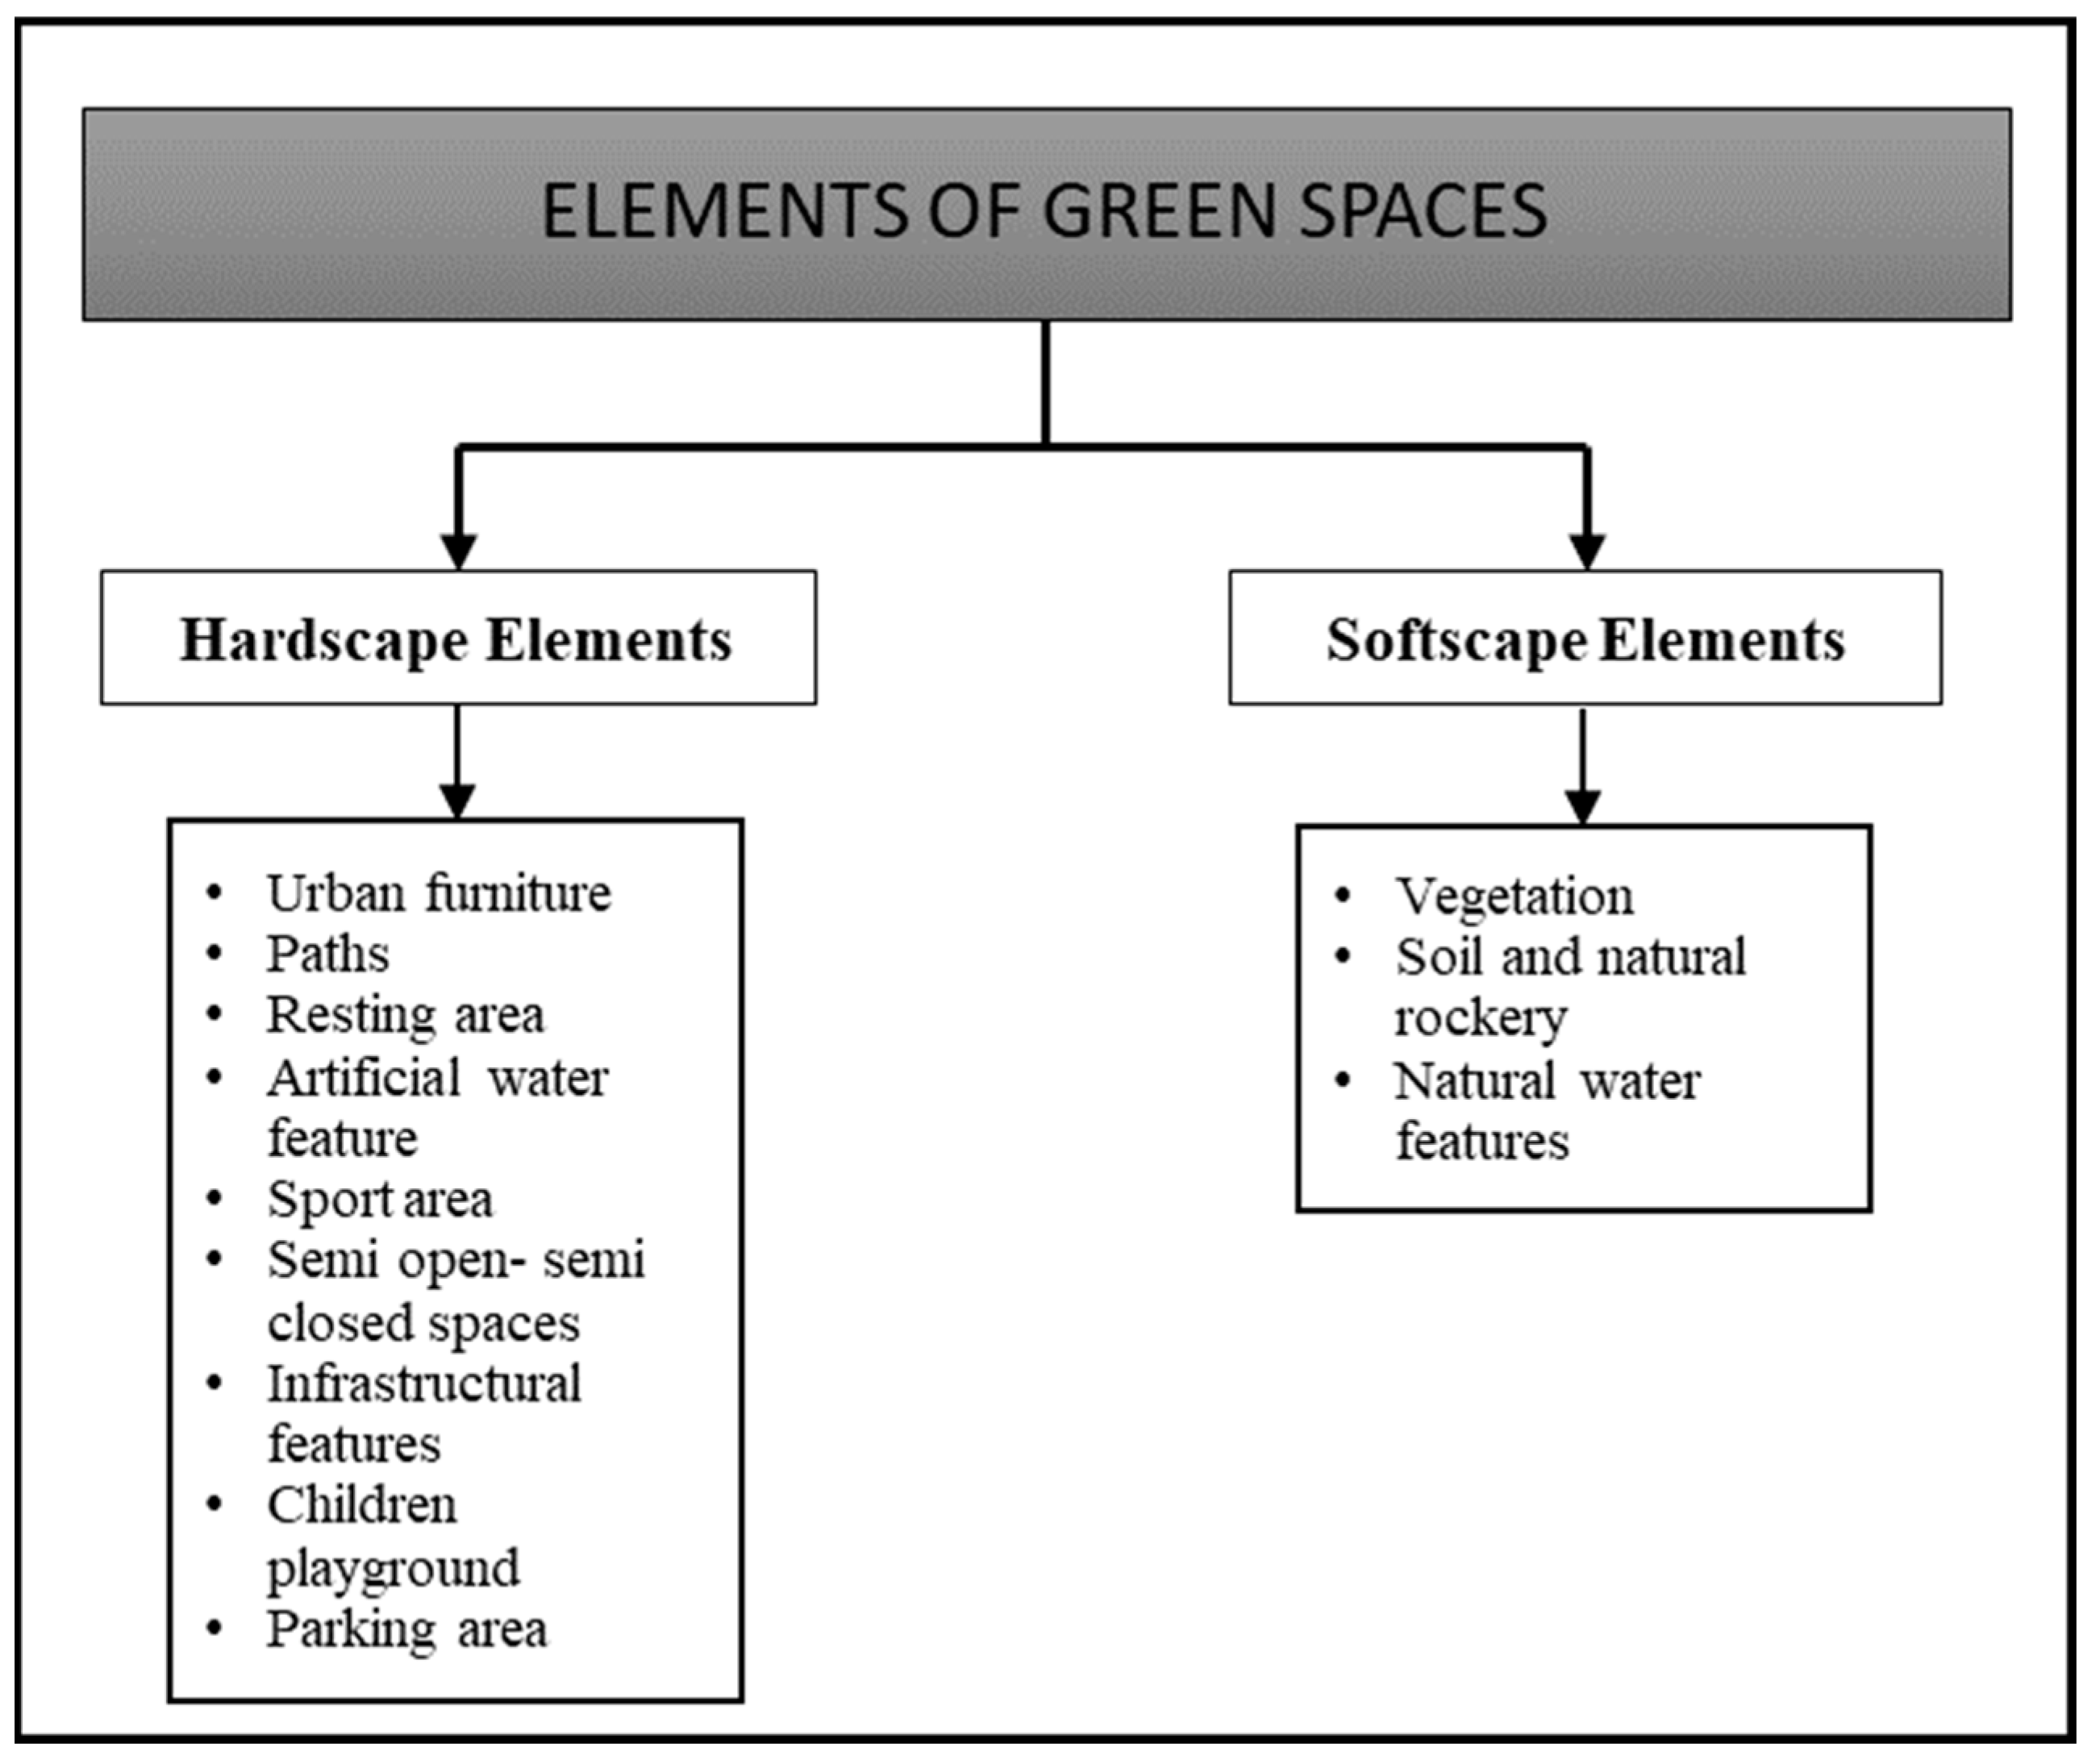
Figure 1. Elements of green spaces.
Sustainability 15 13880 g001
Figure 2. Conceptual model of the study.
Sustainability 15 13880 g002
Figure 3. Location of Cyprus Island in the Mediterranean Basin and location of Nicosia [1,69].
Sustainability 15 13880 g003
Figure 4. Location of Taşkınköy neighborhood (Nicosia Turkish Municipality, 2020) and photos of open green spaces in this neighborhood.
Sustainability 15 13880 g004
Figure 5. Location of Küçük Kaymaklı neighborhood (Nicosia Turkish Municipality, 2020) and photos of open green spaces in this neighborhood.
Sustainability 15 13880 g005
Figure 6. Location of Ortaköy neighborhood (Nicosia Turkish Municipality, 2020) and photos of open green spaces in this neighborhood.
Sustainability 15 13880 g006
Figure 7. Distribution of active and passive green areas in neighborhoods within the borders of Nicosia Municipality.
Sustainability 15 13880 g007
Figure 8. Active green spaces in neighborhoods within the borders of Nicosia Municipality.
Sustainability 15 13880 g008
Figure 9. Distances of active green areas within the borders of Northern Nicosia to buildings.
Sustainability 15 13880 g009
Figure 10. Buffer analysis of 300 m using active green and open spaces within neighborhoods.
Sustainability 15 13880 g010
Figure 11. Buffer analysis of 500 m using active green and open spaces within neighborhoods.
Sustainability 15 13880 g011
Table 1. Green space definitions [28].
Definition TypeDescriptionExample
Acknowledged rangeA definition that acknowledged the range of what can be considered ‘greenspace’“greenness describes the level of vegetation, ranging from sparsely landscaped streets to tree-lined walk-ways to play field sand forested parks”
Definition by examplesExamples were provided to illustrate what is meant by greenspace“combined areas of open land, cropland, urban open land, pasture, forest, and woody perennial”
Ecosystem servicesExamples that embody ecosystem services, such as urban agriculture, and/or a reference to serving human needs“a type of land use which has significant contributions to urban environments in terms of ecology, aesthetics or public health, and primarily serving human needs and uses”
Green areasA reference to ‘green’ and/or ‘natural’ areas without further explanation“the area investigated included substantial green elements”
Land usesGeneric land uses described as greenspace“recreational or undeveloped land”
Vegetated areasAreas that feature vegetation“green in the sense of being predominantly covered with vegetation”
Table 2. Summary of standards and guidance for travel distance to greenspace [37].
Study/StandardMaximum Distance to Travel to GreenspaceGreenspace Size and Type
London Boroughs (since 1976)1/4 mile (0.4 km)
3/4 mile (1.2 km)
small and local parks
district parks
Open Space Planning in London. London Planning Advisory Committee Direct line radius of approximately 280 m-
Six Acre Standard National Playing Fields Association (NPFA) 100 m (1 min walk)
400 m (5 min walk)
1000 m (15 min walk)
local areas for play
local equipped areas for play
neighborhood equipped areas for play
Natural Spaces in Urban Places 0.5 km
2 km
5 km
10 km
natural greenspace of at least 2 ha
natural greenspace of at least 20 ha
natural greenspace of at least 100 ha
natural greenspace of at least 500 ha
minimum 1 ha Local Nature Reserve (LNR) in every urban area per 1000 population
ANGST (Natural England’s Accessible Natural Greenspace Standard, every home should be
within 300 m of
2 km of
5 km of
10 km of
an accessible natural greenspace of at least 2 ha, plus
at least one accessible site of 20 ha
at least one accessible site of 100 ha
at least one accessible site of 500 ha
provision of at least 1 ha LNR per 1000 population
Natural environments—healthy environments? 3 km radius around the center of the neighborhood
London Plan. London’s Public Open Space Hierarchy 8 km
3.2 km
1.2 km
400 m
400 m
400 m
where feasible
regional (over 400 ha)
metropolitan (60–400 ha)
district (20–60 ha)
local parks (2–20 ha)
small local parks (0.4–2 ha)
pocket parks (less than 0.4 ha) linear open spaces (variable)
Space for People 500 m
4 km
accessible woodland of at least 2 ha
accessible woodland of at least 20 ha
Is green space in the living environment associated with people’s feelings of social safety? km or 3 km radius around homesmetropolitan
Table 3. Classification of the neighborhood green spaces based on different literature studies.
ClassificationDescription
Green spacesSmall green areas at the neighborhood scale can meet daily needs for contact with nature [40]
Neighborhood (local) parksNeighborhood parks can be classified as areas serving as social or recreational activity centers for the surrounding neighborhood [41]
PlaygroundsThey are functional open spaces in the urban fabric. Playgrounds, which form a part of open-green space systems in cities, can generally be used by children between the ages of 0 and 14 [42]
Sports areasSports fields, which form large openings and gaps, not only contribute to urban ecology but also have sociocultural value with the functions they create [42]
Residential compound gardensGreen land in residential compound areas. These private or semiprivate home gardens make up the majority of the cultural landscape [43]
Table 4. Measurement tools used for the research design depending on the UNGI.
MeasureTools
Per-capita open green spaceGreen space maps from the Town Planning Office and 2011 Census; neighborhood maps from the Municipality
Proximity to green spaceNeighborhood maps from the Municipality, GIS
Area percentagesNeighborhood maps from the Municipality, GIS
Types of green spacesGreen space maps from the Town Planning office and Municipality
Table 5. Green areas per capita calculated within the borders of Nicosia Municipality.
Green SpacesGreen Space Area (m2)
Total green spaces1,065,954.581 m2
Green space per capita17.367 m2
Total active green spaces205,819.081 m2
Active green space per capita3.353 m2
Total passive green spaces860,135.5 m2
The total population of the districts of Nicosia Municipality according to the 2011 Census is 61,378.
Table 6. Amount of active green areas per capita by districts within the borders of Nicosia Municipality.
Neighborhood NameOpen Green Space (m2)Population (2011)Active Green Space Per Capita (m2)
Abdi Çavuş05680
Akkavuk383.3187930.483
Arabahmet05610
Ayyildiz04890
Haydarpaşa01550
İbrahimpaşa05660
İplikpazari02290
Kafesli02330
Karamanzade18,568.42835152.9
Mahmutpaşa264.473140.842
Selimiye08780
Yenicami016630
Aydemet4470.47223141.932
Çağlayan29,334.598130722.444
Göçmenköy12,660.29230034.216
Hamitköy13,267.00153382.485
Haspolat1769.69542040.421
Kizilay10,992.81835353.110
Köşklüçiftlik15,455.25229395.259
Kumsal2045.89418551.103
Küçük Kaymakli45,466.38510,5724.301
Marmara6200.37330812.012
Ortaköy12,850.49988681.449
Taşkinköy19,471.74438475.062
Yenişehir12,617.84237153.396
Total Active Green Spaces205,819.081
Table 7. The percentage of active open green areas in the Nicosia region based on the types of green spaces.
Types of Green SpacesNumber of Open Green SpaceOpen Green Space (m2)Percentage of Open Green Space (%)
Green spaces1816,403.9507.97
Neighborhood parks27125,334.27160.90
Playgrounds436,949.14117.95
Residential mass housing gardens32416.4021.17
Sports areas124,715.31712.01
Total Active Green Spaces53205,819.081
Table 8. Amount and types of active green areas by neighborhoods within the borders of Nicosia Municipality.
Neighborhood NameOpen Green Space (m2)Types of Green Spaces
Neighborhood ParksPlaygroundsSports Area and PlaygroundsResidential Mass Housing GardensSports Areas
Abdi Çavuş0
Akkavuk383.3181
Arabahmet0
Ayyildiz0
Haydarpaşa0
İbrahimpaşa0
İplikpazari0
Kafesli0
Karamanzade18,568.428 1
Mahmutpaşa264.471
Selimiye0
Yenicami0
Aydemet4470.47251
Çağlayan29,334.598 1 1
Göçmenköy12,660.29242 1
Hamitköy13,267.001141
Haspolat1769.69511
Kizilay10,992.81812
Köşklüçiftlik15,455.252 2
Kumsal2045.894 2
Küçük Kaymakli45,466.385242
Marmara6200.373 1
Ortaköy12,850.499 41
Taşkinköy19,471.7441111
Yenişehir12,617.84212
Total Active Green Spaces205,819.081
Table 9. Findings of quantitative components for North Nicosia and its selected neighborhood.
Findings of Quantitative Characteristics
ParametersNorth NicosiaTaşkınköy NeighborhoodOrtaköy NeighborhoodKüçük Kaymaklı Neighborhood
1. Per-capita green space3.353 m25.062 m21.449 m24.301 m2
2. Proximity to green space (m)337 m
3. Area percentages92.8 km25.87 km24.07 km24.94 km2
205,819.081 m219,471.744 m212,850.499 m245,466.385 m2
total1.148%total2.88%total2.76%total3.43%
active0.22%active0.33%active0.03%active0.9%
4. Types of green space
Green spaces181-2
Playgrounds or parks27-43
Sports area and playgrounds4112
Residential compound gardens31--
Sports areas1--1
Disclaimer/Publisher’s Note: The statements, opinions and data contained in all publications are solely those of the individual author(s) and contributor(s) and not of MDPI and/or the editor(s). MDPI and/or the editor(s) disclaim responsibility for any injury to people or property resulting from any ideas, methods, instructions or products referred to in the content.