
Exploring the Walkability of Senior Citizens in a Densely Populated Neighborhood of Chennai, India—A Structural Equation Modeling Approach


Abstract
:1. Introduction
2. Literature Review
2.1. Walkability and Senior Citizens
2.2. Destination Accessibility
2.3. Level of Safety
2.4. Comfort Conditions
2.5. Aesthetic Environment
3. Methodology
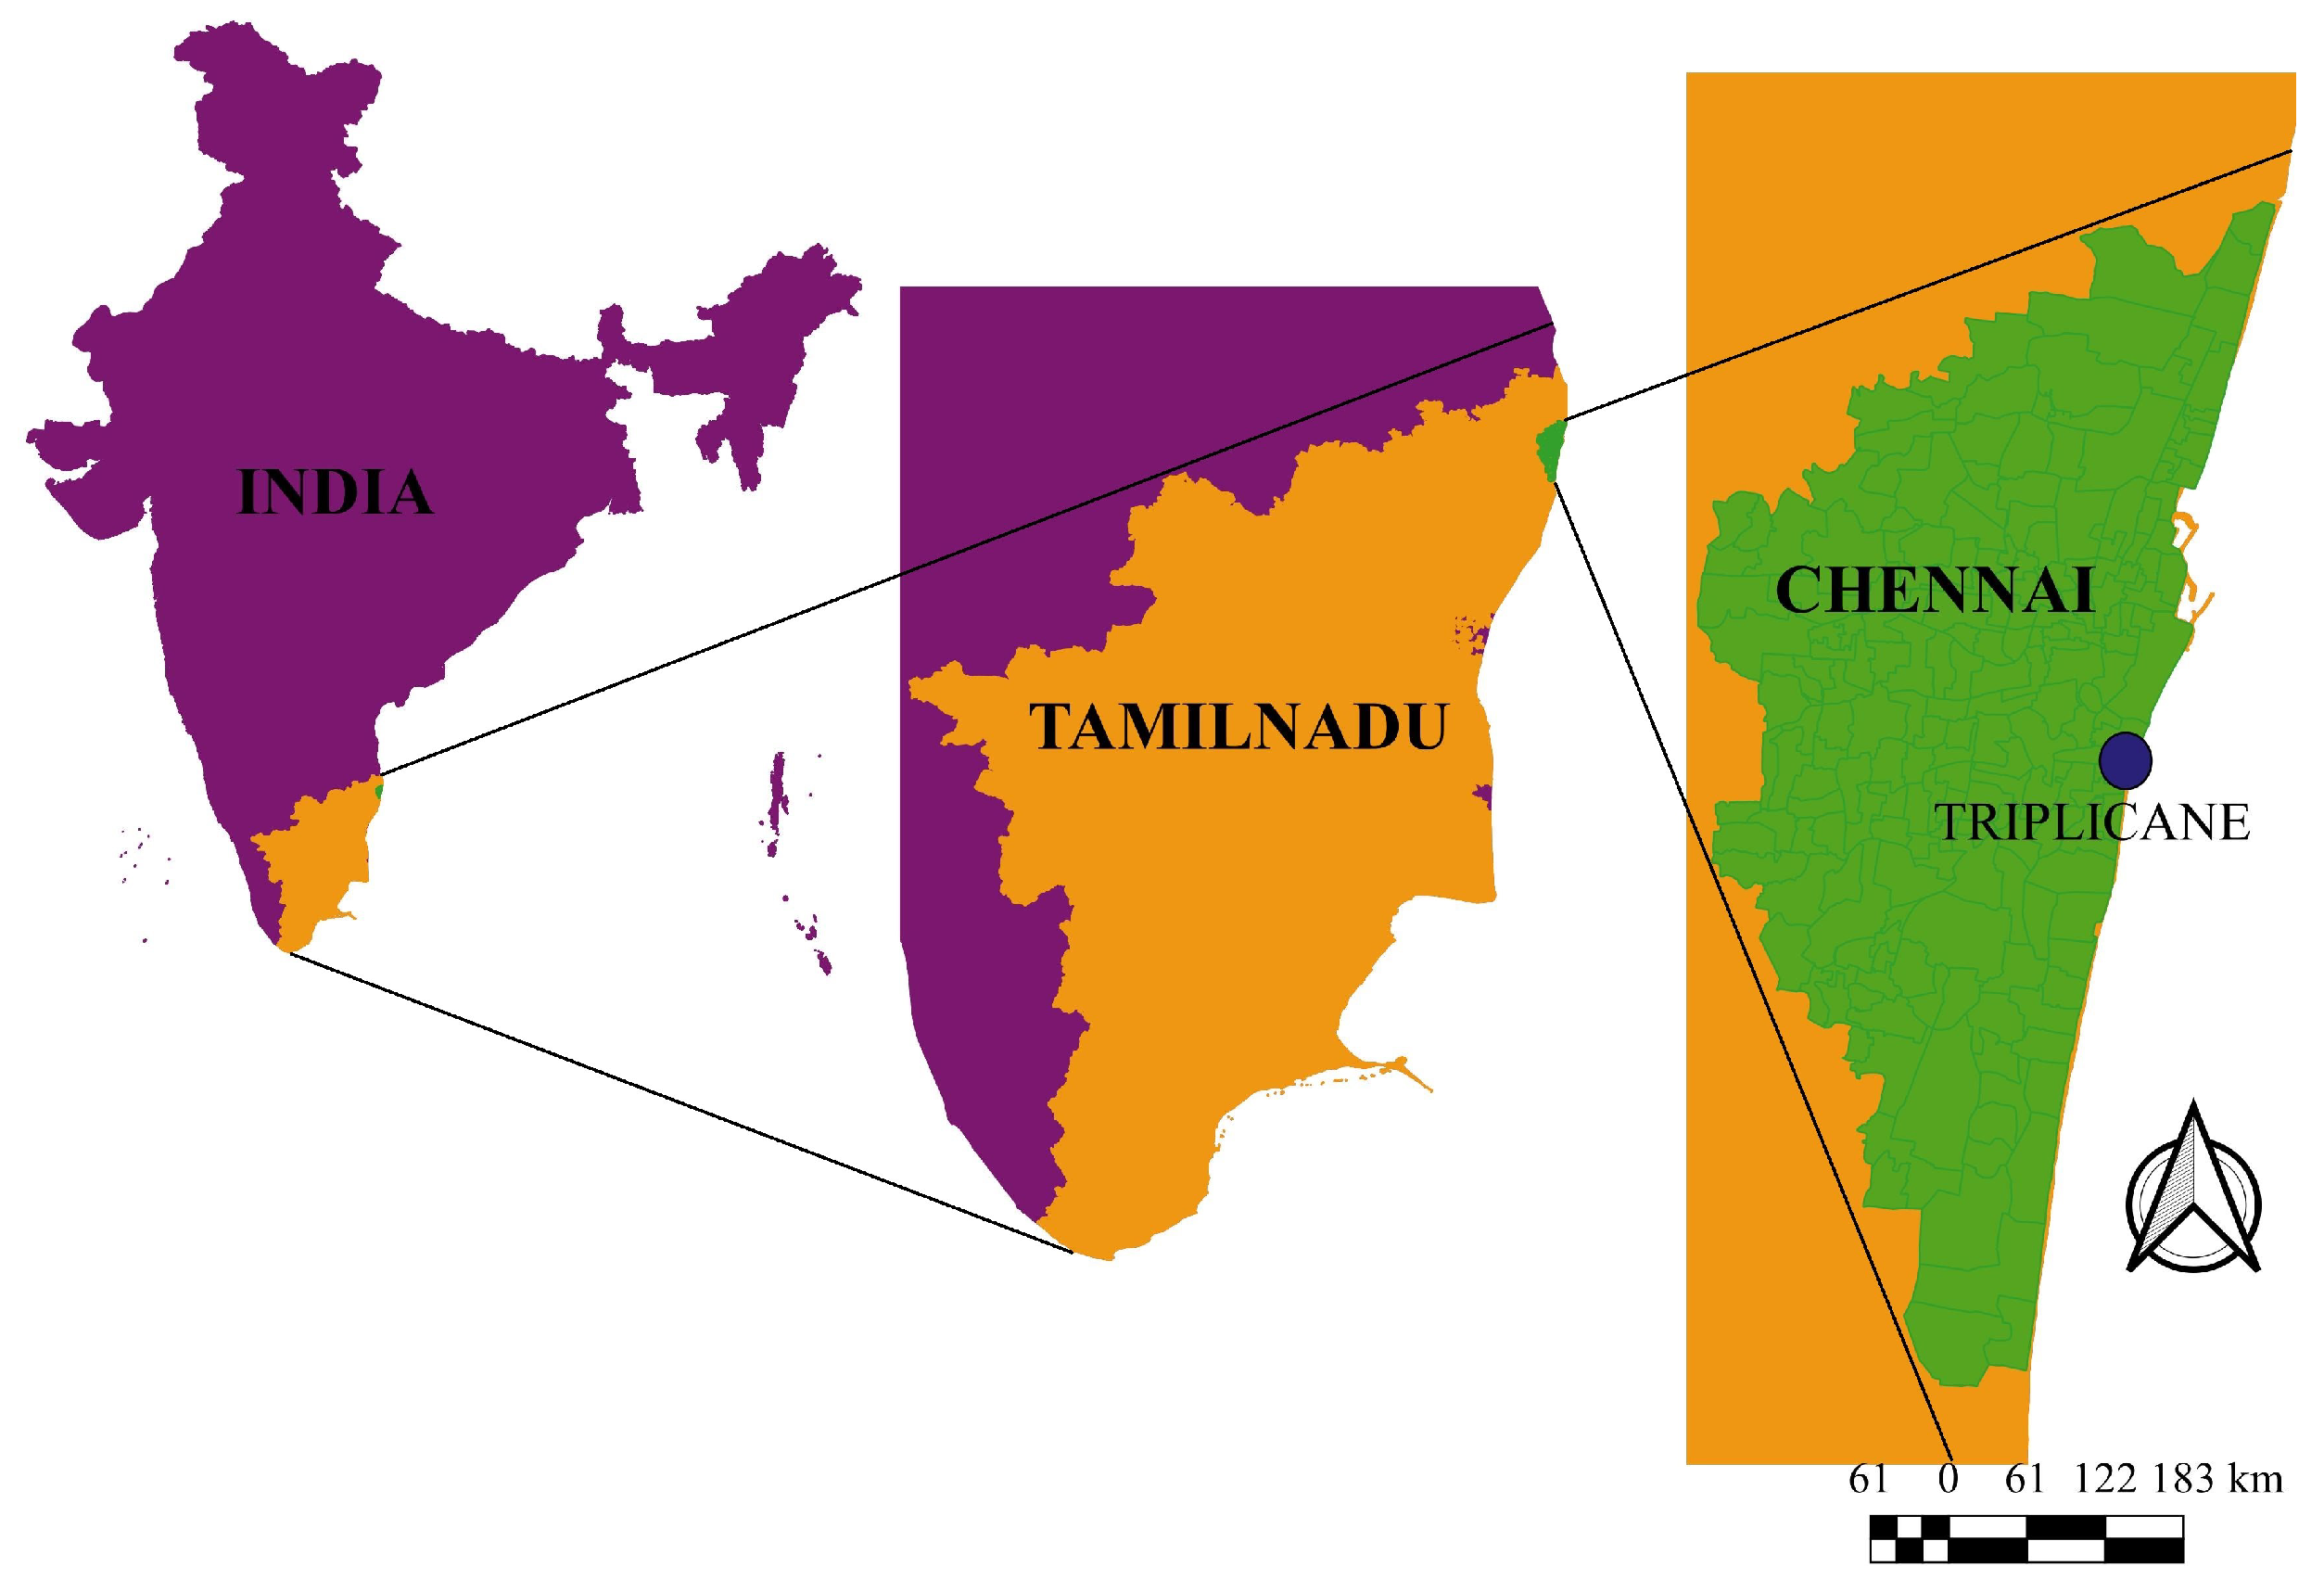
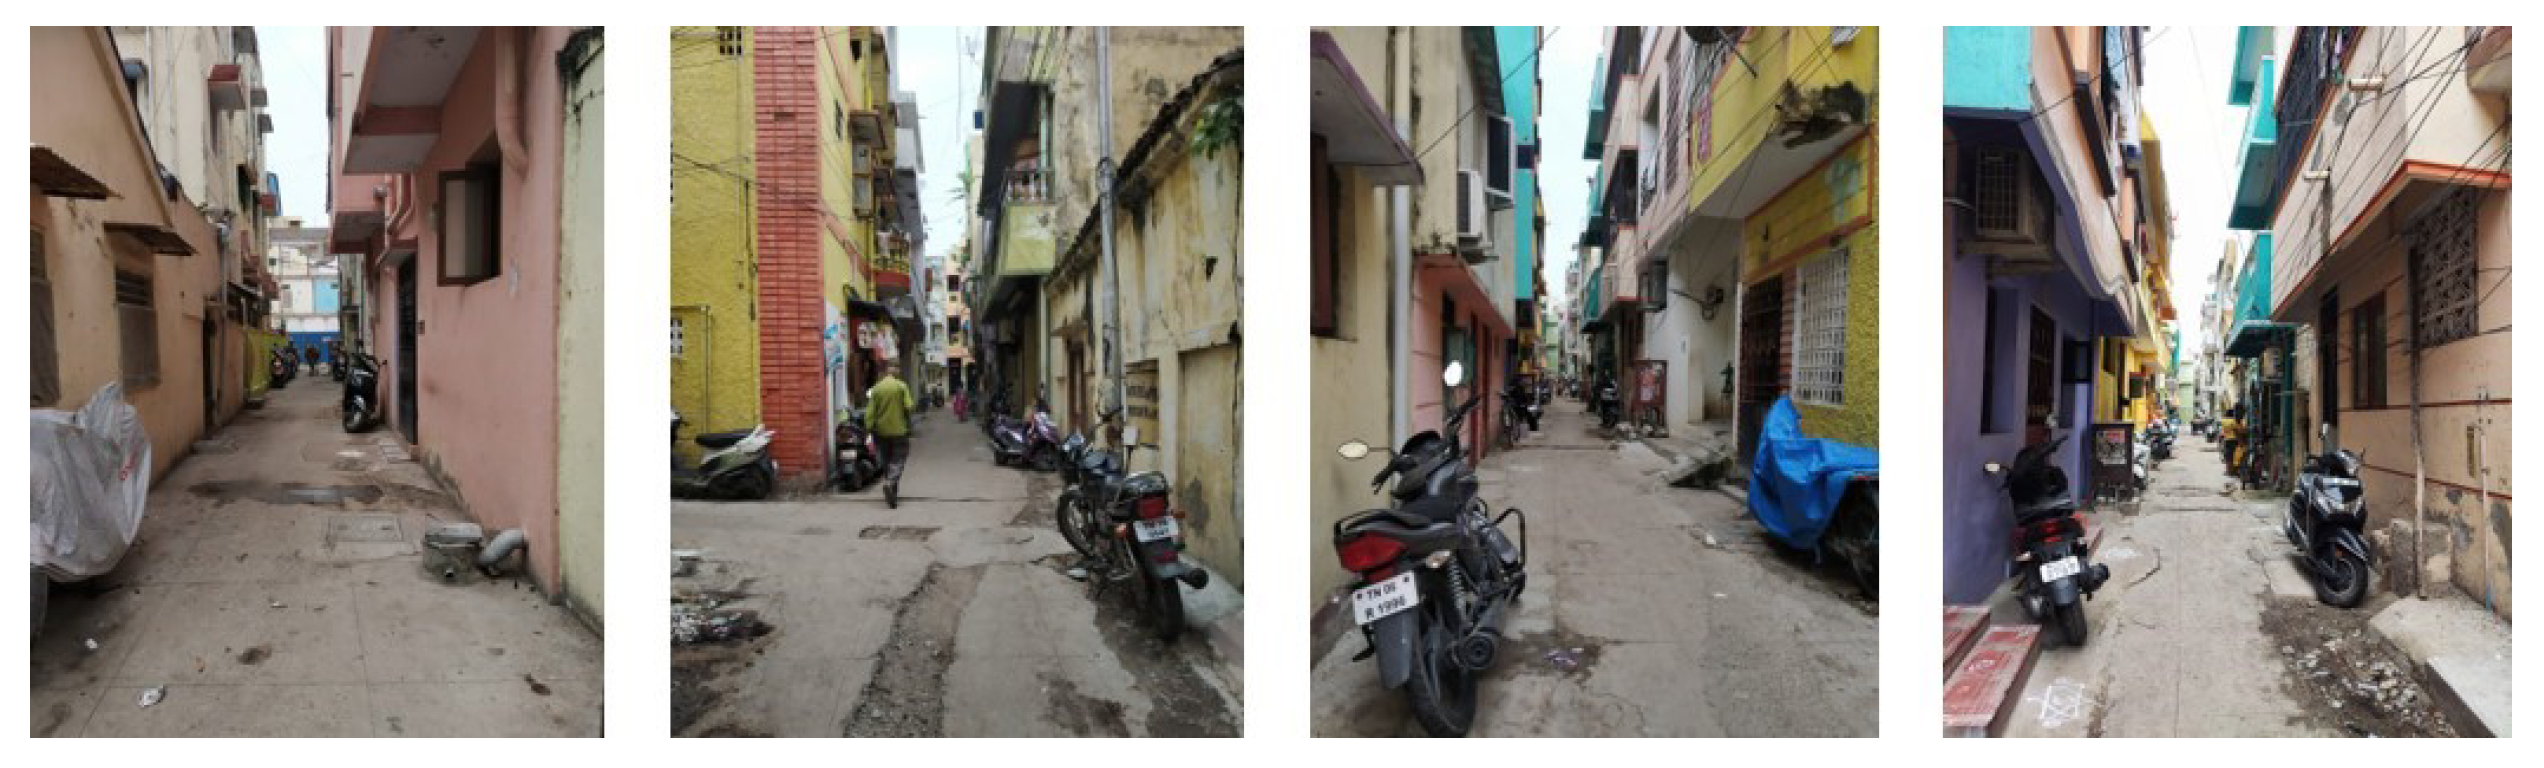
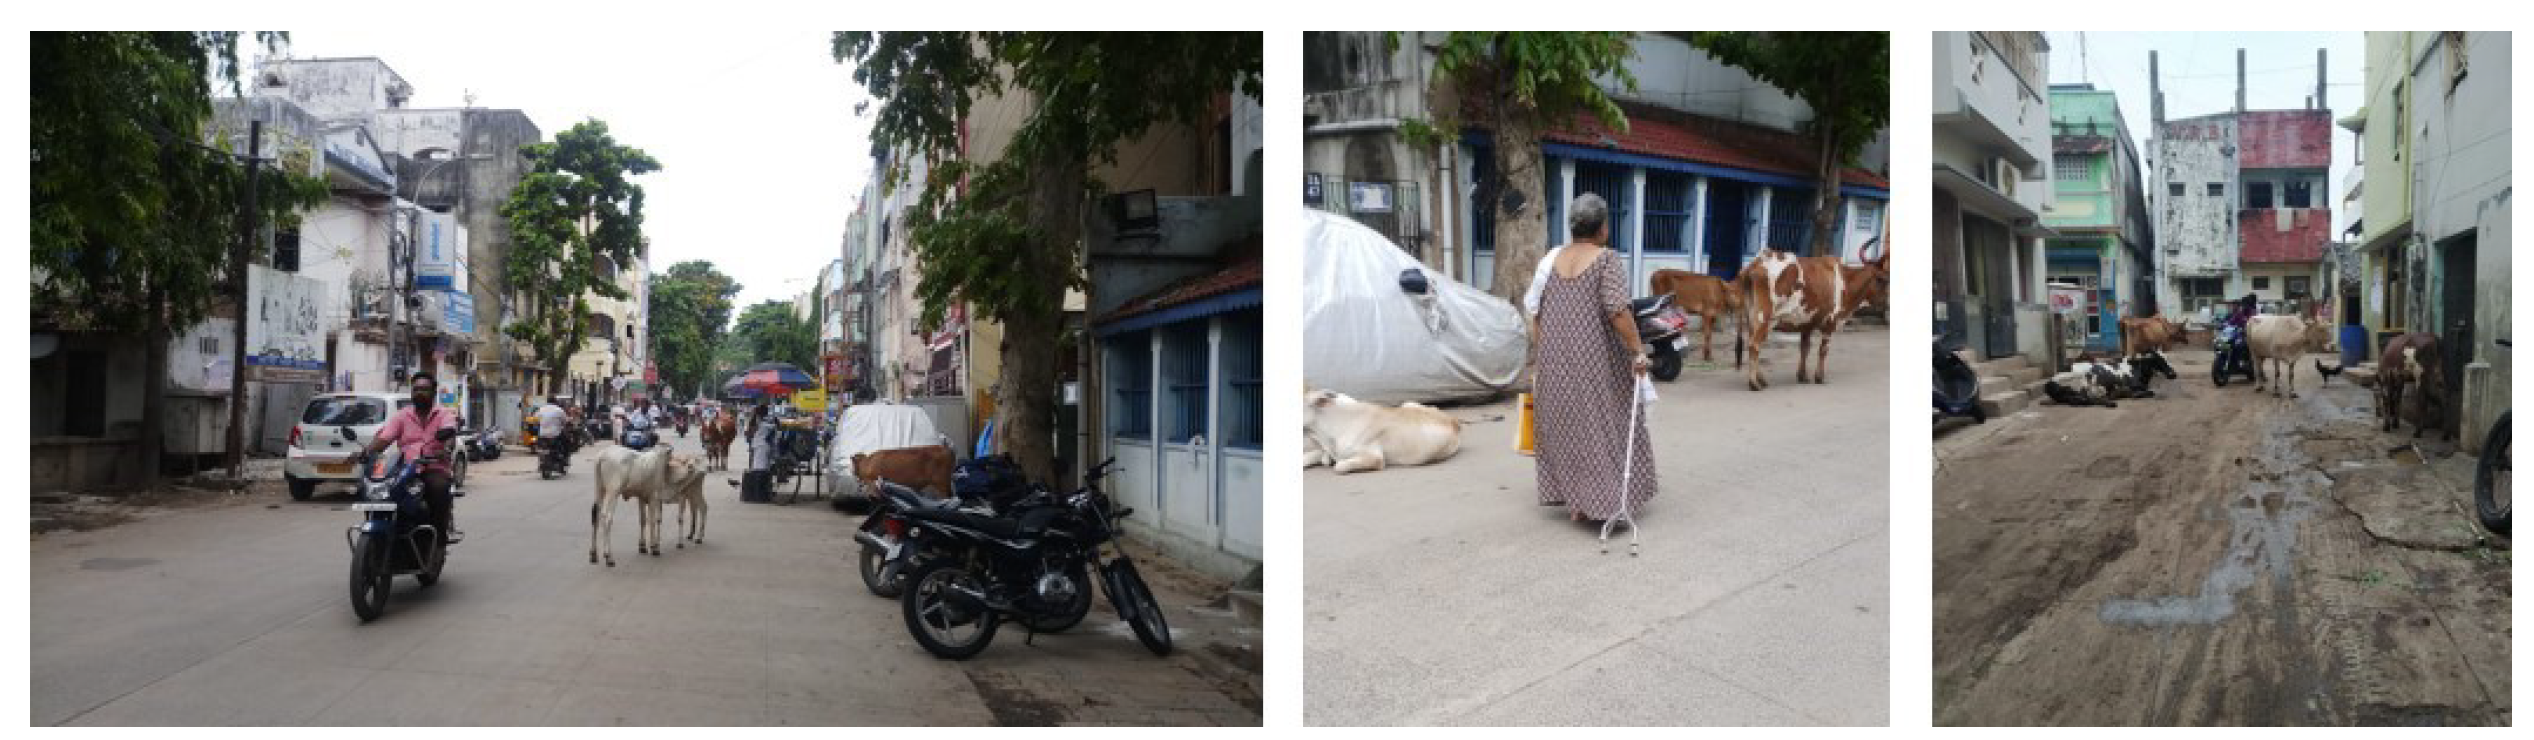
3.1. Study Area
3.2. Study Design and Respondents
3.3. Analytical Strategy
4. Results
4.1. Descriptive Statistics
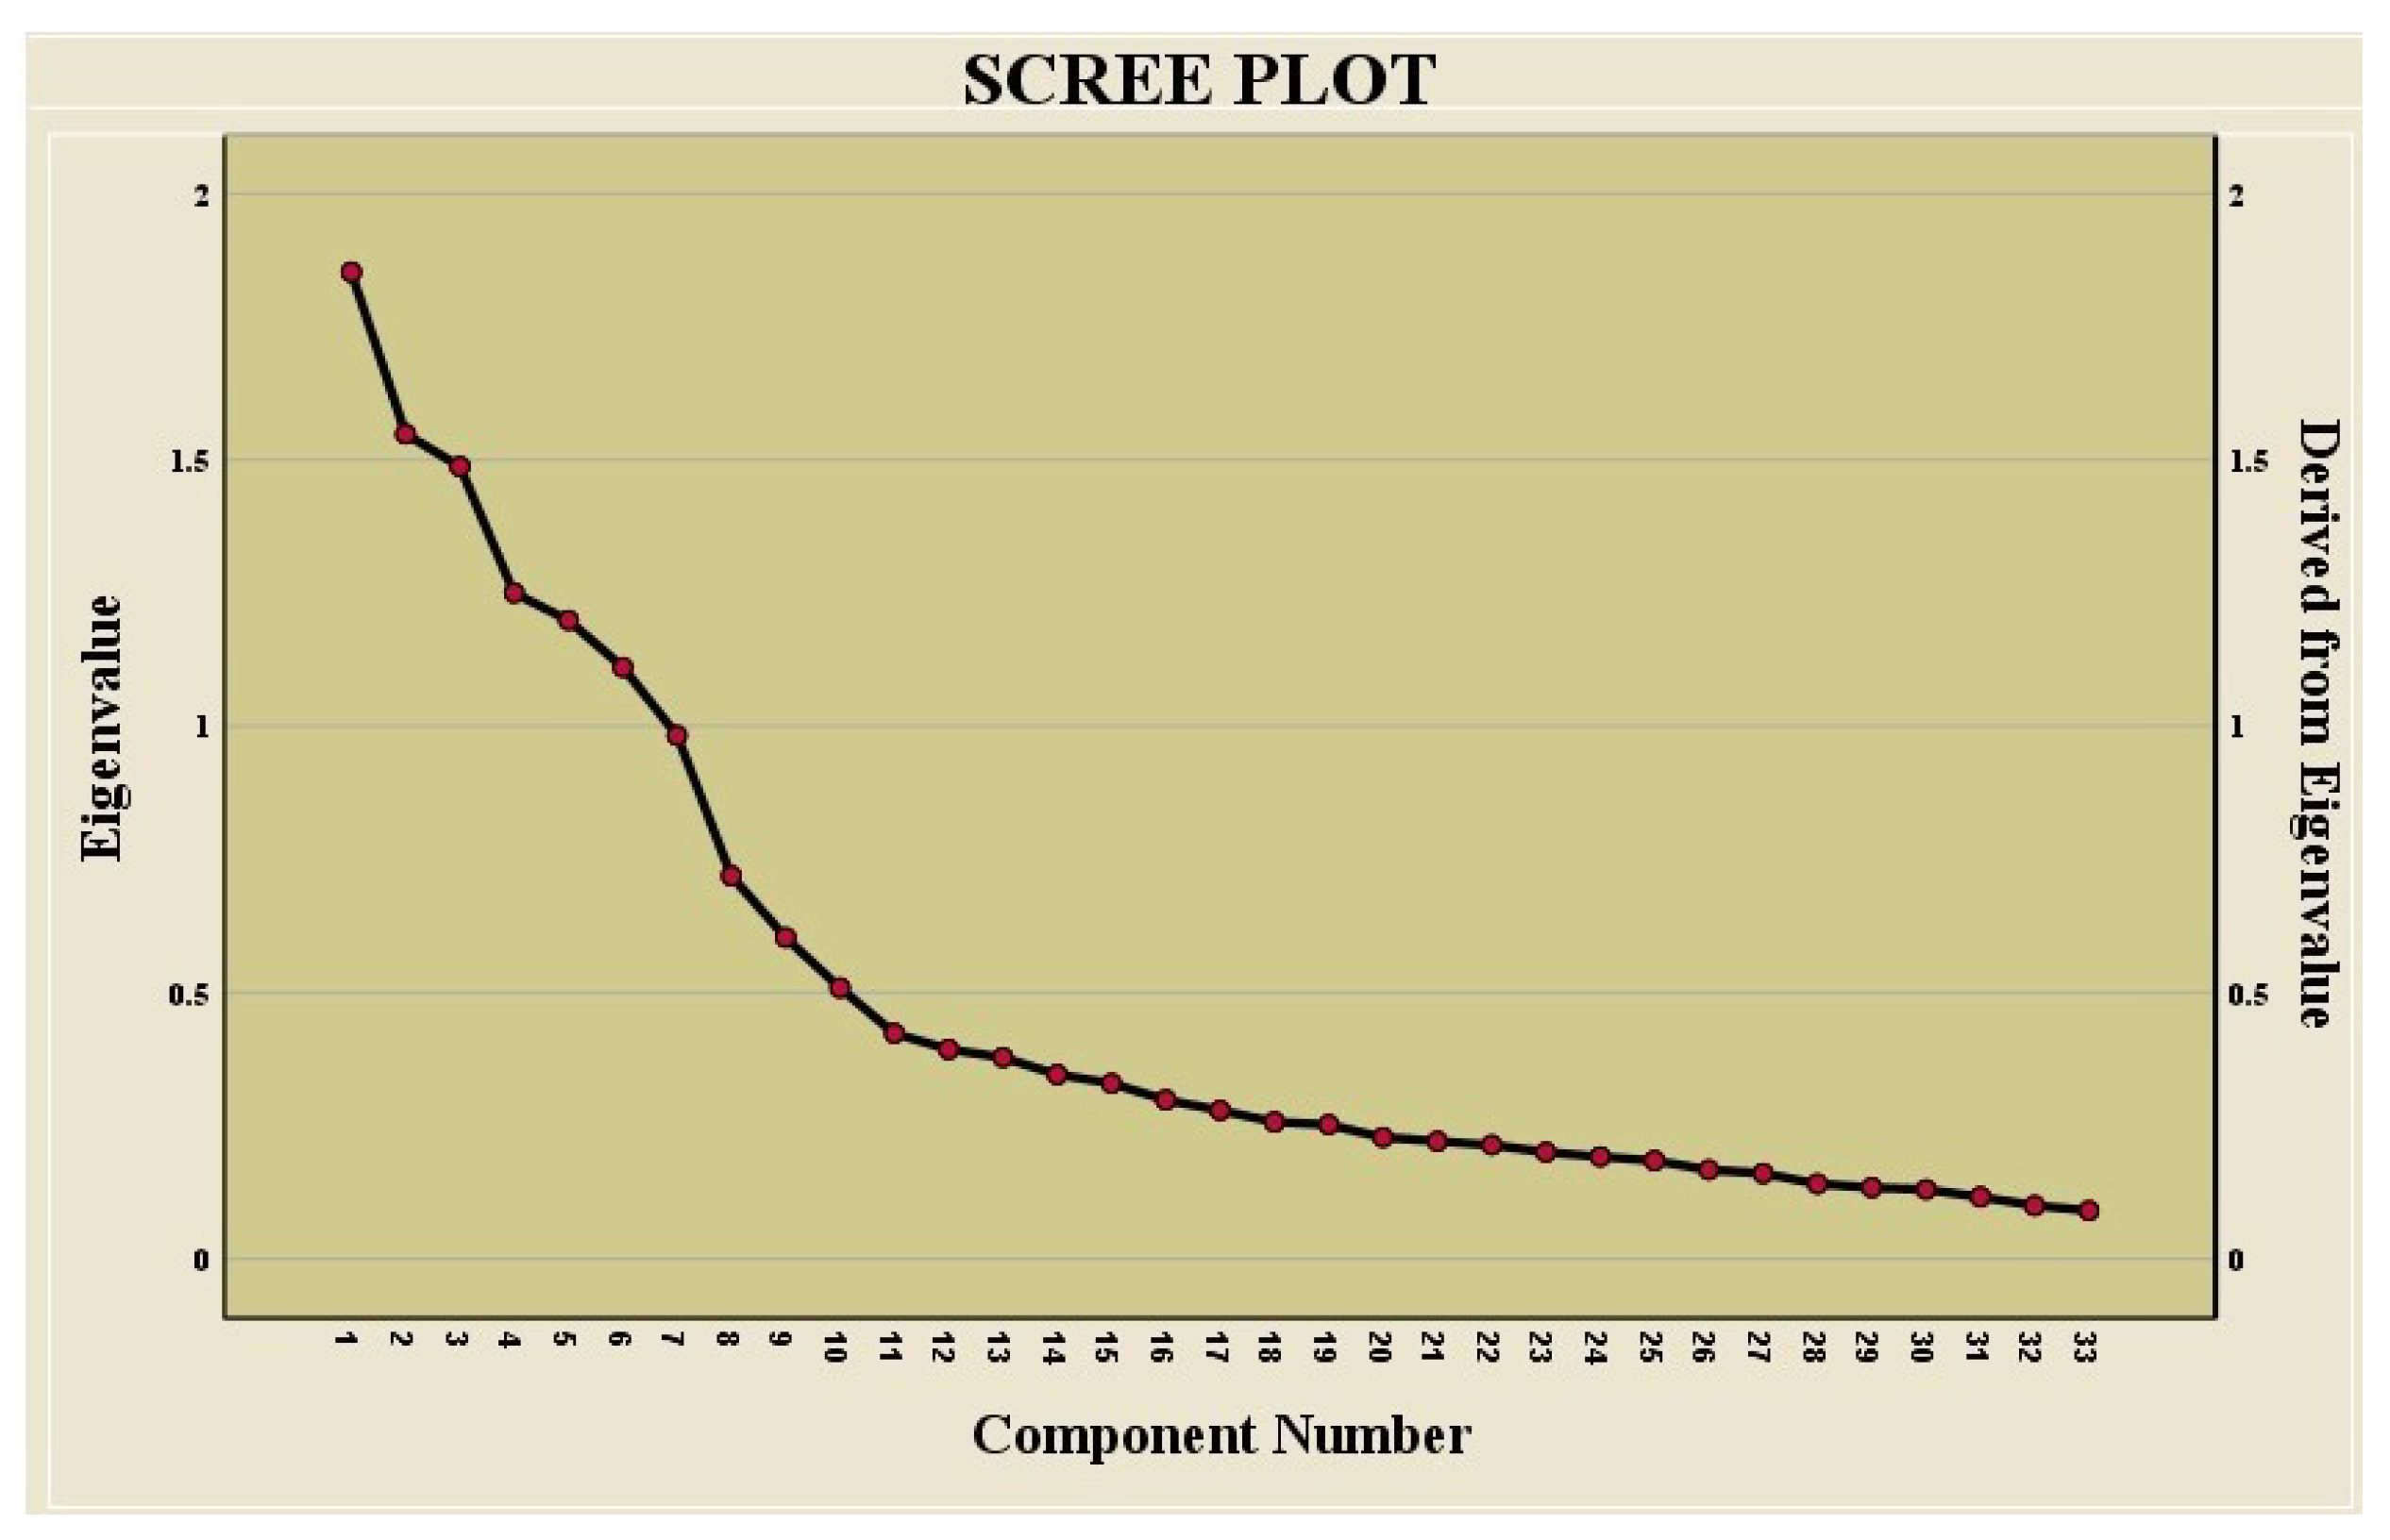
4.2. Exploratory Factor Analysis
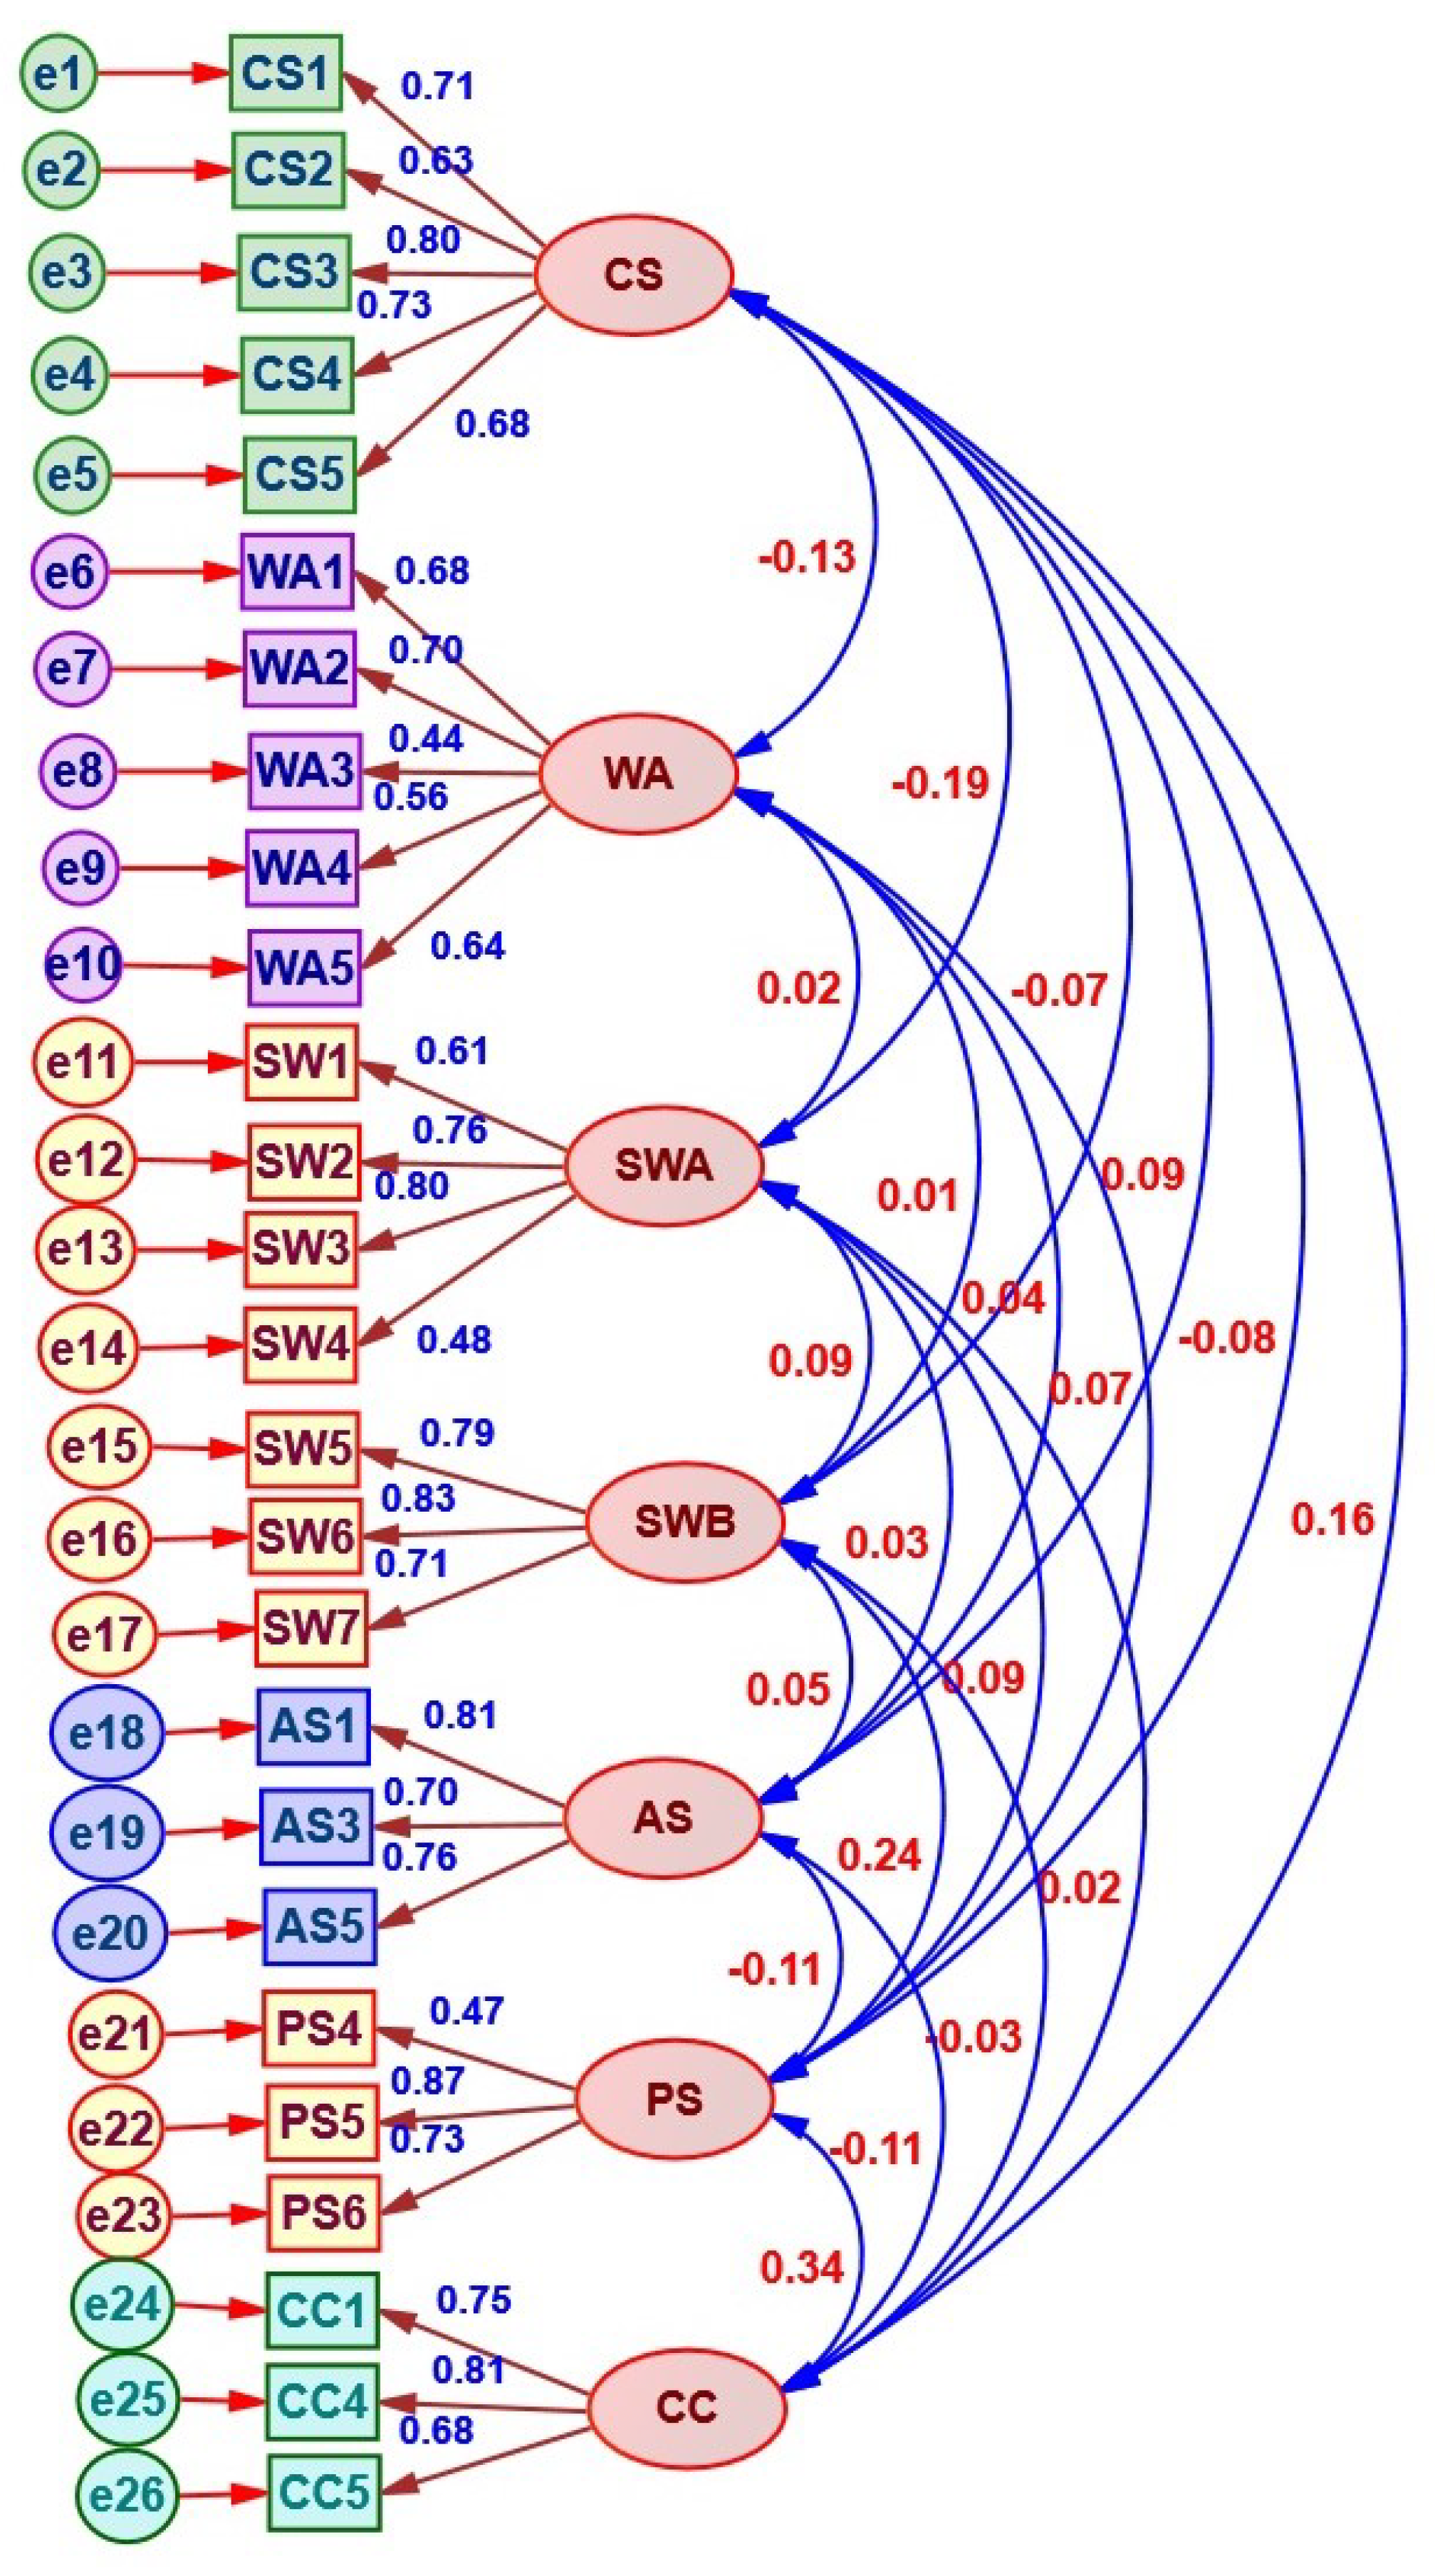
4.3. Confirmatory Factor Analysis (CFA) and the Measurement Model
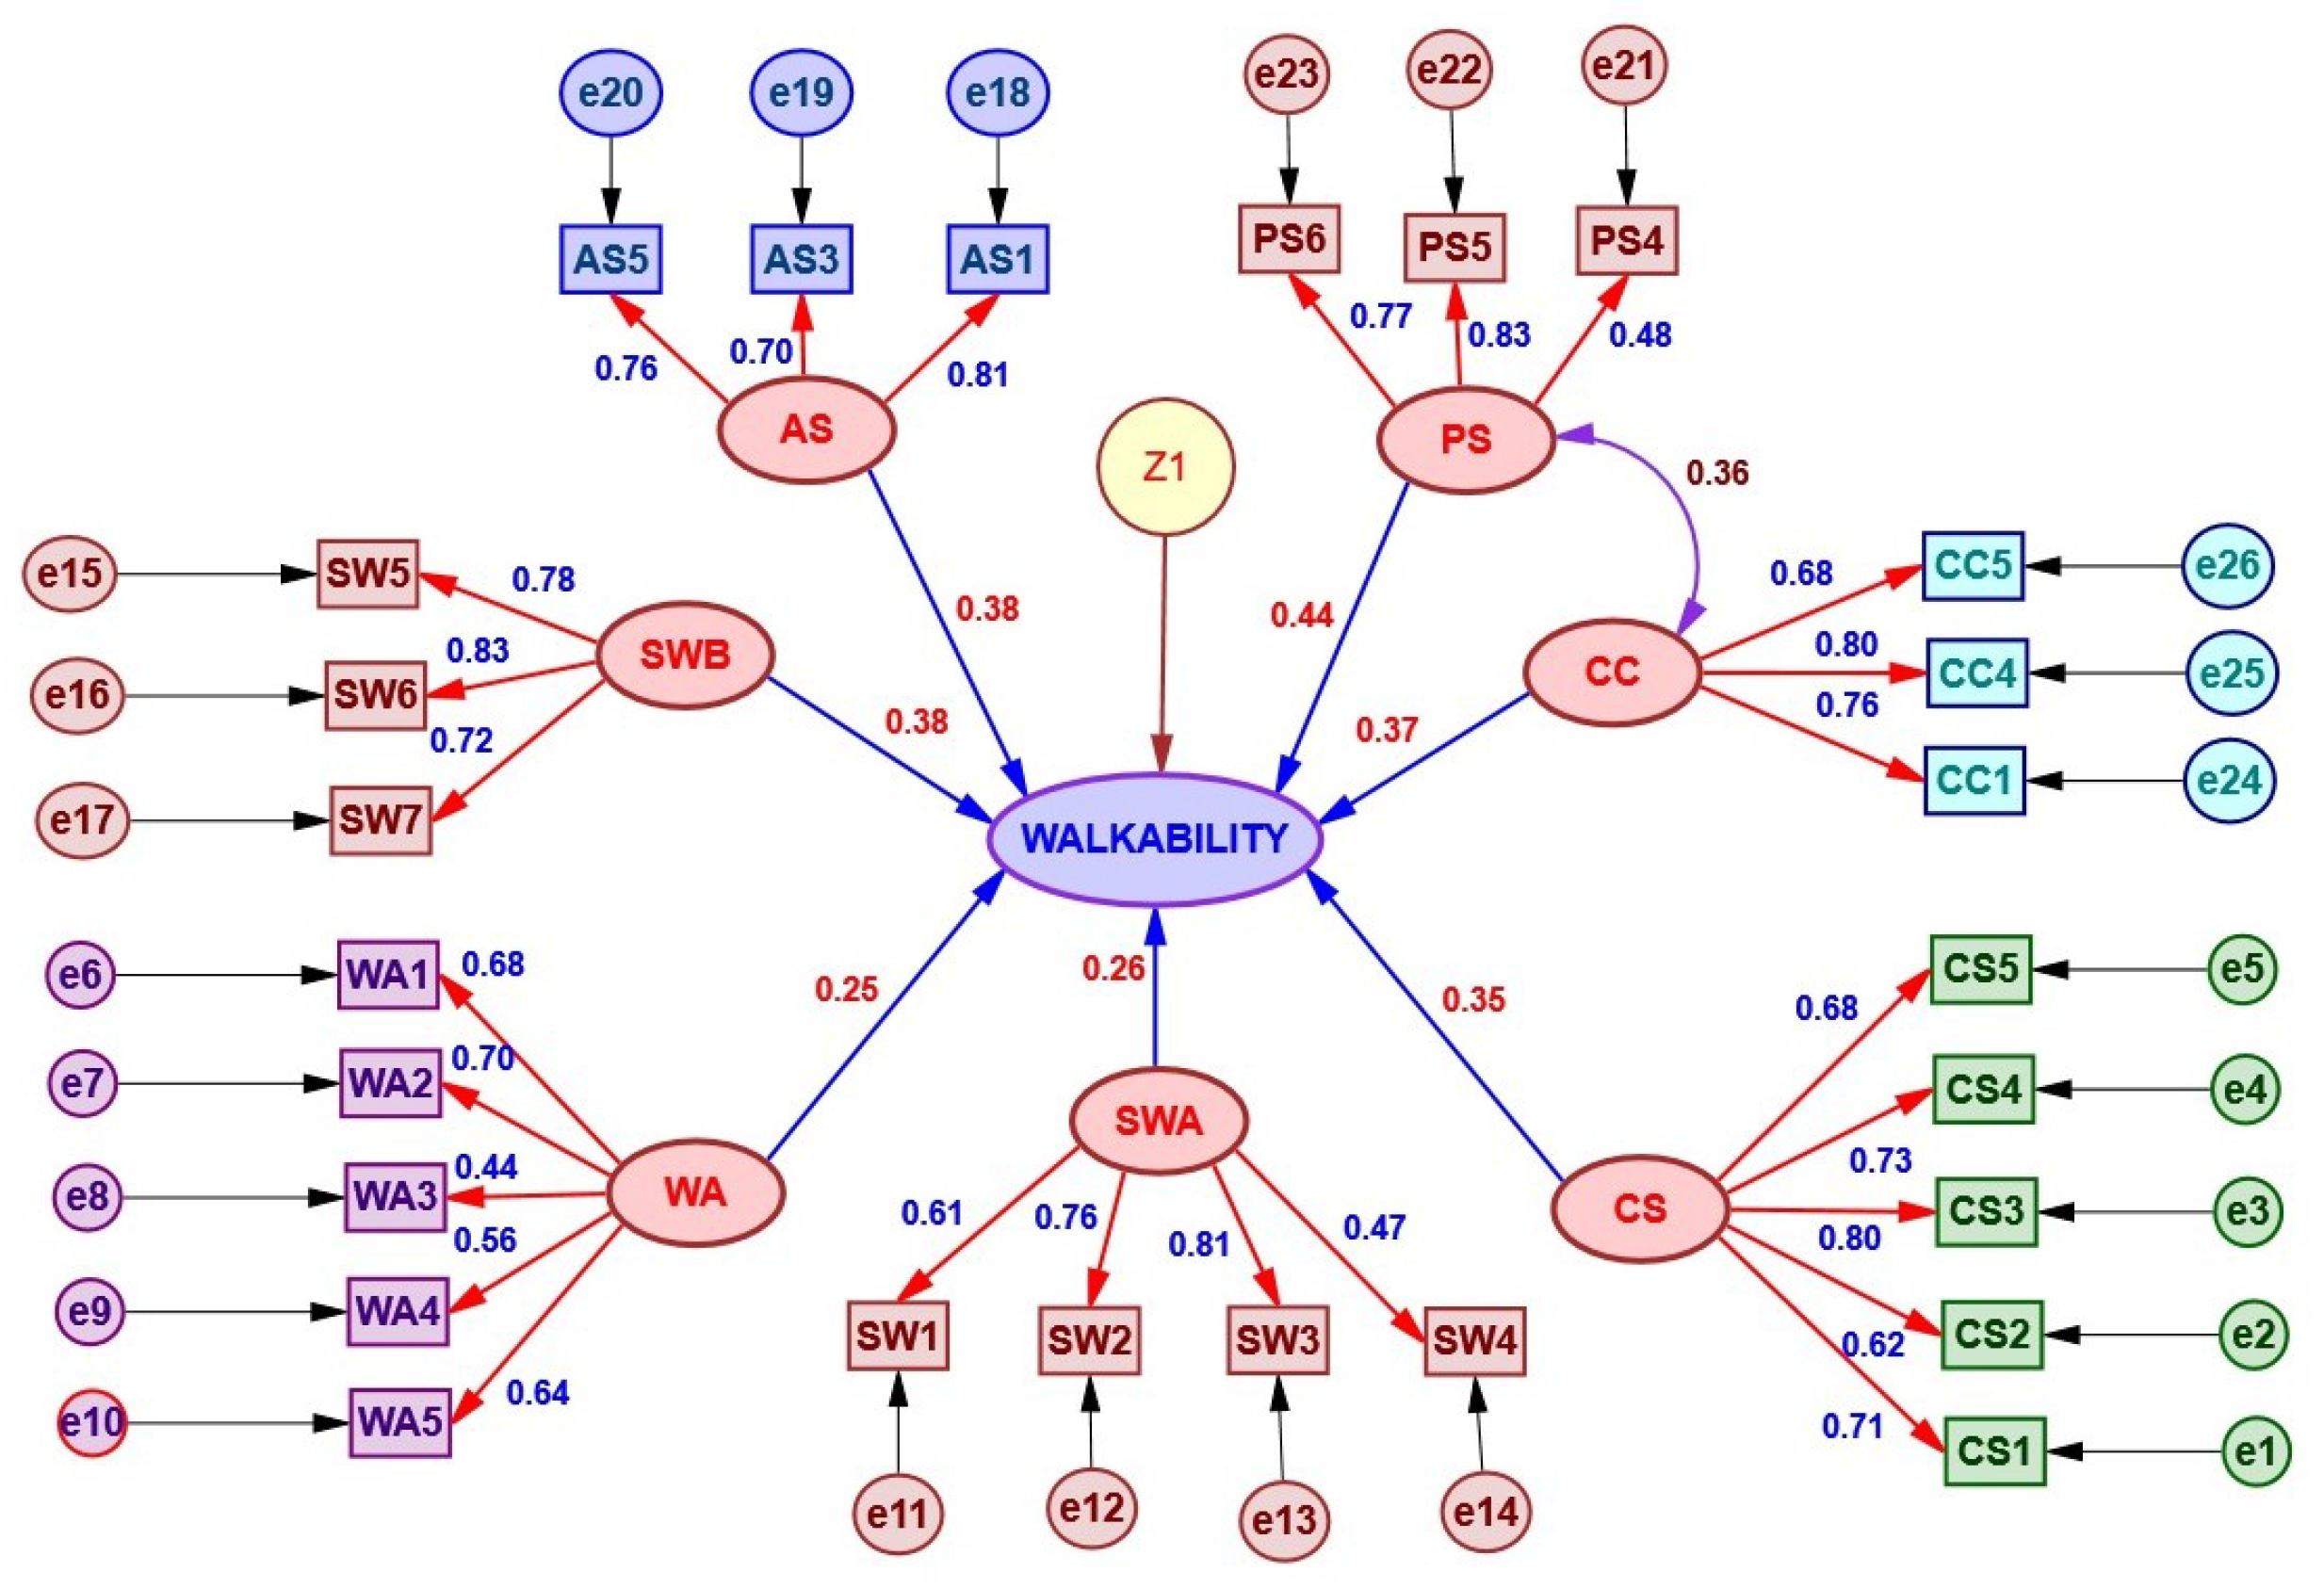
4.4. The Structural Model
5. Discussion
6. Conclusions
Author Contributions
Funding
Institutional Review Board Statement
Informed Consent Statement
Data Availability Statement
Conflicts of Interest
References
- He, W.; Goodkind, D.; Kowal, P.R. An Aging World: 2015; United States Census Bureau: Suitland, MD, USA, 2016. [Google Scholar]
- Yuen, B. Ageing and the Built Environment in Singapore; Springer: Cham, Switzerland, 2019. [Google Scholar]
- Lawton, M.P.; Nahemow, L. Ecology and the Aging Process; American Psychological Association: Washington, DC, USA, 1973. [Google Scholar]
- Iwarsson, S.; Horstmann, V.; Carlsson, G.; Oswald, F.; Wahl, H.W. Person–environment fit predicts falls in older adults better than the consideration of environmental hazards only. Clin. Rehabil. 2009, 23, 558–567. [Google Scholar] [CrossRef]
- Chaudhury, H.; Campo, M.; Michael, Y.; Mahmood, A. Neighbourhood environment and physical activity in older adults. Soc. Sci. Med. 2016, 149, 104–113. [Google Scholar] [CrossRef]
- Nelson, M.E.; Rejeski, W.J.; Blair, S.N.; Duncan, P.W.; Judge, J.O.; King, A.C.; Macera, C.A.; Castaneda-Sceppa, C. Physical activity and public health in older adults: Recommendation from the American College of Sports Medicine and the American Heart Association. Circulation 2007, 116, 1094. [Google Scholar] [CrossRef]
- Lee, I.M.; Buchner, D.M. The importance of walking to public health. Med. Sci. Sport. Exerc. 2008, 40, S512–S518. [Google Scholar] [CrossRef]
- Siegel, P.Z.; Brackbill, R.M.; Heath, G.W. The epidemiology of walking for exercise: Implications for promoting activity among sedentary groups. Am. J. Public Health 1995, 85, 706–710. [Google Scholar] [CrossRef]
- Jelle, V.; Peter, C.; Ilse, D.; Veerle, V.; Dominique, V.; Nico, D.; Liesbeth, D.; Tine, B.; Sarah, D.; Benedicte, D. Physical environmental factors related to walking and cycling in older adults: The Belgian aging studies. BMC Public Health 2012, 12, 142. [Google Scholar] [CrossRef]
- Katila, P.; Colfer, C.J.P.; De Jong, W.; Galloway, G.; Pacheco, P.; Winkel, G. Sustainable Development Goals; Cambridge University Press: Cambridge, UK, 2019. [Google Scholar]
- World Health Organization. Global Recommendations on Physical Activity for Health; World Health Organization: Geneva, Switzerland, 2010. [Google Scholar]
- Alessio, H.M.; Bassett, D.R.; Bopp, M.J.; Parr, B.B.; Patch, G.S.; Rankin, J.W.; Rojas-Rueda, D.; Roti, M.W.; Wojcik, J.R. Climate change, air pollution, and physical inactivity: Is active transportation part of the solution? Med. Sci. Sport. Exerc. 2021, 53, 1170–1178. [Google Scholar] [CrossRef]
- Saint-Maurice, P.F.; Troiano, R.P.; Bassett, D.R.; Graubard, B.I.; Carlson, S.A.; Shiroma, E.J.; Fulton, J.E.; Matthews, C.E. Association of daily step count and step intensity with mortality among US adults. JAMA 2020, 323, 1151–1160. [Google Scholar] [CrossRef]
- Asiamah, N.; Awuviry-Newton, K.; Nesser, W.; Alvarez, E.N. Carbon Footprints of Active and Non-Active Transport Modes: Hierarchy and Intergenerational Narrative Analyses. Sustainability 2023, 15, 12795. [Google Scholar] [CrossRef]
- Baobeid, A.; Koç, M.; Al-Ghamdi, S.G. Walkability and its relationships with health, sustainability, and livability: Elements of physical environment and evaluation frameworks. Front. Built Environ. 2021, 7, 721218. [Google Scholar] [CrossRef]
- Speck, J. Walkable City: How Downtown Can Save America, One Step at a Time; North Point Press: New York, NY, USA, 2012; Volume 334. [Google Scholar] [CrossRef]
- Mohanty, R.N.; Chani, P.S. Assessment of pedestrians’ travel experience at the religious city of Puri using structural equation modelling. J. Urban Des. 2020, 25, 486–504. [Google Scholar] [CrossRef]
- Liu, S.; Higgs, C.; Arundel, J.; Boeing, G.; Cerdera, N.; Moctezuma, D.; Cerin, E.; Adlakha, D.; Lowe, M.; Giles-Corti, B. A generalized framework for measuring pedestrian accessibility around the world using open data. Geogr. Anal. 2022, 54, 559–582. [Google Scholar] [CrossRef]
- Bivina, G.R.; Parida, M. Modelling perceived pedestrian level of service of sidewalks: A structural equation approach. Transport 2019, 34, 339–350. [Google Scholar] [CrossRef]
- Das, S.; Islam, M. Hindu pilgrimage in India and walkability: Theory and praxis. In The Routledge International Handbook of Walking; Routledge: Abingdon, UK, 2017; pp. 242–250. [Google Scholar]
- Patil, D.R. Mobility of Senior Citizens in Urban Public Spaces of Residential Neighborhoods, A Case Study of Bangalore. Ph.D. Thesis, BMS College of Engineering, Bangalore, India, 2019. [Google Scholar]
- Adlakha, D.; Krishna, M.; Woolrych, R.; Ellis, G. Neighbourhood supports for active ageing in urban India. Psychol. Dev. Soc. 2020, 32, 254–277. [Google Scholar] [CrossRef]
- Forsyth, A. What is a walkable place? The walkability debate in urban design. Urban Des. Int. 2015, 20, 274–292. [Google Scholar] [CrossRef]
- Southworth, M. Designing the walkable city. J. Urban Plan. Dev. 2005, 131, 246–257. [Google Scholar] [CrossRef]
- Cao, Y.; Wu, H.; Wang, H.; Qu, Y.; Zeng, Y.; Mu, X. How Do Block Built Environments Affect Daily Leisure Walking among the Elderly? A Empirical Study of Gaoyou, China. Sustainability 2022, 15, 257. [Google Scholar] [CrossRef]
- Xue, Q.L.; Fried, L.P.; Glass, T.A.; Laffan, A.; Chaves, P.H. Life-space constriction, development of frailty, and the competing risk of mortality: The Women’s Health And Aging Study I. Am. J. Epidemiol. 2008, 167, 240–248. [Google Scholar] [CrossRef] [PubMed]
- Langhammer, B.; Bergland, A.; Rydwik, E. The importance of physical activity exercise among older people. Biomed. Res. Int. 2018, 2018, 7856823. [Google Scholar] [CrossRef] [PubMed]
- Murtagh, E.M.; Nichols, L.; Mohammed, M.A.; Holder, R.; Nevill, A.M.; Murphy, M.H. The effect of walking on risk factors for cardiovascular disease: An updated systematic review and meta-analysis of randomised control trials. Prev. Med. 2015, 72, 34–43. [Google Scholar] [CrossRef]
- Reiner, M.; Niermann, C.; Jekauc, D.; Woll, A. Long-term health benefits of physical activity–a systematic review of longitudinal studies. BMC Public Health 2013, 13, 813. [Google Scholar] [CrossRef]
- Wang, M.L.; Narcisse, M.R.; McElfish, P.A. Higher walkability associated with increased physical activity and reduced obesity among United States adults. Obesity 2023, 31, 553–564. [Google Scholar] [CrossRef] [PubMed]
- Cerin, E.; Nathan, A.; Van Cauwenberg, J.; Barnett, D.W.; Barnett, A. The neighbourhood physical environment and active travel in older adults: A systematic review and meta-analysis. Int. J. Behav. Nutr. Phys. Act. 2017, 14, 15. [Google Scholar] [CrossRef] [PubMed]
- Hanibuchi, T.; Kawachi, I.; Nakaya, T.; Hirai, H.; Kondo, K. Neighborhood built environment and physical activity of Japanese older adults: Results from the Aichi Gerontological Evaluation Study (AGES). BMC Public Health 2011, 11, 657. [Google Scholar] [CrossRef] [PubMed]
- Li, F.; Fisher, K.J.; Brownson, R.C.; Bosworth, M. Multilevel modelling of built environment characteristics related to neighbourhood walking activity in older adults. J. Epidemiol. Community Health 2005, 59, 558–564. [Google Scholar] [CrossRef] [PubMed]
- McCormack, G.R.; Shiell, A. In search of causality: A systematic review of the relationship between the built environment and physical activity among adults. Int. J. Behav. Nutr. Phys. Act. 2011, 8, 125. [Google Scholar] [CrossRef]
- Behnamifard, F.; Shafieiyoun, Z.; Behzadfar, M. Associations of Perceived and Objective Neighborhood Environment Attributes with Walking in Older Adults: A Cross-Sectional Study. J. Urban Plan. Dev. 2023, 149, 05023009. [Google Scholar] [CrossRef]
- Wachs, M.; Kumagai, T.G. Physical accessibility as a social indicator. Socio-Econ. Plan. Sci. 1973, 7, 437–456. [Google Scholar] [CrossRef]
- Cerin, E.; Lee, K.Y.; Barnett, A.; Sit, C.H.; Cheung, M.C.; Chan, W.M.; Johnston, J.M. Walking for transportation in Hong Kong Chinese urban elders: A cross-sectional study on what destinations matter and when. Int. J. Behav. Nutr. Phys. Act. 2013, 10, 78. [Google Scholar] [CrossRef]
- Tao, Y.; Zhang, W.; Gou, Z.; Jiang, B.; Qi, Y. Planning walkable neighborhoods for “aging in place”: Lessons from five aging-friendly districts in Singapore. Sustainability 2021, 13, 1742. [Google Scholar] [CrossRef]
- Hajrasouliha, A.; Yin, L. The impact of street network connectivity on pedestrian volume. Urban Stud. 2015, 52, 2483–2497. [Google Scholar] [CrossRef]
- Kim, E.J.; Jin, S. Walk score and neighborhood walkability: A case study of Daegu, South Korea. Int. J. Environ. Res. Public Health 2023, 20, 4246. [Google Scholar] [CrossRef] [PubMed]
- Van Holle, V.; Van Cauwenberg, J.; Gheysen, F.; Van Dyck, D.; Deforche, B.; Van de Weghe, N.; De Bourdeaudhuij, I. The association between Belgian older adults’ physical functioning and physical activity: What is the moderating role of the physical environment? PLoS ONE 2016, 11, e0148398. [Google Scholar] [CrossRef]
- Nathan, A.; Wood, L.; Giles-Corti, B. Exploring socioecological correlates of active living in retirement village residents. J. Aging Phys. Act. 2014, 22, 1–15. [Google Scholar] [CrossRef]
- Cerin, E.; Barnett, A.; Zhang, C.J.; Lai, P.C.; Sit, C.H.; Lee, R.S. How urban densification shapes walking behaviours in older community dwellers: A cross-sectional analysis of potential pathways of influence. Int. J. Health Geogr. 2020, 19, 14. [Google Scholar] [CrossRef]
- Laković, S.; Tollazzi, T.; Gruden, C. Elderly Pedestrians and Road Safety: Findings from the Slovenian Accident Database and Measures for Improving Their Safety. Sustainability 2023, 15, 1631. [Google Scholar] [CrossRef]
- Kim, D. The transportation safety of elderly pedestrians: Modeling contributing factors to elderly pedestrian collisions. Accid. Anal. Prev. 2019, 131, 268–274. [Google Scholar] [CrossRef]
- Lee, S.; Lee, C.; Ory, M.G.; Won, J.; Towne, S.D., Jr.; Wang, S.; Forjuoh, S.N. Fear of outdoor falling among community-dwelling middle-aged and older adults: The role of neighborhood environments. Gerontologist 2018, 58, 1065–1074. [Google Scholar] [CrossRef]
- Alfonzo, M.A. To walk or not to walk? The hierarchy of walking needs. Environ. Behav. 2005, 37, 808–836. [Google Scholar] [CrossRef]
- Christman, Z.J.; Wilson-Genderson, M.; Heid, A.; Pruchno, R. The effects of neighborhood built environment on walking for leisure and for purpose among older people. Gerontologist 2020, 60, 651–660. [Google Scholar] [CrossRef]
- Burton, E.; Mitchell, L. Inclusive Urban Design: Streets for Life; Elsevier: Amsterdam, The Netherlands, 2006. [Google Scholar]
- Parida, D.; Khan, R.R.; Lavanya, K.N. Urban built environment and elderly pedestrian accessibility: Insights from South Asia. SN Soc. Sci. 2022, 2, 86. [Google Scholar] [CrossRef]
- Curl, A.; Thompson, C.W.; Alves, S.; Aspinall, P. Outdoor environmental supportiveness and older people’s quality of life: A personal projects approach. J. Hous. Elder. 2016, 30, 1–17. [Google Scholar] [CrossRef]
- Phillips, J.; Walford, N.; Hockey, A.; Foreman, N.; Lewis, M. Older people and outdoor environments: Pedestrian anxieties and barriers in the use of familiar and unfamiliar spaces. Geoforum 2013, 47, 113–124. [Google Scholar] [CrossRef]
- Balfour, J.L.; Kaplan, G.A. Neighborhood environment and loss of physical function in older adults: Evidence from the Alameda County Study. Am. J. Epidemiol. 2002, 155, 507–515. [Google Scholar] [CrossRef]
- Ball, K.; Bauman, A.; Leslie, E.; Owen, N. Perceived environmental aesthetics and convenience and company are associated with walking for exercise among Australian adults. Prev. Med. 2001, 33, 434–440. [Google Scholar] [CrossRef] [PubMed]
- Sugiyama, T.; Thompson, C.W. Associations between characteristics of neighbourhood open space and older people’s walking. Urban For. Urban Green. 2008, 7, 41–51. [Google Scholar] [CrossRef]
- Cox, H.; Hammonds, A. Religiosity, aging, and life satisfaction. J. Relig. Aging 1989, 5, 1–21. [Google Scholar]
- Chen, Y.; Yuan, Y. The neighborhood effect of exposure to blue space on elderly individuals’ mental health: A case study in Guangzhou, China. Health Place 2020, 63, 102348. [Google Scholar] [CrossRef] [PubMed]
- Adlakha, D.; Hipp, J.A.; Brownson, R.C. Adaptation and evaluation of the neighborhood environment walkability scale in India (NEWS-India). Int. J. Environ. Res. Public Health 2016, 13, 401. [Google Scholar] [CrossRef] [PubMed]
- Bryne, B.M. Structural equation modeling with AMOS: Basic concepts, applications, and programming. Struct. Equ. Model. 2010, 22, 148–161. [Google Scholar] [CrossRef]
- Friman, M.; Edvardsson, B.; Gärling, T. Frequency of negative critical incidents and satisfaction with public transport services. I. J. Retail. Consum. Serv. 2001, 8, 95–104. [Google Scholar] [CrossRef]
- Eboli, L.L.; Mazzulla, G. Service Quality Attributes Affecting Customer Satisfaction for Bus Transit. J. Public Transp. 2007, 10, 21–34. [Google Scholar] [CrossRef]
- Van Acker, V.; Witlox, F. The effects of the land use system on travel behaviour: Towards a new research approach. In Proceedings of the BIVEC-GIBET Transport Research Day 2005—Part I; Hasselt University: Hasselt, Belgium, 2005. [Google Scholar]
- Aditjandra, P.T.; Cao, X.J.; Mulley, C. Understanding neighbourhood design impact on travel behaviour: An application of structural equations model to a British metropolitan data. Transp. Res. Policy Pract. 2012, 46, 22–32. [Google Scholar] [CrossRef]
- Knoke, D. Structural equation models. In Encyclopedia of Social Measurement; Elsevier Inc.: Amsterdam, The Netherlands, 2004; pp. 689–695. [Google Scholar]
- Mickey, R.M. Applied Multivariate Techniques. J. Am. Stat. Assoc. 1997, 92, 384. [Google Scholar] [CrossRef]
- Kaiser, M. Kaiser-Meyer-Olkin measure for identity correlation matrix. J. R. Stat. Soc. 1974, 52, 296–298. [Google Scholar]
- Gliem, J.A.; Gliem, R.R. Calculating, interpreting, and reporting Cronbach’s alpha reliability coefficient for Likert-type scales. In Proceedings of the 2003 Midwest Research-to-Practice Conference in Adult, Continuing, and Community Education, Columbus, OH, USA, 8–10 October 2003. [Google Scholar]
- Bonett, D.G.; Wright, T.A. Cronbach’s alpha reliability: Interval estimation, hypothesis testing, and sample size planning. J. Organ. Behav. 2015, 36, 3–15. [Google Scholar] [CrossRef]
- Hair Anderson, R.; Tatham, R.; Black, W. Multivariate Data Analysis; Prentice Hall: Hoboken, NJ, USA, 1992. [Google Scholar]
- Pulvirenti, G.; Distefano, N.; Leonardi, S. Elderly perception of critical issues of pedestrian paths. Civ. Eng. Archit. 2020, 8, 26–37. [Google Scholar] [CrossRef]
- Chong, S.; Mazumdar, S.; Jalaludin, B.; Hatfield, J. Associations between walkability and pedestrian related injuries is modified by sociodemographic characteristics. Injury 2022, 53, 3978–3986. [Google Scholar] [CrossRef]
- Bohannon, R.W. Population representative gait speed and its determinants. J. Geriatr. Phys. Ther. 2008, 31, 49–52. [Google Scholar] [CrossRef]
- Distefano, N.; Pulvirenti, G.; Leonardi, S. Neighbourhood walkability: Elderly’s priorities. Res. Transp. Bus. Manag. 2021, 40, 100547. [Google Scholar] [CrossRef]
- Curl, A.; Fitt, H.; Tomintz, M. Experiences of the built environment, falls and fear of falling outdoors among older adults: An exploratory study and future directions. Int. J. Environ. Res. Public Health 2020, 17, 1224. [Google Scholar] [CrossRef] [PubMed]
- Malambo, P.; Kengne, A.P.; Lambert, E.V.; De Villers, A.; Puoane, T. Association between perceived built environmental attributes and physical activity among adults in South Africa. BMC Public Health 2017, 17, 213. [Google Scholar] [CrossRef] [PubMed]
- Zandieh, R.; Martinez, J.; Flacke, J.; Jones, P.; Van Maarseveen, M. Older adults’ outdoor walking: Inequalities in neighbourhood safety, pedestrian infrastructure and aesthetics. Int. J. Environ. Res. Public Health 2016, 13, 1179. [Google Scholar] [CrossRef]
- Herrmann-Lunecke, M.G.; Mora, R.; Vejares, P. Perception of the built environment and walking in pericentral neighbourhoods in Santiago, Chile. Travel Behav. Soc. 2021, 23, 192–206. [Google Scholar] [CrossRef]
- Oyeyemi, A.L.; Kolo, S.M.; Rufai, A.A.; Oyeyemi, A.Y.; Omotara, B.A.; Sallis, J.F. Associations of neighborhood walkability with sedentary time in Nigerian older adults. Int. J. Environ. Res. Public Health 2019, 16, 1879. [Google Scholar] [CrossRef] [PubMed]
- Van Cauwenberg, J.; De Bourdeaudhuij, I.; Clarys, P.; Nasar, J.; Salmon, J.; Goubert, L.; Deforche, B. Street characteristics preferred for transportation walking among older adults: A choice-based conjoint analysis with manipulated photographs. Int. J. Behav. Nutr. Phys. Act. 2016, 13, 6. [Google Scholar] [CrossRef]


| Category | Code | Indicators | Mean | Standard Deviation | Skewness | Kurtosis |
|---|---|---|---|---|---|---|
| Accessibility | WA1 | Familiarity of the ward | 4.24 | 0.744 | −0.945 | 1.056 |
| WA2 | Alternative routes to reach a destination | 4.26 | 0.690 | −0.900 | 1.393 | |
| WA3 | Short distance between intersections | 3.90 | 0.750 | −0.682 | 1.348 | |
| WA4 | Streets have no dead ends | 3.93 | 0.847 | −0.820 | 1.027 | |
| WA5 | Good mix of residential and commercial areas | 4.21 | 0.789 | −1.069 | 1.184 | |
| Pedestrian Safety | PS1 | Less traffic along my walking route | 3.44 | 1.192 | −0.805 | −0.532 |
| PS2 | Speed of traffic is usually under safe limits | 3.23 | 1.205 | −0.500 | −1.053 | |
| PS3 | The streets used by motorists to bypass signals | 3.57 | 1.083 | −0.680 | −0.704 | |
| PS4 | Drivers ride on the footpaths | 2.79 | 1.166 | 0.301 | −1.181 | |
| PS5 | Crosswalks and pedestrian signals | 2.69 | 1.142 | 0.109 | −1.410 | |
| PS6 | Pedestrian crossing time is adequate for elderly | 2.57 | 1.160 | 0.073 | −1.489 | |
| Sidewalk Condition | SW1 | There are sidewalks on most of the streets | 2.14 | 1.107 | 0.644 | −0.917 |
| SW2 | The sidewalks are well maintained | 1.77 | 0.887 | 1.298 | 1.385 | |
| SW3 | The sidewalks are continuous without breaks | 1.85 | 0.910 | 1.178 | 1.310 | |
| SW4 | Bollards are present in the sidewalks | 2.24 | 1.134 | 0.697 | −0.697 | |
| SW5 | Grade changes (varying heights) in sidewalks | 3.84 | 1.317 | −0.982 | −0.251 | |
| SW6 | The parking lot abutting the sidewalk | 4.14 | 1.093 | −1.147 | 0.180 | |
| SW7 | Stray animals | 3.97 | 1.074 | −0.923 | −0.228 | |
| Safety from Crime | CS 1 | Activity level in the street (vibrance levels) | 3.93 | 0.889 | 1.312 | |
| CS 2 | There are hawkers and street vendors in my ward | 3.88 | 0.863 | −1.005 | 1.410 | |
| CS 3 | Surveillance cameras | 4.08 | 0.981 | −1.292 | 1.496 | |
| CS 4 | High theft rate in my ward | 3.84 | 0.944 | −1.042 | 1.179 | |
| CS 5 | The streets in my ward are well lit at night | 3.94 | 1.038 | −1.274 | 1.485 | |
| Comfort Condition | CC 1 | The noise level from the traffic is very high | 3.81 | 1.221 | −0.855 | −0.380 |
| CC 2 | There are trees in my walking route | 2.59 | 1.224 | 0.304 | −1.248 | |
| CC 3 | Seating facilities | 2.49 | 1.397 | 0.302 | −1.459 | |
| CC 4 | Legible signboards | 3.98 | 1.193 | −1.222 | 0.467 | |
| CC 5 | Toilets present in my walking route | 3.44 | 1.113 | −0.884 | −0.444 | |
| Aesthetics | AS 1 | Interesting things to look at while walking | 2.22 | 1.168 | 0.820 | −0.498 |
| AS 2 | Garbage bins | 3.46 | 1.281 | −0.604 | −0.862 | |
| AS 3 | There is natural scenery to look at while walking | 2.06 | 1.071 | 0.891 | −0.271 | |
| AS 4 | Dirty scribblings/posters on blank walls | 3.19 | 1.267 | 0.286 | −1.242 | |
| AS 5 | The streets in my ward are unclean and dirty | 2.40 | 0.994 | 0.946 | −0.116 |
| Code | Indicators | Communalities | Factor Loading | Explained Variance | Cumulative Variance | Cronbach’s Alpha |
|---|---|---|---|---|---|---|
| Component 1—Safety from Crime | ||||||
| CS 1 | Activity level in the street (vibrance levels) | 0.614 | 0.767 | |||
| CS 2 | Hawkers and street vendors in my ward | 0.545 | 0.704 | |||
| CS 3 | Surveillance cameras | 0.734 | 0.832 | 11.228 | 11.228 | 0.834 |
| CS 4 | High theft rate in my ward | 0.634 | 0.771 | |||
| CS 5 | The streets in my ward are well lit at night | 0.632 | 0.766 | |||
| Component 2—Accessibility | ||||||
| WA1 | Familiarity of the ward | 0.619 | 0.747 | |||
| WA2 | Alternative routes to reach a destination | 0.652 | 0.758 | |||
| WA3 | Short distance between intersections | 0.397 | 0.565 | 9.385 | 20.613 | 0.735 |
| WA4 | Streets have no dead ends | 0.505 | 0.668 | |||
| WA5 | Good mix of residential and commercial areas | 0.576 | 0.728 | |||
| Component 3—Sidewalk Condition | ||||||
| SW1 | There are sidewalks on most of the streets | 0.664 | 0.762 | |||
| SW2 | The sidewalks are well maintained | 0.699 | 0.801 | |||
| SW3 | The sidewalks are continuous without breaks | 0.724 | 0.828 | 9.016 | 29.630 | 0.747 |
| SW4 | Presence of Bollards in Sidewalks | 0.557 | 0.607 | |||
| Component 4—Barriers to Walking | ||||||
| SW5 | Grade changes (varying heights) in sidewalks | 0.765 | 0.838 | 7.577 | 37.207 | 0.817 |
| SW6 | The parking lot abutting the sidewalk | 0.77 | 0.856 | |||
| SW7 | Stray animals | 0.733 | 0.839 | |||
| Component 5—Aesthetics | ||||||
| AS 1 | Interesting things to look at while walking | 0.752 | 0.817 | |||
| AS 3 | Natural scenery to look at while walking | 0.736 | 0.834 | 7.266 | 44.473 | 0.800 |
| AS 5 | The streets in my ward are unclean and dirty | 0.709 | 0.790 | |||
| Component 6—Pedestrian Safety | ||||||
| PS4 | Drivers ride on footpaths | 0.563 | 0.644 | |||
| PS5 | Crosswalks and pedestrian signals | 0.732 | 0.814 | 6.732 | 51.205 | 0.726 |
| PS6 | Pedestrian crossing time is adequate for elderly | 0.724 | 0.827 | |||
| Component 7—Comfort Condition | ||||||
| CC1 | The noise level from the traffic is very high | 0.752 | 0.843 | |||
| CC4 | Legible signboards | 0.765 | 0.851 | 5.957 | 57.162 | 0.790 |
| CC5 | Toilets present in my walking route | 0.663 | 0.721 | |||
| Component 8—Traffic condition | ||||||
| PS1 | Less traffic along my walking route | 0.81 | 0.887 | 4.358 | 61.519 | 0.831 |
| PS2 | Speed of traffic is usually under safe limits | 0.815 | 0.875 | |||
| Component 9—Pedestrian resting areas | ||||||
| CC 2 | There are trees in my walking route | 0.822 | 0.890 | 3.656 | 65.176 | 0.806 |
| CC 3 | Seating facilities | 0.812 | 0.867 | |||
| Component 10—Cleanliness | ||||||
| AS2 | Garbage bins | 0.743 | 0.785 | 3.084 | 68.260 | 0.743 |
| AS4 | Dirty scribblings/posters on blank walls | 0.790 | 0.851 | |||
| Latent Exogenous Construct | Measured Exogenous Variable | Std RW | Estimate | SE | CR | p | ||
|---|---|---|---|---|---|---|---|---|
| CS | Crime Safety | CS1 | Activity level | 0.711 | 0.892 | 0.099 | 8.992 | *** |
| CS2 | Hawkers and street vendors | 0.624 | 0.759 | 0.094 | 8.044 | *** | ||
| CS3 | Surveillance cameras | 0.801 | 1.108 | 0.113 | 9.801 | *** | ||
| CS4 | High theft rate in my ward | 0.727 | 0.968 | 0.106 | 9.158 | *** | ||
| CS5 | Street lighting | 0.683 | 1 | |||||
| WA | Accessibility | WA1 | Familiarity of the ward | 0.681 | 1.005 | 0.138 | 7.264 | *** |
| WA2 | Alternative routes | 0.703 | 0.963 | 0.131 | 7.367 | *** | ||
| WA3 | Distance between intersections | 0.437 | 0.65 | 0.124 | 5.236 | *** | ||
| WA4 | Streets have no dead ends | 0.556 | 0.935 | 0.147 | 6.362 | *** | ||
| WA5 | Land-use mix | 0.639 | 1 | |||||
| SWA | Sidewalk Condition | SW1 | Sidewalk presence | 0.608 | 1.262 | 0.222 | 5.687 | *** |
| SW2 | Sidewalk maintenance | 0.763 | 1.271 | 0.205 | 6.192 | *** | ||
| SW3 | Sidewalk continuity | 0.807 | 1.379 | 0.222 | 6.219 | *** | ||
| SW4 | Bollards in sidewalk | 0.470 | 1 | |||||
| SWB | Barriers to Walking | SW5 | Grade changes | 0.783 | 1.33 | 0.134 | 9.903 | *** |
| SW6 | Parking lot abutting the sidewalk | 0.830 | 1.17 | 0.118 | 9.936 | *** | ||
| SW7 | Stray animals | 0.722 | 1 | |||||
| AS | Aesthetics | AS1 | Interesting things | 0.812 | 1.251 | 0.134 | 9.333 | *** |
| AS3 | Natural scenery | 0.699 | 0.986 | 0.109 | 9.065 | *** | ||
| AS5 | Street cleanliness level | 0.763 | 1 | |||||
| PS | Pedestrian Safety | PS4 | Drivers ride on footpaths | 0.484 | 0.632 | 0.101 | 6.285 | *** |
| PS5 | Crosswalks and pedestrian signals | 0.829 | 1.06 | 0.140 | 5.592 | *** | ||
| PS6 | Pedestrian crossing time | 0.770 | 1 | |||||
| CC | Comfort Condition | CC1 | Noise level | 0.762 | 1.235 | 0.142 | 5.937 | *** |
| CC4 | Legible signboards | 0.803 | 1.27 | 0.145 | 7.555 | *** | ||
| CC5 | Toilets | 0.677 | 1 | |||||
| Latent endogenous construct | Latent exogenous variable | Std RW | Estimate | SE | CR | p | ||
| Walkability | CS | Crime Safety | 0.352 | 1 | ||||
| WA | Accessibility | 0.250 | 1 | |||||
| SWA | Sidewalk Condition | 0.264 | 1 | |||||
| SWB | Barriers to Walking | 0.385 | 1 | |||||
| AS | Aesthetics | 0.376 | 1 | |||||
| PS | Pedestrian Safety | 0.443 | 1 | |||||
| CC | Comfort Condition | 0.374 | 1 | |||||
| Measure | Threshold | Measurement Model | Structural Model | |
|---|---|---|---|---|
| CMIN | Chi-Square | —— | 350.033 | 381.674 |
| df | Degrees of freedom | —— | 279 | 298 |
| CMIN/df | Normed Chi-Square value | Between 1 and 3 | 1.255 | 1.281 |
| CFI | Comparative Fit Index | ≥ 0.9 | 0.958 | 0.951 |
| GFI | Goodness-of-Fit-Index | ≥0.9 | 0.893 | 0.882 |
| SRMR | Standardized Root Mean Square Residual | <0.08 | 0.062 | 0.078 |
| RMSEA | Root Mean Square Error of Approximation | <0.06 | 0.034 | 0.036 |
| TLI | Tucker–Lewis Index | ≥0.9 | 0.951 | 0.946 |
| PClose | P of Close Fit | >0.05 | 0.994 | 0.991 |
Disclaimer/Publisher’s Note: The statements, opinions and data contained in all publications are solely those of the individual author(s) and contributor(s) and not of MDPI and/or the editor(s). MDPI and/or the editor(s) disclaim responsibility for any injury to people or property resulting from any ideas, methods, instructions or products referred to in the content. |
© 2023 by the authors. Licensee MDPI, Basel, Switzerland. This article is an open access article distributed under the terms and conditions of the Creative Commons Attribution (CC BY) license (https://creativecommons.org/licenses/by/4.0/).
Share and Cite
Prithviraj, D.; Sundaram, L. Exploring the Walkability of Senior Citizens in a Densely Populated Neighborhood of Chennai, India—A Structural Equation Modeling Approach. Sustainability 2023, 15, 13868. https://doi.org/10.3390/su151813868
Prithviraj D, Sundaram L. Exploring the Walkability of Senior Citizens in a Densely Populated Neighborhood of Chennai, India—A Structural Equation Modeling Approach. Sustainability. 2023; 15(18):13868. https://doi.org/10.3390/su151813868
Chicago/Turabian StylePrithviraj, Dharmambigai, and Lakshmi Sundaram. 2023. "Exploring the Walkability of Senior Citizens in a Densely Populated Neighborhood of Chennai, India—A Structural Equation Modeling Approach" Sustainability 15, no. 18: 13868. https://doi.org/10.3390/su151813868
APA StylePrithviraj, D., & Sundaram, L. (2023). Exploring the Walkability of Senior Citizens in a Densely Populated Neighborhood of Chennai, India—A Structural Equation Modeling Approach. Sustainability, 15(18), 13868. https://doi.org/10.3390/su151813868