Article

Environmental Regulation and Employment Changes in Chinese Manufacturing Enterprises: Micro Evidence from the Top 10,000 Energy-Consuming Enterprises Program

Business School, Yangzhou University, Yangzhou 225127, China
*
Author to whom correspondence should be addressed.
Sustainability 2023, 15(18), 13867; https://doi.org/10.3390/su151813867
Submission received: 10 August 2023 / Revised: 7 September 2023 / Accepted: 15 September 2023 / Published: 18 September 2023

Abstract

:
This study investigates the impact of the Top 10,000 Energy-Consuming Enterprises Program (hereafter referred to as the carbon reduction policy) implemented by the Chinese government in 2011 on the employment of manufacturing enterprises. The study indicates that the implementation of the carbon reduction policy has two ways of impacting the employment scale, namely ‘employment creation’ and ‘employment destruction’. The actual effect of the policy on the employment scale depends on the superposition of these two effects. Based on a sample data set of Chinese manufacturing enterprises, the generalized propensity score-matching method (GPSM) is used to identify the causal relationship and its mechanism between the carbon reduction policy and the employment scale. The study reveals several findings. First, the carbon reduction policy positively affects the employment of Chinese manufacturing enterprises, and the employment scale demonstrates an inverted U-shaped relationship as the policy intensity gradually increases. Second, the carbon reduction policy affects the employment scale of Chinese manufacturing enterprises through two pathways of employment creation and employment destruction. Third, the promotion effect of the carbon reduction policy on the employment scale of different types of enterprises is heterogeneous and is influenced by factors such as institutional environment, ownership type, and industry pollution characteristics. These findings remain robust under different samples and empirical methods. The results of this study demonstrate that China’s top 10,000 Energy-Consuming Enterprises Program can achieve a ‘win-win’ situation by ensuring environmental protection and stable employment.

1. Introduction

The relationship between environmental regulation and employment has long been a focus of attention for scholars in environmental and labor economics fields [1,2,3,4]. Developing countries, including China, face the dilemma of balancing economic development, employment creation, and environmental protection. Since the 2008 financial crisis, determining how to achieve environmental protection and the potential impact of environmental protection on employment has become a focal point of environmental policy debates. China is the world’s largest developing country with a significant environmental pollution problem. With particulate matter and sulphur dioxide (SO2) as indicators of environmental pollution, China has one of the worst air pollution levels in the world. The ‘State Environmental Analysis of the People’s Republic of China’ reports that few cities in China’s major urban areas meet the World Health Organization’s air quality standards. As environmental problems caused by economic development have become increasingly prominent in China, the government’s attention to environmental quality and demands for pollution control has increased. Furthermore, as the world’s most populous country, employment has always been at the core of China’s economic development. Government work reports over the years have emphasized the importance of employment, adhering to employment priority strategies, and implementing proactive employment policies, making fuller employment one of the core goals of the transition to high-quality development. In the context of globalization, people are becoming increasingly concerned about environmental issues, to the extent that there are calls to sacrifice employment and economic growth to improve the environment. Improving the environment and increasing employment are crucial for China’s livelihoods and national strategy. Whether China can achieve simultaneous environmental improvement and employment growth will be a significant challenge for the government in the future.
Strict environmental regulations can increase production costs for companies, leading to higher product prices, reduced demand, and further decreases in input demand, including labor. This situation means that environmental regulations affect employment; however, subsequent studies have shown that strict environmental regulations can also encourage companies to increase hiring to install and maintain pollution control equipment or change their production processes to reduce waste. This situation may require more workers than in previous production processes; therefore, company labor employment may increase when environmental regulations become stricter. The neoclassical microeconomic theory cannot predict which of these two opposing mechanisms will dominate; therefore, the impact of environmental regulations on employment is uncertain and requires empirical research and analysis [5]. Most empirical studies on the effects of environmental regulations on labor demand have focused on developed economies, including the United States and European countries. Research on developing countries has been limited, especially concerning large and rapidly developing countries like China. Unlike Western countries, which tend to adopt market-oriented environmental regulations, China’s market mechanisms are still in continuous improvement, with administrative environmental regulations playing a dominant role. As China is a developing country, the government plays a crucial role in economic development. Some scholars believe the Chinese government has always faced a conflict between economic growth and environmental protection [6,7]. The government’s intrinsic motivation to pursue economic growth may lead it to prioritize the protection of manufacturing industry employment and increased fiscal revenue and selectively ignore environmental issues [8,9]. Therefore, the reliability of environmental regulations and the research conclusions based on these policies is debatable [10].
Based on the Top 10,000 Energy-Consuming Enterprises Program implemented by the Chinese government in 2011, this paper investigates the impact of environmental regulations on the total employment and structural changes in the employment of Chinese manufacturing enterprises. We use micro-level employment data from Chinese manufacturing enterprises from 2010 to 2013, and the carbon reduction policy decomposes energy-saving targets into energy-saving quotas allocated to micro-enterprises. This approach restricts the energy consumption rights of enterprises from the front end, thereby controlling their pollutant emissions. Unlike previous end-of-pipe control policies, this is a ‘one-size-fits-all’ policy, which can avoid the problem of the effectiveness of environmental regulation policies caused by the Chinese government’s selective environmental neglect, ensuring the reliability of the conclusions [8,9]. This study treats the influence of the carbon reduction policy on enterprises as a quasi-natural experiment to effectively identify the impact of environmental regulations on employment changes in Chinese manufacturing enterprises. The sample enterprises are divided into treatment and control groups based on whether they are included in the list of the top 10,000 Energy-Consuming enterprises. We use the generalized propensity score-matching (GPSM) method for empirical analysis. This study’s main conclusion is that the carbon reduction policy positively impacts the employment scale of Chinese manufacturing enterprises, and it has two mechanisms for promoting employment creation and reducing employment destruction in enterprise employment.
This paper enriches and expands existing research in several aspects. The first aspect concerns the choice of environmental regulation policies; this study regards the carbon reduction policy implemented by the Chinese government as a policy shock, avoiding potential debates on the effectiveness of environmental policy implementation. Moreover, this policy directly affects manufacturing enterprises; therefore, it can more effectively prevent the problem of aggregation bias when studying micro-enterprise behavior using traditional macro-policy, ensuring the reliability of research conclusions to the greatest extent. The second aspect concerns the choice of research methods. This study adopts the GPSM method within a quasi-natural experiment framework to identify the impact of environmental regulations on employment changes in Chinese manufacturing enterprises and address endogeneity issues that previous studies may have faced. This approach can also identify whether the intensity of the carbon reduction policy has differential effects on enterprise employment. The third aspect is the selection of research perspectives. Unlike previous studies, this study examines the impact of environmental regulations on the total employment of enterprises and the effect of environmental regulations on changes in the employment structure of enterprises. In other words, we examine the impact of environmental regulations on employment creation and destruction by enterprises, allowing for a preliminary exploration of how environmental regulations affect enterprise employment. The rest of this paper is structured as follows. Section 2 reviews the relevant literature. Section 3 introduces the policy background of the Top 10,000 Energy-Consuming Enterprises Program. Section 4 presents the empirical model, variables, and data. Section 5 conducts an empirical analysis. Section 6 provides a further expansion analysis. Section 7 discusses policy recommendations. Section 8 summarizes the entire article.

2. Literature Review

The relationship between environmental regulations and employment has long been studied; however, academic circles have no consensus on whether environmental regulations increase or decrease enterprise employment. Early studies believed that implementing environmental regulation policies would inevitably affect the employment scale of specific industries [2] and cause fluctuations in employment demand [3]. The reason is that regulated entities must purchase expensive equipment to reduce their pollution emissions to avoid the risk of closure. Strict environmental regulations may increase operating costs for manufacturing enterprises and lead them to adopt capital-intensive technologies, negatively impacting employment [4,11]. Early studies on the US Clean Air Act found that stringent environmental regulations negatively affected employment [12,13], and this negative impact was particularly evident in energy-intensive industries [14]. Conversely, subsequent research found that the relationship between environmental regulations and employment exceeded previous expectations, and the two were not simply negatively correlated. Bezdek [15] conducted empirical tests showing that strict environmental regulations did not lead to decreased employment but stimulated economic growth. Some studies have found a complementary relationship between environmental protection, economic growth, and employment [16]. That means environmental protection reduces employment and creates new job opportunities, and the net balance between employment creation and job loss may be positive. In other words, implementing environmental regulation policies may have a ‘neutral’ or ‘favorable’ impact on employment [17]. From an innovation perspective, Porter and Van (1995) proposed that environmental regulations can stimulate enterprises to adopt research and development innovation to improve productivity, enhance the competitive advantage of manufacturing enterprises, and affect the employment demand of manufacturing enterprises. Berman and Bui [5] constructed an empirical equation between environmental regulations and labor demand using micro-enterprise data to examine the impact of environmental regulations on employment, finding that environmental regulations had no significant negative impact on enterprise employment. Cole and Elliott [18] and Gray et al. [2] conducted empirical studies using a similar model to Berman and Bui [5]; they also found no evidence of the negative impacts of environmental regulations on enterprise employment. Empirical research on the US Environmental Protection Agency’s sulphur dioxide trading program also supports that environmental regulations did not significantly reduce the employment rate of regulated fossil fuel power plants [19]. Studies on the labor demand of the European Union Emissions Trading System (EU ETS) also found no statistical evidence of environmental regulations reducing employment [20,21].
As China’s environmental issues become increasingly severe, scholars have begun to study the impact of environmental regulations on employment in China. Due to the availability of microdata, existing studies have primarily focused on industry or regional data and the promotion hypothesis, the inhibition hypothesis, and the non-linear hypothesis have received some evidence support. Lu [22] conducted a study on 43 industries in China and found that introducing a ‘carbon tax’ in China would negatively impact employment. Sun et al. [23] argued that the ‘two control zones’ policy implemented in China is generally unfavorable for improving urban employment. Shi and Wang [24] examined Chinese industrial sector data. Yuan and Xie [25] and Chen, et al. [26] investigated Chinese prefecture-level city data. Sun and Yang [27] empirically studied the Chinese ‘two control zones’ policy, each finding that environmental regulation is conducive to expanding employment scale. Yan and Guo [28], Li and Du [29], Zhong et al. [30], and other studies argued that a non-linear relationship exists between environmental regulations and employment. Furthermore, the difference in the intensity of environmental regulations is a key factor leading to this non-linear relationship. As of the end of 2019, only two studies had examined Chinese micro-enterprise data, concluding that environmental regulations negatively impact enterprise employment. Liu et al. [3] studied the impact of changes in industrial wastewater discharge standards on employment in industries such as textiles based on China’s environmental statistics and industrial enterprise databases. The results showed that stricter industrial wastewater discharge standards decreased labor demand, primarily reflected in the sample of private enterprises. Sheng et al. [31] used World Bank data from a 2003 survey on the investment environment in 18 cities in China to study the impact of environmental regulation policies on employment in 1375 manufacturing firms, finding that environmental regulations adversely affected employment in manufacturing firms through its output and substitution effects.
The differences in sample data and the variations in measuring environmental regulation policies can significantly affect research conclusions [32]. Obtaining reliable data on environmental regulations has always been a challenging task. The inherent motive of the Chinese government to pursue economic growth tends to prioritize protecting manufacturing industry employment and increasing fiscal revenue, resulting in selectively neglecting environmental issues [8,9], further complicating related research. Selecting effective environmental regulation variables for research is essential for obtaining reliable conclusions. China’s current environmental regulation measures mainly belong to end-of-pipe control policies, which are susceptible to interference from local government behavior. Research on data from macro-level policy, such as the ‘two control zones’ policy, usually suffers from aggregation bias. In comparison, the carbon reduction policy decomposes the national macro energy-saving goal into carbon reduction quotas borne by micro-enterprises, which belong to the front-end policy restricting energy use rights of enterprises. Therefore, research conclusions based on the carbon reduction policy have higher reliability. Currently, only two studies have examined the micro-enterprise samples in China, and the period and sample size of these studies lack representativeness. More importantly, existing studies often focus on the relationship between environmental regulation policies and overall employment, neglecting the impact on employment structure changes, thus failing to reveal the influence of environmental regulations on employment. Davis and Haltiwanger [33] used data from U.S. manufacturing enterprises to decompose employment changes into rates of employment creation and employment destruction, re-examining the issue of employment from two dimensions: Employment creation and employment destruction. This analytical framework has been widely applied in subsequent labor market research and provides possibilities for studying the impact of environmental regulations on employment from the perspectives of employment creation and destruction.
In conclusion, research on environmental policies and enterprise employment becomes more critical as China’s economy enters the ‘new normal’ and demand for environmental sustainability in high-quality development increases [3]. This situation requires detailed studies on a larger scale of more representative policies; therefore, this study uses micro-enterprise data from China and the carbon reduction policy to identify the different impacts of various regulatory policy intensities on the employment of manufacturing enterprises. To better reflect the causal effect of regulatory policy intensity on employment changes in enterprises, this study uses GPSM methods to examine relative employment changes in regulated enterprises, comparing them with non-regulated enterprises regarding changes in employment scale and employment structure before and after implementing the carbon reduction policy.

3. Policy Background

Within the framework of the Comprehensive Work Program for Energy Conservation and Emission Reduction of the 12th Five-Year Plan, the Chinese government established the Top 10,000 Energy-Consuming Enterprises Program (T10000P). The primary objective of this initiative is to identify and prioritize key energy consumers, particularly industrial enterprises, with comprehensive energy consumption exceeding 10,000 tons of standard coal in 2010 and an annual consumption of more than 5000 tons of standard coal. The program is overseen by multiple relevant departments, including the State Council, the Development and Reform Commission, the Ministry of Education, the Ministry of Industry and Information Technology, the Ministry of Finance, the Ministry of Housing and Urban Rural Development, the Ministry of Transport, the Ministry of Commerce, the SASAC of the State Council, the AQSIQ, the National Bureau of Statistics, the CBRC, and the National Energy Administration. During the 12th Five-Year Plan period (2011–2015), approximately 17,000 enterprises were selected to participate in T10000P, accounting for more than 60% of China’s total energy consumption. These companies are required to establish individual energy-saving targets within the plan period in order to achieve their overall energy-saving goals. Local energy-saving authorities are responsible for decomposing the energy-saving targets of 10,000 companies and reporting them to the National Development and Reform Commission for record-keeping and assessment purposes. To ensure the sustainability of T10000P, it has been established that any significant changes to the list of participating companies will not take place during the period of the 12th Five-Year Plan (2011–2015). The policy implementation cycle spans this entire period, providing a stable framework to assess the various scientific impacts of the program.
The State Council has mandated the integration of energy-saving objectives and the implementation of energy-saving measures into the provincial government’s assessment system for energy-saving goals. The evaluation results of energy-saving targets in different regions must be compiled and published annually, with copies sent to relevant departments such as the State-owned Assets Supervision and Administration Commission (SASAC), the China Banking Regulation Commission (CBRC), and others. Furthermore, the performance evaluation of central enterprises should include their energy savings goals, and a robust accountability system should be established as part of the comprehensive evaluation of leading groups and leaders’ performance assessment. In order to promote sustainable energy consumption, the CBRC encourages banks and financial institutions to provide increased credit support for energy-saving projects under the Program. However, they must also adhere to the principles of risk control and business sustainability. The achievement of energy-saving goals should be taken into account in enterprise credit ratings, credit access, and exit management. Banks and financial institutions are required to strictly regulate lending to companies that fail to meet energy-saving standards or demonstrate ineffective rectification efforts. Energy-saving supervisory institutions at all levels are obligated to take specific actions to fulfill the objectives of the program. First, they need to strengthen energy-saving supervision. Second, they should conduct specialized supervision of the implementation of energy conservation management systems among the 10,000 selected companies according to the law. Third, they should evaluate and review energy savings in fixed-asset investment projects. Fourth, they should enforce the standards for energy consumption quotas. Fifth, they should eliminate outdated equipment and implement energy-saving plans. Ultimately, the program will enforce strict compliance with energy-using regulations by investigating and penalizing any illegal activities. The institutional framework of this initiative seeks to implement stringent guidelines for corporate energy consumption decisions, thereby promoting a culture of accountability and responsibility towards sustainable development practices.

4. Model, Variables and Data

4.1. Model and Strategy

When studying the relationship between environmental regulation and employment, Berman and Bui [5] divided a firm’s input into quasi-fixed and variable factors. External constraints, such as government-imposed environmental regulations, determine quasi-fixed factors and their levels do not vary with market changes. Variable factors include general production inputs like labor, technology, and capital. Assuming that under conditions of perfect competition, an enterprise must input M quasi-fixed factors and N variable factors for production. The cost function of the firm can be expressed as follows:
C = f Y , P 1 , , P N , F 1 , , F M ,
where C represents the enterprise’s variable costs. Y represents output, P i i = 1 , , N represents the price of the i th variable factor, and F j j = 1 , , M represents the input of the j th quasi-fixed factor. By the first-order condition of profit maximization, the labor input L can be expressed as a function of output, the price of variable factors and the input of quasi-fixed factors [5]. This function can be linearized as follows:
L = α + ρ Y Y + j = 1 M β j F j + i = 1 N γ i P i ,
where L represents labor input and α represents fixed labor demand. ρ Y , β j , and γ I respectively represent the impact of output, the j th quasi-fixed factor input, and the i th variable factor input on labor. Equation (2) indicates that output, quasi-fixed, and variable factors impact employment. Environmental regulation, as an exogenous constraint on enterprises, affects the input of quasi-fixed factors and thus impacts employment. Using R to represent the intensity of environmental regulation, taking the partial derivative of Equation (2) concerning environmental regulation, Equation (3) can be obtained.
L R = ρ Y Y R + j = 1 M β j F j R + i = 1 N γ i P i R .
The first term, Y R , in Equation (3), represents the impact of output changes on labor demand, namely the ‘output effect’ of environmental regulation. Neoclassical microeconomic theory suggests that the ‘output effect’ of environmental regulation suppresses employment growth, and Y R is typically assumed to be negative. However, Berman and Bui [5] point out that environmental regulation’s ‘output effect’ on employment is uncertain. If enterprises invest in ‘green’ technologies to reduce pollutant emissions to comply with environmental regulations, the term Y R might be positive. The second term in Equation (3), j = 1 M β j F j R , represents the effect of environmental regulation on the input of variable factors through the input of quasi-fixed factors. This effect depends on the marginal technical substitution rate between the two, namely the ‘substitution effect’ of environmental regulation. When environmental regulation becomes stricter, enterprises inevitably increase pollution control efforts and reduce employment in the polluting sector. Conversely, additional employment results if enterprises adopt cleaner energy, more efficient production techniques, and cleaner production technologies. The comprehensive impact of the new and replaced positions on enterprise employment is uncertain and depends on their size and whether these positions are substitutes or complements. When factor markets are competitive and regulated enterprises make up only a small portion of these markets, any changes in the degree of environmental regulation will not affect input factor prices. Therefore, the last term in Equation (3), i = 1 N γ i P i R , can be approximated as zero; thus, theoretical models cannot provide the impact of environmental regulation on enterprise employment, which requires empirical testing. Considering that previous studies have primarily focused on the scale of employment without fully understanding the complex effects of environmental regulation on enterprise employment, this paper follows Davis and Haltiwanger [33]. We explore the impact of environmental regulation policy on changes in employment structure from the perspectives of enterprise employment creation and employment destruction to investigate the possible influence mechanism. Therefore, this paper proposes the following three main hypotheses:
Hypothesis 1 (H1).
The carbon reduction policy has a positive promoting effect and a negative constraining effect on the employment scale of manufacturing enterprises; its comprehensive effects must be interpreted through empirical analysis.
Hypothesis 2 (H2).
The impact of the carbon reduction policy on the employment scale of manufacturing enterprises operates simultaneously through two channels of improving employment creation and reducing employment destruction.
Hypothesis 3 (H3).
The impact of the carbon reduction policy on enterprise employment varies heterogeneously for different types of enterprises and is influenced by factors such as institutional environment, ownership type, and industry pollution characteristics.
This study adopts the following simplified form for empirical testing based on the setting by Berman and Bui [5] to observe relative changes in labor input concerning the intensity of environmental regulation rather than absolute levels:
L = δ + μ R ,
where δ = α , μ = L R = ρ Y Y R + j = 1 M β j F j R + i = 1 N γ i P i R .
This study takes the T10000P implemented by the Chinese government in 2011 as a quasi-natural experiment and conducts empirical research using the ‘counterfactual’ method. Specifically, we construct treatment and control groups based on whether the sampled enterprises are included in the list of the top 10,000 Energy-Consuming enterprises. Considering that policy intensity may impact enterprise employment, a ‘counterfactual’ model is required to deal with policy intensity. The traditional propensity score-matching (PSM) model for handling variables is limited to binary variables, i.e., whether impacted by the carbon reduction policy and cannot address employment differences caused by varying environmental regulation intensity. Therefore, this study intends to use the GPSM model as the primary econometric method. As an extension of the PSM method, GPSM effectively handles continuous variables.
GPSM eliminates all biases associated with covariate differences between the treatment and control groups, allowing us to determine whether the intensity of environmental regulation policy has a causal effect on employment in manufacturing enterprises. If the difference between the expected employment levels is significantly positive (or negative), we can assume that when environmental regulatory intensity transitions from one level to another, the expected employment will also increase (or decrease). Because the GPSM model controls for covariate differences, changes in enterprise employment can be understood as the causal impact of different environmental regulatory intensities on enterprise employment: Y ( g ) G | X , g ( g 0 , g 1 . Here, Y(g) represents the outcome value when the treatment variable G takes the value g; this value corresponds to the enterprise employment level when the environmental regulation intensity faced by enterprises is g. This condition implies that after controlling for the factors in the covariate X, we can eliminate the selective bias of treatment intensity and resulting endogeneity issues. The selection requirement for multivariate covariates X affects the treatment variable G and the outcome value Y. For the specific implementation of the three steps of the GPSM test process and the corresponding balance test requirements, please refer to Hirano and Imbens [34] and Liu and Kang [35].

4.2. Variables and Data

4.2.1. Core Variables

The first variable is the treatment variable, i.e., environmental regulation intensity. This study measures the carbon reduction policy intensity by dividing the target scale of the carbon reduction policy for the top 10,000 Energy-Consuming enterprises during the ‘Twelfth Five-Year Plan’ period by the production scale of enterprises in the base period. The policy intensity values fall within the range of [0, 1], with only 36 samples of the top 10,000 Energy-Consuming enterprises having a treatment intensity greater than 1. These 36 samples are winsorized to ensure that the variable values meet the requirements of the fractional logit model.
Next, the output variable, i.e., enterprise employment, comprises two elements. First, considering that external economic cycles can affect enterprise employment, this study uses the average value of the three-year total employment of enterprises in natural logarithm form as the output variable to eliminate the possible impact of economic cycles. The natural logarithm of the employment scale of enterprises in 2011, 2012, and 2013 will be examined separately in the subsequent analysis as the output variables to ensure the robustness and reliability of the conclusions. We focus on changes in total employment of enterprises ‘1 year’, ‘2 years’, and ‘3 years’ after implementing the carbon reduction policy. Second, following the research framework of Davis and Haltiwanger [33] and considering the characteristics of the study sample, total employment is decomposed into employment creation and employment destruction. Specifically, drawing on the methods used by Groizard [36] and Mao and Xu [37], employment creation (create job: c_job) is defined as c_jobit = max(ΔJit, 0), where ΔJit = lnJit − lnJit-1 and employment destruction (destroy job: d_job) is defined as d_jobit = max(−ΔJit, 0).
The covariates are represented by X. Considering the existing literature and enterprise data characteristics, the appropriate covariates selected in this study are as follows: (1) Total output: This variable accurately measures enterprises’ production scale and is a key factor in the output effect of environmental regulation. The natural logarithm is taken to eliminate the influence of scale and outliers. (2) Per capita capital: Considering enterprises’ capital density may simultaneously affect employment and energy consumption, it is estimated by dividing the end-of-year net value of fixed assets by the number of employees and taking the natural logarithm. (3) Total factor productivity (TFP): Given the constant production scale, the higher an enterprise’s TFP, the more it helps to reduce factor inputs and energy consumption as well as employment. The OP method is used to estimate the TFP of enterprises; please refer to Liu and Kang [35]. for specific estimation procedures. (4) Research and development (R&D) investment: R&D expenditure in the base period is used to differentiate enterprises’ innovation capabilities. In addition to the simultaneous impact of innovation on energy consumption and employment, innovation is one of the important transmission mechanisms through which the carbon reduction policy affects enterprise employment. It is a binary variable based on the R&D expenditure in the base period. (5) The subsidy income of enterprises is estimated using the natural logarithm. On the one hand, subsidies act as additional sources of income for enterprises, offsetting the costs generated by the carbon reduction policy and mitigating the negative impact of energy consumption regulations. On the other hand, the scale of subsidies also reflects the ‘government-enterprise relationship’ and influences the intensity of the carbon reduction policy faced by enterprises. (6) Financial condition: Estimated by dividing total liabilities by total assets of the enterprise, i.e., the debt to asset ratio. (7) Export characteristics in base period: Studies have found that export behavior can affect energy consumption and pollutant emissions of enterprises profoundly impact employment; it is defined as a 0–1 variable based on the export delivery value in the base period. Furthermore, this study further controls for factors such as enterprise age, property rights characteristics, industry characteristics (quartile code industry dummy variables), and the province of ownership (province dummy variables). The main variables are described statistically according to whether the sample belongs to the top 10,000 Energy-Consuming enterprises, as shown in Table 1.
Table 1 presents the employment scale, employment creation, and employment destruction of the 10,000 enterprises and non-10,000 enterprises. On average, significant differences exist between the two samples in terms of employment scale and employment structure changes, with the non-10,000 enterprises significantly higher than the 10,000 enterprises, particularly in employment creation and employment growth. However, this may not necessarily be the result of the carbon reduction policy but could be due to ‘self-selection effects’. Furthermore, by comparing the characteristics of the 10,000 enterprises and non-10,000 enterprises in the base period, it is clear that except for property rights characteristics, the variables of the 10,000 enterprises are higher than those of the non-10,000 enterprises. The average total production scale of the former is approximately 11 times that of the latter, and the average capital density is approximately 4.8 times. The average TFP is higher by 1.659, the average enterprise age is approximately 3.76 years higher, the proportion of R&D enterprises is approximately 2.25 times, and the proportion of export enterprises in the base period is higher by 0.18. Finally, the average subsidy income is approximately 6.5 times higher. The difference in financial condition between these two groups is not significant. This study expects to weaken this measurement bias using GPSM methods to evaluate the heterogeneous causal effects of the carbon reduction policy intensity on enterprise employment.

4.2.2. Data Source and Processing

The data used in this study consist of the China Industrial Enterprises database from 2010 to 2013 and the list of enterprises and energy-saving targets published by the National Development and Reform Commission for T10000P. This study referred to the data matching and cleaning performed by Liu and Kang [35]. to match the two databases, resulting in a successful match of 7880 top 10,000 Energy-Consuming enterprises.

5. Empirical Analysis

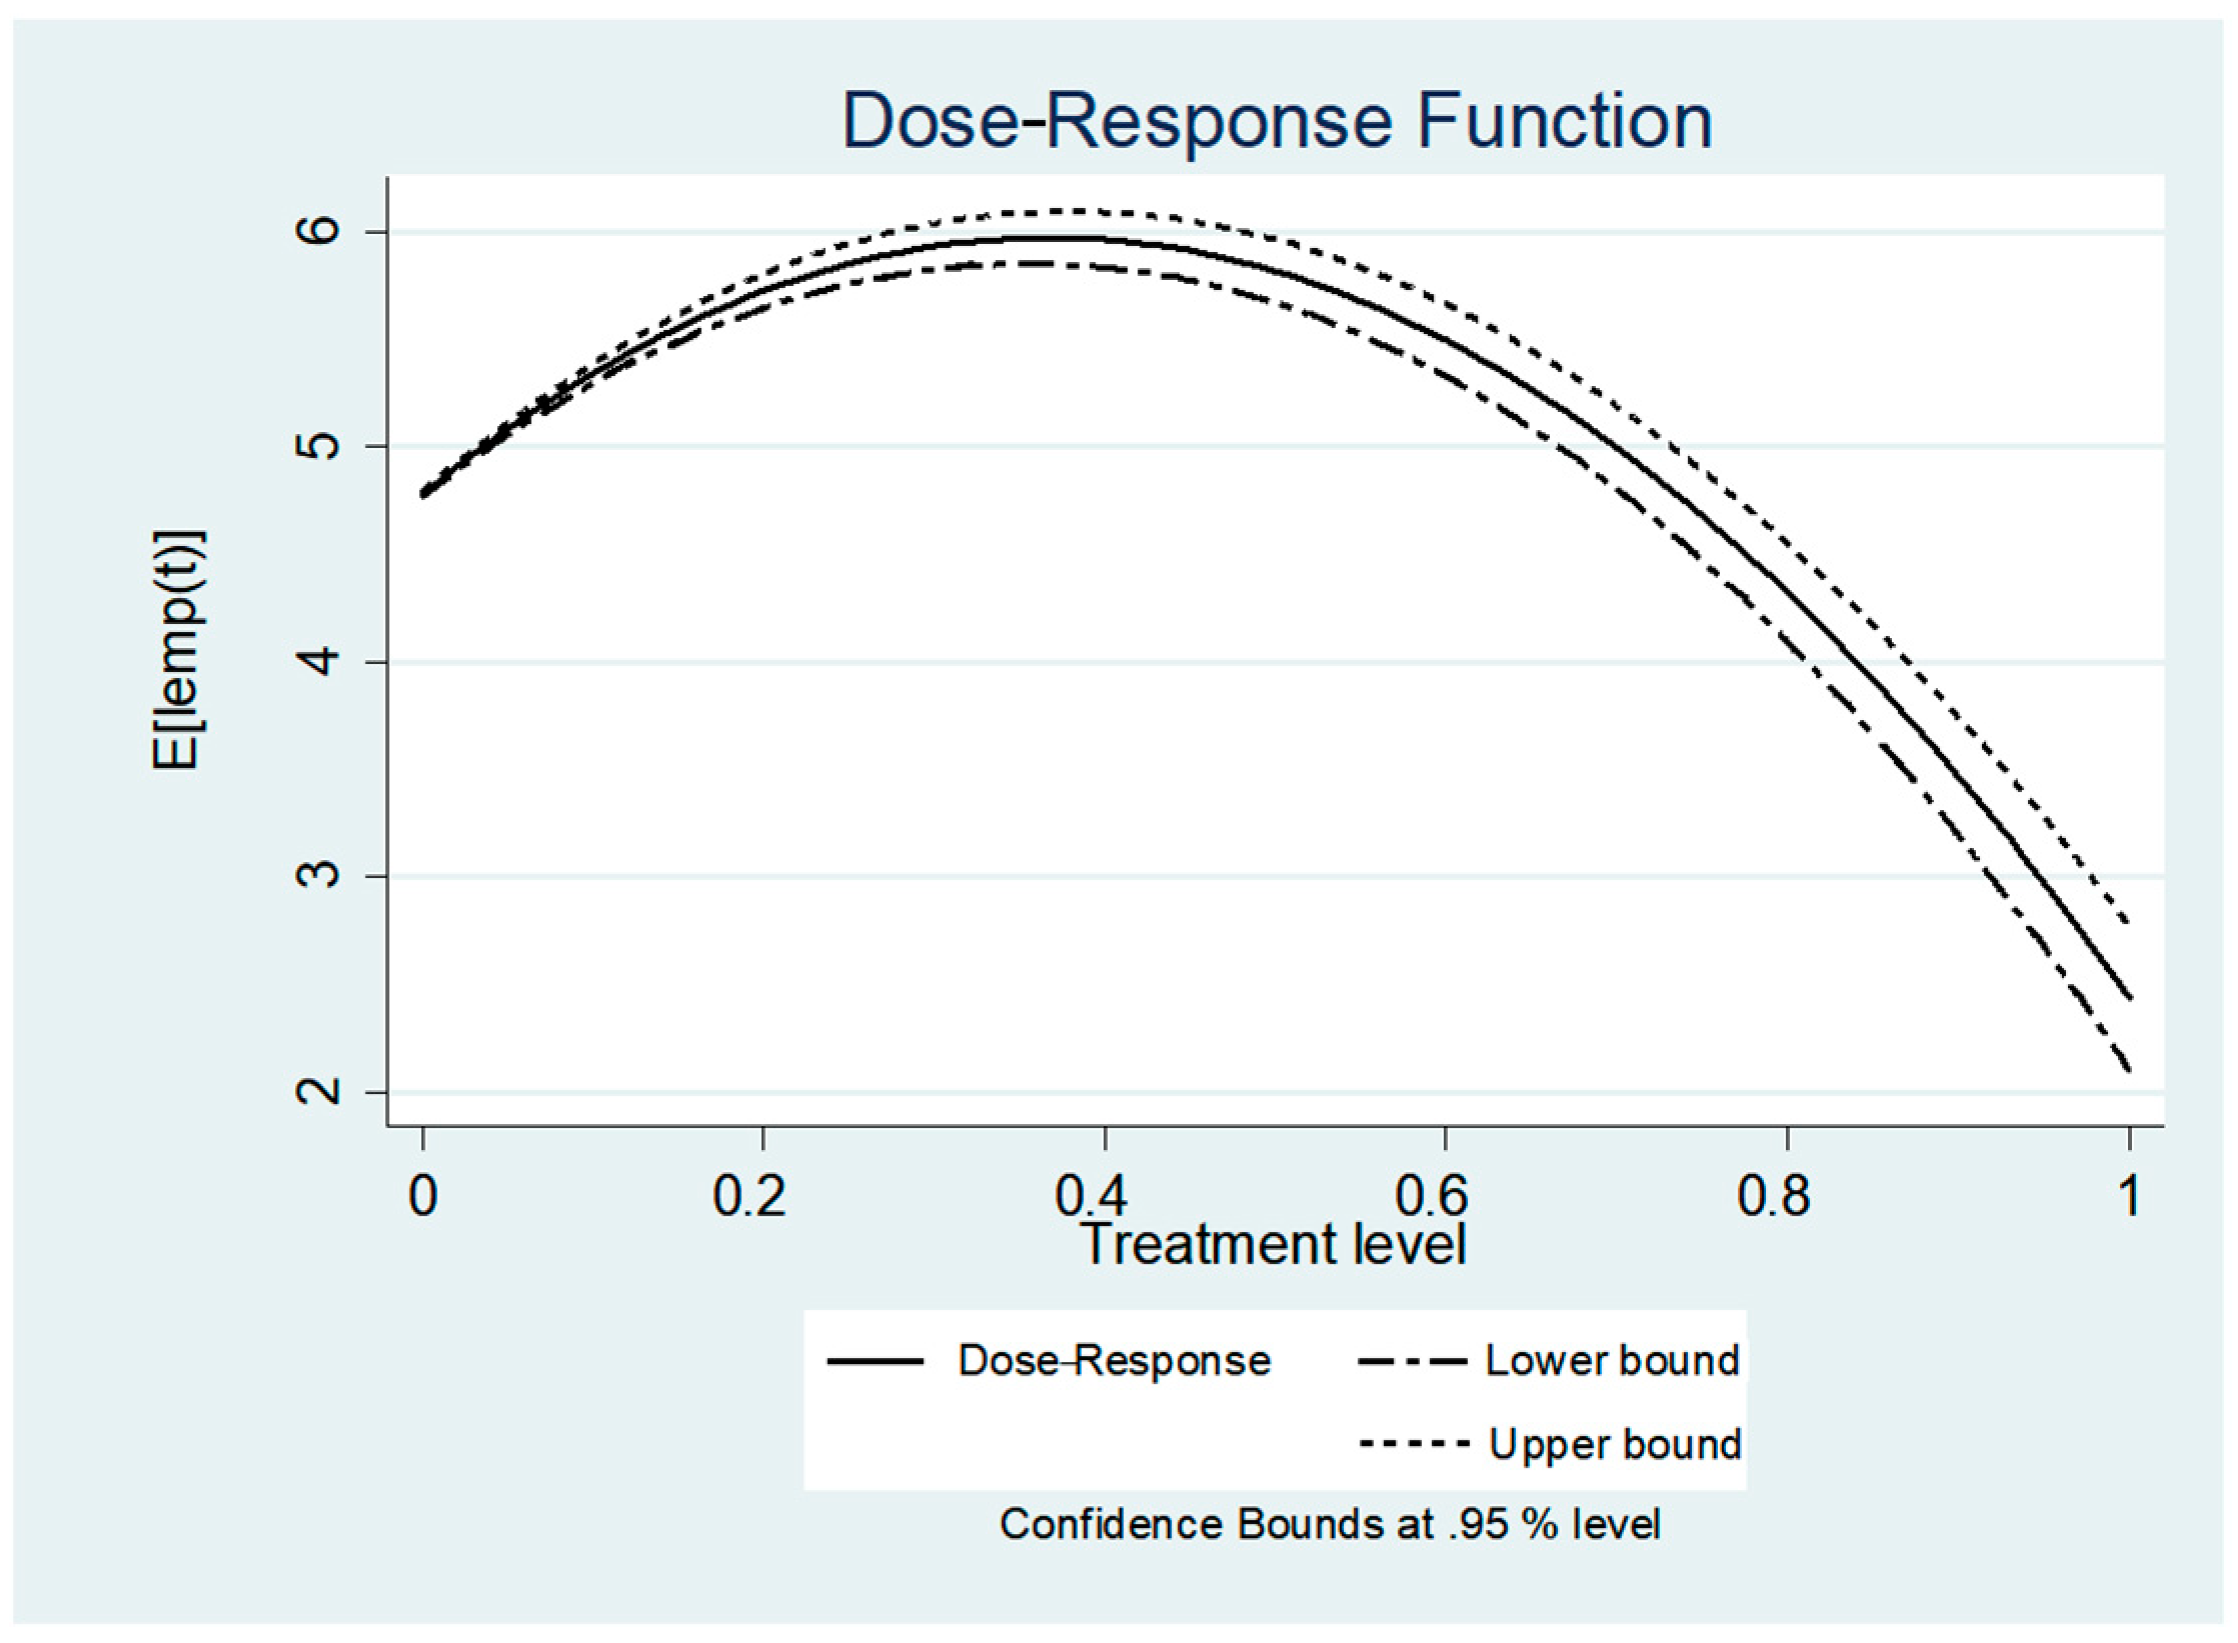
5.1. Analysis Based on Employment Scale

Hirano and Imbens [34] summarized the three main steps to implement GPSM. First, after controlling for all factors included in the covariates X, the conditional maximum likelihood estimation (QMLE), also known as the fractional logit method, is used to estimate the conditional distribution of the continuous treatment variable G (intensity of environmental regulations) and calculate the generalized propensity score based on this distribution. A balancing test is required to ensure the matching’s validity and effectiveness. Second, the outcome variable (enterprise employment) is expressed as a function of the continuous treatment variable G and the generalized propensity score variable and estimated using the least-squares method. Finally, by utilizing the estimated regression coefficients, we can obtain the causal effect of the continuous treatment variable on the outcome variable, i.e., the difference in employment between enterprises with a non-zero intensity of the carbon reduction policy and enterprises not regulated by the policy.
In the first step, the distribution of the carbon reduction policy intensity is estimated based on the fractional logit model; the estimation results are presented in Table 2. Most of the estimated coefficients for the matching variables pass the significance test, indicating the validity of the selection of matching variables, and the entire dose–response function is plotted based on the calculated GPSM values.
Based on the estimation of the carbon reduction policy intensity distribution, the GPSM is calculated, and matching is performed. Simultaneously, a balancing test must be conducted. Since the carbon reduction policy intensity is heavily skewed towards the lower end of the [0, 1] interval, this study attempts to divide the range with smaller intensity values into smaller segments and coarser segments for the range with larger intensity values. The final matching method is shown in Table 3. First, thresholds of 0.045, 0.090, 0.143, and 0.223 are selected as critical values to divide the sample firms into five groups based on the treatment intensity values. Second, within each group, the enterprises are further divided into four segments based on the average GPSM values. The groups and segmentations here correspond to the cut and nq_gps options in Stata’s GPSM commands (such as doseresponse2 or glmdose). The selection of the critical value of treatment intensity mainly considers the characteristic values of the variable distribution, such as mean, median, 75 Quantile, 90 Quantile, etc.
The second column in Table 3 reports the statistical differences in the main covariates between the 10,000 enterprises and non-10,000 enterprises samples without GPSM matching. The average values of the 10,000 enterprises are significantly higher than those of non-10,000 enterprises in almost all covariates, consistent with our intuitive judgement from Table 2. The third to seventh columns report the statistical differences in key control variables between the two types of enterprises within each treatment intensity group after GPSM matching is performed and reference objects are selected. Only a few of the 45 control variables tested in the five treatment intensity groups show significant differences, while the remaining variables show no significant differences between different groups after GPSM matching. This result indicates that using GPSM matching in this study effectively reduces the selection bias caused by observable variables.
In the second step, the employment scale of enterprises is taken as the dependent variable, while the fitted GPSM values and their squares, the intensity of environmental regulations and their squares, and the cross-terms between them are the explanatory variables. The parameter coefficients are estimated using the OLS regression method. Hirano and Imbens [34] pointed out that the specific functional form can be flexible, which can only consider the two variables’ linear terms, or quadratic, cubic terms, and interaction terms of the two variables for approximation. This study chooses a more robust second-order polynomial to approximate the conditional expectation of the output variable. The coefficients for the two variables, their squares and cross-terms, pass the significance test, shown in Table 2, the second estimation step. Due to space limitations, Table 2 only reports the regression results with employment scale as the output variable. The regression conclusions for employment creation and employment destruction as the output variables are consistent with this one, and the results are available upon request.
In the third step, using the obtained parameter coefficients from the OLS, we estimate the employment scale level of each enterprise when subjected to a regulation intensity of G and its corresponding GPSM value. The average employment scale estimated for all enterprises is also calculated and plotted as a curve, representing the average expected result when the regulation intensity is G. This study divides the range of the treatment variable G into 100 sub-intervals Gs (s = 1, 2, …, 100) based on the intensity of regulations. Then, within each sub-interval, the causal effect of regulation intensity on enterprise employment is estimated. By connecting the causal effects at different ranges, we obtain a causal effect function graph of the impact of environmental regulations on the enterprise employment scale across the entire range of regulation intensity, as shown in Figure 1.
Figure 1 presents the GPSM results for the average employment scale of enterprises over 3 years, using the base year of 2010 as the reference, representing the average dose–response function. Figure 1 shows a positive causal relationship between the intensity of environmental regulations and enterprise employment scale, indicating that the carbon reduction policy positively affects expanding enterprise employment. Moreover, the expansion of the enterprise employment scale exhibits an inverted U-shape as the intensity of environmental regulations changes. Based on the theoretical analysis mentioned earlier, the carbon reduction policy’s output or substitution effect on enterprise employment may promote or restrict the increase. Therefore, the dose–response function graph reflects the superimposition of potential promotion and restriction effects; however, we cannot currently distinguish whether the promotion or restriction effect comes from the output or substitution effect. Under the implementation of the carbon reduction policy, the overall trend of employment in the manufacturing enterprises affected by the policy shows an increase. The policy’s positive impact outweighs the negative impact, resulting in a positive treatment effect of the intensity of the carbon reduction policy. When the regulation intensity is approximately less than 0.45, the treatment effect continues to rise, indicating that the promotion effect of the carbon reduction policy surpasses the suppression effect and widens the gap between them. The promotion effect of environmental regulations on enterprise employment becomes more apparent, reaching its maximum employment scale of around 0.45; however, when the regulation intensity exceeds 0.45, the treatment effect begins to decline, indicating that the gap between the positive and negative impacts of the policy narrows. The promotion effect of environmental regulations on the enterprise employment scale weakens, but there is no negative impact. As the regulatory intensity approaches 1, the upper and lower 95% confidence intervals of the average dose–response function tend to expand slightly, mainly due to the smaller sample size of the top 10,000 Energy-Consuming enterprises under a higher carbon reduction policy intensity.

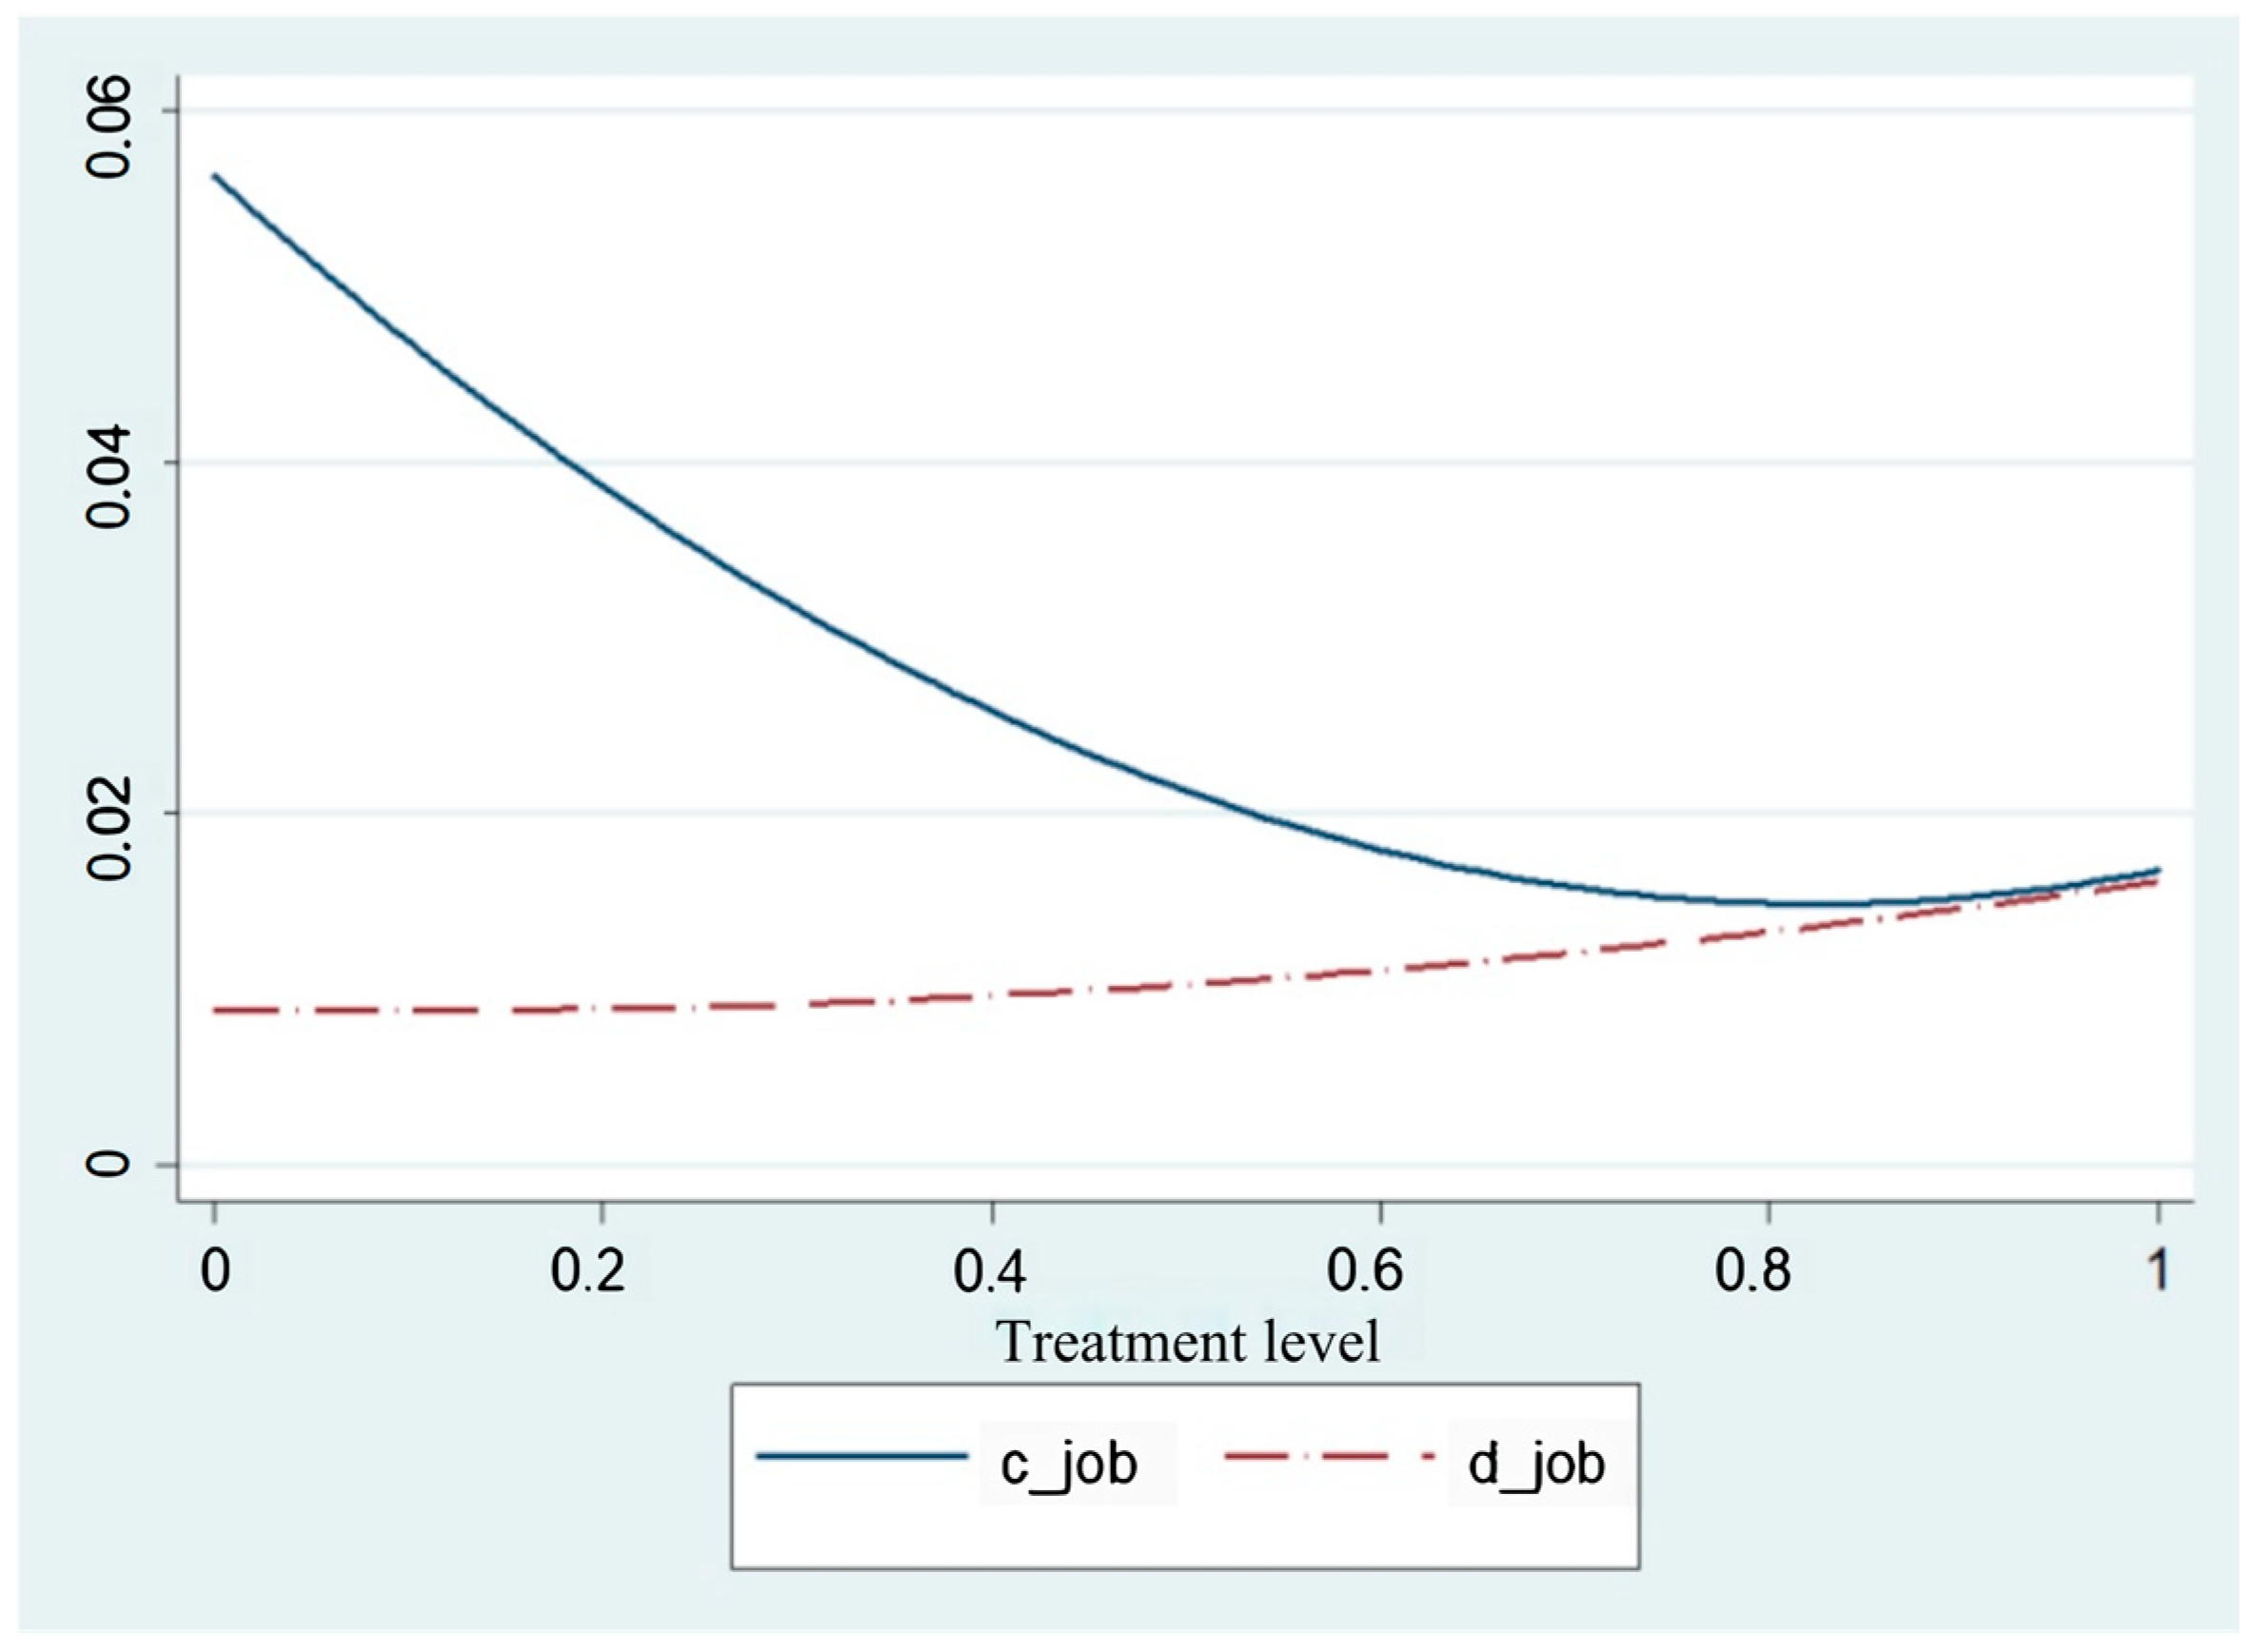
5.2. Analysis Based on Employment Structure

Theoretical analysis suggests that the output and substitution effects of the carbon reduction policy can promote and restrict enterprise employment with an indeterminate net effect. The conclusion from the previous GPSM study provides insight into the determination of the net effect. The promotion effect of the carbon reduction policy is always greater than the restriction effect, resulting in a consistently positive net effect. Sheng et al. [31] treated R&D expenditures as an intermediate variable for the substitution effect. They regarded new equipment investment and auxiliary workforce as intermediate variables for the output effect, attempting to separate and test the predominant effect mechanisms on employment through mediation models; however, the above approach is questionable because new equipment investment can be viewed as ‘green technology investment’ in the output effect and ‘introduction of clean technology’ in the substitution effect. Similar issues exist for R&D expenditures, making it difficult to distinguish between the two effects effectively. Therefore, this study decomposes the enterprise employment scale into employment creation and destruction, further analyzing the impact of the carbon reduction policy and its intensity changes on employment structure to infer possible mechanisms (see Figure 2).
First, regarding the impact of the carbon reduction policy on employment creation, the policy has a positive promoting effect; however, this effect gradually diminishes as the policy intensity strengthens, showing a roughly L-shaped pattern. Two possible explanations exist. On the one hand, based on positive output effects, if enterprises achieve environmental regulatory policy goals through green technology investment instead of production reduction, the environmental regulation will positively affect employment creation. On the other hand, based on positive substitution effects, introducing cleaner production technologies or using cleaner energy substitutes in the production process enables enterprises to achieve policy goals regarding carbon consumption. Whether adopting more energy-efficient technologies and equipment or using technologies and equipment based on clean energy, the demand for technical personnel in this area will inevitably increase; however, enterprises have limitations in technology and resources, and their capacity to adopt new technologies and make green investments is also limited, leading to a gradual weakening of their employment creation capacity as the policy intensity increases. Second, regarding the impact of the carbon reduction policy on employment destruction, a positive correlation exists between the policy and employment destruction, with a slight upward trend as environmental regulatory intensity strengthens. Stricter environmental regulations may increase operating costs, negatively affecting employment in manufacturing enterprises [4]. Although this relationship shows an increasing trend with the strengthening of policy intensity, it remains relatively stable overall, indicating that the impact of regulatory policies on employment destruction does not significantly fluctuate with changes in policy intensity. According to our research on enterprises in the Yangtze River Delta, companies generally have greater challenges reducing staff than increasing personnel. Therefore, the impact of policy changes on employment destruction is much smaller than that of employment creation. Furthermore, by comparing the results in Figure 2, it can be seen that the carbon reduction policy affects both the channels of employment creation and employment destruction and impacts overall employment levels. Combining the GPSM results indicates that regulatory policy has a positive effect on enterprise employment; however, the promoting effect tends to weaken after a certain intensity of regulatory policy.

5.3. Robustness Test Based on Regression Discontinuity Design

This study employs the regression discontinuity design (RDD) method for a robustness test, thus ensuring the reliability of the research conclusions. According to the specific implementation measures of the carbon reduction policy announced by the National Development and Reform Commission (NDRC), whether an enterprise’s carbon consumption scale exceeds 10,000 tonnes is a clear cut-off point determining whether the enterprise is subject to regulation under the carbon reduction policy. The premise of conducting RDD tests is to know the carbon consumption scale of enterprises in the base period; however, China has not yet published carbon consumption scale data of industrial enterprises nationwide. When implementing T10000P, Sichuan Province reported the carbon consumption scale data for all the 10,000 enterprise samples in Sichuan Province and partial non-10,000 enterprise samples, thus allowing this study to adopt RDD tests. A total of 1710 samples of enterprises or institutions with carbon consumption data in 2010 were reported by Sichuan Province, among which 1021 industrial enterprise samples were successfully matched. Therefore, this study conducts RDD tests based on the matched samples of Sichuan Province enterprises from 2010 to 2013; refer to Liu and Kang [35]. for specific RDD methods and settings. In the RDD test, the outcome variable is considered the employment scale of industrial enterprises after the policy implementation. The logarithm of the average employment of enterprises from 2011 to 2013 is used to measure the employment scale of enterprises and smooth the impact of economic fluctuations. As a reference variable, the carbon consumption scale of enterprises in 2010 is selected and standardized with 10,000 tonnes of standard coal as the cut-off point, i.e., the carbon consumption scale of enterprises is uniformly reduced by 10,000 tonnes; thus, the cut-off point is adjusted to a value of 0. Furthermore, covariates consistent with the GPSM test were introduced in the RDD test to ensure the robustness of the empirical conclusions. For the enterprise samples included in the group of the top 10,000 Energy-Consuming enterprises monitored by the NDRC, the policy variable value is 1; those not included automatically enter the control group, and the policy variable value is 0.
The conclusions in Table 4 show that regardless of the triangular nucleus or rectangular kernel functions and whether the covariates are controlled under the optimal bandwidth or 1/2 optimal bandwidth, the carbon reduction policy is positively correlated with the employment scale. Conversely, under the 2-fold optimal bandwidth, it fails to pass the significance test. The RDD test results are consistent with those of the GPSM test, further confirming the validity of the GPSM test settings and the robustness of the conclusions.

6. Further Extension Analysis

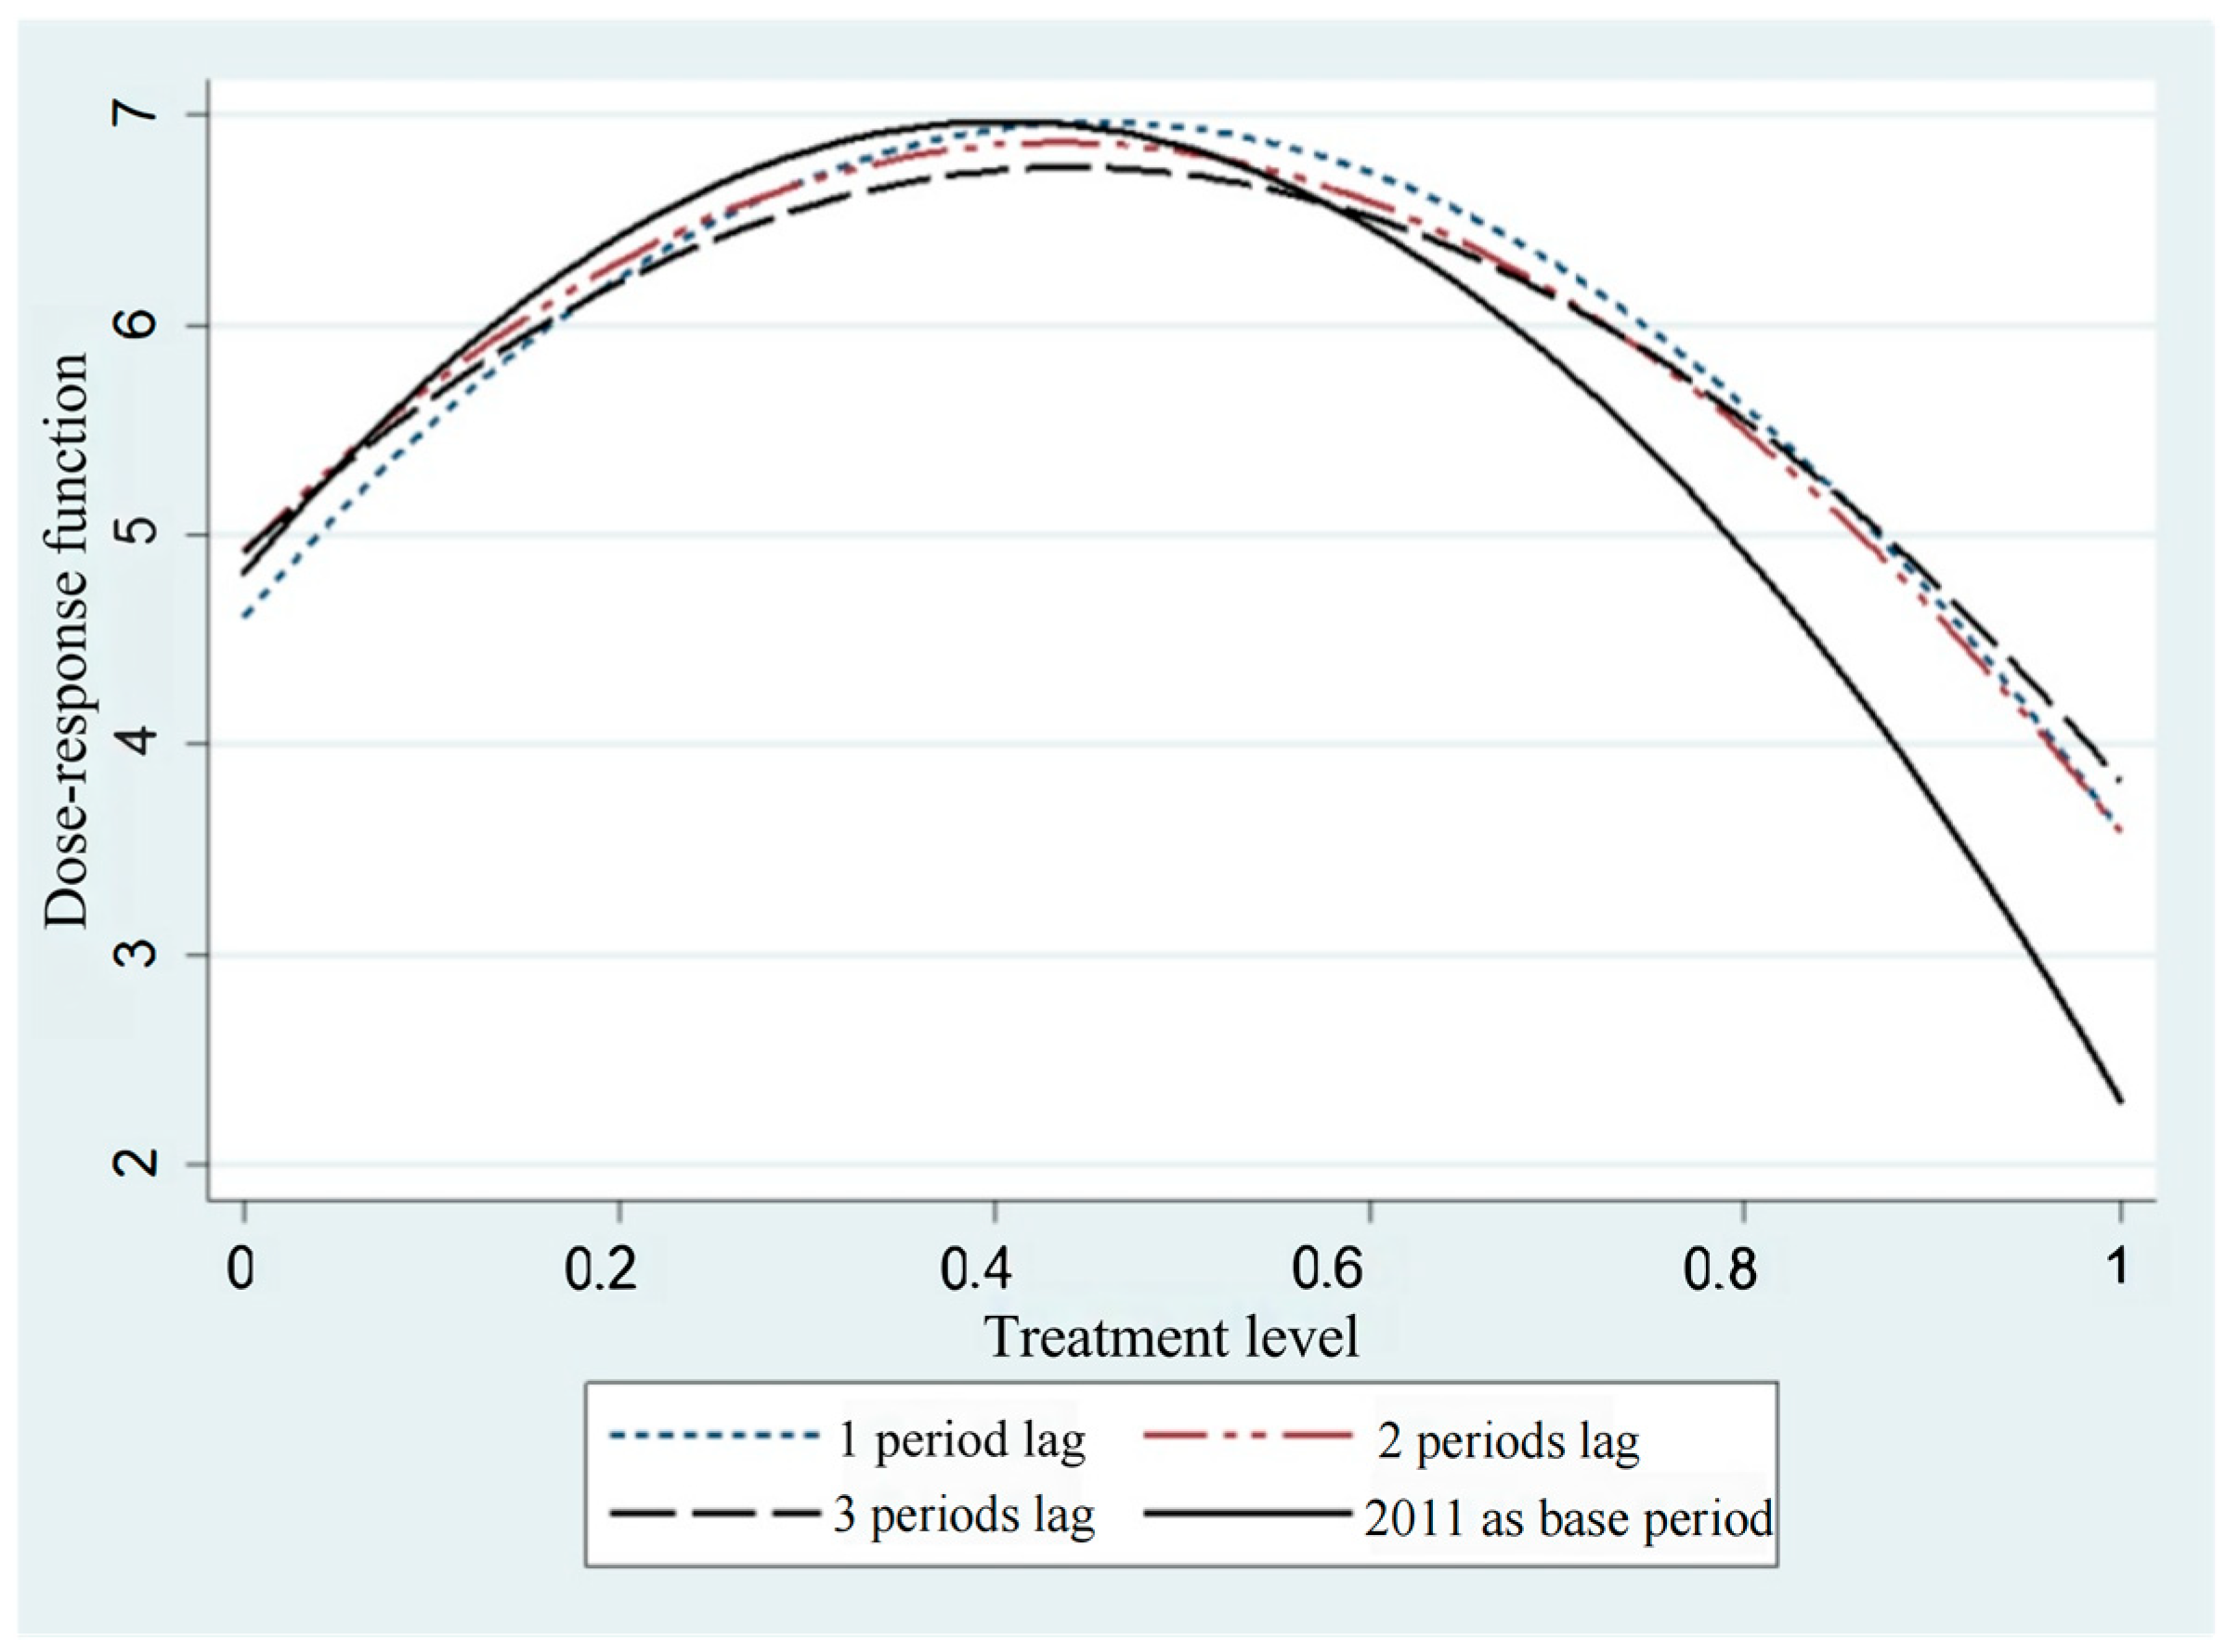
6.1. Test of the Time-Varying Treatment Effect in Different Base Periods

Previous tests used employment indicators to examine the potential impact of economic cycles on employment: The average employment levels of enterprises from 2011 to 2013. To further observe the continuity and lag effect of policy implementation, this study separately tests enterprises’ employment scale in 2011, 2012, and 2013. The empirical results shown in Figure 3 reveal the following conclusions. First, the intensity of the carbon reduction policy implementation has an inverse U-shaped relationship with the employment scale of enterprises in ‘1 year’, ‘2 years’, and ‘3 years’ later. We can infer that the basic analysis conclusions from earlier do not change over time in policy implementation, and the conclusions remain robust. Second, the dose–response functions at ‘1 year’, ‘2 years’, and ‘3 years’ later are consistent, with the maximum value of the employment scale showing a slight downward trend with policy implementation. The maximum values of the dose functions are 6.9680, 6.8706, and 6.7534, respectively, indicating that the promoting effect of the policy is most pronounced one year after implementation and gradually decreases as the policy implementation time progresses; however, the range of decrease is not significant.
Furthermore, this study also considers the potential influence of different base periods on the conclusions above. In this test, the GPSM matching of key variables is conducted using 2011 as the base year to examine the impact of the carbon reduction policy’s intensity on enterprises’ employment scale. The average employment scale of enterprises in 2012 and 2013 is taken as the dependent variable following the specific steps mentioned earlier, and the empirical results remain consistent, as shown in Figure 3. The primary conclusion of the dose–response function presenting a U-shape remains robust regardless of the choice of the base period. In conclusion, the promoting effect of the policy on employment is not affected by either considering the lag effect after policy implementation or the choice of the base period.

6.2. Further Tests Using Individual Samples

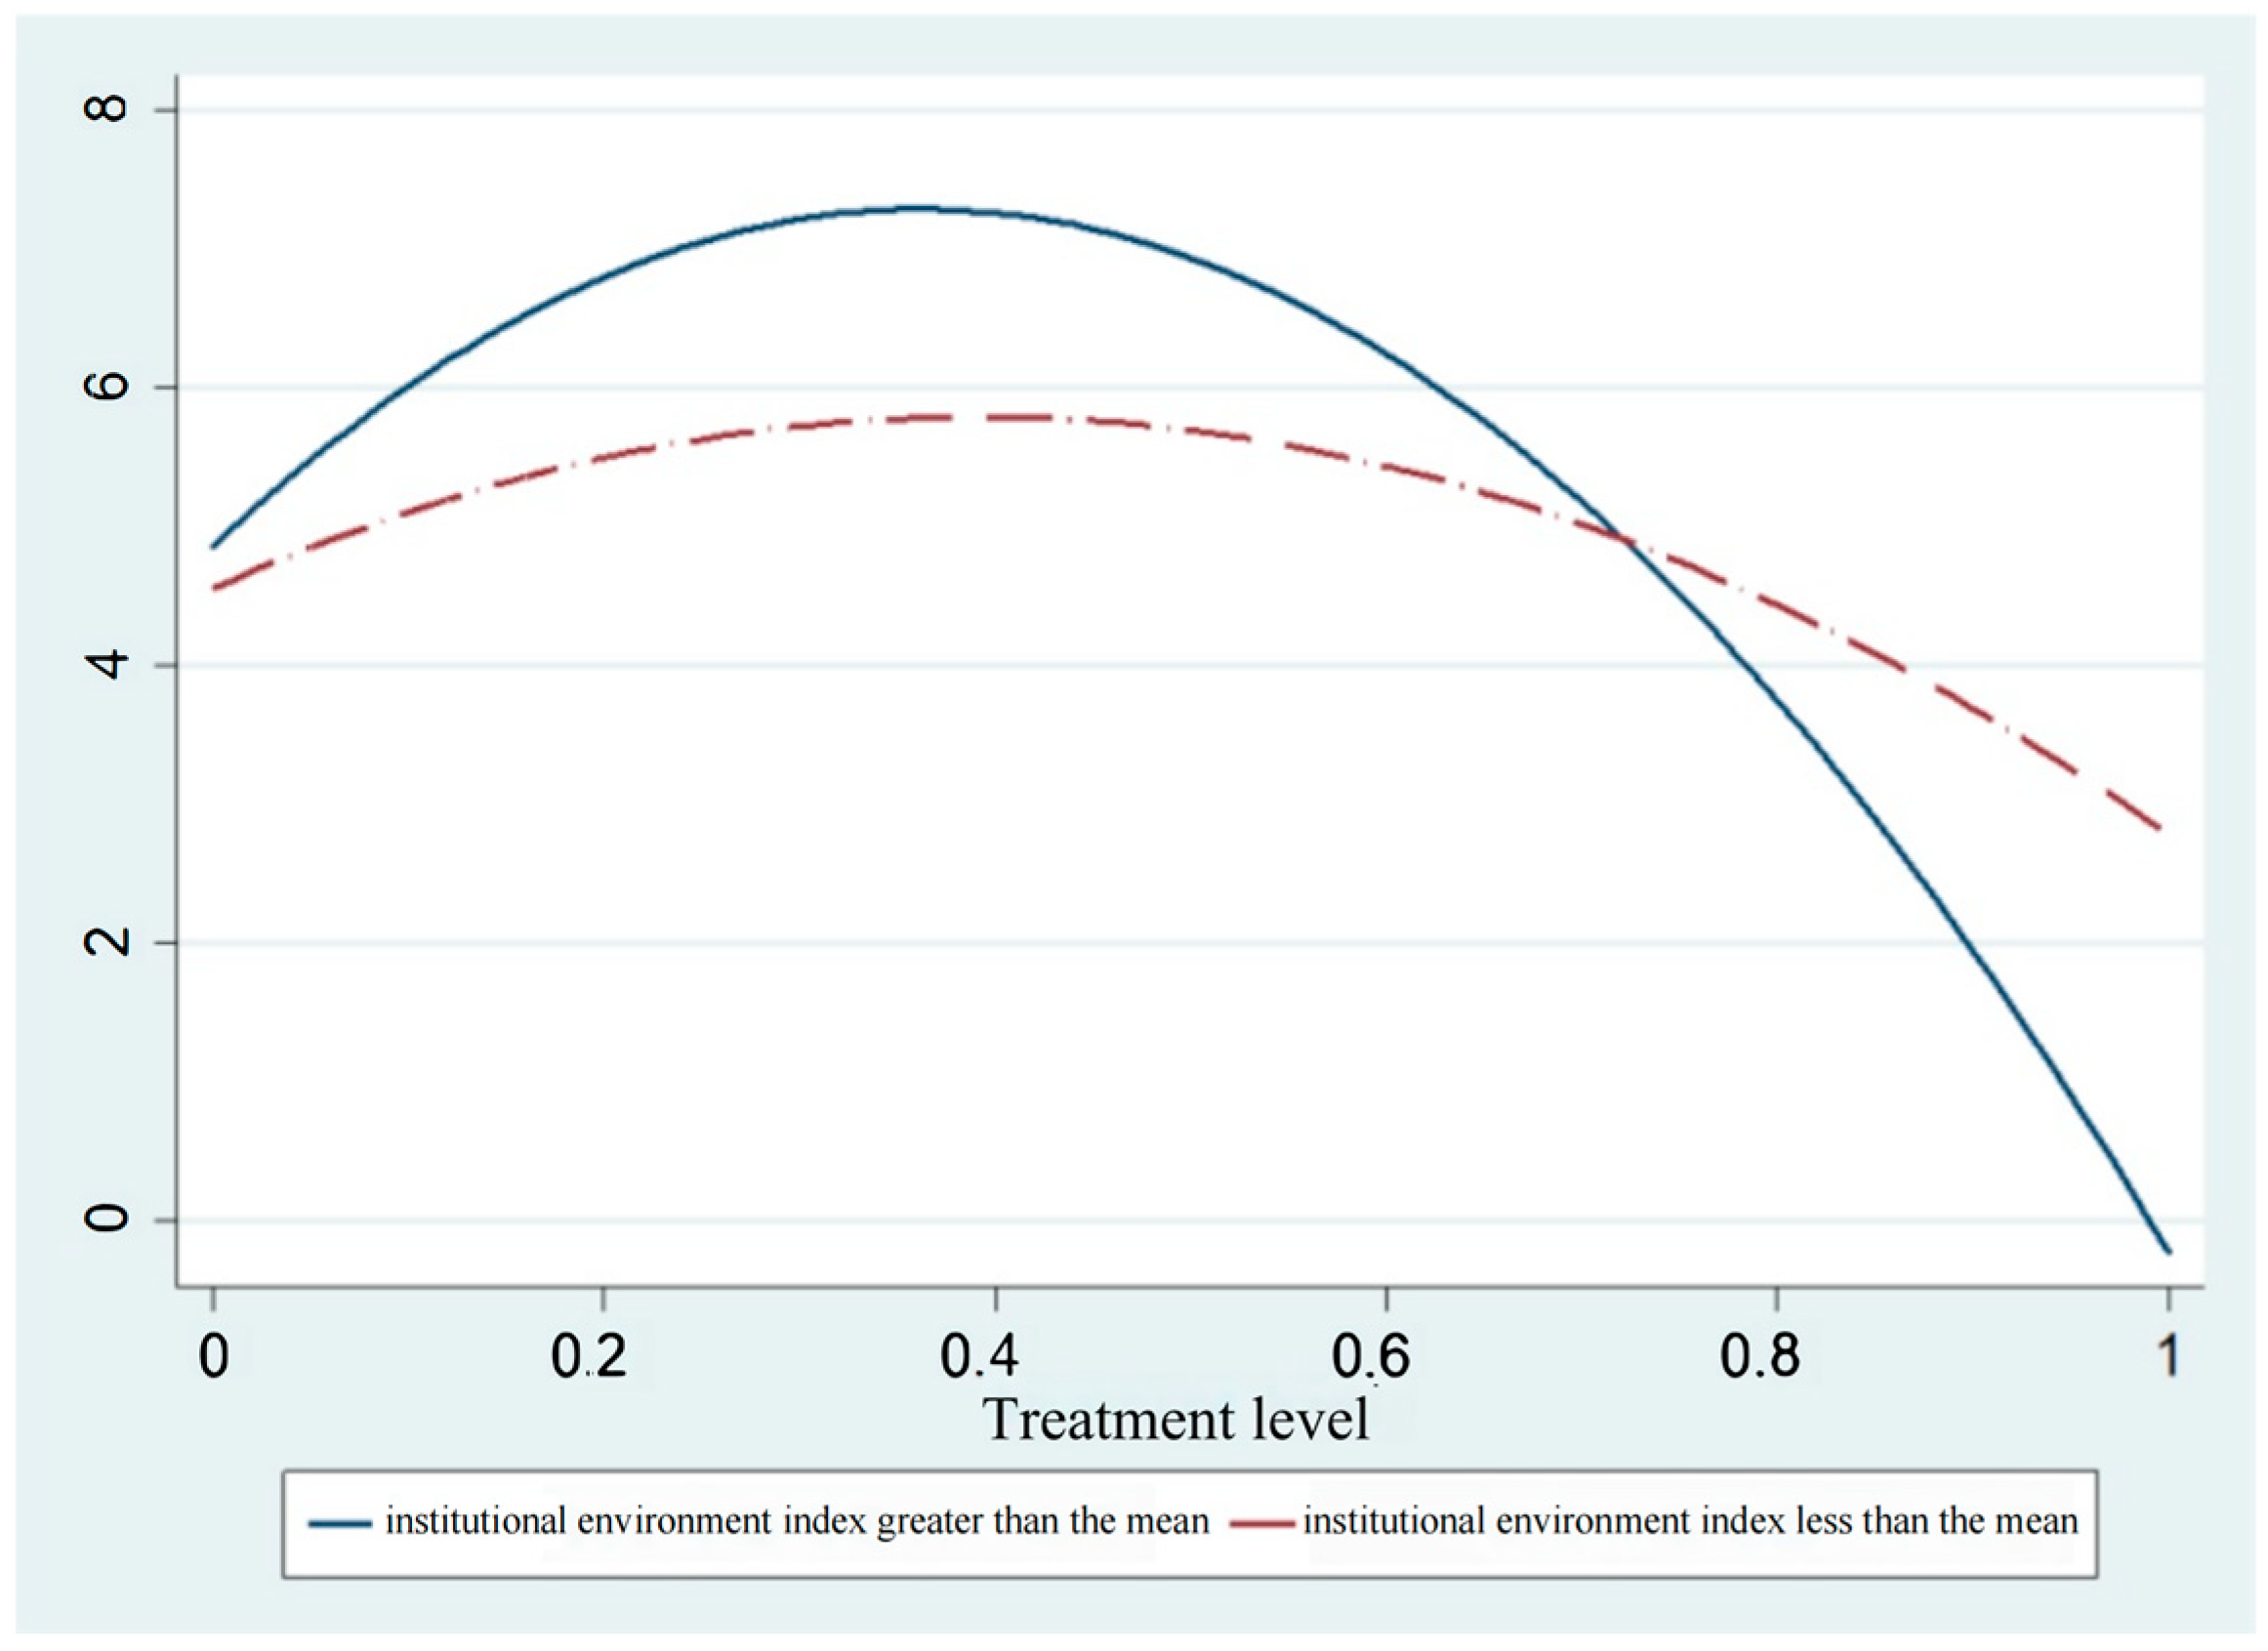
6.2.1. Does Regional Institutional Variation Affect the Impact of the Carbon Reduction Policy on Enterprise Employment?

Grossman and Helpman [38], as well as Nathan [39], argue that differences in the formulation of institutions, quality of contract execution, and efficiency of contract implementation within a country can affect the implementation of economic policies and, ultimately, economic development. This position raises the question of whether regional institutional variation in China will affect the impact of environmental regulation on enterprise employment. With China’s vast territory, institutions in different regions exhibit significant differences in initial conditions and evolutionary processes. These institutional variations influence the implementation of the carbon reduction policy and impact enterprise employment. The policy is more effectively implemented in areas with a better institutional environment, and the level of employment compliance in enterprises is higher than in other areas. Following Kang and Zhang [40], this study sets an indicator to measure the interprovincial institutional environment, i.e., inst d = market d × ( 1 diseg d ) , where market d represents the marketization index, and diseg d represents the market segmentation index for different regions in China each year. The sample is divided into two groups based on whether the interprovincial institutional environment index is greater than the mean value; one with an institutional environment index greater than the mean value and the other has an index less than the mean. The following tests use 2010 as the base year, and the average employment scale of enterprises over three years is selected as the output variable in the GPSM test. The test results are shown in Figure 4.
Figure 4 shows that both samples exhibit a characteristic inverted U-shape and are generally greater than 0, consistent with the conclusions from the previous analysis, indicating that the carbon reduction policy positively promotes enterprise employment. By comparing the graphic features of the two samples, it can be found that there are significant differences between them. Compared to the sample with an institutional environment index greater than the mean, the dose–response function of the sample with an index less than the mean is smoother. We believe that enterprises have a more flexible response to the carbon reduction policy in regions with a better institutional environment. On the one hand, green investment of enterprises and R&D activities of energy-saving and clean production technologies have high risk, long cycles, and large investments; thus, the requirements for the institutional environment are inevitably very high. A mature and well-functioning institutional environment can effectively promote the R&D of energy-saving and clean production technologies or help spread the risks associated with technology development. In provinces with better institutional environments, enterprises have higher levels of independent innovation capabilities [40], enabling them to engage in green investment and R&D and use energy-saving and clean production technologies; therefore, such enterprises have a stronger ability to create employment. On the other hand, regions with better environmental institutions have more regulated labor markets. Additionally, contracts like enterprise employment can be better enforced, and enterprises find it relatively easier to establish contractual relationships with employees. As regulations gradually become stricter, enterprises in these regions can more flexibly increase their employment scales. When the intensity of the policy regulation exceeds the optimal range, enterprises can adjust their employment scales accordingly, indicating a more elastic response to changes. In conclusion, the institutional environment is an essential factor affecting environmental regulation’s impact on enterprise employment.

6.2.2. Does Ownership Type Affect the Impact of the Carbon Reduction Policy on Enterprise Employment?

This study divides the sample into three sub-samples based on the ownership attributes of the enterprises: State-owned enterprises, foreign-funded enterprises (including Hong Kong, Macao, and Taiwan), and private enterprises. This approach allows us to examine whether differences exist in the response of different ownership types to the carbon reduction policy. Figure 5 shows that the dose–response curves of all three types of enterprise samples generally exhibit an inverted U-shape, indicating that the carbon reduction policy positively affects enterprise employment to varying degrees in all three samples. The dose–response curve of the state-owned enterprise sample shows the highest value, followed by the foreign-funded enterprise sample; the private enterprise sample shows the lowest value. These results suggest that the impact of the carbon reduction policy on state-owned enterprises is the largest, followed by foreign-funded enterprises, while private enterprises are affected to a lesser extent. The extant research suggests that private enterprises in China have relatively lower innovation capabilities and willingness; therefore, their ability to increase employment through green investment and R&D and use energy-saving and clean production technologies is the weakest. Based on the ‘pollution haven hypothesis’, differences in environmental regulations among regions are an essential factor affecting the location selection of pollution-inducing industries. According to a simple comparison of the energy consumption ratio in T10000P of Sichuan Province, foreign-funded enterprises have an average energy consumption ratio of 7.58% higher than non-foreign-funded enterprises. Although the data samples are limited, this still reflects that foreign-funded enterprises have higher energy consumption; therefore, under the same policy intensity, the impact of the carbon reduction policy on foreign-funded enterprises will be more significant than that on state-owned enterprise samples.

6.2.3. Does Industry Difference Affect the Impact of the Carbon Reduction Policy on Enterprise Employment?

This study refers to the approach of Shen [41] to test whether the impact of the carbon reduction policy on enterprise employment in different pollution-inducing industries has heterogeneity, distinguishing all samples into pollution-inducing industry samples and clean industry samples. We further examine the validity of the above conclusions under environmental regulations and whether there are significant differences.
Figure 6 presents that both the high pollution-inducing and clean industry samples exhibit dose–response curves that roughly resemble an inverted U-shape, indicating that the promotion effect of the carbon reduction policy on enterprise employment still holds in both types of samples. Comparing the graphic features of the two samples shows little difference in the dose–response curves of the high pollution-inducing industry and the clean industry samples. The maximum point of the treatment effect for the pollution-inducing industry sample is 5.99, while for the clean industry sample, it is 6.18. The former performs significantly better than the latter in terms of the positive effect of the regulation intensity range and level, consistent with the findings of Lu [22]. We believe that in addition to being constrained by the carbon reduction policy, the top 10,000 Energy-Consuming enterprises in pollution-inducing industries are also subject to other environmental policies. The pressure exerted by the carbon reduction policy is even greater for these enterprises, resulting in a stronger incentive for them to engage in green investment and R&D and use energy-saving and clean production technologies.

7. Policy Implications

The findings of this study have significant policy implications.
First, when formulating environmental regulation policies, the Chinese government can further raise standards. Environmental regulation policies, including the carbon reduction policy, may not necessarily reduce the overall employment of manufacturing enterprises. The key lies in striking a balance in policy intensity to achieve the dual goals of economic development and environmental optimization. The determination of the intensity of environmental policies is crucial for successful policy implementation. In the context of the rise of big data and artificial intelligence, policy-making departments need to conduct in-depth research and evaluation of enterprises and develop differentiated policies based on the specific characteristics of different industries and regions. The approach of “trial and error” and “dynamic adjustment” should be utilized to continuously optimize environmental regulation policies.
Second, enterprises should have a certain level of flexibility in response to the pressures of environmental regulation policies, but they also require a certain amount of time to respond and adjust. Policy makers should maintain the continuity and coherence of policies, avoiding unnecessarily high costs caused by frequent policy adjustments. At the same time, a “one-size-fits-all” environmental policy may be a drastic measure for the government to address environmental degradation. However, from the perspective of achieving a “win-win” situation of economic development and environmental improvement, this may not be the best choice. It is necessary to fully consider the requirements of environmental protection in different regions and the capacity of enterprises in different industries and formulate flexible and effective environmental protection policies and enforcement intensity.
Third, the key to helping enterprises overcome the “pain” of environmental policies lies in effectively stimulating and encouraging green investments and the development of energy-saving and clean production technologies, in order to avoid the negative impact of environmental regulations on employment. The corresponding supporting policies during the implementation of the carbon reduction policy should revolve around effectively promoting technological innovation in enterprises. In other words, the implementation path of balancing environmental improvement goals and economic development goals should organically combine “blocking” and “guiding”. By formulating comprehensive environmental regulation policies, the “leaks” in environmental aspects of enterprise development can be addressed. Coupled with corresponding financial and tax policies, active “guidance” should be provided to encourage green investments and the development of energy-saving and clean production technologies, helping enterprises effectively transform “environmental pressures” into “innovation drivers”. This represents a crucial focal point for the implementation of government environmental policies.

8. Conclusions

Based on the Top 10,000 Energy-Consuming Enterprises Program implemented by the Chinese government in 2011, this study uses the GPSM method to examine the impact of environmental regulations and policy intensity on enterprise employment in the Chinese manufacturing industry. The results are as follows. First, the carbon reduction policy positively affects enterprise employment, and the relationship between policy intensity and enterprise employment follows an inverted U-shape. Second, the carbon reduction policy affects total enterprise employment through employment creation and destruction channels. Third, the impact of the carbon reduction policy on enterprise employment varies heterogeneously for different types of enterprises and is influenced by factors such as institutional environment, ownership types, and industry pollution characteristics. A series of robustness and subgroup tests further support the robustness of these findings. Due to the limited availability of microlevel data, most existing research relies on industry or regional data, and this study is no exception. With China’s high-quality economic development demanding stricter environmental requirements, research on environmental policies and enterprise employment becomes even more important. It requires more detailed research from a larger scope of representative policies, which points out the direction for our future research.

Author Contributions

Conceptualization, X.L. and Z.K.; methodology, X.L.; software, Z.K.; validation, X.L. and Z.K.; formal analysis, Z.K.; investigation, X.L.; resources, Z.K.; data curation, Z.K.; writing—original draft preparation, X.L. and Z.K.; writing—review and editing, X.L.; visualization, X.L.; supervision, X.L.; project administration, X.L.; funding acquisition, X.L. and Z.K. All authors have read and agreed to the published version of the manuscript.

Funding

This research was funded by [the Ministry of Education of the People’s Republic of China Humanities and Social Sciences Youth Foundation] grant number [20YJC630089]; [Philosophy and Social Science Fund of Education Department of Jiangsu Province] grant number [2019SJA1807]; [the Social Sciences Foundation of Jiangsu Province] grant number [21EYB001]; [the Ministry of Education of the People’s Republic of China Humanities and Social Sciences General Foundation] grant number [22YJA790029]; and [Sub Project of Major Project of National Social Science Foundation of the People’s Republic of China] grant number [21ZDA022].

Institutional Review Board Statement

Not applicable.

Informed Consent Statement

Not applicable.

Data Availability Statement

Not applicable.

Conflicts of Interest

The authors declare no conflict of interest.

References

  1. Porter, M.E.; Linde, C.V.D. Toward a New Conception of the Environment-Competitiveness Relationship. J. Econ. Perspect. 1995, 9, 97–118. [Google Scholar] [CrossRef]
  2. Gray, W.B.; Shadbegian, R.J.; Wang, C.; Meral, M. Do EPA regulations affect labor demand? Evidence from the pulp and paper industry. J. Environ. Econ. Manag. 2014, 68, 188–202. [Google Scholar] [CrossRef]
  3. Liu, M.; Shadbegian, R.; Zhang, B. Does environmental regulation affect labor demand in China? Evidence from the textile printing and dyeing industry. J. Environ. Econ. Manag. 2017, 86, 277–294. [Google Scholar] [CrossRef]
  4. Chen, Z.; Kahn, E.; Liu, Y.; Wang, Z. The Consequences of Spatially Differentiated Water Pollution Regulation in China. J. Environ. Econ. Manag. 2018, 88, 468–485. [Google Scholar] [CrossRef]
  5. Berman, E.; Bui, L.T. Environmental regulation and labor demand: Evidence from the south coast air basin. J. Public Econ. 2001, 79, 265–295. [Google Scholar] [CrossRef]
  6. Wu, X.; Cao, Y.; Xiao, Y.; Gu, J. Finding of urban rainstorm and waterlogging disasters based on microblogging data and the location-routing problem model of urban emergency logistics. Ann. Oper. Res. 2018, 290, 865–896. [Google Scholar] [CrossRef]
  7. Zhang, K.M.; Wen, Z.G. Review and challenges of policies of environmental protection and sustainable development in China. J. Environ. Manag. 2008, 88, 1249–1261. [Google Scholar] [CrossRef]
  8. Jin, Y.; Andersson, H.; Zhang, S. Air Pollution Control Policies in China: A Retrospective and Prospects. Int. J. Environ. Res. Public Health 2016, 13, 1219. [Google Scholar] [CrossRef]
  9. Yu, X.; Yu, X.; Lu, Y. Evaluation of an Agricultural Meteorological Disaster Based on Multiple Criterion Decision Making and Evolutionary Algorithm. Int. J. Environ. Res. Public Health 2018, 15, 612. [Google Scholar] [CrossRef]
  10. Alford, W.P. Law, law, what law? Mod. China 1997, 23, 398. [Google Scholar] [CrossRef]
  11. Deschenes, O. Climate Policy and Labor Markets; National Bureau of Economic Research, Inc.: Cambridge, MA, USA, 2010. [Google Scholar]
  12. Greenstone, M. The Impacts of Environmental Regulations on Industrial Activity: Evidence from the 1970 and 1977 Clean Air Act Amendments and the Census of Manufactures. J. Political Econ. 2002, 110, 1175–1219. [Google Scholar] [CrossRef]
  13. Walker, W.R. Environmental Regulation and Labor Reallocation: Evidence from the Clean Air Act. Am. Econ. Rev. 2011, 101, 442–447. [Google Scholar] [CrossRef]
  14. Kahn, M.E.; Mansur, E.T. Do local energy prices and regulation affect the geographic concentration of employment? J. Public Econ. 2013, 101, 105–114. [Google Scholar] [CrossRef]
  15. Bezdek, R. Environment and economy: Whats the bottom line? Environ. Sci. Policy Sustain. Dev. 1993, 35, 25–32. [Google Scholar] [CrossRef]
  16. Bosquet, B. Environmental tax reform: Does it work? A survey of the empirical evidence. Ecol. Econ. 2000, 34, 19–32. [Google Scholar] [CrossRef]
  17. Marx, A. Ecological Modernization, Environmental Policy and Employment. Can Environmental Protection and Employment be Reconciled? Innov. Eur. J. Soc. Sci. Res. 2000, 13, 311–325. [Google Scholar] [CrossRef]
  18. Cole, M.A.; Elliott, R.J. Do Environmental Regulations Cost Jobs? An Industry-Level Analysis of the UK. BE J. Econ. Anal. Policy 2007, 7, 1–27. [Google Scholar] [CrossRef]
  19. Ferris, A.E.; Shadbegian, R.J.; Wolverton, A. The Effect of Environmental Regulation on Power Sector Employment: Phase I of the Title IV SO2 Trading Program. J. Assoc. Environ. Resour. Econ. 2014, 1, 521–553. [Google Scholar] [CrossRef]
  20. Abrell, J.; Faye, A.N.; Zachmann, G. Assessing the Impact of the EU ETS Using Firm Level Data. Working Papers of BETA, 2011–15, Bureau d’Economie Théorique et Appliquée, UDS, Strasbourg. Available online: https://beta.u-strasbg.fr/WP/2011/2011-15.pdf (accessed on 9 August 2023).
  21. Ghana, H.S.; Li, S.; Zhang, F. Firm competitiveness and the European Union emissions trading scheme. Energy Policy 2013, 63, 1056–1064. [Google Scholar]
  22. Lu, Y. Green Policies and Jobs in China: A Double Dividend? Econ. Res. J. 2011, 46, 42–54. [Google Scholar]
  23. Sun, W.; Yang, Q.; Ni, Q.; Kim, Y. The impact of environmental regulation on employment: An empirical study of China’s Two Control Zone policy. Environ. Sci. Pollut. Res. Int. 2019, 26, 26472–26487. [Google Scholar] [CrossRef] [PubMed]
  24. Shi, M.; Wang, Y. Environmental Regulation Difference, Industry Characteristics and Employment Dynamic. South China J. Econ. 2016, 7, 48–62. [Google Scholar]
  25. Yuan, Y.; Xie, R. Research on the Effect of Environmental Regulation to Industrial Restructuring—Empirical Test Based on Provincial Panel Data of China. China Ind. Econ. 2014, 8, 57–69. [Google Scholar]
  26. Chen, C.; He, K.; Yin, X. An Empirical Research of the Impact of Environmental Regulation on Employment in China. Popul. Soc. 2014, 30, 9–14+75. [Google Scholar]
  27. Sun, W.; Yang, Q. The Impact of Environmental Regulation on Employment: An Empirical Study Based on TCZ Policy in China. J. Audit Econ. 2017, 32, 96–107. [Google Scholar]
  28. Yan, W.; Guo, S. How Does Environmental Regulation Affect Employment—An Empirical Research Based on Mediating Effect Model. Collect. Essays Financ. Econ. 2016, 10, 105–112. [Google Scholar]
  29. Li, M.; Du, W. The impact of environmental regulation on the employment of enterprises: An empirical analysis based on scale and structure effects. Environ. Sci. Pollut. Res. Int. 2022, 29, 21705–21716. [Google Scholar] [CrossRef]
  30. Zhong, S.; Xiong, Y.; Xiang, G. Environmental regulation benefits for whom? Heterogeneous effects of the intensity of the environmental regulation on employment in China. J. Environ. Manag. 2021, 281, 111877. [Google Scholar] [CrossRef]
  31. Sheng, J.; Zhou, W.; Zhang, S. The role of the intensity of environmental regulation and corruption in the employment of manufacturing enterprises: Evidence from China. J. Clean. Prod. 2019, 219, 244–257. [Google Scholar] [CrossRef]
  32. Busse, M. Trade, Environmental Regulations and the World Trade Organization: New Empirical Evidence. J. World Trade 2004, 38, 285–306. [Google Scholar] [CrossRef]
  33. Davis, S.J.; Haltiwanger, J. Gross Job Creation, Gross Job Destruction, and Employment Reallocation. Q. J. Econ. 1992, 107, 819–863. [Google Scholar] [CrossRef]
  34. Hirano, K.; Imbens, G.W. The Propensity Score with Continuous Treatments; Wiley-Blackwell: Hoboken, NJ, USA, 2004. [Google Scholar] [CrossRef]
  35. Liu, X.; Kang, Z. Environmental Policy and Exports in China: An Analysis Based on the Top 10,000 Energy Consuming Enterprises Program. Sustainability 2022, 14, 14157. [Google Scholar] [CrossRef]
  36. Groizard, J.L.; Ranjan, P.; Rodriguez-Lopez, A. Trade Costs and Job Flows: Evidence from Establishment-Level Data. Econ. Inq. 2015, 53, 173–204. [Google Scholar] [CrossRef]
  37. Mao, Q.; Xu, J. Input Trade Liberalization and Manufacturing Job Dynamics. Econ. Res. J. 2016, 51, 69–83. [Google Scholar]
  38. Grossman, G.M.; Helpman, E. Innovation and Growth in the Global Economy; MIT Press: Cambridge, MA, USA, 1993; pp. 323–324. [Google Scholar]
  39. Nathan, N. Relationship-Specificity, Incomplete Contracts, and the Pattern of Trade. Sch. Artic. 2007, 122, 569–600. [Google Scholar]
  40. Kang, Z.; Zhang, J. Impact of Institution on Independent Innovation of Domestic Manufacturing Enterprises—An Empirical Study on Chinese Domestic Enterprises. R&D Manag. 2010, 22, 103–111. [Google Scholar]
  41. Shen, N.; Liu, F. Can Intensive Environmental Regulation Promote Technological Innovation? Porter Hypothesis Reexamined. China Soft Sci. 2012, 4, 49–59. [Google Scholar]
Figure 1. Dose–response function based on enterprise employment scale.
Sustainability 15 13867 g001
Figure 2. Dose–response function based on enterprise employment structure changes.
Sustainability 15 13867 g002
Figure 3. Treatment effect changes over time and dose–response functions in different base periods.
Sustainability 15 13867 g003
Figure 4. Dose–response function of enterprise samples under different institutional environments.
Sustainability 15 13867 g004
Figure 5. Dose–response functions of enterprise samples with different ownership.
Sustainability 15 13867 g005
Figure 6. Dose–response function of enterprise samples from different industries.
Sustainability 15 13867 g006
Table 1. Descriptive statistics of the main variables.
VariableThe 10,000 Enterprises GroupNon 10,000 Enterprises Group
MeanStandard Error25th75thMeanStandard Error25th75th
Intensity of the carbon reduction policy0.03080.08390.00220.0248
Total employment4.01661.25653.17814.82034.84801.28313.98905.6699
Employment creation0.01260.09880.00000.00000.02470.07300.00000.0000
Employment destruction0.01110.06910.00000.00000.01910.11160.00000.0000
Total output13.55151.701912.467914.639111.17041.334310.337111.9859
Per capita capital4.67781.50653.59475.63913.28091.40862.29454.0773
TFP7.99131.28937.13508.77966.33181.10875.58797.0245
Financial condition0.91500.63360.54300.92450.84390.60280.48540.9277
Age11.700513.48893.000013.00007.15457.94463.00009.0000
Export in the base period0.60450.48900.00001.00000.42760.49470.00001.0000
R&D0.38530.48670.00001.00000.17130.37680.00000.0000
Subsidy2.73463.74090.00006.47850.86852.11330.00000.0000
Domestic enterprises0.31330.46390.00001.00000.49310.49990.00001.0000
Data source: The database of manufacturing enterprises.
Table 2. Results of the first and second steps of GPSM.
The First StepThe Second Step
VariableCoefficient/
Standard Error
VariableCoefficient/
Standard Error
Total output8.72 × 10 11 **treat3.79793 ***
(2.42) (8.20)
TFP−3.31 × 10 7 ***treat_sq−8.82752 ***
(−5.18) (−30.17)
Per capita capital0.00002gps−187.25571 ***
(0.65) (−48.16)
Financial condition−0.00105 ***gps_sq840.33732 ***
(−9.92) (29.72)
Age−0.00002 **treat_gps1242.907 ***
(−1.96) (7.29)
Export−0.00318 ***Constant term5.17335 ***
(−7.50) (608.17)
R&D−0.00081 ***
(−4.02)
Subsidy0.00034 ***
(10.42)
Domestic enterprises−0.00075 ***
(−5.82)
Constant term−0.00144 ***
(−3.20)
AIC0.0275267 -
Industry fixed effectYes -
Province fixed effectYes -
N72,817 72,817
The likelihood function values−2873.970407 -
Note: Z value are in parentheses; ** = p < 0.05 and *** = p < 0.01.
Table 3. Balance condition test for GPSM.
Balance Condition TestWithout GPSM AdjustmentInterval Segmentation of the Carbon Reduction Policy Intensity
[0, 0.045](0.045, 0.090](0.090, 0.143](0.143, 0.223](0.223, 1]
Total output1.870 ***0.85720.7958−0.19320.89650.8983
(95.33)(0.147)(−1.533)(−0.181)(0.573)(0.864)
Per capita capital1.234 ***0.0078−0.00550.1752−0.0327−0.0882
(60.14)(0.061)(−0.079)(1.569)(−0.221)(0.841)
TFP1.457 ***1.4018 ***−0.62790.77382−0.49061.8979 ***
(85.70)(3.342)(−1.374)(1.079)(0.519)(2.871)
Age3.084 ***−0.7938−0.52360.73490.99401.2062 **
(25.53)(−1.252)(−1.439)(1.272)(1.292)(2.2137)
Export0.040 ***−0.06650.0017−0.0038−0.02210.1896
(6.06)(−0.474)(0.259)(−0.351)(−1.522)(1.854) *
R&D0.1090 ***0.00110.00130.00120.00140.0017
(20.69)(0.440)(1.2543)(0.653)(0.714)(1.1893)
Subsidy1.519 ***−1.1 × 10 6 3.8 × 10 6 −3.8 × 10 6 −1.4 × 10 5 5.6 × 10 6
(47.09)(−0.045)(0.413)(−0.259)(0.710)(0.418)
Ownership−0.139 ***0.03470.0455 *0.03730.07670.1054 ***
(−19.50)(−0.783)(1.948)(1.03)(1.60)(3.110)
Note: t values are in parentheses; * = p < 0.1, ** = p < 0.05, and *** = p < 0.01.
Table 4. Empirical results of the carbon reduction policy and the employment scale of enterprises.
1234
Triangular NucleusRectangular Kernel
Local Wald503.64363 ***3.12648 ***4.60238 ***4.25298 **
(3.95)(2.97)(3.82)(2.38)
Local Wald1002.42201 ***1.67973 **3.65797 **1.04862 *
(2.67)(2.42)(2.48)(1.82)
Local Wald2000.40858−0.218461.43088−0.04163
(0.44)(−0.37)(1.21)(−0.05)
N1021102110211021
Note: Z-values are shown in parentheses. *, **, and *** indicate statistical significance at 0.1, 0.05, and 0.01 confidence levels, respectively. Furthermore, 50, 100, and 200 denote SRDD results at 1/2 optimal bandwidth, optimal bandwidth, and 2-fold optimal bandwidth, respectively. Columns 1 and 3 show SRDD results with uncontrolled covariates, while columns 2 and 4 show SRDD results with controlled covariates.
Disclaimer/Publisher’s Note: The statements, opinions and data contained in all publications are solely those of the individual author(s) and contributor(s) and not of MDPI and/or the editor(s). MDPI and/or the editor(s) disclaim responsibility for any injury to people or property resulting from any ideas, methods, instructions or products referred to in the content.

