Article

A Framework for Climate Resilient Urban Design: The Case of Porte de Montreuil, Paris

1
Centro Studi PLINIVS, University of Naples Federico II, 80134 Naples, Italy
2
Department of Architecture, University of Naples Federico II, 80134 Naples, Italy
3
Mechanical Engineering Department, School of Engineering in Bilbao, University of the Basque Country UPV/EHU, 48940 Leioa, Spain
4
Department of Architecture, Universitat Internacional de Catalunya (UIC), 08195 Barcelona, Spain
5
Department of Planning, Aalborg University (AAU), 9220 Aalborg, Denmark
6
Department Génie Urbain, Université Gustave Eiffel, 77447 Marne-la-Vallée, France
*
Author to whom correspondence should be addressed.
Sustainability 2023, 15(18), 13857; https://doi.org/10.3390/su151813857
Submission received: 26 June 2023 / Revised: 20 August 2023 / Accepted: 5 September 2023 / Published: 18 September 2023
(This article belongs to the Section Environmental Sustainability and Applications)

Abstract

:
With the increasing frequency and intensity of extreme climate events in cities, it is essential to develop multi-scale and multi-hazard design tools to ensure urban climate resilience. A designed approach to urban development across spatial scales offers the opportunity to integrate diverse fields to create a strong multidisciplinary knowledge base and avoid fragmented planning approaches. This paper proposes a process-based methodological framework for climate resilient urban design-integrating analysis of climate impact with concerns of local communities. A combined focus on climate impact and co-benefits enables a design process with the ability to promote adaptation and mitigation while also addressing diverse urban challenges and responding to local needs and priorities. The proposed methodological framework is applied in the context of the climate resilient urban redevelopment of the Porte de Montreuil district in Paris, France. The results show that the Porte de Montreuil area is at risk from heat waves as a result of the urban characteristics of the area. However, it is possible to suggest specific design measures that integrate local planning priorities with climate resilient design measures to decrease the risk and improve climate resilience in the area.

1. Introduction

Climate change impacts are being felt across the globe with increasing temperatures, rising sea levels, and an increase in extreme heat and/or flooding events [1]. Cities have become central hubs of people, assets, and value and often face increased vulnerability to climate change as a result of urban form, infrastructure, social dynamics, and complex governance structures [2].
The complexity of today’s cities calls for a flexible and dynamic set of design tools that have the capacity to guide an integrated approach to climate resilient regeneration of buildings, neighborhoods, districts, and urban and regional systems. Methodological approaches to urban planning and design are evolving to respond to strategic global objectives set out by the Sustainable Development Goals (SDGs), the New Urban Agenda, and the Sendai Framework for Disaster Risk Reduction. These global agendas call for cities to strengthen resilience, invest in adaptive mitigation, and “build back better” in order to tackle the deep-rooted inequalities and vulnerabilities that plague today’s cities and urban communities [3,4]. This has led to a recognition of the importance of design-led action for retrofitting buildings, regenerating urban neighborhoods, ensuring functional spatial layouts, and preserving the ecological integrity of cities and surrounding peri-urban areas. A design-led approach to urban development across spatial scales offers a unique opportunity to integrate the previously disconnected fields of architecture, urban planning, climate change adaptation, disaster risk reduction, and sustainable development to create a strong integrated knowledge base across disciplines and maximize efficiency while avoiding fragmented approaches that so often limit the effectiveness of solutions [5,6,7]. Integrating the work of experts from such diverse fields is a complex collaborative challenge that requires the development of iterative tools to enable holistic multi-scale and multi-hazard approaches. Therefore, it is critical to integrate climate resilient design principles into mainstream architectural and urban planning and design processes to promote resilience thinking across spatial scales and disciplinary divides.
In the European context, the issue of climate resilience is promoted also by implementing methodologies and operational tools in order to integrate hazard/impact assessment in policies and strategies [8]. Climate services—IT tools that enable the integration of climate-related information in the design process—can support decision-makers [9,10].
In this scenario, the paper proposes and tests a methodological framework for climate resilient urban design based on the four-phase process developed by the UCCRN ARC3.2 Working Group on Urban Planning and Urban Design, as part of the Second Assessment Report on Climate Change in Cities [11]. The aim is to develop a multidisciplinary and design-oriented proposal for the climate-resilient transformation of the Porte de Montreuil area in Paris. In particular, the contribution, based on the methodology identified in previous studies [6,11], focuses on the testing phase and on the tools implemented in the Site Survey and Public Space evaluation and in the Planning and Design phases.

2. Methodological Framework for Climate Resilient Urban Design

The methodological framework aims to guide multi-scale risk assessment and support decision-making for adaptation and mitigation planning in cities. Specifically, the methodology is designed to integrate climate resilience thinking with local community needs and priorities to guide designs that address societal challenges while also tackling the impacts of climate change on urban systems. According to previous studies [6,11], the climate resilient urban design methodological framework is based on four sequential steps: climate analysis mapping, site survey and public space evaluation, planning and design, and post-intervention evaluation.
Climate Analysis Mapping is an essential first step in the design process to identify areas expected to experience the greatest impacts from climate change-related hazards in today’s climate and potential future climates [11]. This phase utilizes GIS-based modeling tools to analyze climate impacts at an urban or district scale. Specifically, simulation tools able to capture the effect of urban morphology and surface cover on the urban microclimate and potential impacts of extreme events, such as the HWLEM (Heat Wave Local Effect Model) and FLEM (Flood Local Effect Model) models [11] developed within the H2020 CLARITY research project (CLARITY, n.d.), can be utilized to simulate heat waves and pluvial flooding in both current and future scenarios. Such GIS-based simulation enables evidence-based assessment of risk from climate change-related hazards. GIS-based simulations at city level are supported by 3D modelling tools, such us Rhinoceros and Grasshopper, to assess technical solutions at block/building scale.
Site Survey and Public Space Evaluation enable the integration of urban climate analysis with the specific needs and priorities of local communities which often do not relate to climate considerations but instead center around issues of livability, housing, availability of services, mobility, and social cohesion [11]. Assessing local community needs through participatory processes enables the integration of citizen concerns and local urban challenges into design proposals that also serve adaptive mitigation functions. During this phase, the physical state of the area as well as local plans and strategies can be analyzed in order to understand local challenges and priorities. Future visioning exercises can aid in translating high-level city visions into human scale illustrations of daily life by mapping the "day in the life" of residents in future scenarios according to the planned projects and policies.
Planning and design focus on identifying synergies and tradeoffs based on the climate analysis mapping and site survey and public space evaluation in order to propose interventions that balance climate impacts with co-benefits, thus maximizing potential benefits for the local communities and urban systems [11]. During this phase, metadesign strategies can be developed that integrate climate resilient design measures with best-practice urban strategies. Metadesign strategies can be adapted to any local context to guide the development of master plans or neighborhood scale designs that provide functional adaptation and mitigation solutions while also addressing relevant local challenges.
Post-intervention Evaluation involves a critical review of the benefits of proposed solutions with regard to the urban microclimate, energy consumption, and environmental performance combined with an assessment of community benefits [11]. In the post-design phase, the GIS-based tools are used to simulate climate impact and model energy and environmental behavior at different scales to evaluate the performance of proposed solutions. In the post-implementation phase, it becomes critical to monitor the actual response of the developed solutions to the slow-onset changes and extreme-event impacts, as well as the perceived urban quality and the way community needs as expressed in the co-design process have been translated into social, economic, and environmental co-benefits of the climate-resilient urban transformation.
Throughout the design process, climate resilient design principles and urban design best practices should guide the selection of potential interventions. Climate resilient design principles offer a variety of strategies for adaptive mitigation depending on intervention priorities and can aid designers in selecting appropriate solutions [12]. Form and Layout, Blue and Green Infrastructure, Building Envelope, Surface Materials, and Energy Efficiency and CO2 Emissions are the four proposed climate resilient design principles that should be considered in urban regeneration and building retrofitting projects. The incorporation of these design principles enables designers to quantitatively assess the climate change adaptation and mitigation benefits of potential solutions [13,14,15].
Form and Layout are critical, as altering the form and layout of buildings and districts can provide cooling and ventilation to reduce energy use while also increasing thermal comfort and reducing vulnerability to flooding and runoff.
Blue and Green Infrastructure has immense potential to cool buildings and neighborhoods, reduce cooling demand, and reduce runoff while mitigating air pollution [16,17].
Building Envelope and Surface Materials can reduce urban heat island (UHI) effect and improve overall building performance [18,19].
Energy Efficiency and CO2 Emissions are an important area to address, as low carbon and near-zero energy solutions can reduce GHG emissions while also minimizing urban waste heat [20,21].
In addition to climate resilient urban design principles, interventions should align with urban design best practices that aim to promote livability, improve walkability and soft mobility infrastructure, provide access to public services, and promote social inclusion.

3. Climate Resilient Urban Design Application: The Case of Porte de Montreuil

Potential applications of the proposed framework for climate resilient urban design, described in Section 2, can be illustrated through the use of the framework to guide the climate resilient urban redevelopment of the Porte de Montreuil district in Paris, France, as part of the Climate Resilient Urban Design (CRUD) project, UCCRN Urban Design Climate Workshop held in Paris in November 2021 (Lab’URBA, n.d.), and the UCCRN Urban Design Climate Workshop held in Paris in June 2022.
The four-phase climate resilient urban design methodology utilized enables an evidence-based approach to urban design that embeds climate concerns in the local context through the consideration of stakeholder strategies and priorities. The application of this methodology to the Porte de Montreuil district shows that the framework enables the design of solutions with adaptation and mitigation functions that also meet the needs of local communities.
The Porte de Montreuil district covers an area of approximately 8 km2 and is currently home to 200,000 inhabitants (based on the elaborations that take into account 2011–2021 demographics, provided by the INSEE—Institut national de la statistique et des études économiques—and the APUR—Atelier Parisien d’Urbanisme) and is expected to increase in population in 2050 as show in Figure 1.
The case area is located along the eastern administrative boundary of the city of Paris at the intersection of the municipalities of Paris, Montreuil, Bagnolet, Vincennes, and Saint-Mande. The district is a priority area for urban redevelopment, and planned projects are already underway to reimagine the area and strengthen the connection between the city of Paris and the greater region (Paris.U, n.d.; TVK, n.d.; Ville de Paris, n.d.).
The Porte de Montreuil district has been selected as a priority area for urban renewal in Paris as part of the New National Urban Renewal Program—NPNRU (“Portes du 20ème” project [22]). The urban redevelopment project is assigned to the TVK agency with the objective of strengthening the links between Paris and Montreuil by creating an urban continuity through public spaces, a square, and the construction of seven buildings [23]. In this context of redevelopment, the City of Paris also proposed to include the area in the call for innovative urban project Reinventing Cities led by the C40 (Cities Climate Leadership Group); the call for project was won by Atelier Georges [24]. The aim of the urban redevelopment is to transform the Porte de Montreuil area into a pilot district of environmental and sustainability excellence as well as a laboratory for zero carbon and the new economy principles.
Figure 2 shows the main development areas in the Porte de Montreuil district.
Considering climate factors, the Porte de Montreuil area is primarily exposed to heat waves and pluvial flooding with the intensity of both hazards expected to increase in the future under certain scenarios (based on the elaboration of Euro-Cordex RCM data provided by the H2020 CLARITY project [25]). In this scenario, this study takes a multi-scale approach to the climate resilient design of the area by focusing on an analysis of both the Porte de Montreuil district as well as two smaller subdistricts within the area as shown in Figure 3.
An overall district strategy is proposed for the whole area, while more detailed urban design experimentation is proposed for subdistrict B, aimed at highlighting the need for coherent planning and design choices at multiple scales to ensure the achievement of the targeted climate benefits and co-benefits. This study focuses on an analysis of three scenarios as shown in Table 1.
The following sections describe the application of the four phases of the climate resilient urban design methodology in the Porte de Montreuil study area.

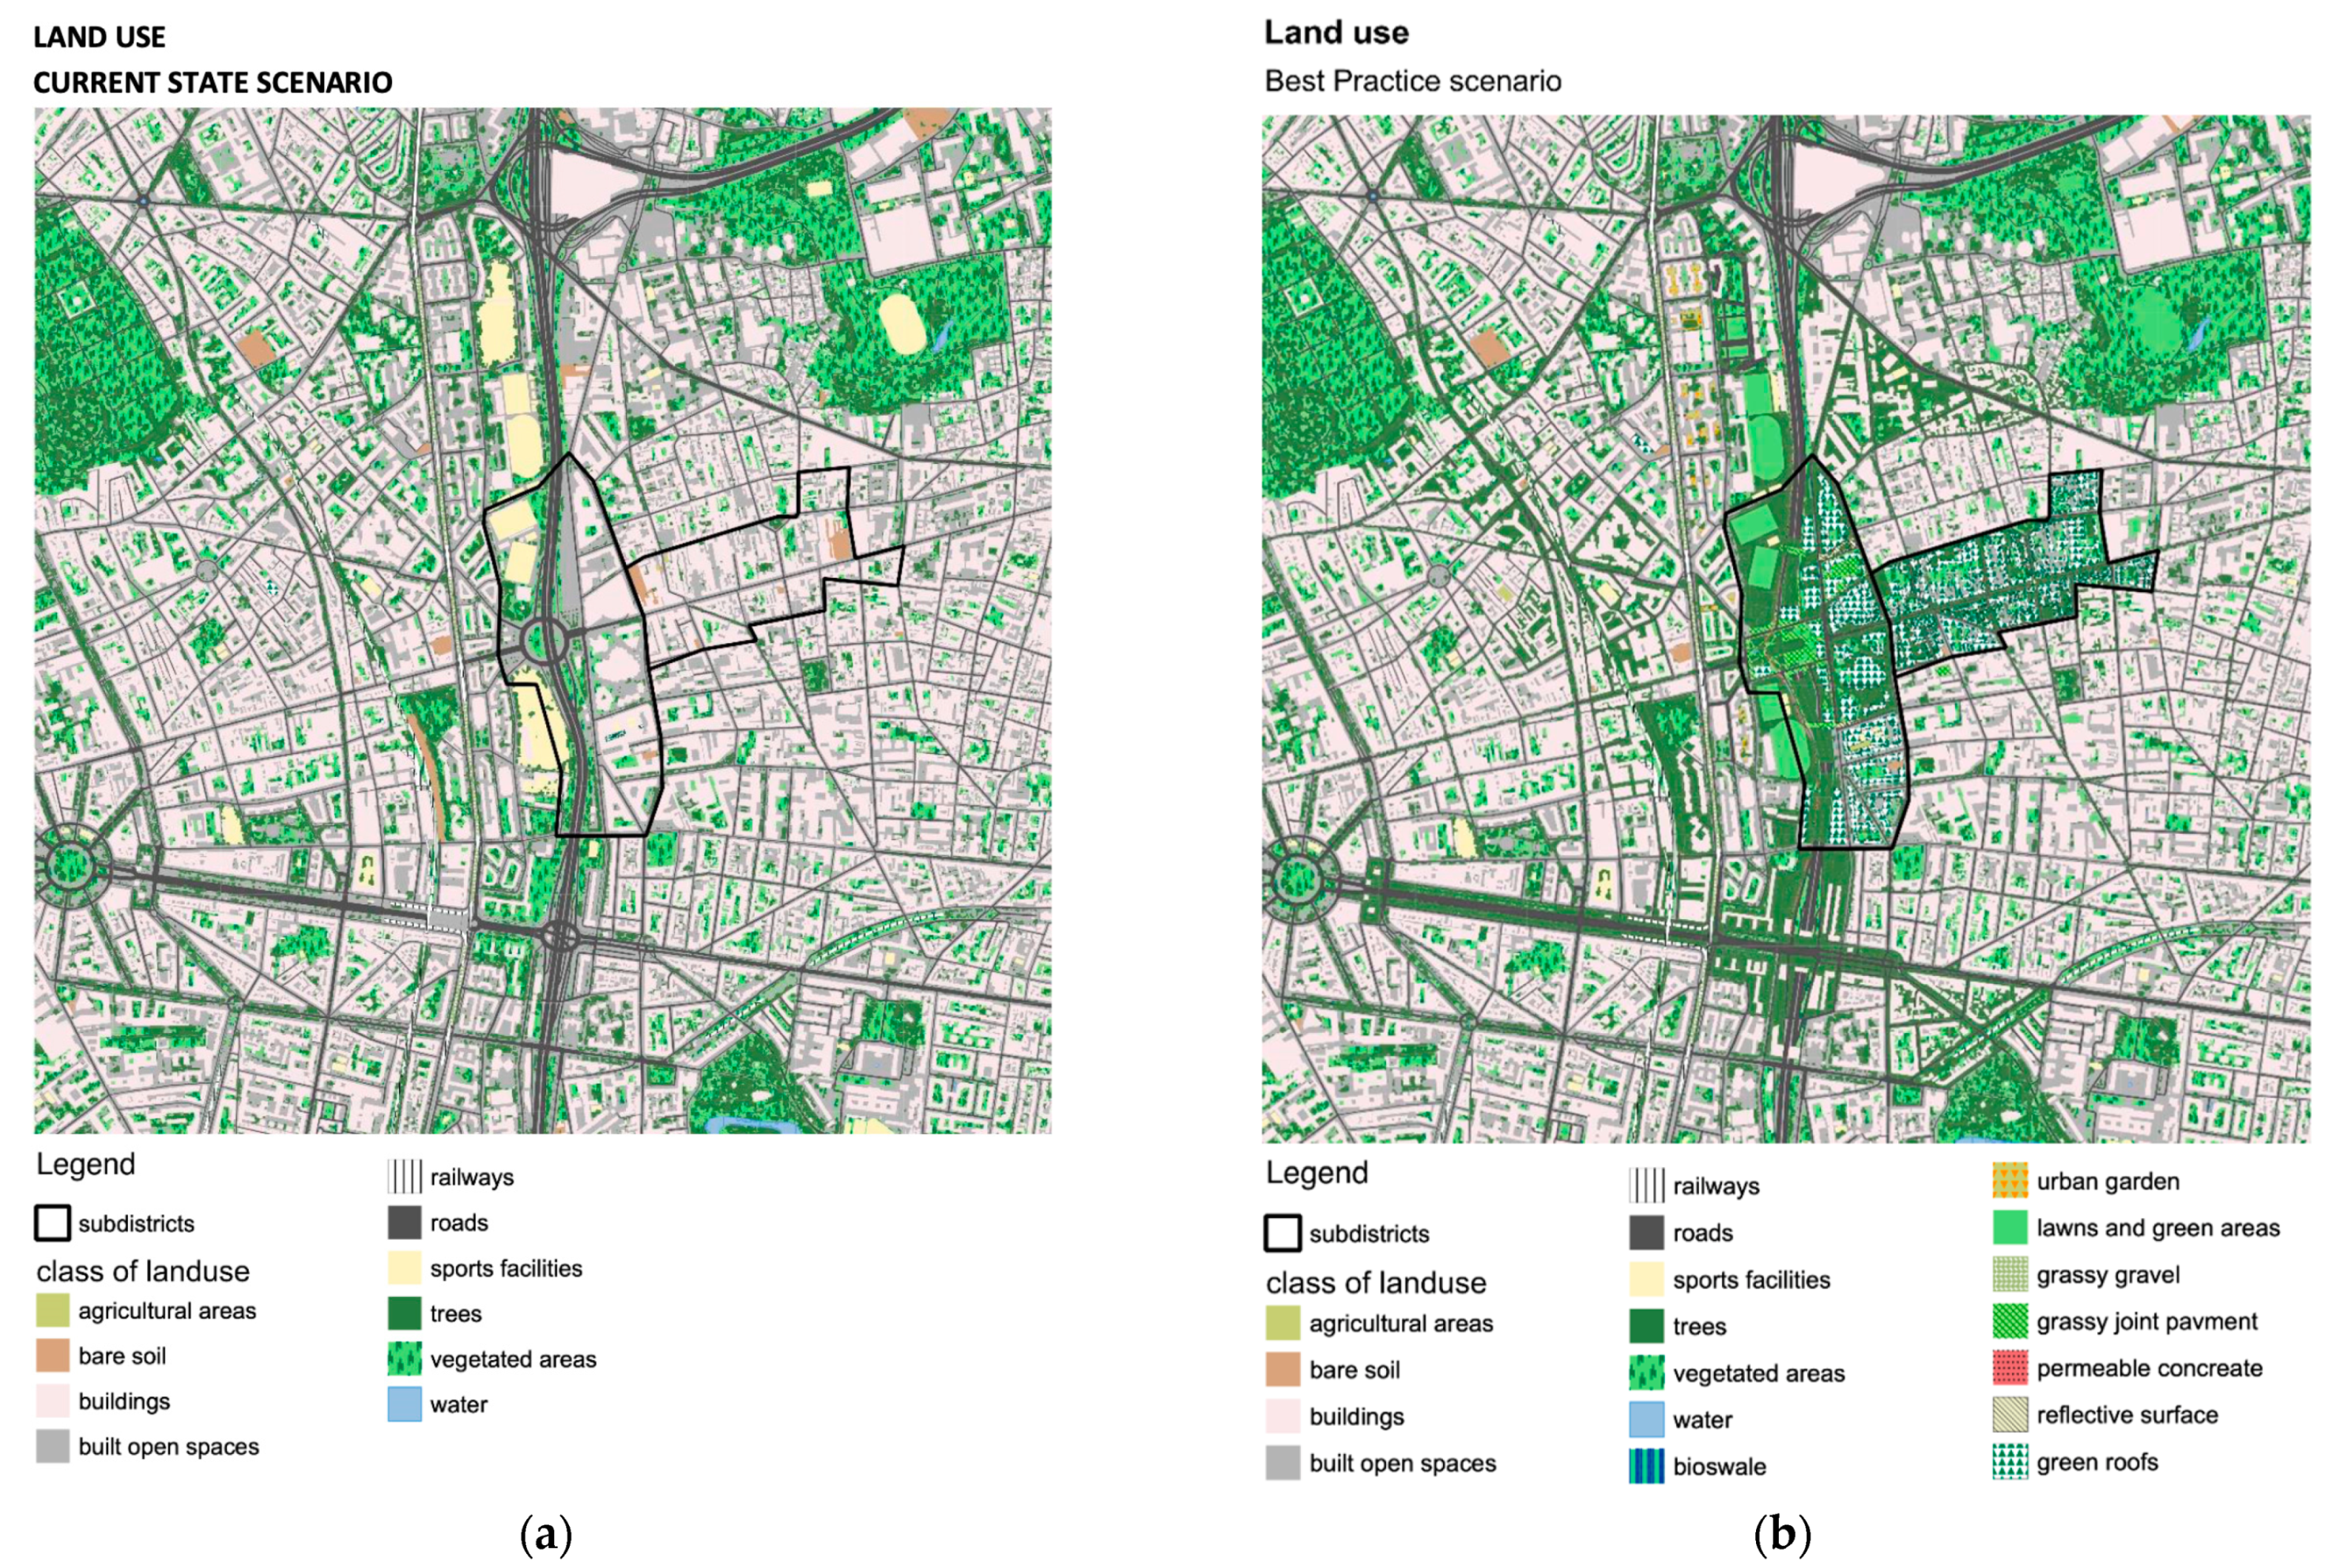
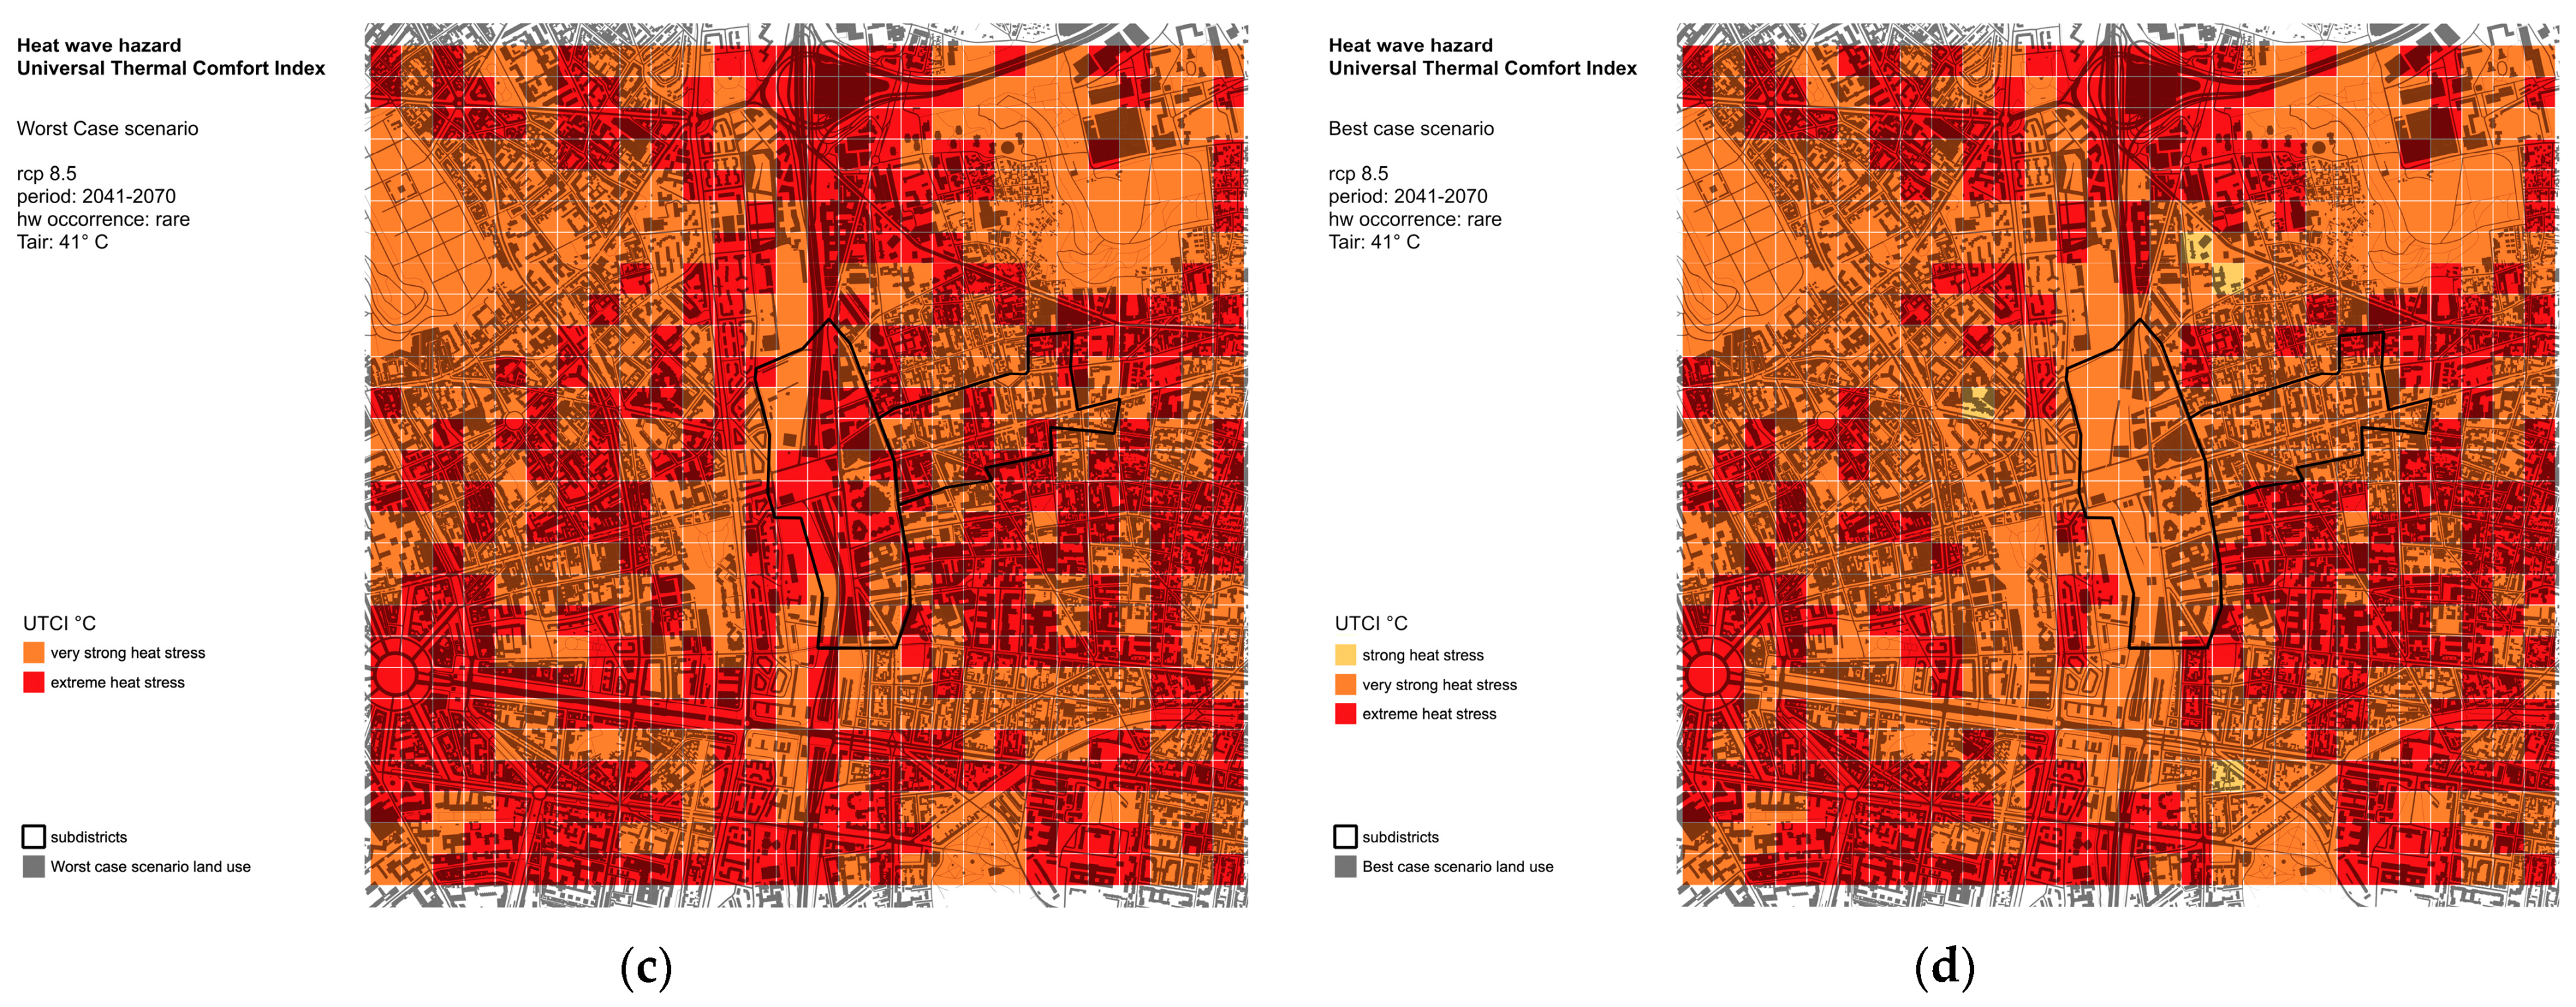
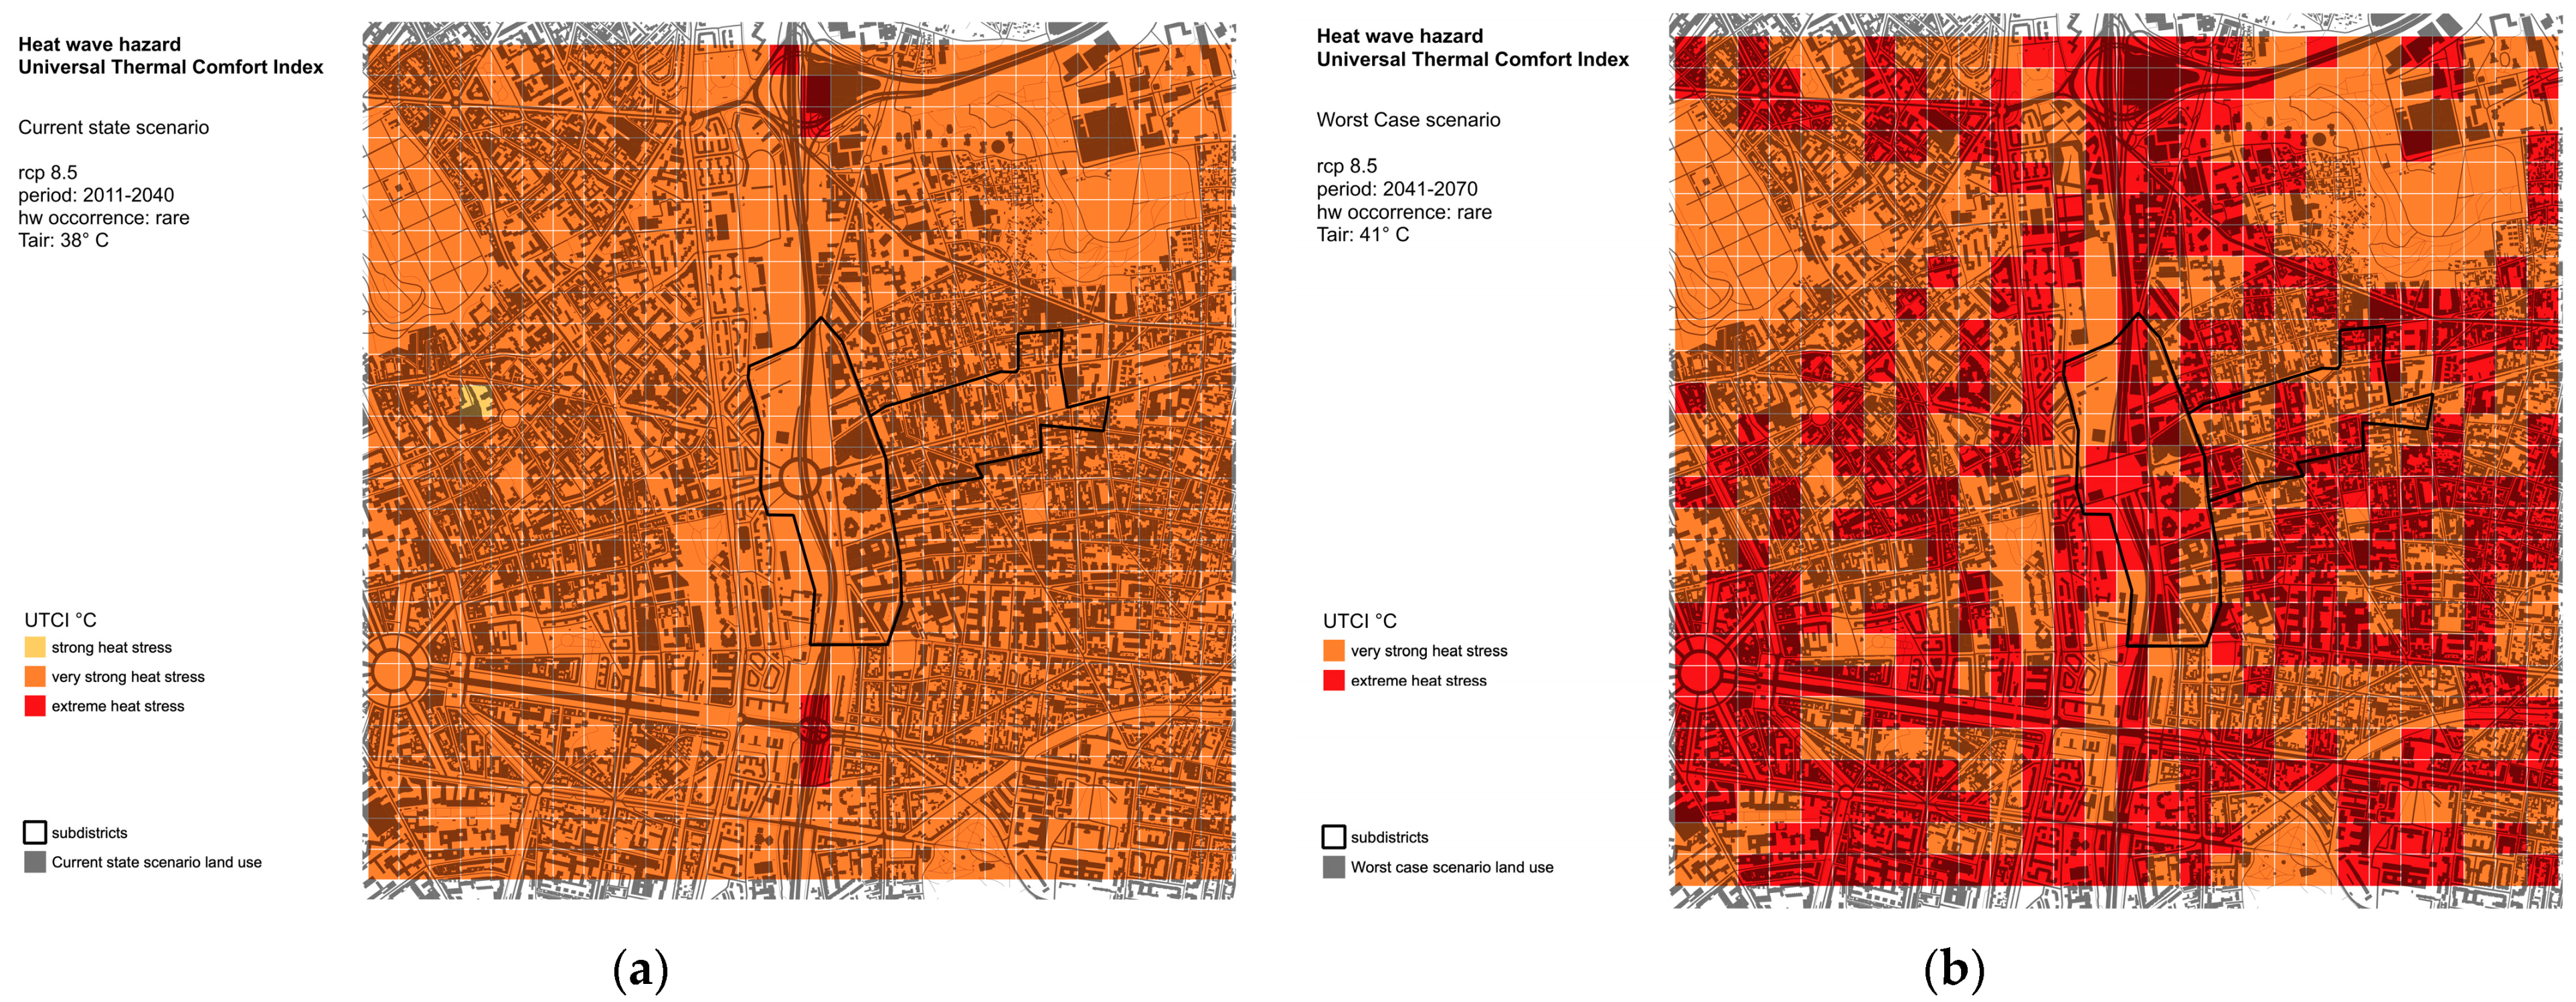
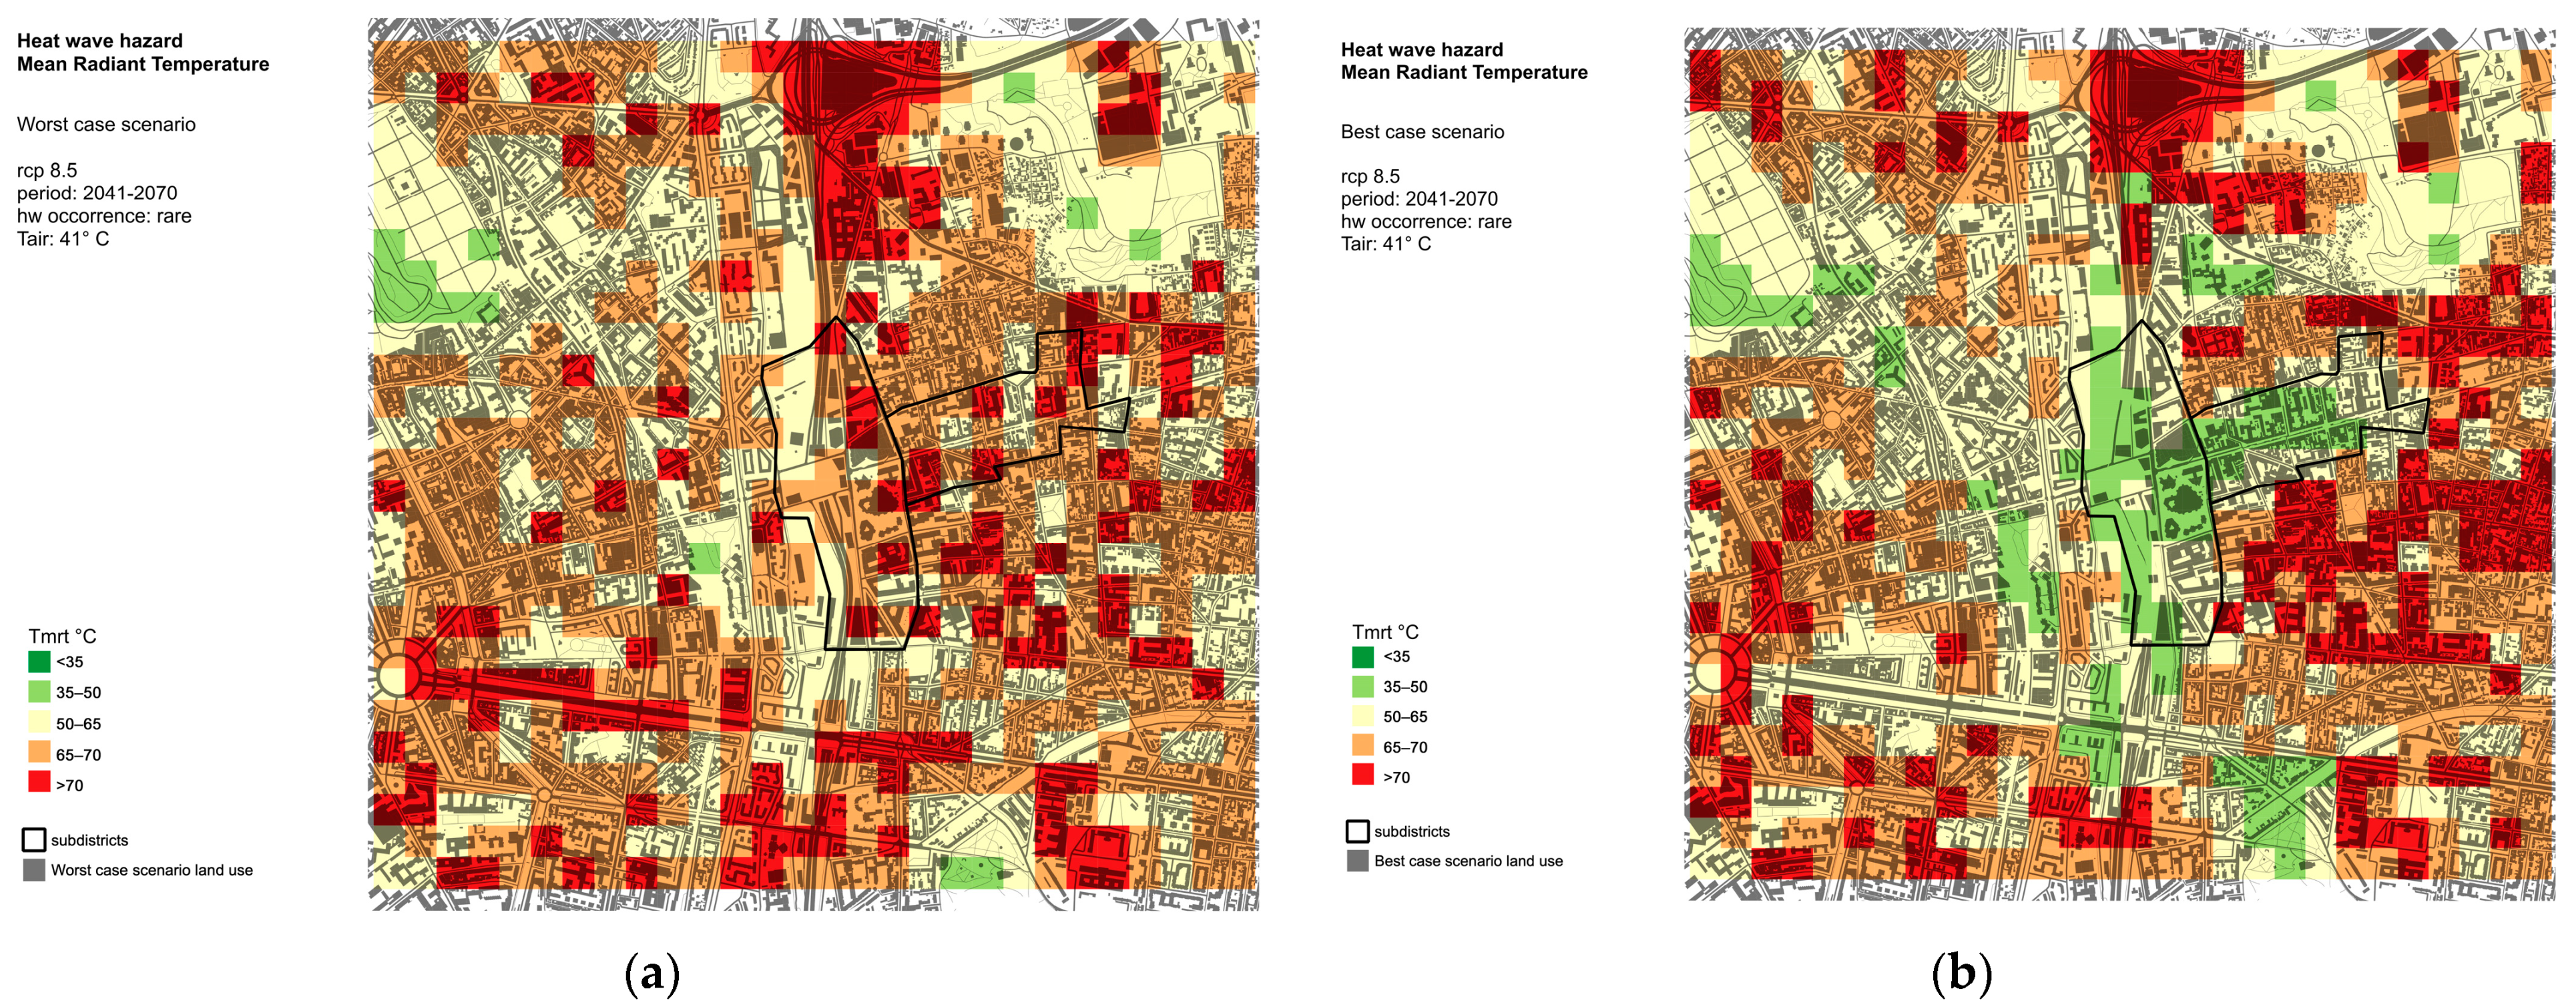
3.1. Climate Analysis Mapping

The climate analysis mapping phase utilized the CLARITY HWLEM model [10] (Heat Wave Local Effect Model—HWLEM) to simulate heat waves in the Porte de Montreuil area. The CLARITY HWLEM model is based on a set of GIS procedures combined with algorithms developed in SQL and Pyton that enable the attribution of thermal comfort indicators to the land use geometries. To represent and analyze urban spaces, the system is based on a 2.5D model [26], which combines the two-dimensional features of land use footprints with selected three-dimensional information (such as elevation, shading, sky-view factor). The main algorithm for calculating the mean radiant temperature is derived from the SOLWEING [27].
Simulations were carried out for the current and future business-as-usual 2050 (BAU) scenarios. Current simulations utilize existing land use as input data, while BaU simulations are run based on future land use data that take into account the planned state of the district in 2050 according to the planned projects in the area. Finally, the Best Practice scenario will take into account the master plan prototype in 2050. Figure 4 shows the land use of the current state scenario (Figure 4a) and of the BaU scenario (Figure 4b).
In order to simulate the impact of heat waves on the terrain, two measures were used: Mean Radiant Temperature (Tmrt) and Universal Thermal Climate Index (UTCI). Tmrt is a useful summary indicator to assess the impact of heat on the human body, outdoor comfort [28,29] and is considered to be more suitable for studying the impact of extreme heat events on humans than other measures due to its close relation to urban morphology and vegetation characteristics [30]. The UTCI provides further information about thermal comfort in heat wave simulations, giving a measure of the human physiological response to the thermal environment and correlating core parameters as 2 m air temperature, 2 m dew point temperature (or relative humidity), wind speed at 10 m above ground level, and mean radiant temperature to derive potential heat stress for the population [31,32]. While the Tmrt is considered a proxy of Urban Heat Island conditions and gives information about both indoor and outdoor microclimate conditions, the UTCI simulation excludes in the calculation the contribution of building rooftops and is intended to support the design of outdoor environments to reduce heat stress in public spaces.
Figure 5a,b illustrate Tmrt in the Porte de Montreuil study area during a current state rare heat wave of 38 °C and BAU rare heat wave of 41 °C, respectively.
In the current state scenario, the majority of the Porte de Montreuil area has a Tmrt of over 50 °C, which correlates with a dangerous level of heat stress for elderly populations that are highly vulnerable to extreme heat [33]. For citizens over 80 years, Tmrt values above 55.5 °C can lead to a significant increase in the risk of heat-related mortality [16]. Figure 5, therefore, shows a significant risk of heat stress in the current state scenario. Figure 5 shows that high Tmrt values are concentrated around the Montreuil neighborhood to the east of the Porte de Montreuil as well as the area surrounding Nation in the southwest of the case area and the major intersections along the Boulevard Peripherique, which runs through the case area from north to south. High Tmrt values in these areas are due to the densely built character of the neighborhoods, the prevalence of large road infrastructure, and the limited presence of greenery.
In the BAU scenario, Tmrt values are clearly higher with the majority of the case area exhibiting Tmrt values over 65 °C and a significant portion of the case area showing Tmrt values above 70 °C.
Even though the BAU scenario considers the planned projects in the area that will incorporate more greenery into the area, heat stress in this scenario is clearly more extreme, which demonstrates the projected increase in the intensity of heat waves in the future as well as the limited efficacy of the current planned projects in mitigating future heat stress.
Figure 6a and 6b below illustrate the UTCI in the Porte de Montreuil study area during a current-state rare heat wave of 38 °C and BAU rare heat wave of 41 °C, respectively.
Figure 6 shows that when using UTCI as an indicator of thermal comfort, different results are observed compared to Tmrt. In the current scenario, the entire case area experiences very strong heat stress, while in the BAU scenario, a large percentage of the case area experiences extreme heat stress. These results show that heat stress in the area may be even more extreme than shown in Tmrt models, as UTCI more closely represents outdoor thermal comfort.
In addition to mapping Tmrt and UTCI, the CLARITY model also enables an assessment of impact indicators such as excess mortality rates and hospitalization costs as a result of different heat wave events. In the current state rare heat wave scenario modeled above, a mortality rate of 3.7% is observed, and a total hospitalization cost of €187,375 is expected. In the BAU 2050 rare heat wave scenario, the expected mortality rate increases to 4.8%, and the total cost of hospitalization is expected to reach €298,734, nearly double that of the current state rare heat wave scenario.

3.2. Site Survey and Public Space Evaluation

The first step of the site survey and public space evaluation phase was to map the existing state of the Porte de Montreuil area in order to better understand exposed elements present within the case area. Specifically, topography, commercial activity, mobility, educational space, cultural activity, and urban green spaces were mapped.
The next step was to conduct an analysis of policies, strategies, and planned projects in the Porte de Montreuil area to gain a deeper understanding of the strategic and political context in the area. Due to the unique location of the case area at the intersection of several different municipalities and territories, it was necessary to analyze policies from each of the different jurisdictions present within the district. Plans and strategies from Paris, Montreuil, Bagnolet, Seine Saint Denis, Grand Paris, and Ile de France were assessed. All major policies and strategies related to climate resilience and sustainable development were included in the analysis.
Based on the analysis, it is that the city of Paris addresses a much wider range of resilience-related goals in their plans and strategies than neighboring municipalities. Following a thematic analysis of plans and strategies, the planned projects in the area were mapped in order to gain an understanding of ongoing and planned urban developments.
Major plans and strategies in the Paris Region include the Paris Climate Action Plan, the Great Urban Renewal Project (GPRU), and the Plan Local d’Urbanisme (PLU). The Paris Climate Action Plan outlines a vision for a carbon neutral city by 2050, specifically focusing on renewable energy, active transport, building renovation, sustainable food systems, air quality, and climate change adaptation through green and blue infrastructure [22]. The GPRU is an urban revitalization program focused on improving living conditions and promoting economic development in the areas of Paris and neighboring municipalities with the most vulnerable population (Ville de Paris, n.d.), which comprises 13 sites, including Porte de Montreuil.
Finally, the PLU presents guidelines and regulations for the development of the city over a horizon of 10–15 years. The PLU aims to improve the living conditions of all Parisians by integrating sustainable development concepts into city planning, reducing inequalities to create a united Paris, and developing intermunicipal cooperation throughout the region. Within the Porte de Montreuil area, the Porte de Montreuil Urban Project and the Zac Fraternité development site will influence the future development of the area. The Porte de Montreuil Urban Project is a project initiated by the City of Paris as part of the GPRU and New National Program for Urban Renewal (NPRU) in partnership with ANRU “Les Portes du 20ème”. This project aims to improve the quality of urban public spaces, promote soft mobilities, enhance the landscape potential of the green belt, redevelop social housing, and improve schools. The project also aims to create a new economic center through the revitalization of the Montreuil flea market and the creation of better connections with neighboring areas.
The Zac Fraternité site is a development project for the Fraternité district in Montreuil that focuses on developing 70,000 m2 of mixed-use area for housing, shops, and other activities (ParisU, n.d.).
After understanding the planned projects in the area, the final step of the site survey and public space evaluation phase was to communicate the knowledge gained from the analysis of policies, strategies, and the planned projects on a human scale. In order to do so, several "day in the life" visualizations were produced to illustrate possible daily lived experiences of children, adults, and elderly residents in the Porte de Montreuil district in 2050. The day-in-the-life visualizations are grounded in strategic objectives and planned projects and therefore reflect how citizens might experience life in the area in several decades if planned developments are implemented as expected. Figure 7 shows one example of a day-in-the-life Porte de Montreuil 2050 illustration.
During this phase, as part of the 2 workshop, some analyses with local associations and communities were also carried out in order to better understand public, private and business demands [34].

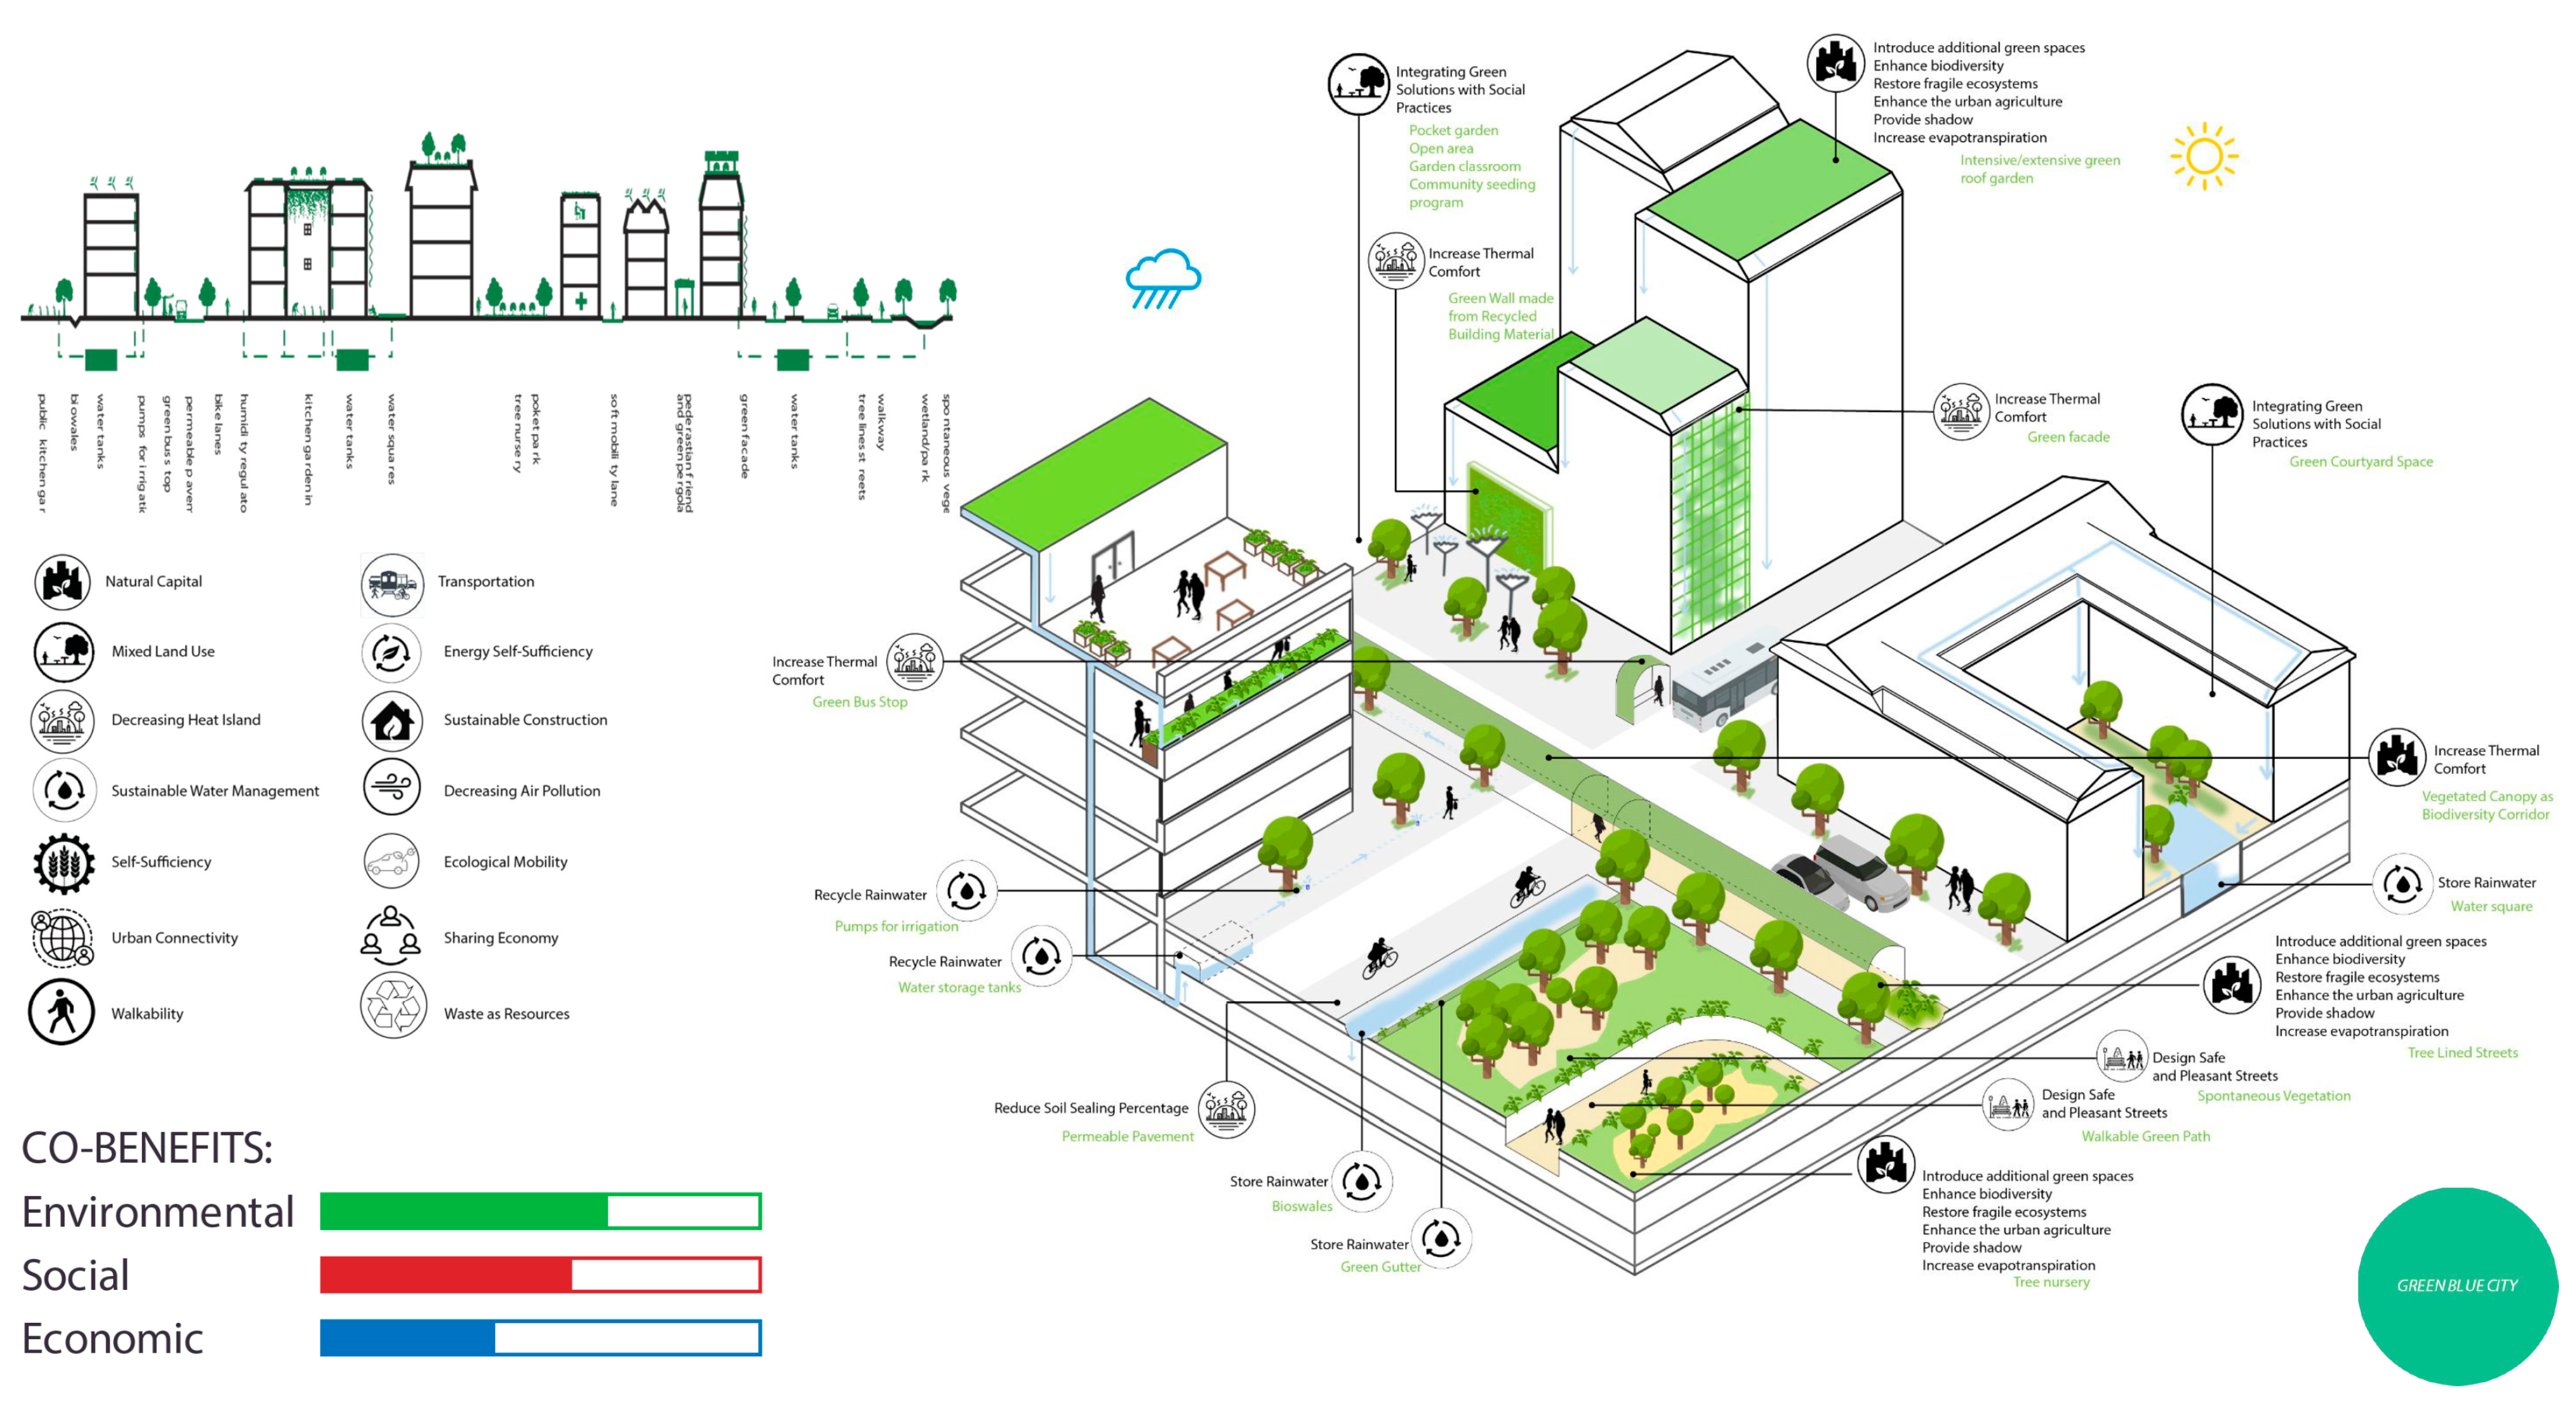
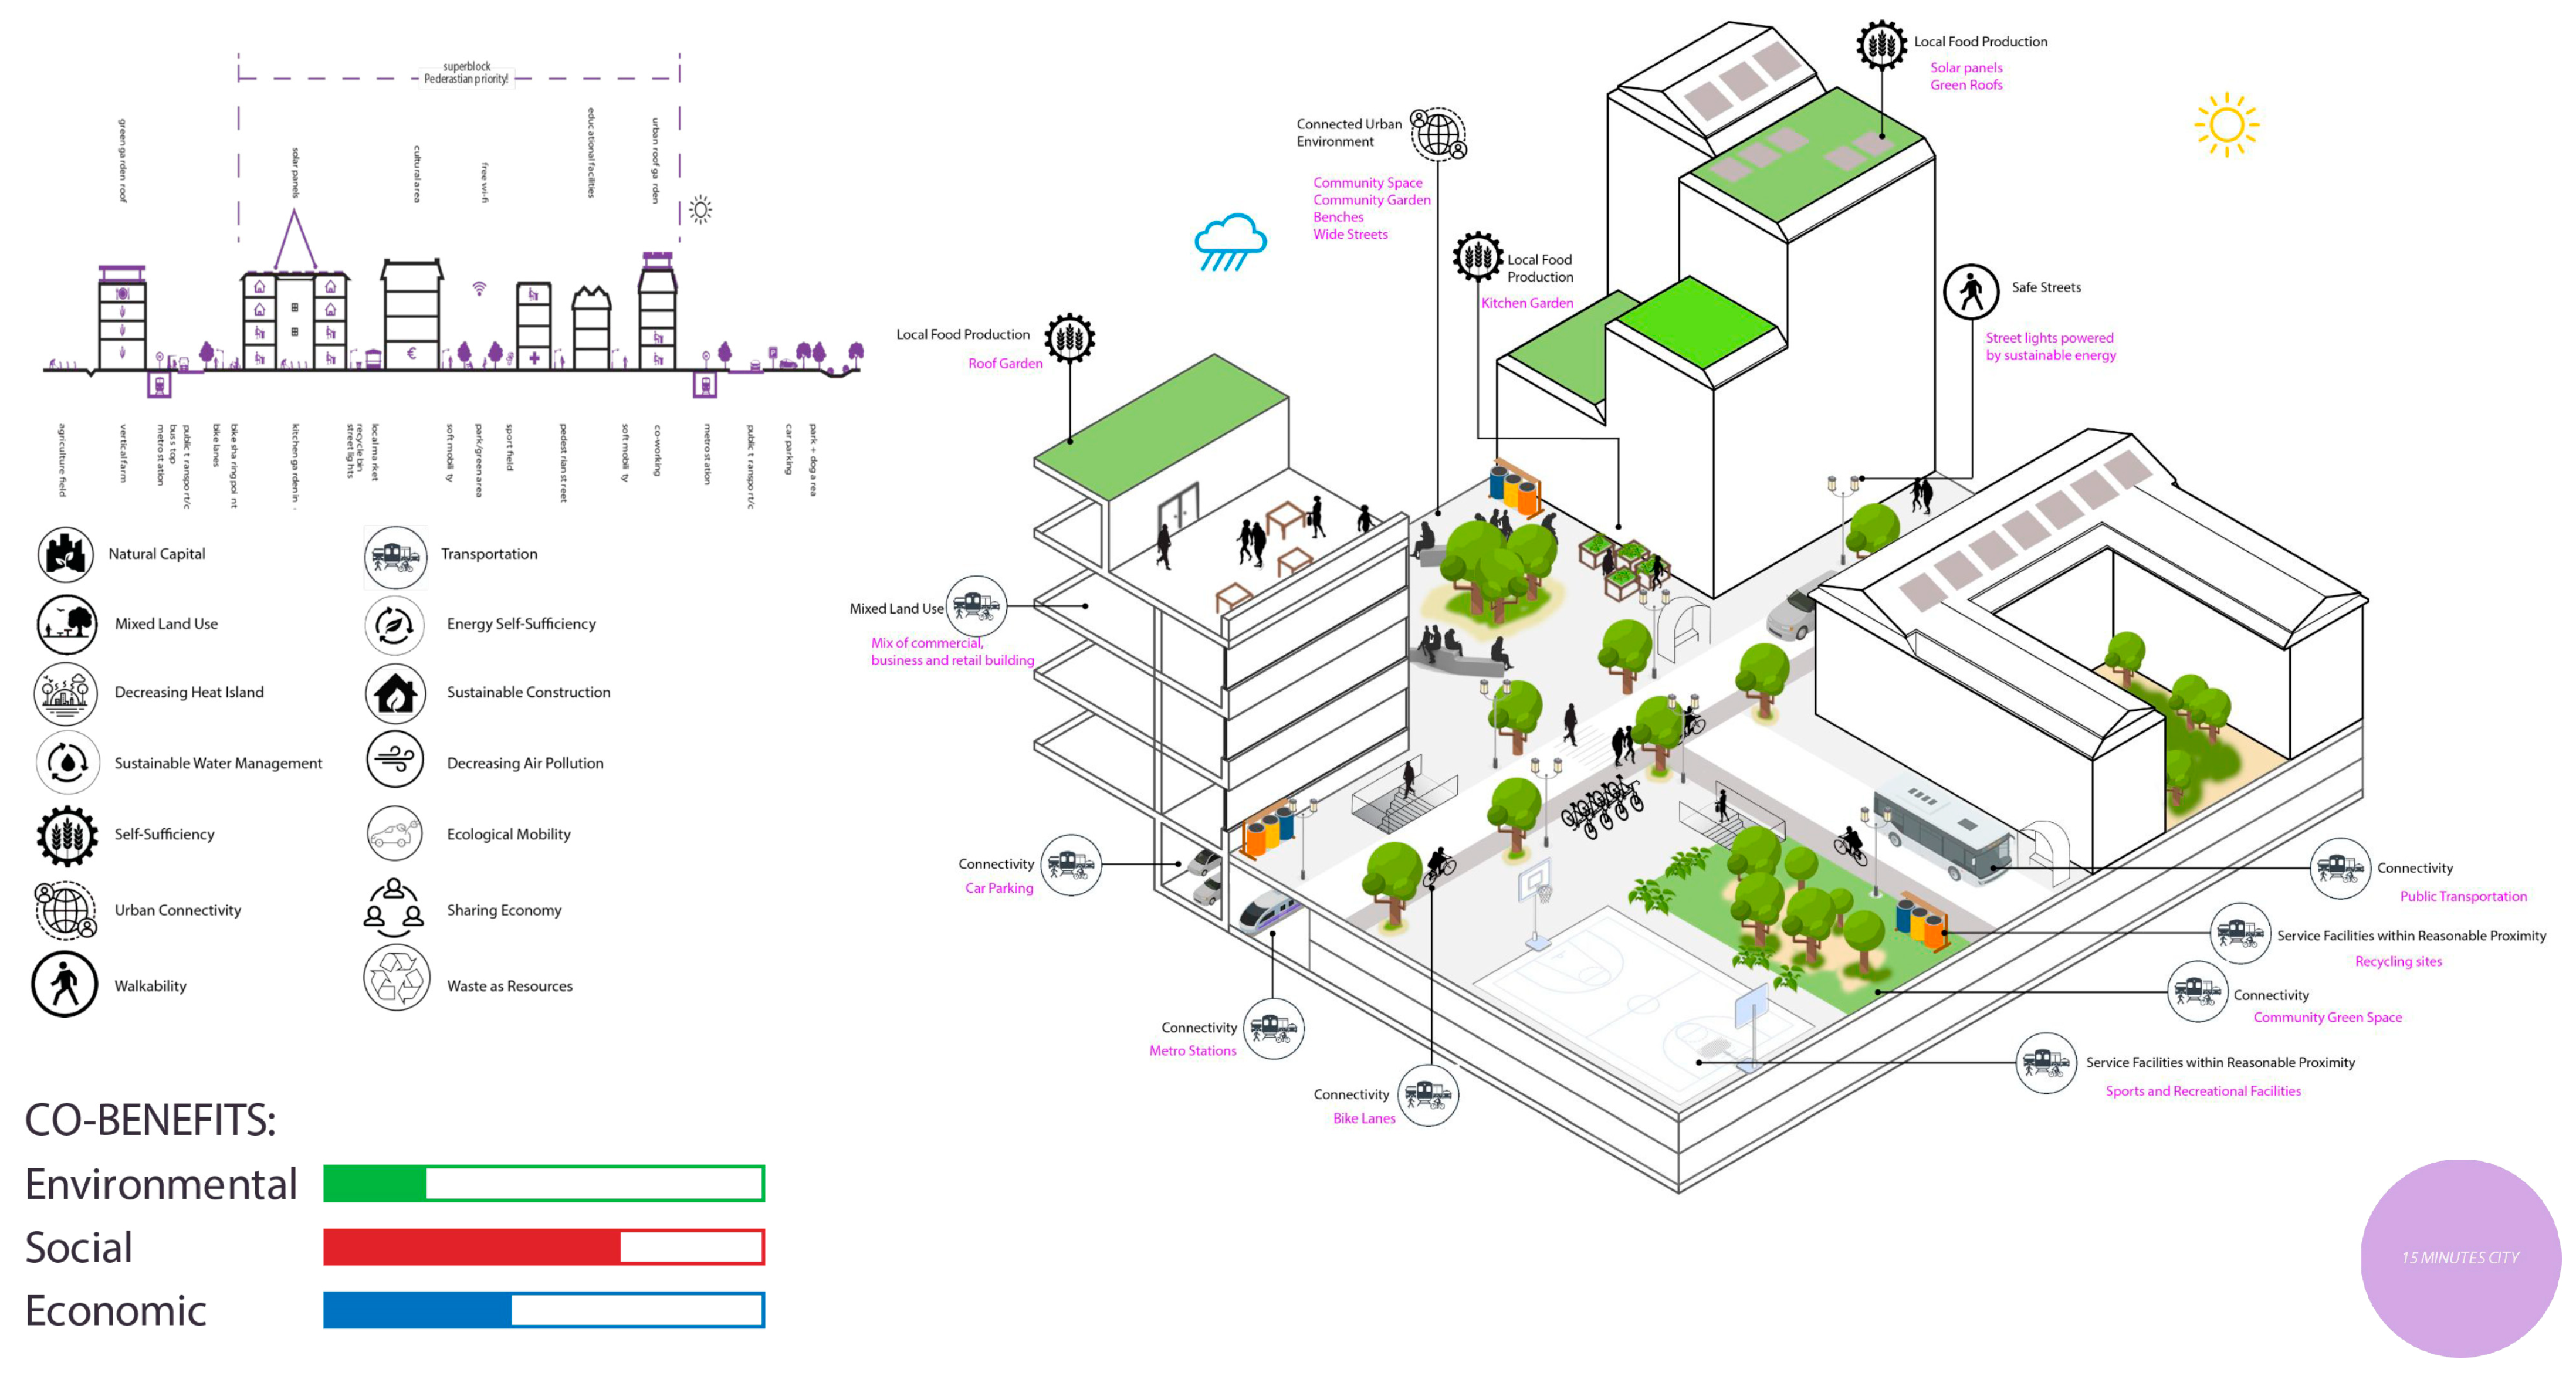
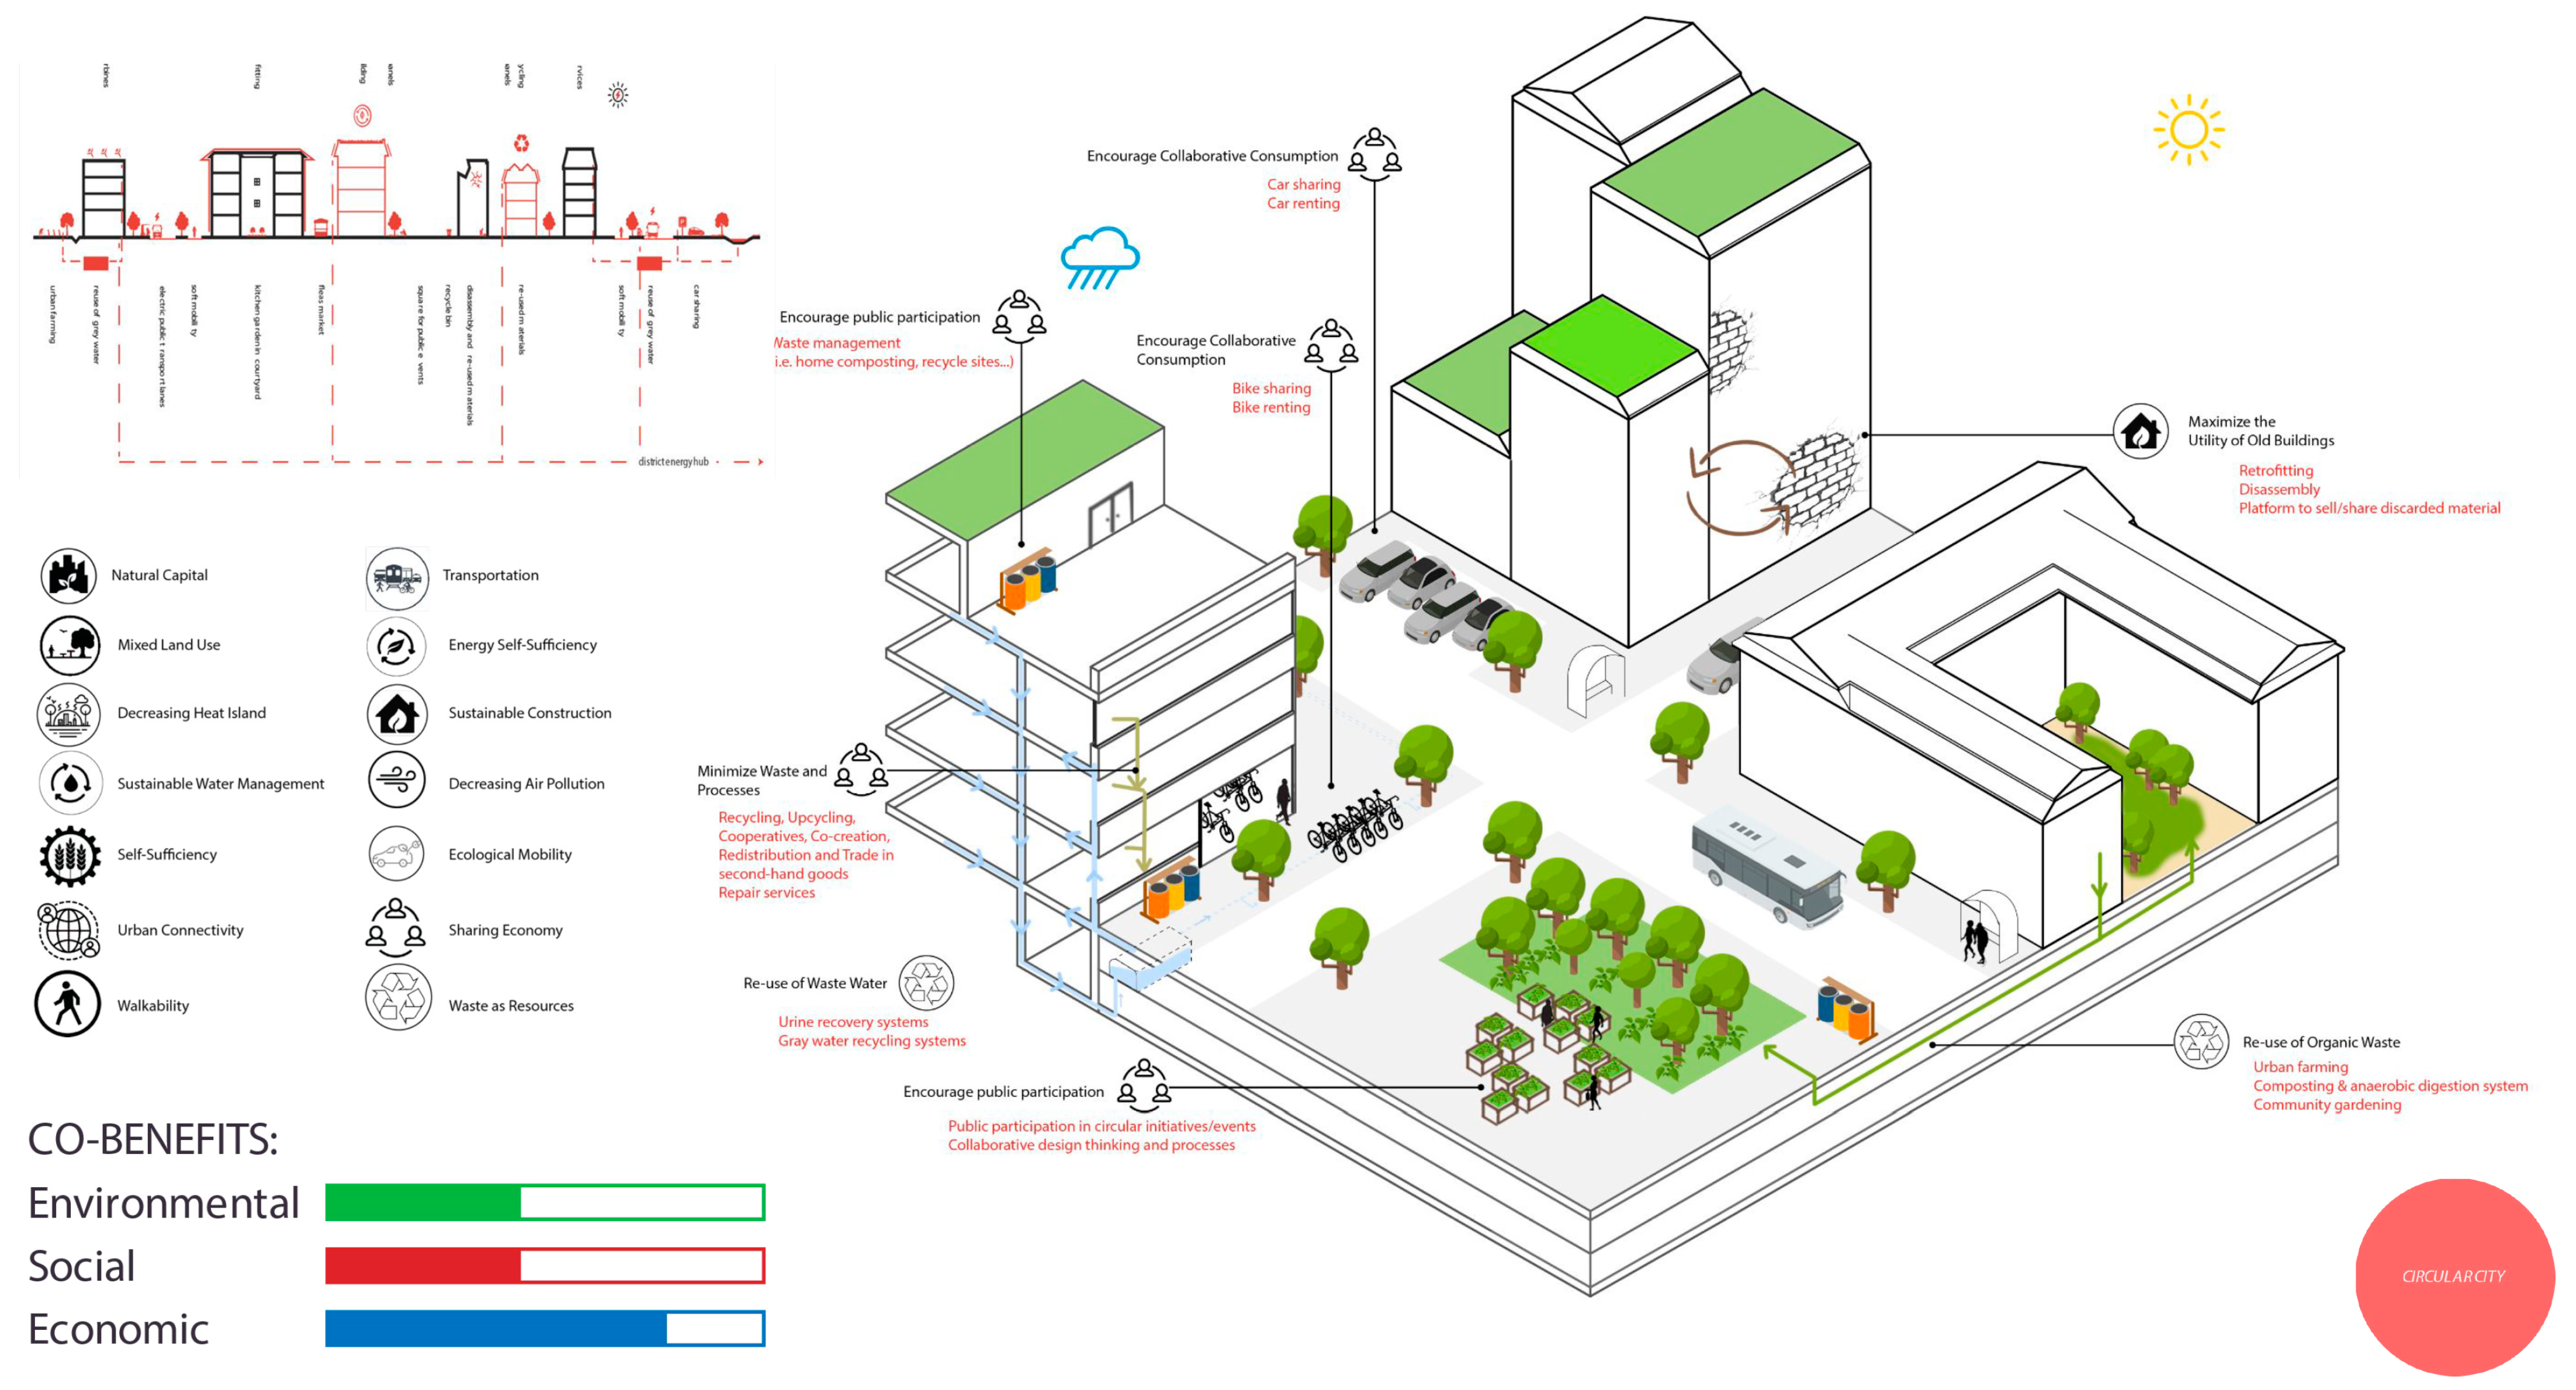
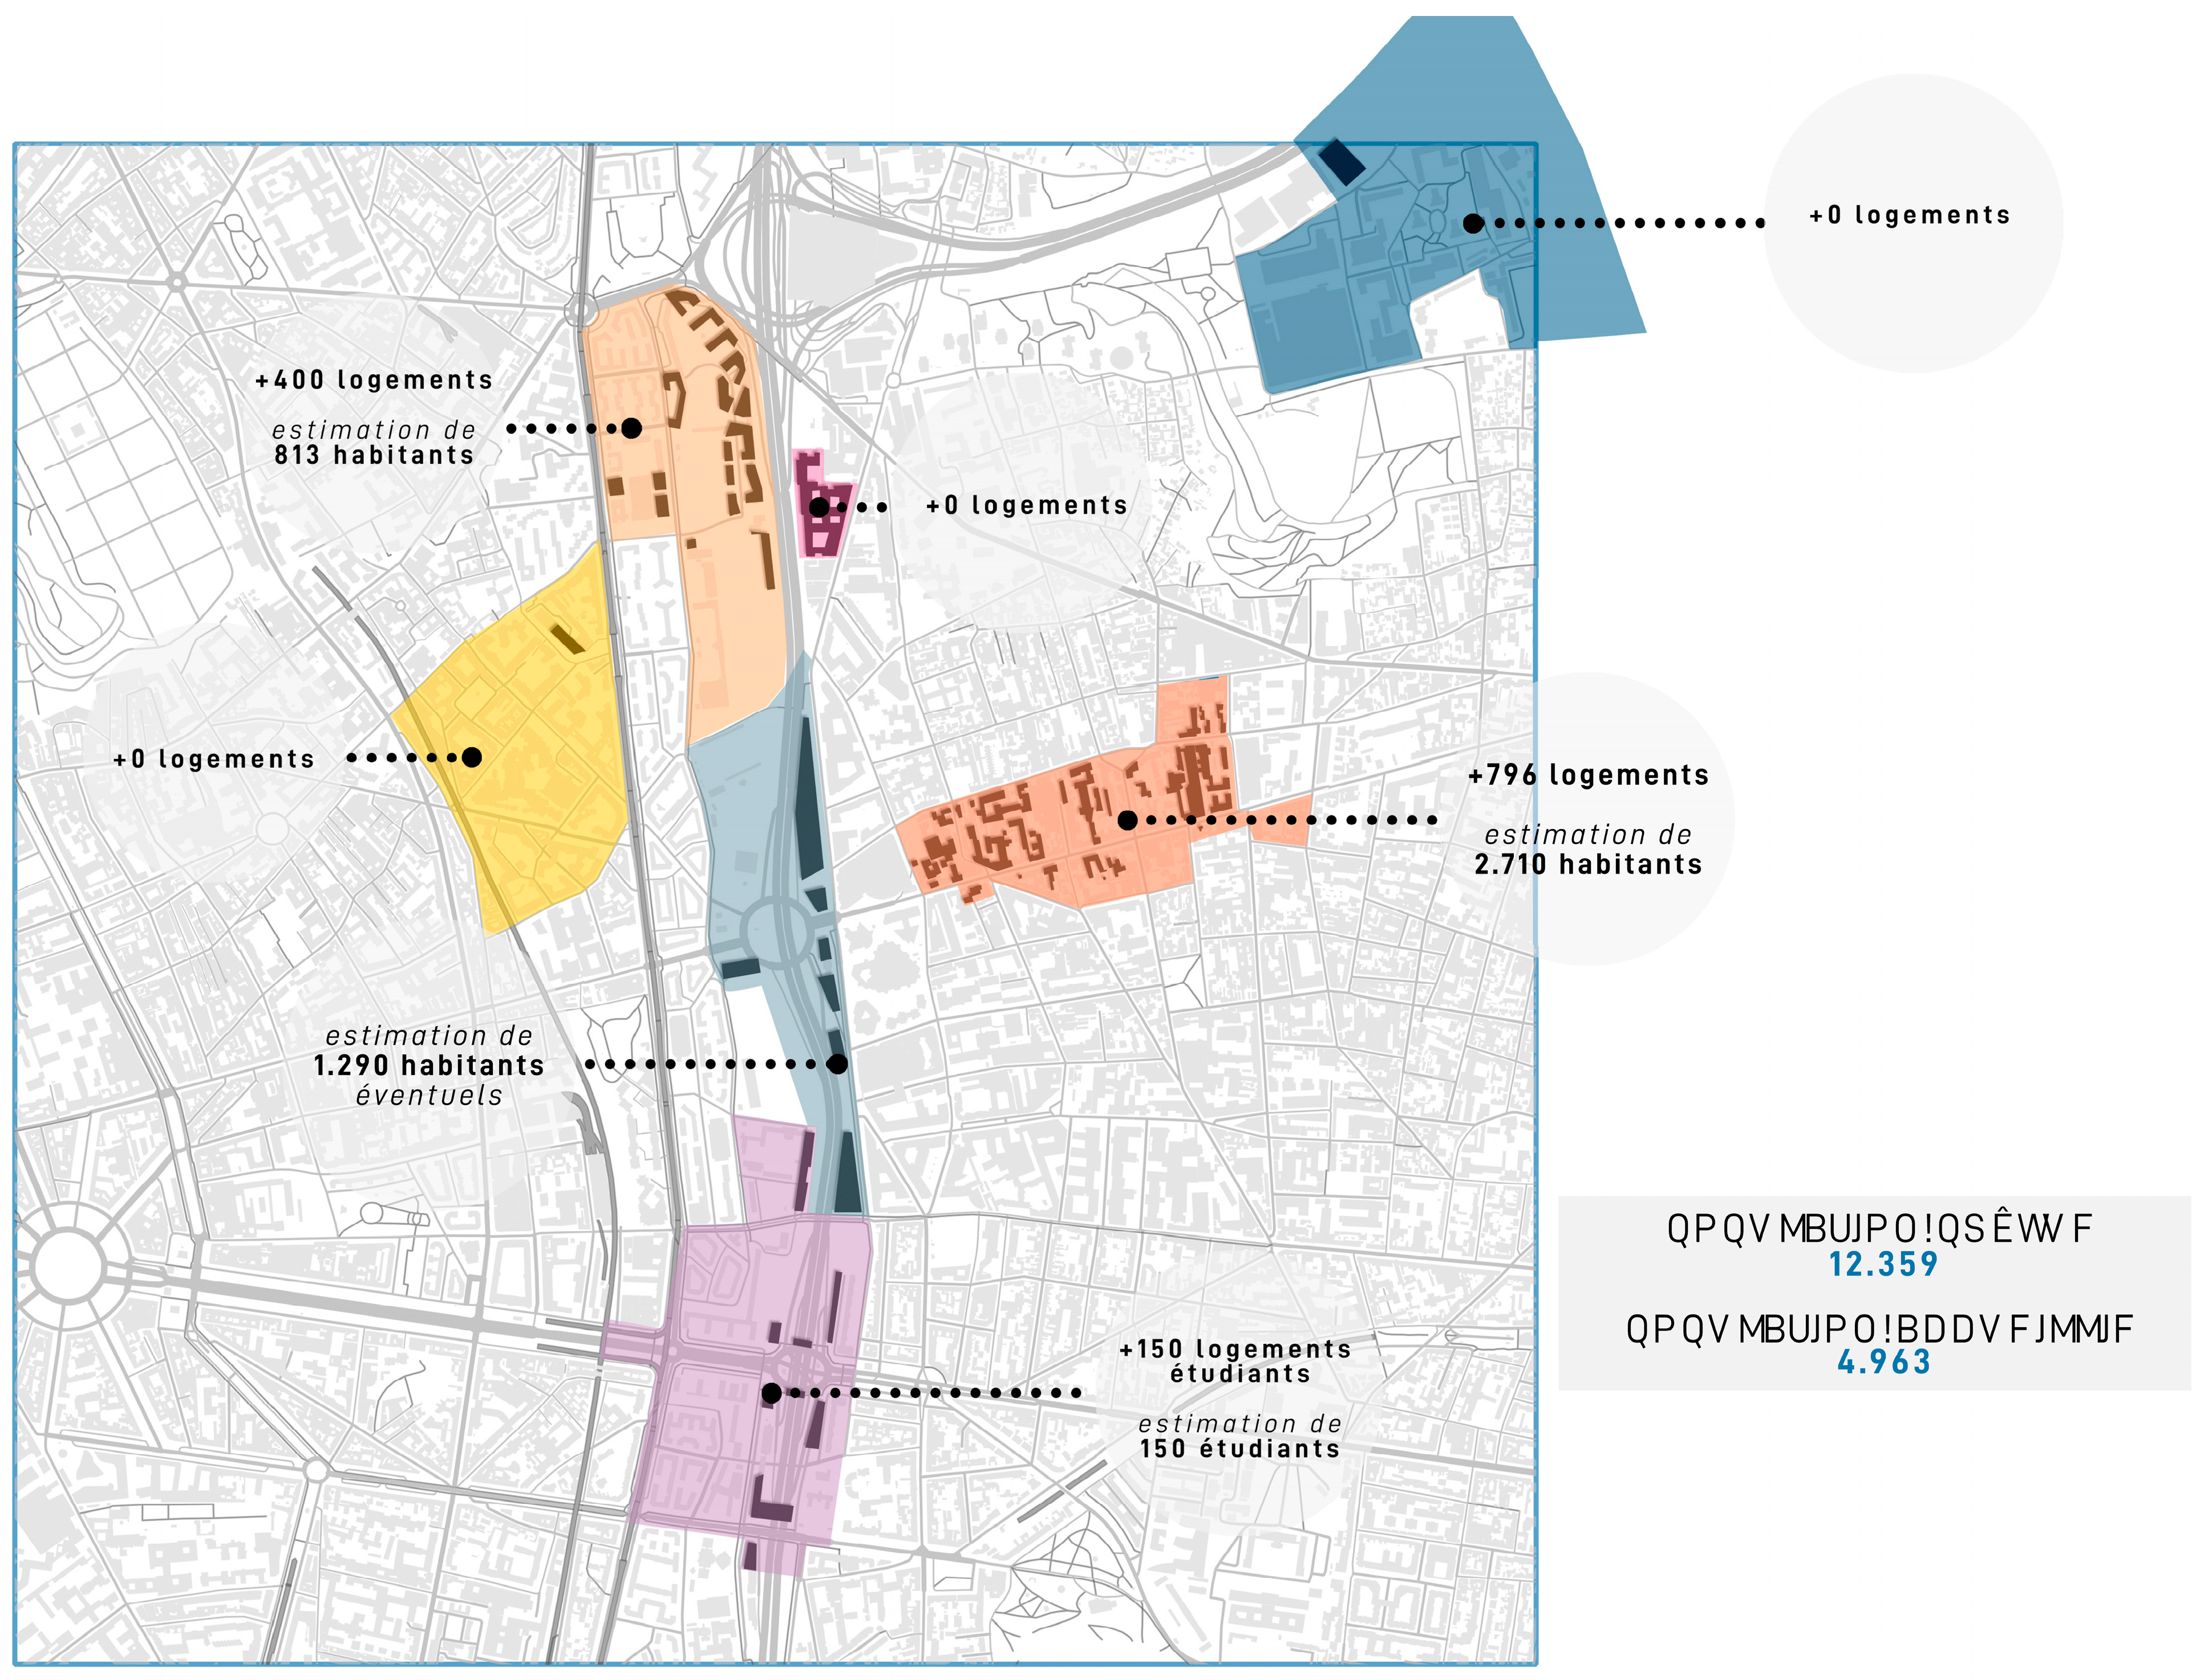
3.3. Planning and Design

The first step of the planning and design phase was to identify metadesign strategies that can integrate climate resilient design measures with urban project priorities. Following the identification of metadesign strategies, goals and actions were defined that could help to realize each city’s vision. Finally, specific adaptation and mitigation solutions capable of addressing each specific action were identified. Each solution is tied directly to the CLARITY technical cards (CLARITY Project Consortium, n.d.) which define the specific adaptation or mitigation performance of each solution in terms of key parameters such as albedo and emissivity. This enables the simulation of proposed measures in the post-intervention evaluation phase (Section 3.4) in order to test the climate impact of potential solutions and encourage an iterative and evidence-based design process. In addition to defining the climate impact of each solution, it was also critical to identify the co-benefits delivered by each metadesign strategy by calculating the environmental, social, and economic co-benefits of each respective strategy.
In this specific application to the Porte de Montreuil case, four metadesign strategies were identified based on best-practice city visions: the green-blue city, the 15 min city, the zero carbon city, and the circular city.
The green-blue city aims to incorporate urban greening with sustainable water management to provide ecological and amenity values while also recreating a natural water cycle. The green-blue infrastructure implemented to achieve a green-blue city vision delivers a range of environmental, economic, and social benefits [35].
The 15 min city is a residential urban concept that shifts the focus of transportation planning from mobility to accessibility. In a 15 min city, all residents can meet their needs within a 15 min walking or cycling radius. All residents should be able to access key services regardless of age, ability, or socioeconomic status [36]. The COVID-19 pandemic has led to a renewed interest in the 15 min city as a key urban planning vision due to the increasingly apparent importance of accessing essential amenities close to home [37].
The zero carbon city eliminates all internal carbon emissions while also balancing other emissions that it is responsible for [38]. The zero carbon city runs entirely on renewable energy, energy demand is minimized, and resources are managed responsibly through multi-stakeholder participation [39]. The circular city applies the concepts of a circular economy to promote regenerative urban systems. Specifically, a circular city aims to close, slow, and narrow resource loops. Circular cities focus on redefining waste systems, commodities, and energy to transition away from a linear economy. This transition is supported by new business models and innovative cross sector collaboration [40,41].
The complete metadesign process can be illustrated by examining in more detail the process of identifying goals, actions, solutions, and co-benefits for the green-blue city strategy. Based on the definition of the green-blue city, key goals include improving natural capital, reducing urban heat islands, promoting sustainable water management, and reducing the risk of flooding. Associated actions that could be implemented to achieve these goals include introducing additional green spaces, improving biodiversity, reducing impermeable surfaces, and storing and recycling rainwater. Figure 8 shows the specific adaptation and mitigation solutions (based on the CLARITY technical cards) that can be used to achieve these actions and meet the goals of a green-blue city. Each adaptation and mitigation measure is connected to a variety of environmental, social, or economic co-benefits.
Following the identification of adaptation and mitigation measures suitable for promoting the green-blue city, it was possible to visualize how these measures could relate in a spatial context in order to realize all aspects of this city’s vision. Figure 8 shows how each adaptation and mitigation solution could be implemented within an urban context and indicates which goal each solution relates to. The co-benefits of the overall city strategy are also summarized based on the respective co-benefits of each adaptation and mitigation measure.
This same process was completed for the 15 min city (Figure 9), zero carbon city (Figure 10), and circular city (Figure 11) in order to visualize how specific adaptation and mitigation measures could help to create each city vision, and how such solutions could be implemented within an urban context.
When developing potential designs, the priorities of Atelier Georges are also considered. Atelier Georges wishes to pursue an innovative architecture and urban planning approach, based on an iterative rather than consecutive design method for better articulation of different fields of expertise. The key challenges and design priorities of Atelier Georges in relation to the Porte de Montreuil project are as follows [24]:
-
Challenge 1—Energy efficiency and clean energy;
-
Challenge 2—Management of sustainable materials and circular economy;
-
Challenge 3—Mobility;
-
Challenge 4—Resilience;
-
Challenge 5—New “green” services;
-
Challenge 6—Green growth and smart cities;
-
Challenge 7—Sustainable water management;
-
Challenge 8—Biodiversity, vegetation, and agriculture;
-
Challenge 9—Inclusive city and local impact.
The design proposals of local and international student groups working on the Porte de Montreuil case were also considered when selecting solutions. These included the creation of ecological corridors, the transformation of the ring road into a new urban boulevard, the integration of water and vegetative cover into the city, the creation of mixed use areas, strategic reuse of building materials, and the implementation of shared transport strategies [34]. Following the metadesign process, the solutions from these four metadesign strategies in combination with stakeholder input were translated into the local context of the Porte de Montreuil area and included in a proposed master plan and subdistrict design. Figure 12 shows the proposed master plan for the Porte de Montreuil district.
The first step in drafting the proposed master plan was to map hotspots and flood risk areas alongside key elements of exposure such as existing green areas, schools, and cultural and heritage areas. Next, key activity hubs in the district were identified, and green connections were proposed to link these existing hubs, thus increasing the green-blue infrastructure and promoting the 15 min city concept, by improving the accessibility of services. Finally, specific types of climate resilient design solutions suitable for each area within the district were identified. Measures should be implemented to increase natural capital, decrease urban heat islands, and promote sustainable water management. It is important to note that this master plan is only a concept and primarily focuses on addressing heat-related challenges. Further iterations could be performed to create even more effective climate resilient design measures targeting both heat and flooding.
The proposed design for subdistrict B took the point of departure in the master plan shown in Figure 13 by utilizing the same activity hubs and green connections proposed in the master planning phase. In the subdistrict design, it was possible to further specify the climate resilient design measures that should be implemented in each zone of the subdistrict. Figure 12 shows that solutions corresponding to each of the four metadesign strategies (the green-blue city, the 15 min city, the zero carbon city, and the circular city) can be implemented in parallel and together form a holistic design capable of being embedded in the local context of the Porte de Montreuil area.

3.4. Post-Intervention Evaluation

The post-intervention evaluation phase aimed to test the climate impact of the proposed master plan and subdistrict design described in Section 3.3. The CLARITY HWLEM model was used to simulate the impact of proposed solutions on Tmrt and UTCI in the study area. To simulate the impact of these "best practice" designs on Tmrt and UTCI, the BAU land use file utilized in Section 3.1 was edited to reflect the proposed solutions. All proposed adaptation and mitigation measures could easily be simulated by the CLARITY model due to their direct connection to the climate resilient urban measures defined in the CLARITY technical cards (CLARITY Project Consortium, https://clarity-h2020.eu/ accessed on 1 June 2023).
Figure 13 below illustrates the changes in Tmrt (Figure 13a,b) and UTCI (Figure 13c,d) in the BAU 2050 scenario compared to the best practice 2050 scenario during a midcentury rare heat wave of 41 °C.
Figure 13 shows improvements in both Tmrt and UTCI in the best practice scenario compared to the BAU scenario. The best practice scenario also results in an improvement in the impact of a rare heat wave event with a 19% decrease in total hospitalization costs in subdistricts A and B compared to the BAU 2050 scenario. The excess mortality rate also decreases by 21% in subdistricts A and B compared to that of the BAU scenario.

4. Conclusions

Cities are at risk from climate change, and with the increasing frequency and intensity of extreme climate events, the need for design-led action to support urban climate resilience is more urgent than ever. This paper proposes a methodological framework for climate resilient urban design built around four sequential stages: climate analysis mapping, site survey and public space evaluation, planning and design, and post-intervention evaluation. Together these four phases enable a design process that balances climate benefits with co-benefits to identify locally relevant solutions that deliver adaptation and mitigation functions. The GIS-based simulation tools such as the CLARITY models allow for climate analysis mapping at the district and neighborhood scales and also provide an iterative tool for testing potential design solutions in terms of climate impact. The CLARITY models can simulate hazard conditions through mapping of heat stress indicators including Tmrt and UTCI but can also provide a powerful tool for illustrating impact through indicators such as hospitalization costs and mortality rates which directly link extreme climate events to tangible human consequences.
The site survey and public space evaluation phase can be modified depending on available data in the case study in question. In all cases, storytelling exercises such as day-in-the-life visioning can help to deepen the understanding of future plans and strategies through grounding policy goals and local planning priorities on a human scale that emphasizes the daily lived experience.
The metadesign strategies are a useful tool for grounding specific climate resilient design measures in best practice urban strategies that can be adapted to fit any local context. The four metadesign strategies proposed (the green-blue city, the 15 min city, the zero carbon city, and the circular city) can be adapted to any local context to design holistic plans that tackle climate challenges while also responding to context specific urban challenges.
The post-intervention evaluation is an important iterative phase that can utilize GIS-based tools to simulate the impact of proposed solutions. This phase provides decision-makers with the ability to continuously test solutions to ensure that the climate impact of potential measures is validated before project implementation.
This methodological framework has been applied in the Porte de Montreuil district, a priority area for urban redevelopment in Paris, France. The results show that the Porte de Montreuil case area is at risk from heat waves, but climate resilient design solutions can be proposed to reduce this risk while also delivering on community priorities and promoting local strategies and existing plans for the area.
In conclusion, the proposed framework for climate resilient urban design can help to guide decision-making on neighborhood and district scale urban development projects and provides a powerful tool for integrating adaptation and mitigation with locally appropriate urban design visions. Future tests of the proposed framework to support climate resilient urban design should be conducted in other cities contexts to highlight the potential and criticalities of the approach.

Author Contributions

Conceptualization, N.A., M.F.C., L.Q.-G., R.A.K., F.L., G.N., M.P., A.R., S.S., E.T., S.V., C.V. and M.F.L.; methodology, M.F.C., E.T., C.V. and M.F.L.; software, N.A., L.Q.-G., R.A.K., F.L., G.N., M.P., A.R., S.S., E.T., S.V. and M.F.L.; validation, M.F.C., E.T., C.V. and M.F.L.; formal analysis, N.A., M.F.C., L.Q.-G., R.A.K., F.L., G.N., M.P., A.R., S.S., E.T., S.V. and M.F.L.; investigation, N.A., M.F.C., L.Q.-G., R.A.K., F.L., G.N., M.P., A.R., S.S., E.T., S.V. and M.F.L.; resources, N.A., M.F.C., L.Q.-G., R.A.K., F.L., G.N., M.P., A.R., S.S., E.T., S.V. and M.F.L.; data curation, N.A., M.F.C., L.Q.-G., R.A.K., F.L., G.N., M.P., A.R., S.S., E.T., S.V., and M.F.L.; writing—original draft preparation, N.A., L.Q.-G., R.A.K., F.L., G.N., M.P., A.R., S.S., E.T., S.V. and M.F.L.; writing—review and editing, M.F.C., E.T., C.V. and M.F.L.; visualization, N.A., L.Q.-G., R.A.K., F.L., G.N., M.P., A.R. and S.S.; supervision, M.F.C., E.T., C.V. and M.F.L.; project administration, E.T. and M.F.L.; funding acquisition, E.T. and M.F.L. All authors have read and agreed to the published version of the manuscript.

Funding

This research was funded by the project UCCRN_edu—Climate Resilient Urban Design, Planning and Governance (2021–2024), which received funding from the European Union under the Erasmus+ programme, KA220 Action. Additional funding was received from the Basque Government through the SAREN Research Group (IT1619-22).

Institutional Review Board Statement

Not applicable.

Informed Consent Statement

Not applicable.

Data Availability Statement

Not applicable.

Acknowledgments

The work in this paper presents the results from the research and educational activities carried out by the working group from the University of Naples Federico II (UNINA) and Urban Climate Change Research Network European Hub, as part of the international mobility programs organized within the projects UCCRN_edu (www.uccrn.education, accessed on 1 June 2023), coordinated by UNINA (Italy), and CRUD—Climate Resilient Urban Design (https://www.laburba.com/recherches/crud/, accessed on 1 June 2023)—coordinated by University Gustave Eiffel (UGE, France). The authors would like to thank Bruno Barroca and Margot Pellegrino from UGE, organizers and curators of the workshops in Paris.

Conflicts of Interest

The authors declare no conflict of interest.

References

  1. IPCC. AR6 Climate Change 2021: The Physical Science Basis, Working Group I Contribution to the Sixth Assessment Report. 2021. Available online: https://www.ipcc.ch/report/ar6/wg1/ (accessed on 1 June 2023).
  2. Rosenzweig, C.; Solecki, W.; Romero-Lankao, P.; Mehrotra, S.; Dhakal, S.; Ali Ibrahim, S. (Eds.) Climate Change and Cities: Second Assessment Report of the Urban Climate Change Research Network; Cambridge University Press: Cambridge, UK, 2018. [Google Scholar]
  3. Romero-Lankao, P.; Bulkeley, H.; Pelling, M.; Burch, S.; Gordon, D.J.; Gupta, J.; Johnson, C.; Kurian, P.; Lecavalier, E.; Simon, D.; et al. Urban transformative potential in a changing climate. Nat. Clim. Chang. 2018, 8, 754–756. [Google Scholar] [CrossRef]
  4. Zuccaro, G.; Leone, M.; Martucci, C. Future research and innovation priorities in the field of natural hazards, disaster risk reduction, disaster risk management and climate change adaptation: A shared vision from the ESPREssO project. Int. J. Disaster Risk Reduct. 2020, 51, 101783. [Google Scholar] [CrossRef]
  5. Losasso, M. Urban regeneration: Innovative perspectives. TECHNE J. Technol. Archit. Environ. 2015, 10, 4–5. [Google Scholar] [CrossRef]
  6. Leone, M.; Raven, J. Multi-scale and adaptive-mitigation design methods for climate resilient cities. TECHNE J. Technol. Archit. Environ. 2018, 15, 299–310. [Google Scholar] [CrossRef]
  7. Zuccaro, G.; Leone, M.F. Building resilient cities: A simulation-based scenario assessment methodology for the integration of DRR and CCA in a multi-scale design perspective. Procedia Eng. 2018, 212, 871–878. [Google Scholar] [CrossRef]
  8. European Commission. Non-Paper Guidelines for Project Managers: Making Vulnerable Investments Climate Resilient; European Commission: Brussels, Belgium, 2013; Available online: https://climate-adapt.eea.europa.eu (accessed on 15 March 2020).
  9. Hewitt, C.; Mason, S.; Walland, D. The Global Framework for Climate Services. Nat. Clim Change 2012, 2, 831–832. [Google Scholar] [CrossRef]
  10. Zuccaro, G.; Leone, M.F. Climate Services to Support Disaster Risk Reduction and Climate Change Adaptation in Urban Areas: The CLARITY Project and the Napoli Case Study. Front. Environ. Sci. 2021, 9, 345. [Google Scholar] [CrossRef]
  11. Raven, J.; Stone, B.; Mills, G.; Towers, J.; Katzschner, L.; Leone, M.; Gaborit, P.; Georgescu, M.; Hariri, M. Urban planning and design. In Climate Change and Cities: Second Assessment Report of the Urban Climate Change Research Network; Rosenzweig, C.W., Solecki, P., Romero-Lankao, S., Mehrotra, S.D., Ali Ibrahim, S., Eds.; Cambridge University Press: New York, NY, USA, 2018; pp. 139–172. [Google Scholar]
  12. Leone, M.; Tersigni, E. Progetto Resiliente e Adattamento Climatico. Metodologie, Soluzioni Progettuali e Tecnologie Digitali; Clean: Napoli, Italy, 2020; pp. 94–123. [Google Scholar]
  13. Jeffrey, R. Cooling the public realm: Climate-resilient urban design. In Resilient Cities: Cities and Adaptation to Climate Change-Proceedings of the Global Forum 2010; Springer Netherlands: Dordrecht, The Netherlands, 2011. [Google Scholar]
  14. Javanroodi, K.; Nik, V.M.; Adl-Zarrabi, B. A multi-objective optimization framework for designing climate-resilient building forms in urban areas. IOP Conf. Ser. Earth Environ.Sci. 2020, 588, 032036. [Google Scholar] [CrossRef]
  15. Santos, L.G.; Nevat, I.; Pignatta, G.; Norford, L.K. Climate-informed decision-making for urban design: Assessing the impact of urban morphology on urban heat island. Urban Clim. 2021, 36, 100776. [Google Scholar] [CrossRef]
  16. Brears, R.C. Blue and Green Cities: The Role of Blue-Green Infrastructure in Managing Urban Water Resources. Springer: Berlin/Heidelberg, Germany, 2018. [Google Scholar]
  17. Badach, J.; Szczepański, J.; Bonenberg, W.; Gębicki, J.; Nyka, L. Developing the Urban Blue-Green Infrastructure as a Tool for Urban Air Quality Management. Sustainability 2022, 14, 9688. [Google Scholar] [CrossRef]
  18. Ascione, F.; Bianco, N.; De Masi, R.F.; Mauro, G.M.; Vanoli, G.P. Design of the Building Envelope: A Novel Multi-Objective Approach for the Optimization of Energy Performance and Thermal Comfort. Sustainability 2015, 7, 10809–10836. [Google Scholar] [CrossRef]
  19. Kandya, A.; Mohan, M. Mitigating the Urban Heat Island effect through building envelope modifications. Energy Build. 2018, 164, 266–277. [Google Scholar] [CrossRef]
  20. Pellegrino, M.; Musy, M. Seven questions around interdisciplinarity in energy research. Energy Res. Soc. Sci. 2017, 32, 1–12. [Google Scholar] [CrossRef]
  21. Koutra, S.; Becue, V.; Gallas, M.A.; Ioakimidis, C.S. Towards the development of a net-zero energy district evaluation approach: A review of sustainable approaches and assessment tools. Sustain. Cities Soc. 2018, 39, 784–800. [Google Scholar] [CrossRef]
  22. Ville de Paris. Projet 20e – Porte de Montreuil. Available online: https://www.paris.fr/pages/20-e-porte-de-montreuil-3329 (accessed on 1 June 2023).
  23. TVK. Porte de Montreuil – Projet urbain. Available online: http://www.tvk.fr/architecture/porte-de-montreuil (accessed on 1 June 2023).
  24. Reinventing Cities. Designing a Green and Just Urban Future; Porte de Montreuil: Paris, France; Available online: https://www.c40reinventingcities.org/en/professionals/winning-projects/porte-de-montreuil-1303.html (accessed on 1 June 2023).
  25. Clarity. Available online: https://csis.myclimateservice.eu/ (accessed on 1 June 2023).
  26. Yu, B.; Liu, H.; Wu, J.; Lin, W.-M. Investigating impacts of urban morphology on spatio-temporal variations of solar radiation with airborne LiDAR data and a solar flux model: A case study of downtown Houston. Int. J. Remote Sens. 2009, 30, 4359–4385. [Google Scholar] [CrossRef]
  27. Lindberg, F.; Grimmond, C.S.B. The Influence of Vegetation and Building Morphology on Shadow Patterns and Mean Radiant Temperatures in Urban Areas: Model Development and Evaluation. Theor. Appl. Climatol. 2011, 105, 311–323. [Google Scholar] [CrossRef]
  28. Krüger, E.L.; Minella, F.O.; Matzarakis, A. Comparison of different methods of estimating the mean radiant temperature in outdoor thermal comfort studies. Int. J. Biometeorol. 2014, 58, 1727–1737. [Google Scholar] [CrossRef] [PubMed]
  29. Thorsson, S.; Rocklöv, J.; Konarska, J.; Lindberg, F.; Holmer, B.; Dousset, B.; Rayner, D. Mean radiant temperature–A predictor of heat related mortality. Urban Clim. 2014, 10, 332–345. [Google Scholar] [CrossRef]
  30. Lindberg, F.; Onomura, S.; Grimmond, C.S.B. Influence of ground surface characteristics on the mean radiant temperature in urban areas. Int. J. Biometeorol. 2016, 60, 1439–1452. [Google Scholar] [CrossRef]
  31. CLARITY Project Consortium. Clarity D3.2 Science Support Report V1. 2019. Available online: https://clarity-h2020.eu/sites/clarity-h2020.eu/files/public/content-files/deliverables/CLARITY%20D3.2%20Science%20support%20report%20v1.pdf (accessed on 1 June 2023).
  32. Di Napoli, C.; Barnard, C.; Prudhomme, C.; Cloke, H.L.; Pappenberger, F. ERA5-HEAT: A global gridded historical dataset of human thermal comfort indices from climate reanalysis. Geosci. Data J. 2021, 8, 2–10. [Google Scholar] [CrossRef]
  33. City of Paris, Green Parks and Environment, Urban Ecology Agency. Paris Climate Action Plan. 2018. Available online: https://cdn.paris.fr/paris/2019/07/24/1a706797eac9982aec6b767c56449240.pdf (accessed on 1 June 2023).
  34. URBAN DESIGN CLIMATE WORKSHOP #1, PORTE DE MONTREUIL PARIS, Report. Available online: https://www.uccrn.education/udcw-reports%20/#dearflip-df_1092/3/ (accessed on 1 June 2023).
  35. Tang, Y.T.; Chan, F.K.S.; O’Donnell, E.C.; Griffiths, J.; Lau, L.; Higgitt, D.L.; Thorne, C.R. Aligning ancient and modern approaches to sustainable urban water management in China: Ningbo as a “Blue-Green City” in the “Sponge City” campaign. J. Flood Risk Manag. 2018, 11, e12451. [Google Scholar] [CrossRef]
  36. Moreno, C.; Allam, Z.; Chabaud, D.; Gall, C.; Pratlong, F. Introducing the “15-Minute City”: Sustainability, resilience and place identity in future post-pandemic cities. Smart Cities 2021, 4, 93–111. [Google Scholar] [CrossRef]
  37. Pozoukidou, G.; Chatziyiannaki, Z. 15-Minute City: Decomposing the New Urban Planning Eutopia. Sustainability 2021, 13, 928. [Google Scholar] [CrossRef]
  38. Kennedy, S.; Sgouridis, S. Rigorous classification and carbon accounting principles for low and Zero Carbon Cities. Energy Policy 2011, 39, 5259–5268. [Google Scholar] [CrossRef]
  39. Urrutia-Azcona, K.; Stendorf-Sørensen, S.; Molina-Costa, P.; Flores-Abascal, I. Smart Zero Carbon City: Key factors towards smart urban decarbonisation. DYNA 2019, 94, 676–683. [Google Scholar] [CrossRef] [PubMed]
  40. Langergraber, G.; Pucher, B.; Simperler, L.; Kisser, J.; Katsou, E.; Buehler, D.; Mateo, M.C.G.; Atanasova, N. Implementing nature-based solutions for creating a resourceful circular city. Blue-Green Syst. 2020, 2, 173–185. [Google Scholar] [CrossRef]
  41. Paiho, S.; Mäki, E.; Wessberg, N.; Paavola, M.; Tuominen, P.; Antikainen, M.; Heikkilä, J.; Rozado, C.A.; Jung, N. Towards circular cities—Conceptualizing core aspects. Sustain. Cities Soc. 2020, 59, 102143. [Google Scholar] [CrossRef]
Figure 1. Projected future population in Porte de Montreuil (Source: élaboration by authors from PLU Paris, INSEE—Institut national de la statistique et des études économiques—and the APUR—Atelier Parisien d’Urbanisme—data).
Sustainability 15 13857 g001
Figure 2. Main urban developments in the Porte de Montreuil area (Source: illustration by authors from PLU Paris).
Sustainability 15 13857 g002
Figure 3. Porte de Montreuil district and subdistrict study areas. A and B were used to distinguish the subdistricts. (Source: illustration by authors).
Sustainability 15 13857 g003
Figure 4. Land use of current state scenario (a) and planned land use within the business-as-usual scenario (b). (Source: illustration by students of the Urban Design Climate Workshop #1, Paris, November 2022).
Sustainability 15 13857 g004
Figure 5. (a) Tmrt of current-state heat wave in the Porte de Montreuil district (RCP8.5 20112040 rare event, 38 °C); (b) Tmrt of BAU worst case scenario heat wave in the Porte de Montreuil district (RCP8.5 2041–2070, 41 °C). Illustration by authors.
Sustainability 15 13857 g005
Figure 6. (a) UTCI of current state heat wave in the Porte de Montreuil district (RCP8.5 2011–2040 rare event, 38 °C); (b) UTCI BAU of worst case scenario heat wave in the Porte de Montreuil district (RCP8.5 2041–2070, 41 °C). Illustration by authors.
Sustainability 15 13857 g006
Figure 7. A day-in-the-life in Porte de Montreuil 2050—Pauline. Illustration by authors.
Sustainability 15 13857 g007
Figure 8. City vision, green and blue city. Illustration by authors.
Sustainability 15 13857 g008
Figure 9. City vision, 15 min city. Illustration by authors.
Sustainability 15 13857 g009
Figure 10. City vision, zero carbon city. Illustration by authors.
Sustainability 15 13857 g010
Figure 11. City vision, circular city. Illustration by authors.
Sustainability 15 13857 g011
Figure 12. Current land use (a) and proposed master plan (b) for the Porte de Montreuil district. Illustration by authors.
Sustainability 15 13857 g012
Figure 13. Tmrt in the Porte de Montreuil area for BAU 2050 scenario (a) and Best Practice 2050 scenario (b) during a rare heat wave event (RCP8.5 2041–2070, 41 °C). UTCI in the Porte de Montreuil area for BAU 2050 scenario (c) and Best Practice 2050 scenario (d) during a rare heat wave event (RCP8.5 2041–2070, 41 °C). Illustration by authors.
Sustainability 15 13857 g013aSustainability 15 13857 g013b
Table 1. Reference scenarios for the Porte de Montreuil district.
Frequency of HeatwavesCurrent State * with Current Land UseBusiness-as-Usual Scenario, BaU 2050 *, with Planned Land UseBest Practice 2050 * with Proposed Master Plan Prototype
Frequent33 °C for 2.9 days36 °C for 2.8 days36 °C for 2.8 days
Rare38 °C for 2.0 days41 °C for 2.0 days41 °C for 2.0 days
* Current State: The situation of the city in its current state, in both built-up area and population
* Business as Usual Scenario – BAU 2050: The situation of the city in the future (in the year 2050), considering the development of the built-up area and population according to the current standards of development
* Best Practice 2050: The situation of the city in the future (to the year 2050), considering the development of the built-up area and population by implementing climate change adaptation and mitigation measures
Disclaimer/Publisher’s Note: The statements, opinions and data contained in all publications are solely those of the individual author(s) and contributor(s) and not of MDPI and/or the editor(s). MDPI and/or the editor(s) disclaim responsibility for any injury to people or property resulting from any ideas, methods, instructions or products referred to in the content.

