Article

Accumulated Carbon Fractions in Tropical Sandy Soils and Their Effects on Fertility and Grain Yield in an Integrated Crop–Livestock System

by
Deyvison de Asevedo Soares
1,*,
Bianca Midori Souza Sekiya
2,
Viviane Cristina Modesto
3,
Allan Hisashi Nakao
3,
Leandro Alves Freitas
3,
Isabela Malaquias Dalto de Souza
3,
João Henrique Silva da Luz
1,
Fernando Shintate Galindo
2,
Gelci Carlos Lupatini
2,
Gustavo Pavan Mateus
4,
Carolina dos Santos Batista Bonini
2,
Cristiana Andrighetto
2,
Iêda de Carvalho Mendes
5,
Paulo Sergio Pavinato
1 and
Marcelo Andreotti
3
1
Department of Soil Science, Luiz de Queiroz College of Agriculture, University of Sao Paulo, Piracicaba 13418-900, Brazil
2
College of Agronomic and Technological Sciences, Sao Paulo State University “Julio de Mesquita Filho”, Dracena 17900-000, Brazil
3
Department of Plant Health, Rural Engineering and Soils, Sao Paulo State University “Julio de Mesquita Filho”, Ilha Solteira 15385-000, Brazil
4
São Paulo Agency of Agribusiness Technology (APTA), Andradina 16900-970, Brazil
5
Embrapa Cerrados, BR020, Km 18, Planaltina 73310-970, Brazil
*
Author to whom correspondence should be addressed.
Sustainability 2023, 15(18), 13829; https://doi.org/10.3390/su151813829
Submission received: 1 July 2023 / Revised: 1 September 2023 / Accepted: 5 September 2023 / Published: 16 September 2023
(This article belongs to the Special Issue Sustainable Agriculture for Crop Cultivation)

Abstract

:
Food production in sandy soils has evolved significantly, most notably through the advent of integrated crop–livestock systems (ICLSs). ICLSs increase soil cover, which maintains soil moisture and sequesters carbon (C). Here we investigate the influence of ICLSs on soil physical, chemical, and biochemical properties, and grain yield (GY) in tropical sandy soils in short-time. We compared seven ICLSs in two consecutive crops seasons (with soybean or maize as cash crops) in southeastern Brazil. These were (1) corn + Urochloa brizantha cv. BRS Paiaguás—soybean (ICL-Paiaguás); (2) corn + U. brizantha cv. BRS Piatã—soybean; (3) corn + U. ruziziensis—soybean; (4) corn–soybean under conventional tillage (CT) as a negative control; (5) corn–soybean under no-tillage (NT) as a positive control; (6) Paiaguás grass—continuous grazing (Perennial Paiaguás); (7) and Piatã grass—continuous grazing (Perennial Piatã). Soybean and corn GY data, soil physical and chemical attributes, and soil enzymatic activity were subjected to descriptive statistics and multivariate analysis. CT and NT shared high loadings of H + Al, Al, and soil temperature and low loadings of soil pH, SOM physical and chemical fractions, cationic exchange capacity, and arylsulfatase activity. ICL-Paiaguás and Perennial Piatã had a similarly high loading of total N, humin, total organic carbon, and mineral-associated carbon stocks. The fulvic acid fraction was the most sensitive to C accumulation in the sandy soil under ICLSs. Soil water and thermal regimes were limiting in both CT and NT. The study not only confirms the capacity of conservation mechanisms to enhance soil-based ecosystem functions, but it also highlights the potential of ICLSs to aid sustainable food production even in the context of tropical sandy soils, which frequently receive limited attention in intensive agricultural practices.

Graphical Abstract

1. Introduction

Inadequate soil management in agricultural systems promotes the loss of carbon (C) to the atmosphere via CO2 [1,2] and impairs ecosystem services. These effects on the environment also reduce the quality of human life [3]. One option for the sustainable optimization of land use is integrated crop–livestock systems (ICLSs), which integrate agriculture and livestock within the same area. This integration promotes ecological interactions that increase the efficiency of nutrient cycling and use through crops, thus reducing the need for external inputs [4,5,6,7,8]. These benefits stem from biotic and abiotic changes within the soil–plant–atmosphere system, brought by animal components. These subsequent impacts influence the biogeochemical processes of soil nutrients [7,9]. The resulting synergistic relationships also have environmental and socioeconomic benefits [4].
Food production in sandy soils has evolved significantly in recent years [3]. ICLSs are a valuable tool for sustainable production in sandy soils [10]. Forage intercropping with the main crop in the off-season increases C inputs in the soil, and system consolidation helps maintain or increase the total organic carbon (TOC) via crop residues and animal manure [11,12]. In addition to improving soil fertility, TOC accumulation in the soil mitigates CO2 emissions to the atmosphere [13,14,15] and the effects of climate change.
However, TOC assessment alone may not be sufficient to detect the influences of land use and management [16], as detecting potential changes in TOC fractions requires a thorough evaluation. Studies under different environmental conditions have indicated that evaluations of the physical [17,18,19] and chemical fractions of soil organic matter (SOM) can be used to predict the effects of management systems on soil quality [18,20,21]. SOM encompasses all living organisms and their derivatives in varying degrees of decomposition, even plant residues on topsoil [22], which are represented by particulate C [23]. Particulate C has a fast decomposition rate and is easily consumed by soil microorganisms [24]. As particulate C is the most labile fraction of C, it is more sensitive to changes in land use and management.
The cropping system has a strong impact on TOC and soil biochemical activity [25], especially in the tropics, where the lack of climate constraints (aeration, temperature, and soil moisture) accelerates decomposition [26]. TOC and soil biochemical activity are sensitive to soil disturbance, as the rupture of soil aggregates exposes organic compounds to biotic and abiotic oxidation and promotes the loss of hydrophobic components. This exposure can also reduce the stability of humic associations and structures [27]. In sandy soils, the hydrophobic components of SOM are essential for preserving and stabilizing soil aggregates [28]. For establishing and maintaining an ICLS under no-tillage (NT), straw is of fundamental importance [29] for protecting the soil and contributing nutrients and energy for plants and the biota [30,31].
The susceptibility to degradation and agricultural productivity of tropical sandy soils is relatively homogeneous, but there is still little information on the effects of different management systems on the chemical, biochemical, and physical-hydraulic properties of these soils [10,32]. Multivariate analyses are essential for understanding the joint effects of the environmental processes that develop under these intensive cultivation conditions throughout the year. In this study, the effects of different agricultural production systems on soil water and thermal regimes, soil physical, chemical, and biochemical properties, and grain yield (GY) in the main season (soybean) and off-season (corn) were evaluated in tropical sandy soil. We hypothesized that in the short term, ICLSs increase the accumulation of labile organic matter fractions (SOM) in sandy soil, thereby improving soil properties and GY.

2. Materials and Methods

2.1. Description of the Study Site and Local Climatic Conditions

The experiment was conducted in Caiuá, state of São Paulo, Brazil (21°49′ W, 51°59′ S, and 330 m altitude), during three consecutive crop seasons (2016/17, 2017/18, and 2018/19). The local soil is classified as a sandy texture dystrophic Latossolo Vermelho (or Oxisol, USDA Soil Taxonomy) [33] with 816, 116, and 68 g kg−1 of sand, clay, and silt, respectively, in the 0.0–0.2 m soil layer [34].
According to Köppen’s classification, the local climate is Aw [35], i.e., humid tropical with rainy summers and dry winters. The average annual rainfall is 1353 mm, and the average annual temperature is 24.3 °C. January, February, and December are the hottest months (the average photoperiod is 13.2 h and the average temperature is 27 °C—Supplementary Table S1 and Figure 1), whereas June and July are the coldest months (the average photoperiod is 10.7 h and the average temperature is 21 °C—Supplementary Table S1 and Figure 1) [36]. Average rainfall and temperature data collected during the experimental period are shown in Figure 1 [37].
From 2007 to 2014, the experimental area (42 ha) was cultivated with Megathyrsus maximus (Syn. Panicum maximum) cv. Massai for seed production. From March to July 2015, corn was cultivated, and from November to February, the area was desiccated for soybean cultivation under no-tillage. In March 2016, soil samples were collected from the 0.0–0.2 m layer (with manually driven probe), and the initial soil chemical characteristics were determined [38]: soil pH, 6.0; OM, 14 g dm−3; P, 21 mg dm−3; S-SO4, 4 mg dm−3; K, 1.1 mmolc dm−3; Ca, 21 mmolc dm−3; Mg, 11 mmolc dm−3; H+Al, 12 mmolc dm−3; cationic exchange capacity (CEC), 45.2 mmolc dm−3; base saturation (BS), 70%. The total soil N content in the 0.0–0.10 layer was determined by the Kjeldahl method and was 0.94 g kg−1. The C/N ratio was 9.3.
Undisturbed soil samples (volumetric ring) from the 0.0–0.2 m layer were used to determine macroporosity, microporosity, total porosity, and soil bulk density, which were 0.08 m3 m−3, 0.28 m3 m−3, 0.35 m3 m−3, and 1.58 Mg m−3, respectively [34].

2.2. Experimental Design and Treatments

Seven systems comprising different crops in summer and autumn and different management practices were implemented in 2016. Therefore, treatments were: (1) corn + Urochloa brizantha cv. BRS Paiaguás—soybean (ICL-Paiaguás); (2) corn + U. brizantha cv. BRS Piatã—soybean (ICL-Piatã); (3) corn + U. ruziziensis—soybean (ICL-Ruziziensis); (4) corn–soybean under conventional tillage as a negative control (CT); (5) corn–soybean under no-tillage as a negative control (NT); (6) Paiaguás grass—continuous grazing (Perennial Paiaguás); and (7) Piatã grass—continuous grazing (Perennial Piatã). Treatments 1, 2, and 3 were under no-tillage.

2.3. Sowing, Management, and Evaluation of Corn and Intercropped Forage

The corn hybrid DKB 177 was sown in March 2017 and 2018 with a row spacing of 0.90 m and a density of 50,700 plants ha−1 under NT (except in CT). In ICL-Paiaguás, ICL-Piatã, and ICL-Ruziziensis, the corn was intercropped with U. brizantha BRS Paiaguás, U. brizantha BRS Piatã, or U. ruziziensis, respectively. The forage seed was sown simultaneously with corn at a density of 5 kg ha−1 of pure and viable seeds by using an additional box for forage seeds coupled to the seeder. The forage seeds were distributed in front of the seeder through ducts between the corn rows 0.06 to 0.08 m below the corn seed. Corn seedlings emerged 5 days after sowing.
In 2017, corn mineral fertilization was performed in the sowing furrow with 300 kg ha−1 08-28-16 fertilizer. Corn topdressing was carried out at V5 with 230 kg ha−1 20-00-20 fertilizer [39]. After emergence, subdoses of 8 g ha−1 nicosulfuron and 1.5 kg ha−1 atrazine were applied to suppress initial forage growth [40]. The perennial pastures were maintained by applying 240 kg ha−1 30-00-10 fertilizer as topdressing twice in the rainy season. In 2018, corn mineral fertilization was performed in the sowing furrow with 200 kg ha−1 08-28-16 fertilizer. Corn topdressing was performed with 150 kg ha−1 ammonium nitrate at V5 and 60 kg ha−1 KCl at V8, at the end of the rainy season (Supplementary Table S2). Subdoses of 120 mL ha−1 mesotrione and 2 L ha−1 atrazine were applied to retard initial forage growth [41]. The corn was harvested at the stage of full maturity (R6) in July of each year.
After the second corn harvest, Nellore steers with an initial age of 12 months and an average weight of 250 kg were randomly distributed into homogeneous groups in ICL-ruziziensis, ICL-Piatã, and ICL-Paiaguás and left to graze for three months. In the perennial pastures (Perennial Piatã and Perennial Paiaguás), Nellore steers were randomly distributed in homogeneous groups and grazed throughout the year. The grazing method was continuous stocking with a variable stocking rate to maintain a forage height of 0.30 m. The stocking rate was adjusted according to the forage mass, which was determined monthly. In each plot, five test animals were used, which were selected according to a homogeneous weight pattern, and a variable number of grazing regulators were used. The stocking rate was adjusted as needed [42] and averaged 4.3 animal units (AU: 450 kg live weight).
Two weeks before soybean sowing (October 2017 and 2018), the forage in the ICLSs (ICL-Paiaguás, ICL-Piatã, and ICL-Ruziziensis) was desiccated for straw formation (Supplementary Figure S2) by spraying glyphosate (1.44 kg ha−1 active ingredient) in a volume of 200 L ha−1.

2.4. Soybean Sowing and Evaluation of Soybean Yield and Soil Moisture and Temperature

Soybean seeds of the cultivar TMG 7063 were sown in early October 2017 and early November 2018. The seeds were sown with a seeder fertilizer and a row spacing of 0.45 m at 14 seeds per linear meter to achieve a target population of 300,000 plants ha−1. The seeds were inoculated with Bradyrhizobium bacteria: 80 g of peaty solid inoculant and 150 mL of liquid inoculant per 40 kg of seed. In 2017/18, sowing fertilization comprised 340 kg ha−1 of 04-30-10 (NPK) formulated fertilizer; in 2018/19, 200 kg ha−1 of 04-30-10 (NPK) formulated fertilizer + 130 kg ha−1 KCl was applied, as recommended by [39] (Supplementary Table S2). Crop management was performed according to crop needs.
Soybean was harvested in March 2018 and February 2019 in the 2017/18 and 2018/19 crop seasons, respectively. Grain yield (GY) was manually determined using eight sampling points for each experimental plot. Each sample consisted of two rows of plants; each row was 5 m in length. The plants were mechanically threshed, and the grains were weighed. The GY was extrapolated to kg ha−1 (130 g kg−1 on a wet basis).
The temperature of the soil in each plot at a depth of 0.1 m was measured using a digital rod thermometer (Soloterm 1200; Solotest, São Paulo, SP, Brazil). Gravimetric humidity was determined according to Teixeira et al. [34] at a depth of 0.10 m. These measurements were performed at three points in each plot at 30-day intervals from the date of forage desiccation (November of each year) until April.

2.5. Soil Sampling and Enzymatic Activity Analysis

At the R8 stage of soybean, the soil was sampled for enzymatic activity analysis. Samples were collected from the 0.0–0.1 m layer in each experimental plot using a probe-type auger. Sampling was carried out in a cross-section of the soybean sowing line. One sample per plot was collected, and each sample consisted of 12 subsamples (4 collected from the rows and 8 from between the rows).
The activities of soil enzymes associated with the carbon (β-glucosidase), phosphorus (acid phosphatase), and sulfur (arylsulfatase) cycles were evaluated using the methods described by Tabatabai [43]. The soil samples were prepared according to the FERTBIO soil sampling concept described in Mendes et al. [44]. Briefly, the soil samples were air-dried at room temperature for at least two weeks, passed through a 2-mm sieve, and stored at room temperature. The analyses were performed within one week after air drying. Enzyme activity was assayed in duplicate, including one control, as described in Tabatabai [43]. Due to the short incubation periods (one hour), toluene was omitted from the assays. Enzyme activity was expressed in µg p-nitrophenol (PNP) kg−1 h−1.

2.6. Soil Sampling and Chemical, Physical, and SOM Fractionation Analyses

After the soybean harvest, soil chemical properties (macro- and micronutrients) in the 0.0–0.1 m layer were evaluated using a composite sample of 20 subsamples per hectare collected with a probe-type auger. The soil samples were analyzed for pH; exchangeable P, Ca, Mg, and K contents; H+Al content; CEC at pH 7.0; and Cu, Fe, Mn, and Zn contents, according to van Raij et al. [38]. The total N content in the soil was determined by the Kjeldahl method, which was used to calculate the C/N ratio in SOM and the total N stock.
In addition to sampling for chemical analysis, undisturbed soil samples were collected in duplicate from the 0–0.10 m layer using volumetric rings. These samples were used to determine macroporosity, microporosity, total porosity, and density according to Teixeira et al. [34]. The particulate organic carbon (POC) fraction was determined by SOM granulometric fractionation according to Cambardella and Elliott [45]. The POC and TOC data were used to calculate the carbon fraction associated with the clay and silt fractions (C-M) by subtracting POC from TOC. The fractions of fulvic acids (FAF), humic acids (HA), and humin (HU) were determined according to the International Society of Humic Substances [46] with adaptations from Benites et al. [47].
The C stocks of all SOM fractions (TOC, POC, C-M, HU, HA, and FAF) and total N were calculated by the equivalent-layer method (Equation (1)) [48] and corrected according to the equivalent mass method (Equation (2)) [49]. The latter uses the soil mass of a reference system (conventional tillage system—CT) as the basis for calculating stocks in other systems.
TOC Stock = (TOC × Ds × h)/10
TOC Stock is the soil C stock (Mg ha−1); TOC is the soil C content (g dm−3); Ds is the soil bulk density (Mg m−3); and h is the height of the sampled soil layer (cm).
TOC Stockcorrected = [TOC × Ds × (Dsref/Dstreat × h)]/10
TOC Stockcorrected is the soil organic carbon stock (Mg ha−1); TOC is the organic C content at the sampled depth (g kg−1); Dstreat is the apparent density of the soil at the sampled depth (Mg m−3); Dsref is the soil density at the sampled depth in the reference area (mg m−3); and h is the height of the sampled soil layer (cm).

2.7. Statistical Analyses

Descriptive statistics (minimum, mean, maximum, standard error of the mean, and coefficient of variation) were analyzed to classify the variability of each attribute. The hypothesis of multivariate normality was tested before conducting hierarchical cluster analysis and principal component analysis (PCA). These analyses aimed to reduce the number of variables and visualize the attributes with the greatest interactions with soil C accumulation and crop yield.
Principal component analysis was performed in R version 4.0.1 using the packages “FactoMineR”, “shiny”, “FactoInvestigate”, and “ggplot2”. Following Kaiser [50], the principal components (PCs) with eigenvalues greater than unity, that is, the principal components that explained most of the variation in the data set, were considered in the analysis [51]. Heatmaps associated with multivariate cluster analysis were built using the Euclidean distance between groups with the “heatmap3” package in R.

3. Results

3.1. Changes in Soil Physical and Chemical Properties

Descriptive statistics (Table 1) are presented only for variables with significant correlations in the PCA. The largest amplitude between the minimum and maximum TOC stocks occurred in the last year (2019, 8 t ha−1). This difference may have been due to the deleterious effects of periodic soil disturbances under intensive management compared with conservation systems. Conservation systems increase plant dry matter inputs and maintenance in the soil, resulting in the accumulation of greater amounts of carbon over time. The difference between the minimum and maximum pH values was 1.8 units in 2017 and 1.4 units in 2019. The average pH values in 2017 and 2019 were 5.6 and 5.4, which are classified as low and medium acidity, respectively [38].
The K content in both years was classified as average, while the initial contents of Ca and Mg were high [38]. Compared with 2017, the contents of Ca and Mg decreased by half in 2019, and the coefficients of variation (CVs) indicated that spatial differences were reduced. The initially high Ca and Mg contents were residuals from liming performed before the implementation of the treatments and from the nutritional management of the forage previously grown for seed production in the study area.
The levels of the micronutrients Cu and Mn were initially average and high, respectively, and these levels were maintained in 2019. By contrast, the Fe content doubled and became high [38], possibly due to the increase in soil acidification in some areas, as implied by the lower minimum pH value in 2019 (Table 1).

3.2. Changes in Grain Yield, Temperature, Moisture, and Enzymatic Activity in the Soil

As shown in Table 2, the average corn GY in 2017 was higher than the Brazilian average for the off-season harvest (4673 kg ha−1) [52]. In the 2019 harvest, weather conditions severely compromised corn GY, which was approximately 1/3 of the Brazilian average (5682 kg ha−1) [52] (Table 2).
The soil temperature was roughly the same in both years based on the means and coefficients of variation (CV). The variation in soil moisture differed between the years, highlighting the long-term sensitivity of soil moisture to straw formation and maintenance in sandy soils (Table 2).

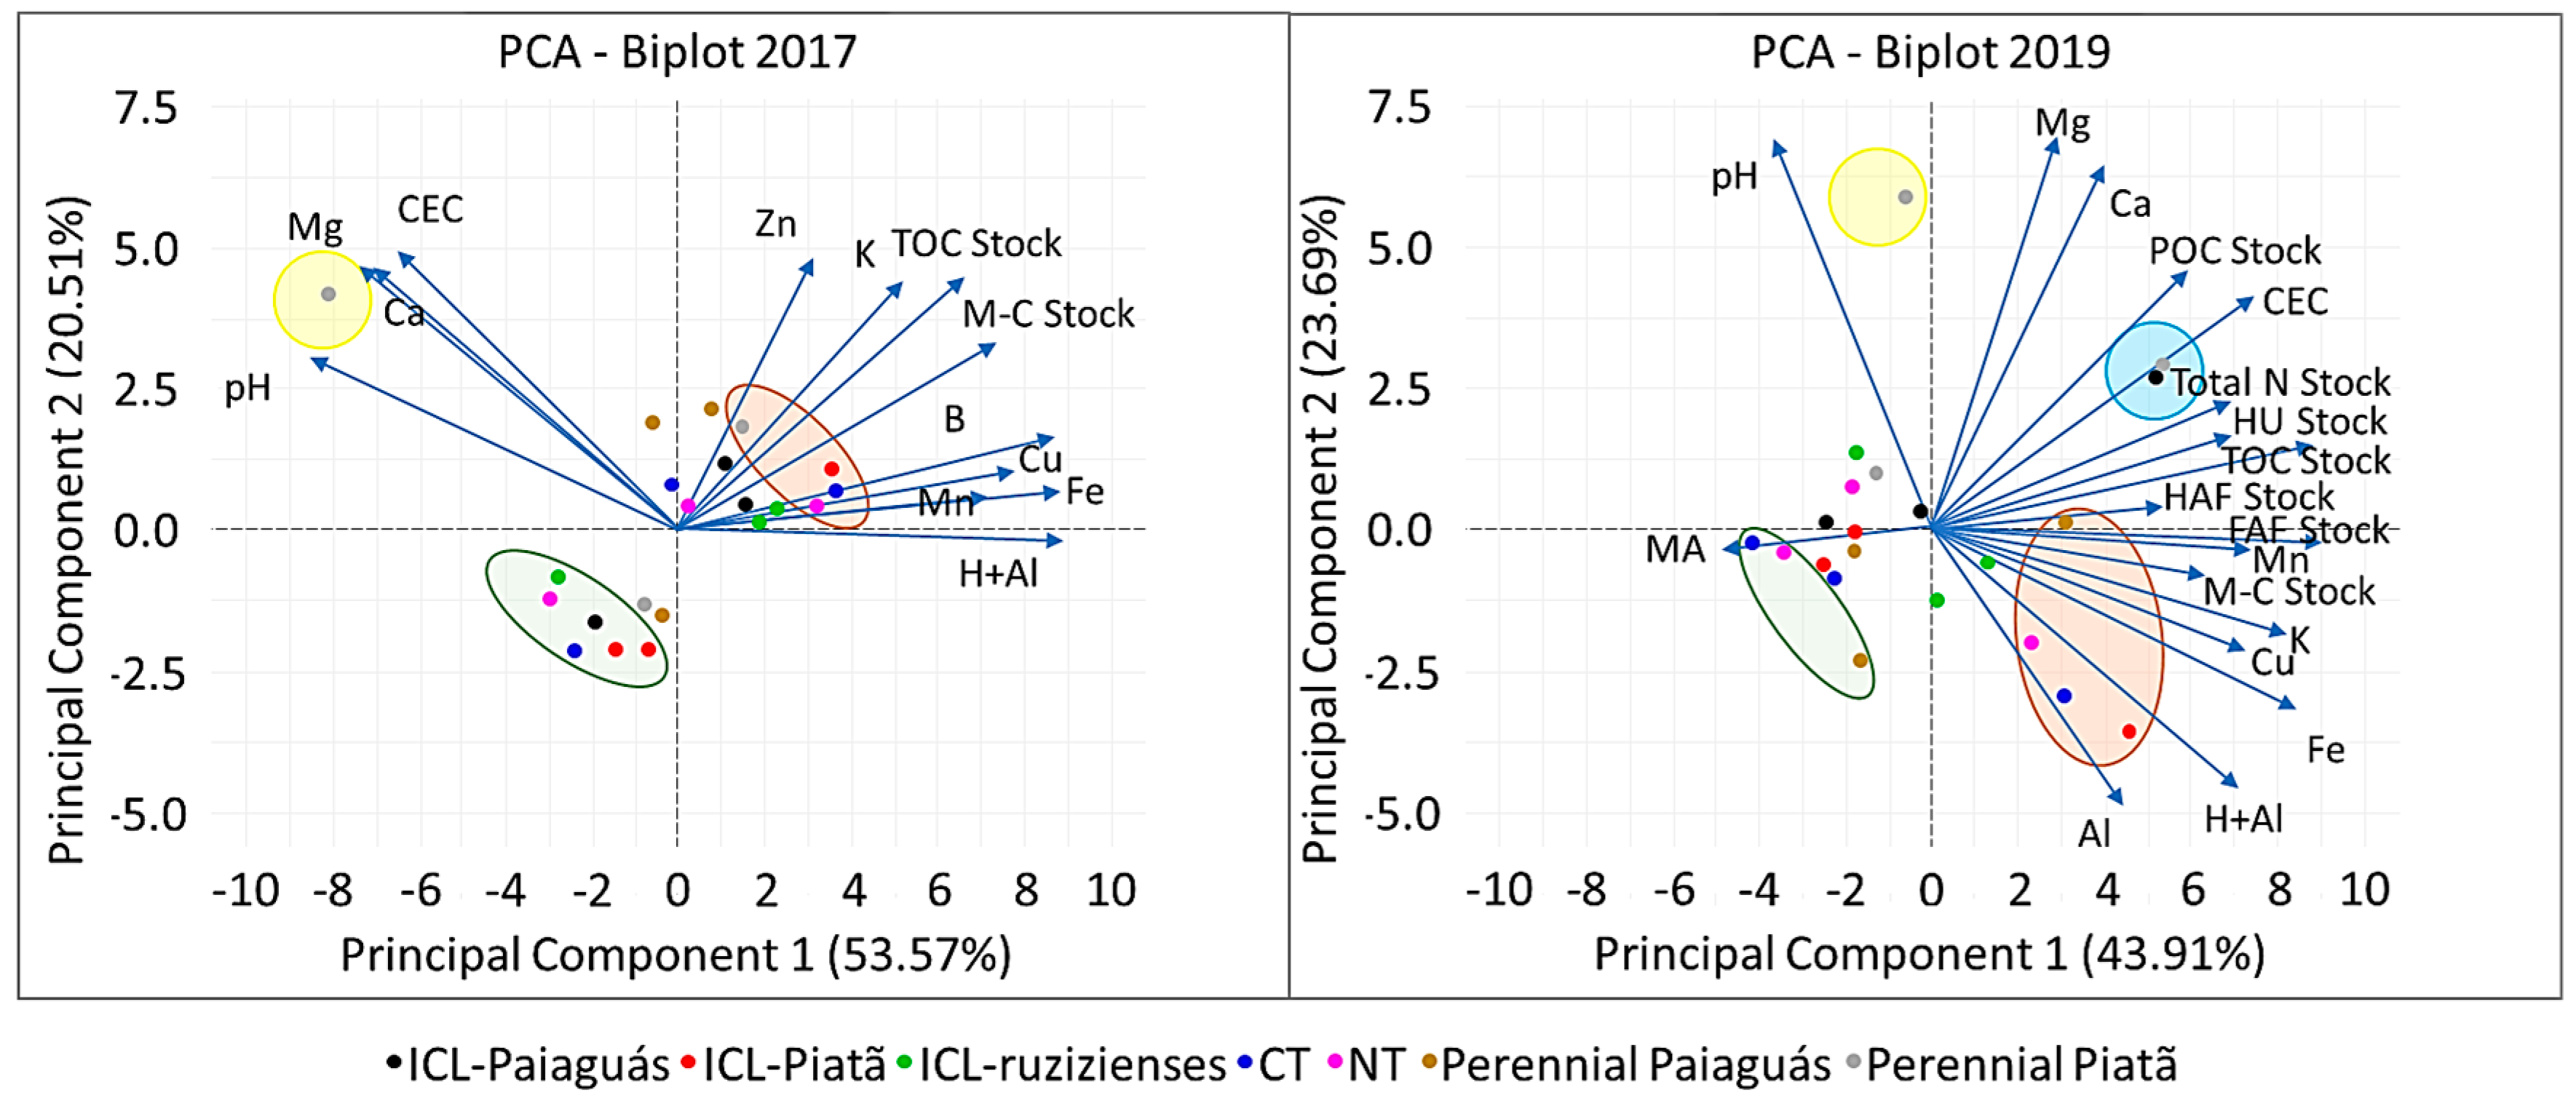
3.3. Relationships and Correlations between Management Types and Physical and Chemical Soil Properties

The PCA of the soil chemical and physical properties in 2017 extracted two components that together explained 74.08% of the total variance of the data. The first principal component (PC1) represented 53.57% of the total variance, and the second (PC2) represented 20.51% (Table 3 and Figure 2). Likewise, the PCA of the soil chemical and physical properties in 2019 extracted two components that together explained 67.60% of the total data variance. The first component (PC1) represented 43.91% of the total variance, and the second (PC2) represented 23.69% (Table 3 and Figure 2).
The variables that were most strongly correlated with PC1 in 2019 were FAF stock (0.90), TOC stock (0.88), Fe (0.85), K (0.82), CEC (0.75), Cu (0.73), Mn (0.73), HU stock (0.70), H+Al (0.70), total N stock (0.69), M-C stock (0.64), POC stock (0.59), and HAF stock (0.53) (Table 3). In 2017, PC1 was negatively correlated with pH and positively correlated with C stocks and micronutrient contents. The group formed by ICL-Piatã, Perennial Piatã, CT, and NT (red group at right in Biplot 2017, PC1, Figure 2) shared similarities in TOC and M-C stocks and K, Fe, Cu, B, Mn, Zn, and H+Al contents, which were positively and strongly correlated with each other and negatively correlated with pH (at left in Biplot 2017, PC1, Figure 2).
Perennial Piatã is represented by the point in the upper left quadrant of Biplot 2017 (negative coordinate of PC1 and positive coordinate of PC2) and had high loadings of pH, Mg, Ca, and CEC, which were strongly positively correlated with each other (Figure 2). The group located in the lower left quadrant of Biplot 2017 (negative coordinates of PC1 and PC2) was formed by ICL-Paiaguás, ICL-Piatã, ICL-Ruziziensis, NT, and CT and shared low values of TOC and M-C stocks, and K, Fe, Cu, B, Zn, and H + Al.
In Biplot 2019, the group formed by ICL-Piatã, Perennial Paiaguás, CT, and NT was located in the lower right quadrant (positive coordinate of PC1) and shared high loadings of K, Fe, Cu, Al, and H+Al and low values of pH (Figure 2). The group formed by ICL-Paiaguás and Perennial Piatã was located in the upper right quadrant (positive coordinate of PC1) and shared high loadings of total N, HU, HAF, TOC, and M-C stocks. The group formed by CT, NT, and Perennial Paiaguás in the lower left quadrant (negative coordinate of PC1) shared low values of TOC, FAF, POC, HAF, and HU stocks, and CEC, Mn, Fe, and Cu. PC1 was strongly correlated with the FAF stock, which was the factor with the greatest variation in the interpretation of the component (Figure 2).

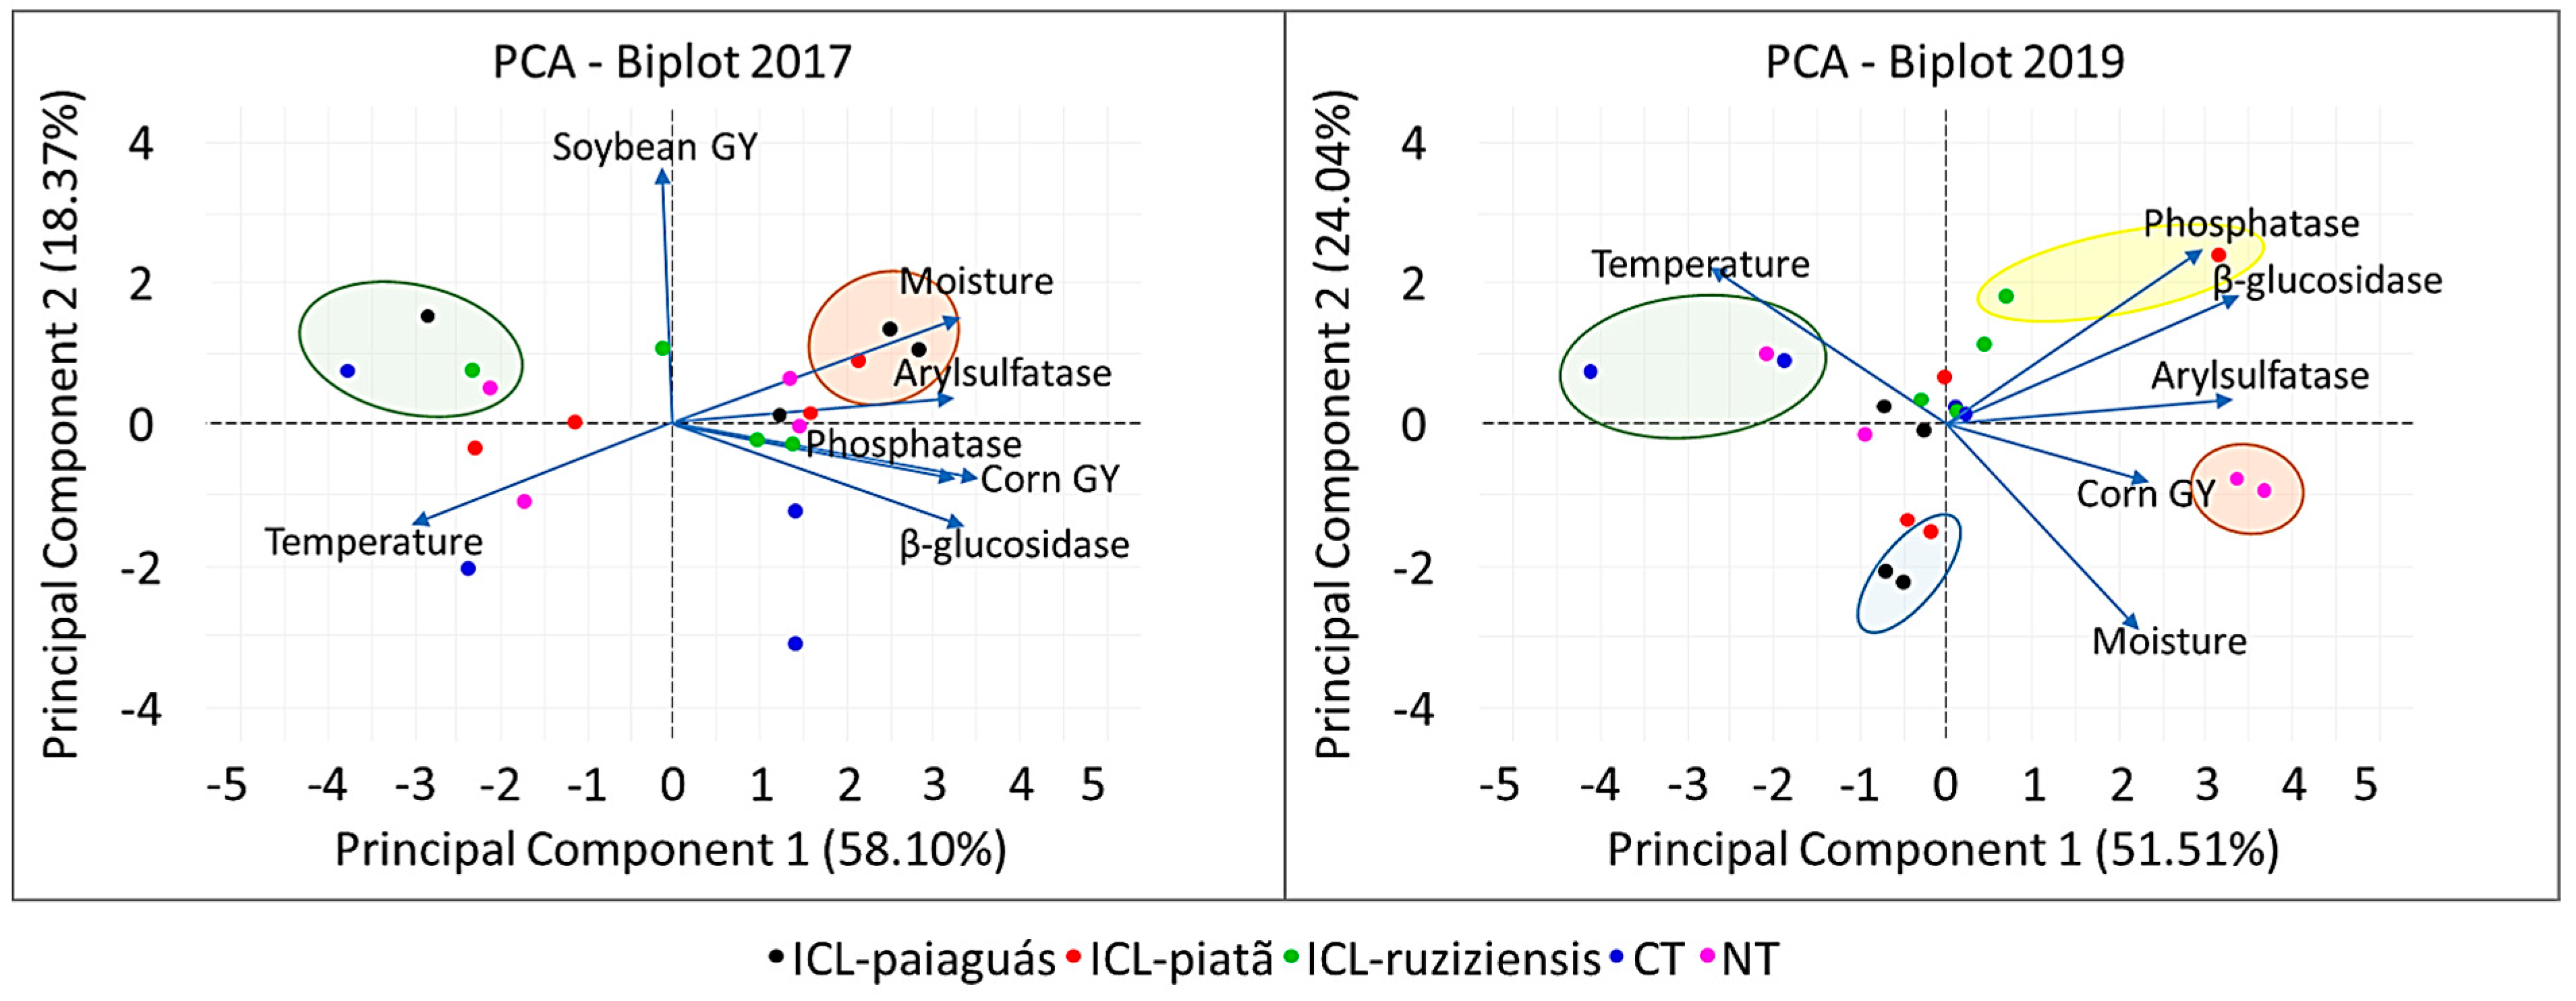
3.4. Correlations between Management, Grain Yield, and Soil Temperature, Moisture, and Enzymatic Activity

The first two components extracted from the PCA of grain yield and soil moisture, temperature, and biochemical attributes in 2017 explained 76.48% of the total data variance. The first component (PC1) represented 58.10% of the total variance, and the second (PC2) represented 18.37% (Table 4 and Figure 3). The interpretation was restricted to PC1. The parameters that were most strongly correlated with PC1 were GY (0.88), soil moisture (0.83), phosphatase activity (0.82), arylsulfatase activity (0.81), and β-glucosidase activity (0.84). The first four parameters were grouped to the right of the biplot on the positive coordinate of PC1, as they were strongly positively correlated with each other and inversely correlated with temperature (Figure 3). These correlations were associated with ICLSs, more precisely, ICL-Paiaguás.
The PCA for 2019 extracted two components that together explained 75.55% of the total data variance. The first component (PC1) represented 51.51% of the total variance, and the second (PC2) represented 24.04% (Table 4 and Figure 3). The parameters that were most strongly correlated with PC1 were β-glycosidase activity (0.85), arylsulfatase activity (0.82), phosphatase activity (0.75), and soil temperature (−0.68). NT, which is the group located in the lower right quadrant of Biplot 2019, had high loadings of corn GY and soil moisture, which were strongly positively correlated with each other. The group in the upper left quadrant of the plot (negative coordinate of PC1) had high loadings of soil temperature and low values of arylsulfatase activity (Figure 3) and comprised NT and CT.
The PC2 of Biplot 2019 was most strongly correlated with phosphatase activity (0.61), soil temperature (0.55), and soil moisture (−0.72) (Figure 3). The group formed by ICL-Ruziziensis and ICL-Piatã in the upper right quadrant of the plot (positive coordinate of PC2) shared high loadings of β-glucosidase activity, and the group formed by ICL-Piatã and ICL-Paiaguás in the lower left quadrant of the plot (negative coordinate of PC2) had low values of phosphatase activity.

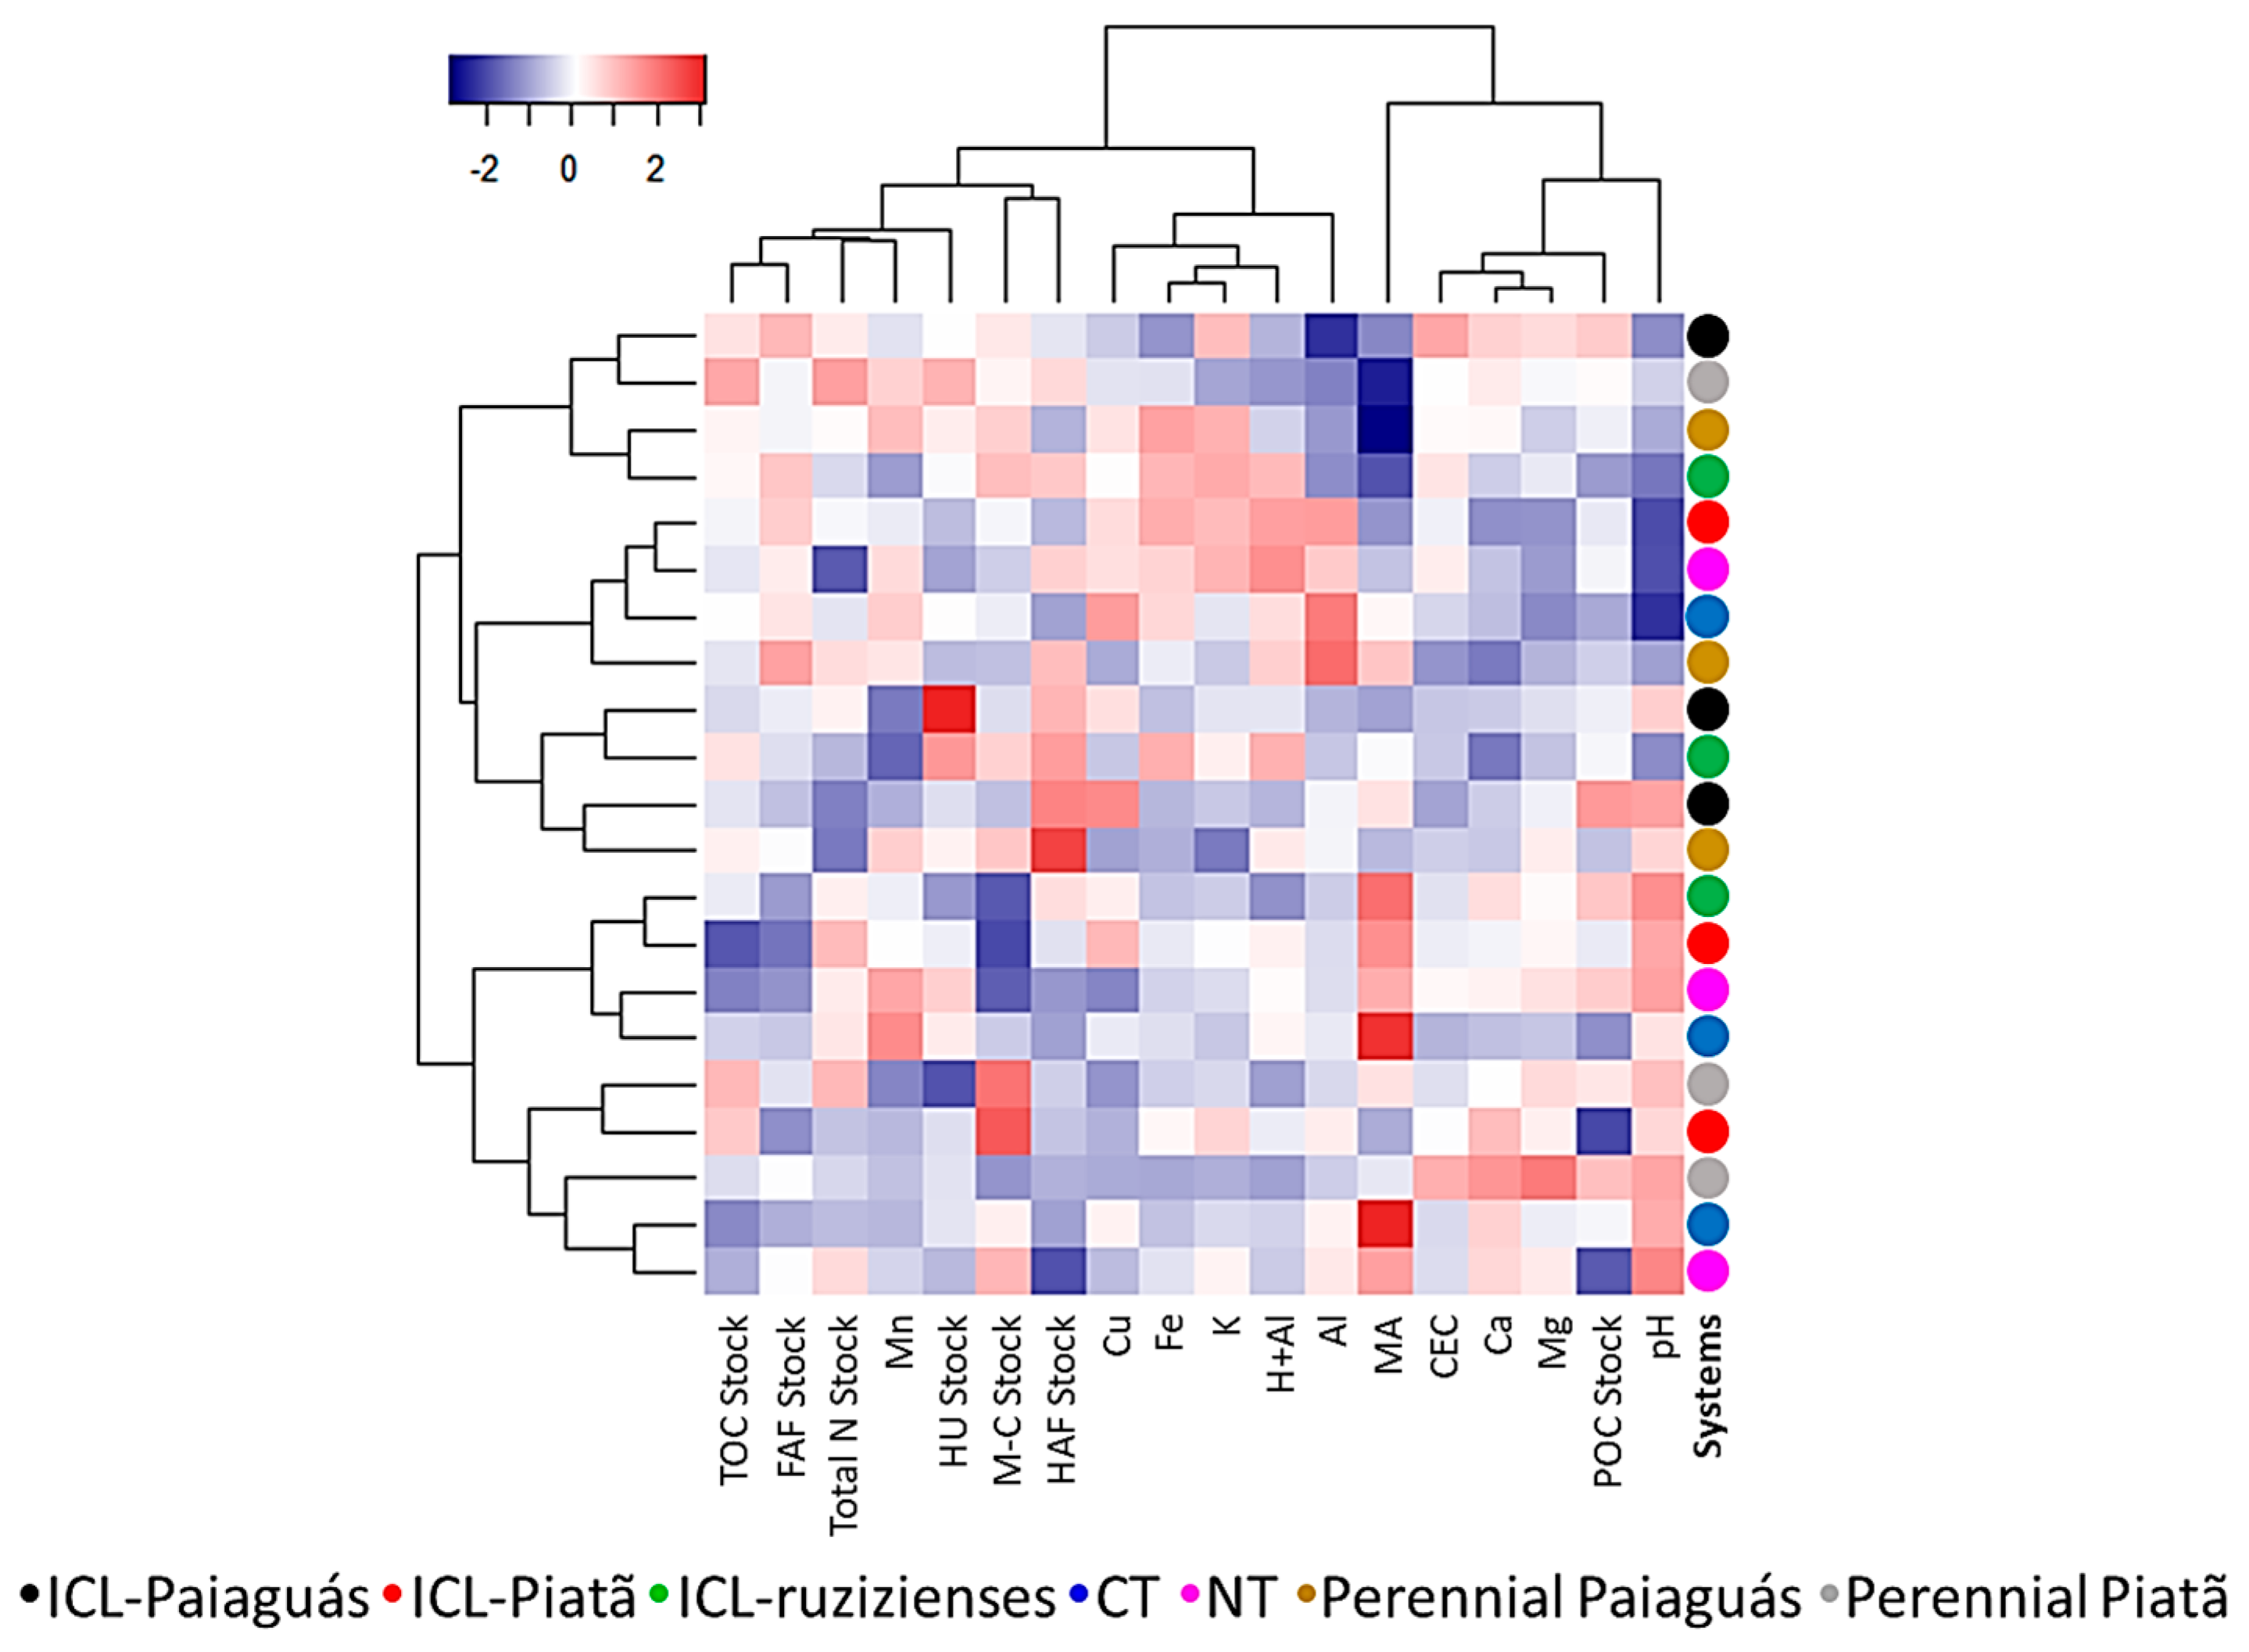
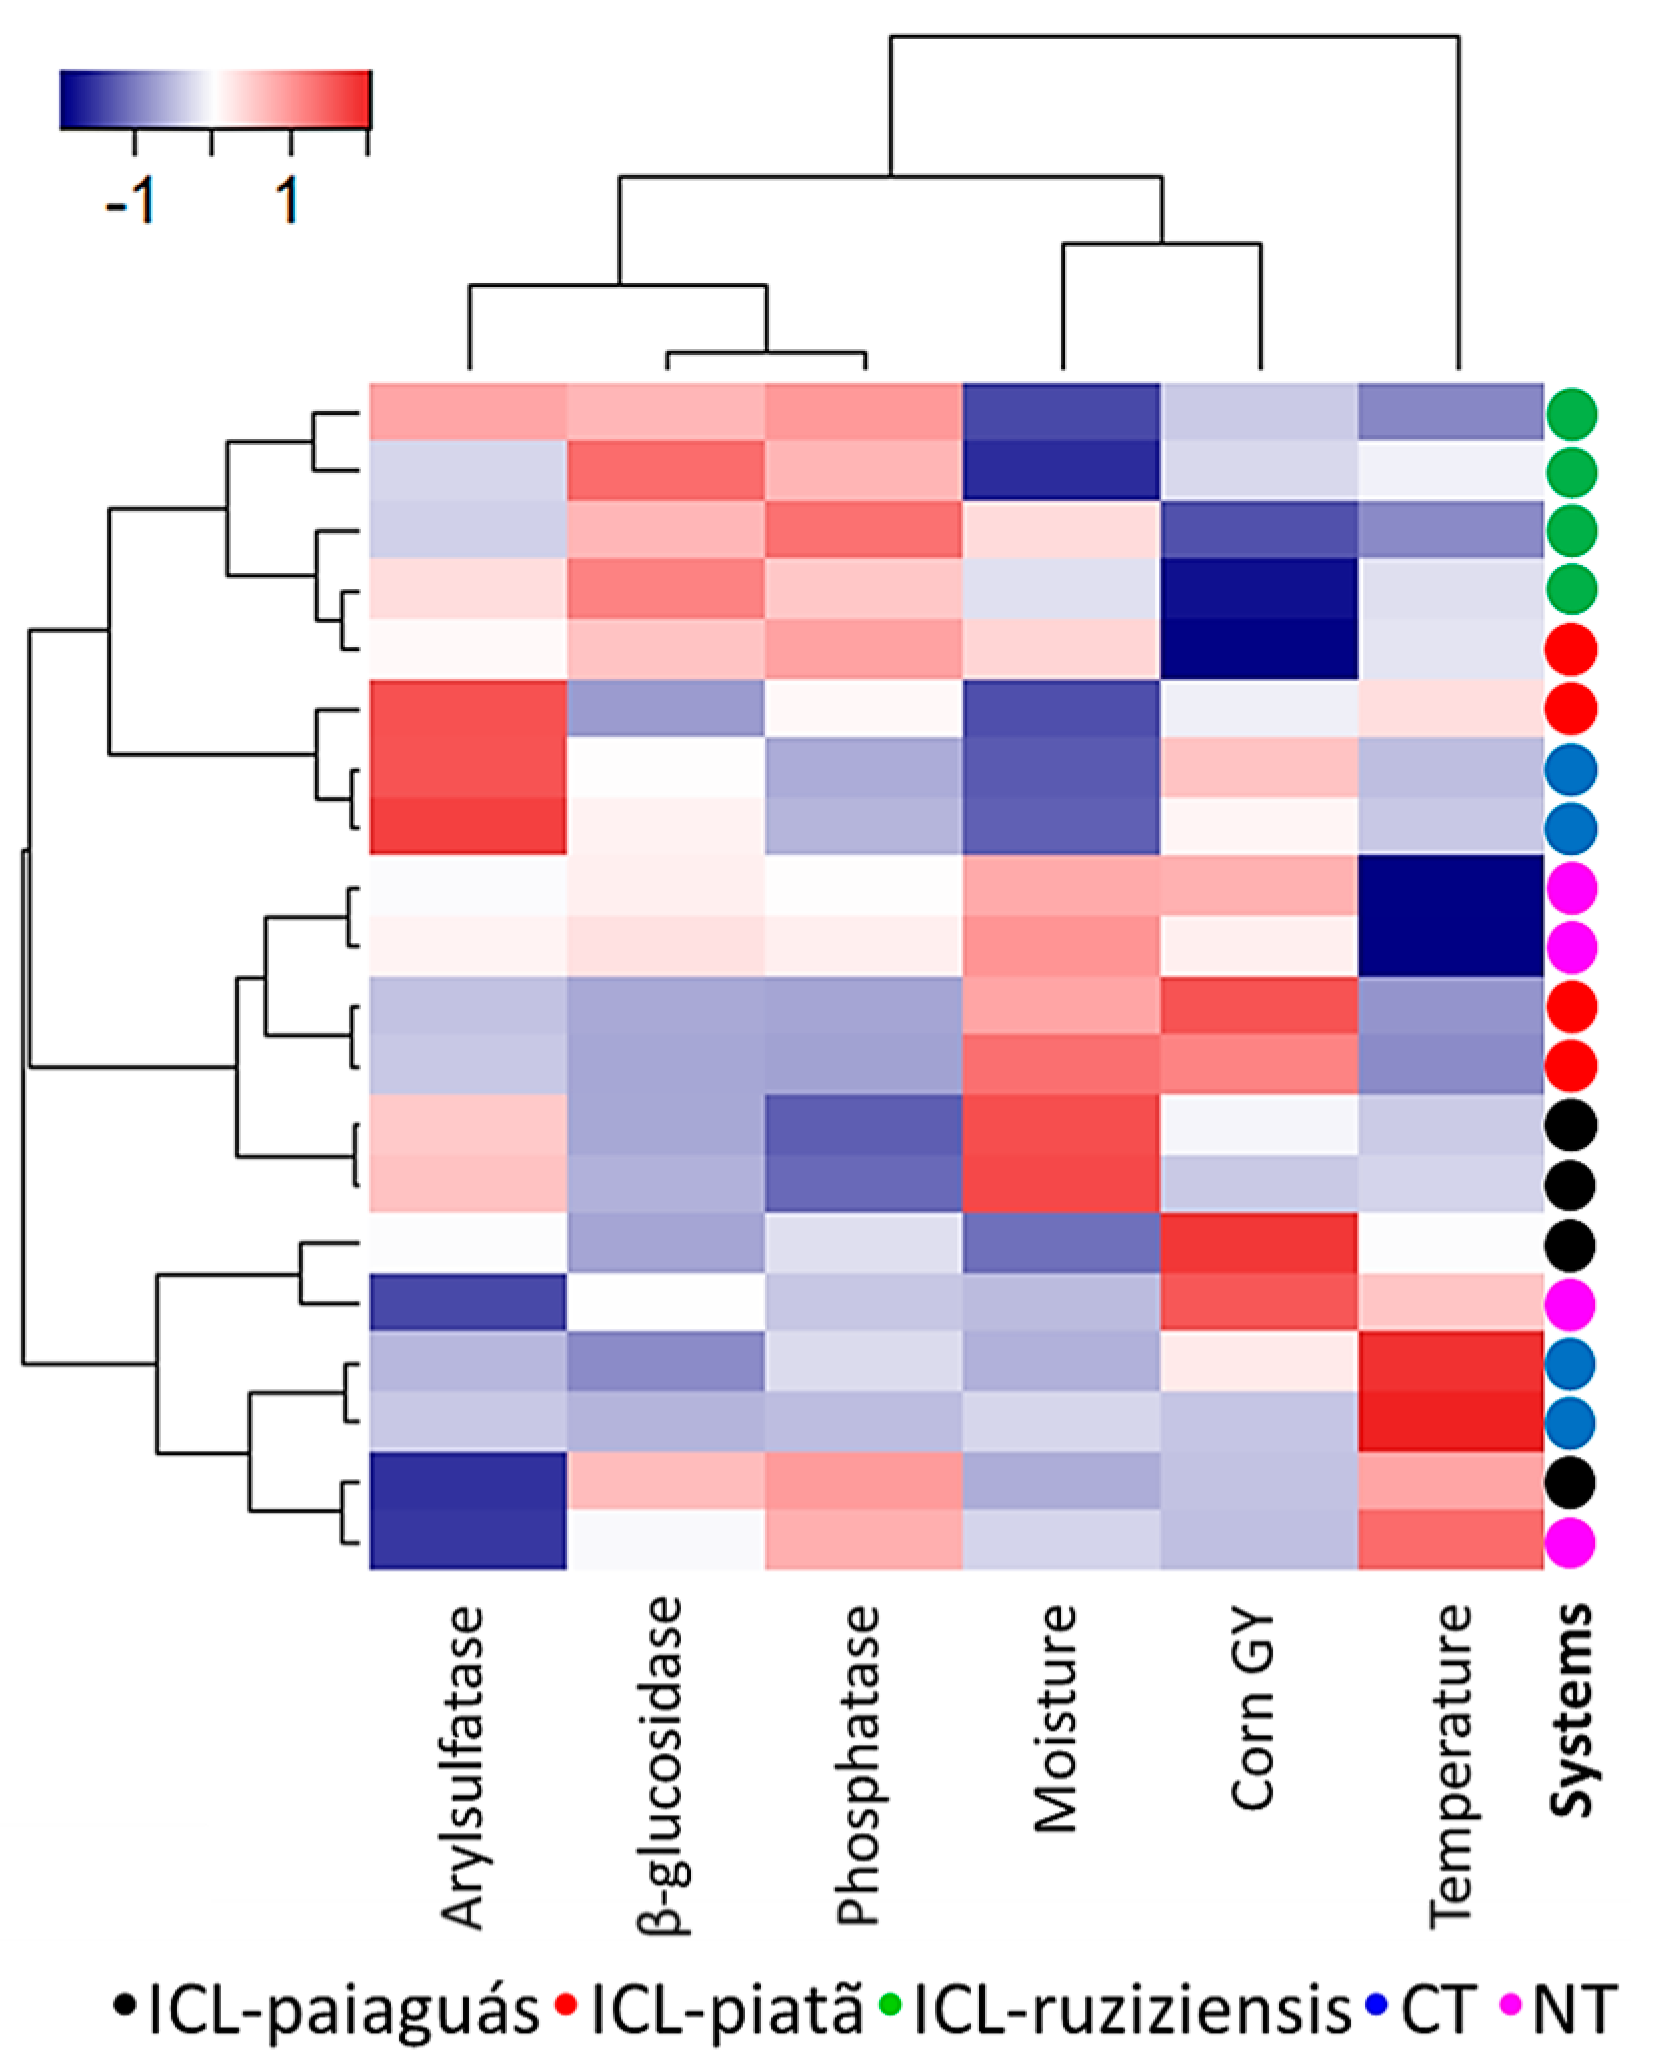
3.5. Similarities and Dissimilarities in Parameters According to Land-Use Type

To obtain an overview of the groups of treatments with common characteristics, data for 2019 were used to generate a heatmap via multivariate analysis of hierarchical clustering. The Euclidean distance method was used to measure the distances between groups, and redder colors indicated higher parameter values (Figure 4). The heatmap confirmed the patterns observed in both components of the 2019 Biplot (Figure 2), which revealed three groups.
In the group formed by ICL-Paiaguás, Perennial Piatã, Perennial Paiaguás, and ICL-ruziziensis (identified by the dendrogram in the upper left region), ICL-Paiaguás and Perennial Piatã shared the same attributes previously described for PC1 in Biplot 2019 (low loadings of TOC and N stock and high loadings of MA). The second group, which comprised CT, NT, and Perennial Paiaguás (identified by the dendrogram in the central left region), and the third group, which comprised ICL-Piatã, Perennial Paiaguás, CT, and NT (identified by the dendrogram in the lower left region), shared the same characteristics previously described for the PC2 of Biplot 2019 (Figure 2).
The dendrogram in the upper part of the heatmap revealed a group with lower macroporosity formed by the continuous grazing systems (Perennial Paiaguás and Perennial Piatã); however, the microporosity was higher in CT and NT (Figure 4). This pattern was expected, but is not a significant limitation for plant growth as the ratios of macroporosity to total porosity (0.56 m3 m−3) and soil density (1.60 Mg m−3) were adequate for the development of plant roots in sandy soils (upper limit value suitable for sandy soils is approximately 1.70 Mg m−3) [53,54]. These results corroborate the findings from the PCA Biplot 2019 (Figure 2).
The data on soil enzymatic activity, moisture and temperature, and GY (Table 4 and Figure 3) for 2019 were used to perform hierarchical cluster analysis and generate a heatmap (Figure 5). This multivariate analysis confirmed the clusters identified in the PCA Biplot 2019 (Figure 3).
The dendrogram to the left of the heatmap identified a cluster in which ICL-Ruziziensis had the highest values of β-glucosidase activity (Figure 5). In the central region of the map, ICL-Piatã and ICL-Paiaguás formed a group with low phosphatase activity, while NT and ICL-Piatã formed a group with the highest corn GY and soil moisture levels. In the lower part of the map, the group formed predominantly by NT and CT had the highest temperatures and lowest arylsulfatase activity. Notably, GY was highly dependent on soil moisture, as evidenced by the clustering in the dendrogram above the heat map and color shades in the heatmap. These patterns confirm those observed in the PC1 of Biplot 2019 (Figure 3).

4. Discussion

4.1. Relationships between Management and Soil Physical and Chemical Properties

The large input of plant residues into the soil in conservation systems such as ICLSs increases C stocks [11,12,15]. Similar short-term dynamics were observed in the present study, as evidenced by the high correlations of TOC and FAF stocks with PC1 in 2019, which were shared by ICL-Paiaguás and Perennial Piatã (Table 3, Figure 2). FAF stocks had the strongest correlation with PC1 and thus indicated the effects of the cropping systems on SOM quality.
According to Caetano et al. [16], FAF is more sensitive to soil disturbance than TOC, which explains the low FAF stocks in the topsoil in CT and NT. Fulvic acids are the most reactive and least stable of the SOM fractions. High FAF stocks can facilitate cation leaching and the illuviation of humified clays in the form of organic complexes [55].
The group formed by samples from ICL-Piatã, Perennial Paiaguás, CT, and NT shared high soil H + Al, Al, Cu, and Fe contents and a low soil pH (Table 3, Figure 2 and Figure 4). The input of plant residues into the soil can increase the formation of soluble complexes with SOM and its decomposition products, increasing the availability of micronutrients [56,57]. This process can occur when water-soluble compounds leach from decomposing plant residues, such as low-molecular-weight organic acids [58], which can complex cationic micronutrients in the soil [59]. Thus, plant residue decomposition promotes ionic balance in the soil solution by acidifying it and increasing the availability of metallic micronutrients [60].
PC2 was strongly correlated with pH, and the available Fe and Cu contents in the soil solution increased with the increasing acidity (negative coordinate of PC2) (Table 3, Figure 2 and Figure 4). Soil acidification generates soluble forms of these micronutrients through stoichiometric reactions [61]. Perennial Piatã exhibited high loadings of pH, Ca, and Mg in PC2 (upper left quadrant of the biplot, on the positive coordinate) (Table 3, Figure 2). The high correlation of Mg with PC2 may be the result of reduced Mg binding with an increasing soil charge (lyotropic series). As the soil pH increases, the affinity of the soil for Ca is greater than that for Mg. Ca was also strongly correlated with PC2, although this correlation was weaker than that between Mg and PC2. According to Lopes and Guilherme [62], soil acidity is directly proportional to the exchangeable Al content and inversely proportional to the Ca, Mg, and K contents (Figure 4). During the mineralization and formation of humic substances, H+ and NO3- ions are released [63]. The latter are neutralized by solution cations (such as Ca and Mg), thereby reducing BS, keeping H+ in solution, and decreasing pH.
In PC2, samples from ICL-Paiaguás and Perennial Piatã shared high loadings of total N, HU, TOC, and C-M stocks (Table 3, Figure 2 and Figure 4). A positive correlation between soil SOM and N contents was also reported by Islabão et al. [64]. This correlation is reasonable because plant residues incorporated into the soil are sources of carbon and energy for microorganisms, and N found in residues is transformed into inorganic forms that are available to plants [65].

4.2. Relationships among Management, Grain Yield, and Soil Temperature, Moisture, and Enzymatic Activity

In Biplot 2017, the group to the left of the plot (negative coordinate of PC1) was more strongly associated with CT and included low values of corn GY and phosphatase, arylsulfatase, and β-glycosidase activities (Figure 3). These results are due to lower plant dry matter inputs and fast C oxidation in CT due to soil disturbance [66]. Plant residues sustain the microbiota, which is mainly responsible for enzyme production [67,68,69].
The higher soil temperature and lower soil moisture in CT and NT indicate limited water storage due to the absence of vegetation cover or the sandy texture of the soil (Figure 3). Proper management can improve sandy soils; in particular, soil cover can mitigate temperature and water losses to the atmosphere. Agroecosystems such as ICLSs provide major benefits, as the contributions from plant straw and crop diversity stimulate and increase microbial diversity and activity in the topsoil [7,70]. These features improve soil resilience against weather conditions or management practices [10,71,72].
The results for 2019 highlighted that the soil water regime strongly influenced enzymatic activity (Figure 3 and Figure 5). Enzyme production by plant roots [73,74] and soil microorganisms is regulated by substrate requirements and availability, which are determined by factors such as soil temperature and moisture, among others [75,76,77]. As observed in the CT samples (Figure 5), enzyme activity can be an efficient bioindicator of soil changes, particularly SOM formation and degradation processes or nutrient mineralization [7,44,74,77]. This finding is consistent with previous studies in the Brazilian Cerrado that have shown that enzyme activity is sensitive to land use and management practices [44,72,78,79,80].
Soil temperature and moisture are interdependent parameters and usually change simultaneously [81]. CT and NT exhibited similar soil water and thermal regimes (Figure 3 and Figure 5) because these factors depend on the amount and distribution of straw. When properly managed, the thermal insulation provided by straw can significantly reduce the topsoil temperature and decrease evaporation rates to maintain soil moisture [32,82,83]. In contrast to the ICLSs, straw cover was absent in CT and inefficient in NT, which did not include appropriate grass species for dry matter production and straw formation [84].
Soybean GY was negatively correlated with soil temperature and positively correlated with soil moisture in 2017, but not in 2019. However, corn GY in 2019 was similar in the NT samples (Figure 3, Biplot 2019), pointing to the importance of soil cover. These results indicate that the absence of Urochloa is the best condition for corn GY under water deficits such as the one that occurred in 2019 (Figure 1). Studies are needed on strategies for avoiding water deficits in tropical sandy environments, such as agricultural zoning, which aims to minimize risks related to adverse climatic phenomena and allows each region to identify the best sowing times for specific soil types and crop cultivar cycles [85].
According to PC2 for 2019 (Table 4, Figure 3), ICL-Piatã and ICL-Paiaguás shared low values of phosphatase activity (lower part of the plot, on the negative coordinate), indicating that phosphatase activity is influenced by both the water regime and soil management system [69,86,87]. These results contrast with those of Barbiere et al. [88], who observed increased phosphatase activity in areas with greater plant diversity in the second harvest in southern Brazil. Other studies have also indicated that, compared with monocropping, increased plant diversity promotes soil enzymatic activity to varying extents depending on the enzyme type [89,90]. Other parameters that were not addressed in this study may also explain the lower phosphatase activity in ICL-Piatã and ICL-Paiaguás (Figure 5). Future studies should consider other variables to further elucidate the biochemical phenomena in ICLSs in sandy soils. For example, the soil in the experimental area had a mean P content of 49 mg dm−3 in 2019 (SD: ±13), which is classified as high by van Raij et al. [38]. Greater P availability in the soil may restrict the expression of P-mineralizing enzymes.

5. Conclusions

The findings of this study support our hypothesis: the ICLSs increased labile fractions of organic matter in sandy soil, particularly FAF stocks, and improved soil chemical properties and arylsulfatase and β-glucosidase activities. Soil temperature and moisture were directly influenced by soil cover, and this influence was reflected in the yields of soybean as the main crop and corn in the off-season. These effects were particularly evident under no-tillage management in sandy soil, where there was competition between corn and forage under water deficit conditions. Under ICLS management, the positive effects of straw cover on soil chemical and biochemical properties and grain yield were evident in the short term, although not all processes that ensure greater soil resilience were clearly evident in some systems. In addition to confirming that conservation systems favor the development of ecosystem services in the soil, this study shows that ICLSs can enable sustainable food production in tropical sandy soils, which are often overlooked in intensive agriculture.

Supplementary Materials

The following supporting information can be downloaded at: https://www.mdpi.com/article/10.3390/su151813829/s1, Figure S1. Historical climate data (1992–2022) of the experimental site. Caiuá, SP, Brazil; Figure S2. Dry matter of the aerial part of Urochloa ruziziensis (ICL-Ruziziensis), U. brizantha cv. Piatã (ICL-Piatã) and U. brizantha cv. Paiaguás (ICL-Paiaguás). Different letters denote significant differences between treatments (Tukey, p ≤ 0.05); Table S1. Photoperiod at Caiuá, SP, Brazil; Table S2. Information on the cultivar, sowing date, spacing between rows, sowing density, fertilization, top dressing date, and date of harvest (corn and soybean) or management for the palisade grass used in the cropping systems from 2016/17, 2017/18, and 2018/19.

Author Contributions

Conceptualization, M.A., G.C.L., G.P.M. and D.d.A.S.; methodology, M.A., G.C.L., D.d.A.S. and G.P.M.; experiment conduction, D.d.A.S., G.C.L., B.M.S.S., G.P.M., C.d.S.B.B., C.A., A.H.N., L.A.F. and I.M.D.d.S.; laboratory analyses, D.d.A.S., V.C.M., I.d.C.M. and B.M.S.S.; statistical analysis, D.d.A.S., F.S.G. and J.H.S.d.L.; interpretation of results, D.d.A.S. and M.A.; writing—original draft preparation, D.d.A.S.; review and editing, M.A., G.C.L., I.d.C.M., F.S.G. and P.S.P.; supervision, M.A., G.C.L., C.d.S.B.B., G.P.M. and C.A. All authors have read and agreed to the published version of the manuscript.

Funding

This research was funded by Fundação de Amparo à Pesquisa do Estado de São Paulo—FAPESP (Process Nº 2018/07625-0), which granted a doctoral scholarship to the first author.

Data Availability Statement

Not applicable.

Acknowledgments

The authors would like to thank the FACHOLI group for fieldwork support, and Dawn Schmidt who provided editorial support. The authors also thank CAPES (AUXPE nº 2671/2022) for the financial support for the publication of this manuscript.

Conflicts of Interest

The authors declare no conflict of interest.

References

  1. Wachiye, S.; Merbold, L.; Vesala, T.; Rinne, J.; Räsänen, M.; Leitner, S.; Pellikka, P. Soil Greenhouse Gas Emissions under Different Land-Use Types in Savanna Ecosystems of Kenya. Biogeosciences 2020, 17, 2149–2167. [Google Scholar] [CrossRef]
  2. Intergovernmental Panel on Climate Change Climate Change (IPCC) 2022: Mitigation of Climate Change. Working Group III Contribution to the IPCC Sixth Assessment Report (AR6). Available online: https://report.ipcc.ch/ar6wg3/pdf/IPCC_AR6_WGIII_FinalDraft_FullReport.pdf (accessed on 11 August 2023).
  3. Chaudhary, A.; Gustafson, D.; Mathys, A. Multi-Indicator Sustainability Assessment of Global Food Systems. Nat. Commun. 2018, 9, 848. [Google Scholar] [CrossRef]
  4. Dos Santos, F.C.; de Albuquerque Filho, M.R.; Vilela, L.; Ferreira, G.B.; Santana Carvalho, M.d.C.; Viana, J.H.M. Decomposição e Liberação de Macronutrientes Da Palhada de Milho e Braquiária, Sob Integração Lavoura-Pecuária No Cerrado Baiano. Rev. Bras. Cienc. Solo 2014, 38, 1855–1861. [Google Scholar] [CrossRef]
  5. Assmann, J.M.; Martins, A.P.; Anghinoni, I.; de Oliveira Denardin, L.G.; de Holanda Nichel, G.; de Andrade Costa, S.E.V.G.; Pereira e Silva, R.A.; Balerini, F.; de Faccio Carvalho, P.C.; Franzluebbers, A.J. Phosphorus and Potassium Cycling in a Long-Term No-till Integrated Soybean-Beef Cattle Production System under Different Grazing Intensities Insubtropics. Nutr. Cycl. Agroecosyst. 2017, 108, 21–33. [Google Scholar] [CrossRef]
  6. Damian, J.M.; Firmano, R.F.; Cherubin, M.R.; Pavinato, P.S.; de Marches Soares, T.; Paustian, K.; Cerri, C.E.P. Changes in Soil Phosphorus Pool Induced by Pastureland Intensification and Diversification in Brazil. Sci. Total Environ. 2020, 703, 135463. [Google Scholar] [CrossRef]
  7. Damian, J.M.; Matos, E.; Pedreira, B.C.; de Carcio Carvalho, P.C.; Souza, A.J.; Andreote, F.D.; Premazzi, L.M.; Cerri, C.E.P. Pastureland Intensification and Diversification in Brazil Mediate Soil Bacterial Community Structure Changes and Soil C Accumulation. Appl. Soil Ecol. 2021, 160, 103858. [Google Scholar] [CrossRef]
  8. Franzluebbers, A.J. Fostering the Future with Forage: The Case for Pasture Crop Rotations. Better Crops with Plant Food 2017. Available online: http://www.ipni.net/publication/bettercrops.nsf/issue/BC-2017-4 (accessed on 4 September 2023).
  9. Assmann, J.M.; Anghinoni, I.; Martins, A.P.; de Andrade Costa, S.E.V.G.; Cecagno, D.; Carlos, F.S.; de Faccio Carvalho, P.C. Soil Carbon and Nitrogen Stocks and Fractions in a Long-Term Integrated Crop–Livestock System under No-Tillage in Southern Brazil. Agric. Ecosyst. Environ. 2014, 190, 52–59. [Google Scholar] [CrossRef]
  10. Donagemma, G.K.; Luiz de Freitas, P.; Balieiro, F.C.; Fontana, A.; Spera, S.T.; Lumbreras, J.F.; Viana, J.H.M.; de Araújo Filho, J.C.; dos Santos, F.C.; de Albuquerque, M.R.; et al. Characterization, Agricultural Potential, and Perspectives for the Management of Light Soils in Brazil. Pesqui. Agropecu. Bras. 2016, 51, 1003–1020. [Google Scholar] [CrossRef]
  11. Salton, J.C.; Mercante, F.M.; Tomazi, M.; Zanatta, J.A.; Concenço, G.; Silva, W.M.; Retore, M. Integrated Crop-Livestock System in Tropical Brazil: Toward a Sustainable Production System. Agric. Ecosyst. Environ. 2014, 190, 70–79. [Google Scholar] [CrossRef]
  12. Sulc, R.M.; Franzluebbers, A.J. Exploring Integrated Crop–Livestock Systems in Different Ecoregions of the United States. Eur. J. Agron. 2014, 57, 21–30. [Google Scholar] [CrossRef]
  13. Kragt, M.E.; Pannell, D.J.; Robertson, M.J.; Thamo, T. Assessing Costs of Soil Carbon Sequestration by Crop-Livestock Farmers in Western Australia. Agric. Syst. 2012, 112, 27–37. [Google Scholar] [CrossRef]
  14. Tavanti, R.F.R.; Montanari, R.; Panosso, A.R.; La Scala, N.; Chiquitelli Neto, M.; da Silva Freddi, O.; Paz González, A.; de Carvalho, M.A.C.; Soares, M.B.; Tavanti, T.R.; et al. What Is the Impact of Pasture Reform on Organic Carbon Compartments and CO2 Emissions in the Brazilian Cerrado? Catena Amst. 2020, 194, 104702. [Google Scholar] [CrossRef]
  15. Colazo, J.C.; Herrero, J.D.; Sager, R.; Guzmán, M.L.; Zaman, M. Contribution of Integrated Crop Livestock Systems to Climate Smart Agriculture in Argentina. Land 2022, 11, 2060. [Google Scholar] [CrossRef]
  16. Caetano, J.O.; de Melo Benites, V.; Silva, G.P.; da Silva, I.R.; de Assis, R.L.; Cargnelutti Filho, A. Dinâmica Da Matéria Orgânica de Um Neossolo Quartzarênico de Cerrado Convertido Para Cultivo Em Sucessão de Soja e Milheto. Rev. Bras. Cienc. Solo 2013, 37, 1245–1255. [Google Scholar] [CrossRef]
  17. Dos Santos, D.C.; de Lima, C.L.R.; Kunde, R.J.; dos Santos Carvalho, J.; Abeijon, L.M.; Pillon, C.N. Agregação e Proteção Física Da Matéria Orgânica Em Planossolo Háplico Sob Diferentes Sistemas de Manejo. Biosci. J. 2012, 28, 54–63. [Google Scholar]
  18. Guardiola, M.D.E.; Vale Júnior, J.F.; da Silva, E.E.; Rossi, C.Q.; Pereira, M.G. Chemical and Physical Fractions of Soil Organic Matter under Various Management Regimes in Roraima, Brazil. Semin. Cienc. Agrar. 2017, 38, 2419. [Google Scholar] [CrossRef]
  19. Locatelli, J.L.; Santos, R.S.; Cherubin, M.R.; Cerri, C.E.P. Changes in Soil Organic Matter Fractions Induced by Cropland and Pasture Expansion in Brazil’s New Agricultural Frontier. Geoderma Reg. 2022, 28, e00474. [Google Scholar] [CrossRef]
  20. Loss, A.; Pereira, M.G.; Perin, A.; Beutler, S.J.; Anjos, L.H.C. Oxidizable Carbon and Humic Substances in Rotation Systems with Brachiaria/Livestock and Pearl Millet/No Livestock in the Brazilian Cerrado. Span. J. Agric. Res. 2013, 11, 217–231. [Google Scholar] [CrossRef]
  21. Rosset, J.S.; do Carmo Lana, M.; Pereira, M.G.; Schiavo, J.A.; Rampim, L.; Sarto, M.V.M. Frações Químicas e Oxidáveis da Matéria Orgânica Do Solo Sob Diferentes Sistemas de Manejo, Em Latossolo Vermelho. Pesqui. Agropecu. Bras. 2016, 51, 1529–1538. [Google Scholar] [CrossRef]
  22. Steverson, F.J. Humus Chemistry: Genesis, Composition, Reactions, 2nd ed.; John Willey: New York, NY, USA, 1994. [Google Scholar]
  23. Castro, G.S.A.; Crusciol, C.A.C.; Calonego, J.C.; Rosolem, C.A. Management Impacts on Soil Organic Matter of Tropical Soils. Vadose Zone J. 2015, 14, vzj2014.07.0093. [Google Scholar] [CrossRef]
  24. Schmidt, M.W.I.; Torn, M.S.; Abiven, S.; Dittmar, T.; Guggenberger, G.; Janssens, I.A.; Kleber, M.; Kögel-Knabner, I.; Lehmann, J.; Manning, D.A.C.; et al. Persistence of Soil Organic Matter as an Ecosystem Property. Nature 2011, 478, 49–56. [Google Scholar] [CrossRef] [PubMed]
  25. Cardelli, R.; Marchini, F.; Saviozzi, A. Soil Organic Matter Characteristics, Biochemical Activity and Antioxidant Capacity in Mediterranean Land Use Systems. Soil Tillage Res. 2012, 120, 8–14. [Google Scholar] [CrossRef]
  26. Ashagrie, Y.; Zech, W.; Guggenberger, G.; Mamo, T. Soil Aggregation, and Total and Particulate Organic Matter Following Conversion of Native Forests to Continuous Cultivation in Ethiopia. Soil Tillage Res. 2007, 94, 101–108. [Google Scholar] [CrossRef]
  27. Piccolo, A. The Supramolecular Structure of Humic Substances: A Novel Understanding of Humus Chemistry and Implications in Soil Science. In Advances in Agronomy; Academic Press: Cambridge, MA, USA, 2002; Volume 75, pp. 57–134. ISBN 0120007932. [Google Scholar]
  28. Marinari, S.; Liburdi, K.; Corradini, D.; Grego, S. Reversed-Phase High Performance Liquid Chromatographic Profile of Organic Fractions Extracted by Solvents with Different Polarity as a Tool to Evaluate the Hydrophobic Character of Soil under Different Management. Soil Tillage Res. 2010, 109, 36–40. [Google Scholar] [CrossRef]
  29. Costa, S.E.V.G.A.; Souza, E.D.; Anghinoni, I.; Carvalho, P.C.F.; Martins, A.P.; Kunrath, T.R.; Cecagno, D.; Balerini, F. Impact of an Integrated No-till Crop-Livestock System on Phosphorus Distribution, Availability and Stock. Agric. Ecosyst. Environ. 2014, 190, 43–51. [Google Scholar] [CrossRef]
  30. Wendling, B.; Jucksch, I.; Mendonça, E.S.; Alvarenga, R.C. Organic-Matter Pools of Soil under Pines and Annual Cultures. Commun. Soil Sci. Plant Anal. 2010, 41, 1707–1722. [Google Scholar] [CrossRef]
  31. Jamala, G.Y.; Oke, D.O. Humic Substances and Mineral-Associated Soil Organic Carbon as Influenced By Land Use in Southeastern Adamawa State, Nigeria. J. Environ. Sci. 2013, 6, 59–70. [Google Scholar] [CrossRef]
  32. Sone, J.S.; Sanches de Oliveira, P.T.; Zamboni, P.A.P.; Vieira, N.O.M.; Carvalho, G.A.; Macedo, M.C.M.; Romeiro de Araujo, A.; Montagner, D.B.; Sobrinho, T.A. Effects of Long-Term Crop-Livestock-Forestry Systems on Soil Erosion and Water Infiltration in a Brazilian Cerrado Site. Sustainability 2019, 11, 5339. [Google Scholar] [CrossRef]
  33. Santos, H.G.; Jacomine, P.K.T.; dos Anjos, L.H.C. Sistema Brasileiro de Classificação de Solos, 5th ed.; Embrapa Solos: Brasilia, Brazil, 2018; Volume 1. [Google Scholar]
  34. Teixeira, P.C.; Donagemma, G.K.; Fontana, A.; Teixeira, W.G. Manual de Métodos de Análise de Solo, 3rd ed.; Embrapa Solos: Rio de Janeiro, Brazil, 2017; ISBN 9788570357717. [Google Scholar]
  35. Alvares, C.A.; Stape, J.L.; Sentelhas, P.C.; Gonçalves, J.L.M.; Sparovek, G. Köppen’s Climate Classification Map for Brazil. Meteorol. Z. 2013, 22, 711–728. [Google Scholar] [CrossRef]
  36. Instituto Nacional de Meteorologia (INMET). Climatologia e Histórico de Previsão do Tempo Em Caiuá. Available online: https://www.climatempo.com.br/climatologia/2248/caiua-sp (accessed on 11 August 2023).
  37. National Aeronautics and Space Administration (NASA). Giovanni—The Bridge between Data and Science. Available online: https://giovanni.gsfc.nasa.gov/giovanni/ (accessed on 11 August 2023).
  38. Van Raij, B.; Andrade, J.C.; Cantarella, H.; Quaggio, J.A. Análise Química Para Avaliação da Fertilidade de Solos Tropicais; Instituto Agronômico/Fundação IAC: Campinas, Brazil, 2001. [Google Scholar]
  39. Van Raij, B.; Cantarella, H.; Quaggio, J.A.; Furlani, A.M.C. Recomendações de Adubação e Calagem Para o Estado de São Paulo, 1st ed.; IAC: Campinas, Brazil, 1997. [Google Scholar]
  40. Jakelaitis, A.; Silva, A.A.; Ferreira, L.R.; Silva, A.F.; Pereira, J.L.; Viana, R.G. Efeitos de Herbicidas No Consórcio de Milho Com Brachiaria Brizantha. Planta Daninha 2005, 23, 69–78. [Google Scholar] [CrossRef]
  41. Ceccon, G.; Matoso, A.O.; Neto Neto, A.L.; Palombo, L. Uso de Herbicidas No Consórcio de Milho Safrinha Com Brachiaria Ruziziensis. Planta Daninha 2010, 28, 359–364. [Google Scholar] [CrossRef]
  42. Euclides, V.P.B.; Montagner, D.B.; Barbosa, R.A.; do Valle, C.B.; Nantes, N.N. Animal Performance and Sward Characteristics of Two Cultivars of Brachiaria Brizantha (BRS Paiaguás and BRS Piatã). Rev. Bras. Zootec. 2016, 45, 85–92. [Google Scholar] [CrossRef]
  43. Tabatabai, M.A. Soil Enzymes. In Methods of Soil Analysis: Part 2 Microbiological and Biochemical Properties; Weaver, R.W., Angle, S., Bottomley, P., Bezdicek, D., Smith, S., Tabatabai, A., Wollum, A., Eds.; Soil Science Society of America: Madison, WI, USA, 1994; Volume 2, pp. 775–833. ISBN 9780891188650. [Google Scholar]
  44. De Carvalho Mendes, I.; de Souza, L.M.; de Sousa, D.M.G.; de Castro Lopes, A.A.; dos Reis Junior, F.B.; Lacerda, M.P.C.; Malaquias, J.V. Critical Limits for Microbial Indicators in Tropical Oxisols at Post-Harvest: The FERTBIO Soil Sample Concept. Appl. Soil Ecol. 2019, 139, 85–93. [Google Scholar] [CrossRef]
  45. Cambardella, C.A.; Elliott, E.T. Particulate Soil Organic-Matter Changes across a Grassland Cultivation Sequence. Soil Sci. Soc. Am. J. 1992, 56, 777–783. [Google Scholar] [CrossRef]
  46. Swift, R.S. Organic Matter Characterization. In Methods of Soil Analysis; Sparks, D.L., Page, A.L., Helmke, P.A., Loeppert, R.H., Soltanpour, P.N., Tabatabai, M.A., Johnston, C.T., Sumner, M.E., Eds.; American Society of Agronomy Soil Science Society: Madison, WI, USA, 1996; pp. 1011–1020. [Google Scholar]
  47. Benites, V.M.; Madari, B.; Machado, P.L.O.A. Extração e Fracionamento Quantitativo de Substâncias Húmicas Do Solo: Um Procedimento Simplificado de Baixo Custo; Embrapa Solos: Rio de Janeiro, Brazil, 2003. [Google Scholar]
  48. Bayer, C.; Mielniczuk, J.; Amado, T.J.C.; Martin-Neto, L.; Fernandes, S.V. Organic Matter Storage in a Sandy Clay Loam Acrisol Affected by Tillage and Cropping Systems in Southern Brazil. Soil Tillage Res. 2000, 54, 101–109. [Google Scholar] [CrossRef]
  49. Carvalho, J.L.N.; Cerri, C.E.P.; Feigl, B.J.; Píccolo, M.C.; Godinho, V.P.; Cerri, C.C. Carbon Sequestration in Agricultural Soils in the Cerrado Region of the Brazilian Amazon. Soil Tillage Res. 2009, 103, 342–349. [Google Scholar] [CrossRef]
  50. Kaiser, H.F. The Varimax Criterion for Analytic Rotation in Factor Analysis. Psychometrika 1958, 23, 187–200. [Google Scholar] [CrossRef]
  51. Savegnago, R.P.; Caetano, S.L.; Ramos, S.B.; Nascimento, G.B.; Schmidt, G.S.; Ledur, M.C.; Munari, D.P. Estimates of Genetic Parameters, and Cluster and Principal Components Analyses of Breeding Values Related to Egg Production Traits in a White Leghorn Population. Poult. Sci. 2011, 90, 2174–2188. [Google Scholar] [CrossRef]
  52. Companhia Nacional de Abastecimento Boletim (CONAB). Das Safras de Grãos. Available online: https://www.conab.gov.br/info-agro/safras/graos/boletim-da-safra-de-graos?start=20 (accessed on 11 August 2023).
  53. Reichert, J.M.; Suzuki, L.E.A.S.; Reinert, D.J.; Horn, R.; Håkansson, I. Reference Bulk Density and Critical Degree-of-Compactness for No-till Crop Production in Subtropical Highly Weathered Soils. Soil Tillage Res. 2009, 102, 242–254. [Google Scholar] [CrossRef]
  54. Torres, J.L.R.; Fabian, A.J.; Pereira, M.G. Alterações Dos Atributos Físicos de Um Latossolo Vermelho Submetido a Diferentes Sistemas de Manejo. Ciência Agrotecnol. 2011, 35, 437–445. [Google Scholar] [CrossRef]
  55. Silva, J.R.; Silva, D.J.; Gava, C.A.T.; Tavares de Oliveira, T.C.; Conceição de Freitas, M.d.S. Carbon in Humic Fractions of Organic Matter in Soil Treated with Organic Composts under Mango Cultivation. Rev. Bras. Cienc. Solo 2016, 40, e0150095. [Google Scholar] [CrossRef]
  56. Jones, D.L.; Dennis, P.G.; Owen, A.G.; van Hees, P.A.W. Organic Acid Behavior in Soils—Misconceptions and Knowledge Gaps. Plant Soil 2003, 248, 31–41. [Google Scholar] [CrossRef]
  57. Dhaliwal, S.S.; Naresh, R.K.; Mandal, A.; Singh, R.; Dhaliwal, M.K. Dynamics and Transformations of Micronutrients in Agricultural Soils as Influenced by Organic Matter Build-up: A Review. Environ. Sustain. Indic. 2019, 1–2, 100007. [Google Scholar] [CrossRef]
  58. Franchini, J.C.; Hoffmann-Campo, C.B.; Torres, E.; Miyazawa, M.; Pavan, M.A. Organic Composition of Green Manure During Growth and Its Effect on Cation Mobilization in an Acid Oxisol. Commun. Soil Sci. Plant Anal. 2003, 34, 2045–2058. [Google Scholar] [CrossRef]
  59. Pegoraro, R.F.; da Silva, I.R.; Novais, R.F.; de Sa Mendonça, E.; de Oliveira Gebrim, F.; Moreira, F.F. Fluxo Difusivo e Biodisponibilidade de Zinco, Cobre, Ferro e Manganês No Solo: Influência Da Calagem, Textura Do Solo e Resíduos Vegetais. Rev. Bras. Cienc. Solo 2006, 30, 859–868. [Google Scholar] [CrossRef]
  60. Vitti, G.C.; Trevisan, T. Manejo de Macro e Micronutrientes Para a Alta Produtividade Da Soja. In Soja: Tecnologia da Produção; Câmara, G.M.S., Ed.; Potafos: Piracicaba, Brazil, 2000; pp. 383–422. [Google Scholar]
  61. Van Raij, B. Fertilidade Do Solo e Manejo de Nutrientes; International Plant Nutrition Institute: Piracicaba, Brazil, 2011. [Google Scholar]
  62. Lopes, A.S.; Guilherme, L.R.G. A Career Perspective on Soil Management in the Cerrado Region of Brazil. In Advances in Agronomy; Academic Press: Cambridge, MA, USA, 2016; Volume 137, pp. 1–72. ISBN 9780128046920. [Google Scholar]
  63. Meurer, E.J. Fundamentos de Química Do Solo, 3rd ed.; Evangraf: Porto Alegre, Brazil, 2006. [Google Scholar]
  64. Islabão, G.O.; Pinto, M.A.B.; Selau, L.P.R.; Vahl, L.C.; Timm, L.C. Characterization of Soil Chemical Properties of Strawberry Fields Using Principal Component Analysis. Rev. Bras. Cienc. Solo. 2013, 37, 168–176. [Google Scholar] [CrossRef]
  65. Camargo, F.A.O.; Silva, L.S.; Gianello, C.; Tedesco, M.J. Nitrogênio Orgânico Do Solo. In Fundamentos da Matéria Orgânica do Solo: Ecossistemas Tropicais e Subtropicais; Santos, G.A., Silva, L.S., Canellas, L.P., Camargo, F.A.O., Eds.; Metrópole: Porto Alegre, Brazil, 2008; pp. 87–99. [Google Scholar]
  66. Purwanto, B.H.; Alam, S. Impact of Intensive Agricultural Management on Carbon and Nitrogen Dynamics in the Humid Tropics. Soil Sci. Plant Nutr. 2020, 66, 50–59. [Google Scholar] [CrossRef]
  67. Cenciani, K.; dos Freitas, S.S.; Critter, S.A.M.; Airoldi, C. Microbial Enzymatic Activity and Thermal Effect in a Tropical Soil Treated with Organic Materials. Sci. Agric. 2008, 65, 674–680. [Google Scholar] [CrossRef]
  68. Qu, Y.; Tang, J.; Li, Z.; Zhou, Z.; Wang, J.; Wang, S.; Cao, Y. Soil Enzyme Activity and Microbial Metabolic Function Diversity in Soda Saline–Alkali Rice Paddy Fields of Northeast China. Sustainability 2020, 12, 10095. [Google Scholar] [CrossRef]
  69. Siebielec, S.; Siebielec, G.; Klimkowicz-Pawlas, A.; Gałązka, A.; Grządziel, J.; Stuczyński, T. Impact of Water Stress on Microbial Community and Activity in Sandy and Loamy Soils. Agronomy 2020, 10, 1429. [Google Scholar] [CrossRef]
  70. De Souza Gallo, A.; dos Santos Araujo, T.; dos Santos Araujo, F.; dos Santos, L.C.; de Franca Guimarães, N.; da Silva, R.F. Biomassa e Atividade Microbiana Em Solo Cultivado Com Milho Consorciado Com Leguminosas de Cobertura. Rev. Ciências Agrárias 2019, 42, 347–357. [Google Scholar] [CrossRef]
  71. Bonetti, J.D.A.; Anghinoni, I.; Zulpo, L. Temperatura e Umidade Do Solo Em Sistema de Integração Soja-Bovinos de Corte Com Diferentes Manejos Da Altura Do Pasto. Sci. Agrar. 2017, 18, 11. [Google Scholar] [CrossRef]
  72. Mendes, I.C.; Sousa, D.M.G.; Reis Junior, F.B.; Lopes, A.A.C.; Souza, L.M.; Chaer, G.M. Bioanálise de Solo: Aspectos Teóricos e Práticos. In Tópicos em Ciência do Solo; Severino, E.C., Morais, M.F., Paula, A.M., Eds.; Sociedade Brasileira de Ciência do Solo: Viçosa, Brazil, 2019. [Google Scholar]
  73. Xie, X.; Liao, M.; Yang, J.; Chai, J.; Fang, S.; Wang, R. Influence of Root-Exudates Concentration on Pyrene Degradation and Soil Microbial Characteristics in Pyrene Contaminated Soil. Chemosphere 2012, 88, 1190–1195. [Google Scholar] [CrossRef]
  74. Balota, E.L.; Nogueira, M.A.; Mende, I.C.; Hungria, M.; Fagotti, D.S.L.; Melo, G.M.P.; Souza, R.C.; Melo, W.J. Enzimas e Seu Papel Na Qualidade Do Solo. In Tópicos em Ciência do Solo; Araújo, A.P., Ed.; Sociedade Brasileira de Ciência do Solo: Viçosa, Brazil, 2013; pp. 189–250. [Google Scholar]
  75. Burns, R.G.; DeForest, J.L.; Marxsen, J.; Sinsabaugh, R.L.; Stromberger, M.E.; Wallenstein, M.D.; Weintraub, M.N.; Zoppini, A. Soil Enzymes in a Changing Environment: Current Knowledge and Future Directions. Soil Biol. Biochem. 2013, 58, 216–234. [Google Scholar] [CrossRef]
  76. Li, J.; Wu, X.; Gebremikael, M.T.; Wu, H.; Cai, D.; Wang, B.; Li, B.; Zhang, J.; Li, Y.; Xi, J. Response of Soil Organic Carbon Fractions, Microbial Community Composition and Carbon Mineralization to High-Input Fertilizer Practices under an Intensive Agricultural System. PLoS ONE 2018, 13, e0195144. [Google Scholar] [CrossRef]
  77. Bogati, K.A.; Golińska, P.; Sewerniak, P.; Burkowska-But, A.; Walczak, M. Deciphering the Impact of Induced Drought in Agriculture Soils: Changes in Microbial Community Structure, Enzymatic and Metabolic Diversity. Agronomy 2023, 13, 1417. [Google Scholar] [CrossRef]
  78. De Jesus Franco, A.; da Silva, A.P.V.; Souza, A.B.S.; Oliveira, R.L.; Batista, É.R.; de Souza, E.D.; Silva, A.O.; Carneiro, M.A.C. Plant Diversity in Integrated Crop-Livestock Systems Increases the Soil Enzymatic Activity in the Short Term. Pesqui. Agropecu. Trop. 2020, 50, e64026. [Google Scholar] [CrossRef]
  79. Sarto, M.V.M.; Borges, W.L.B.; Sarto, J.R.W.; Pires, C.A.B.; Rice, C.W.; Rosolem, C.A. Soil Microbial Community and Activity in a Tropical Integrated Crop-Livestock System. Appl. Soil Ecol. 2020, 145, 103350. [Google Scholar] [CrossRef]
  80. Mendes, I.C.; Martinhão Gomes Sousa, D.; Dario Dantas, O.; Alves Castro Lopes, A.; Bueno Reis Junior, F.; Ines Oliveira, M.; Chaer, G.M. Soil Quality and Grain Yield: A Win–Win Combination in Clayey Tropical Oxisols. Geoderma 2021, 388, 114880. [Google Scholar] [CrossRef]
  81. Ding, W.; Yu, H.; Cai, Z.; Han, F.; Xu, Z. Responses of Soil Respiration to N Fertilization in a Loamy Soil under Maize Cultivation. Geoderma 2010, 155, 381–389. [Google Scholar] [CrossRef]
  82. Tominaga, T.T.; Cássaro, F.A.M.; Bacchi, O.O.S.; Reichardt, K.; Oliveira, J.C.M.; Timm, L.C. Variability of Soil Water Content and Bulk Density in a Sugarcane Field. Soil Res. 2002, 40, 604. [Google Scholar] [CrossRef]
  83. Moitinho, M.R.; Ferraudo, A.S.; Panosso, A.R.; da Silva Bicalho, E.; Teixeira, D.D.B.; de Andrade Barbosa, M.; Tsai, S.M.; Borges, B.M.F.; de Souza Cannavan, F.; de Souza, J.A.M.; et al. Effects of Burned and Unburned Sugarcane Harvesting Systems on Soil CO2 Emission and Soil Physical, Chemical, and Microbiological Attributes. Catena Amst. 2021, 196, 104903. [Google Scholar] [CrossRef]
  84. De Asevedo Soares, D.; Modesto, V.C.; Nakao, A.H.; Soares, W.R.; Freitas, L.A.; Dickmann, L.; Pascoaloto, I.M.; Andreotti, M. Soybean Yield and Nutrition Grown on the Straw of Grain Sorghum Inoculated with Azospirillum Brasilense and Intercropped with BRS Paiaguás Grass. Plants 2023, 12, 2007. [Google Scholar] [CrossRef] [PubMed]
  85. Ministério da Agricultura (MAPA). Zoneamento Agrícola. Available online: https://www.gov.br/agricultura/pt-br/assuntos/riscos-seguro/programa-nacional-de-zoneamento-agricola-de-risco-climatico/zoneamento-agricola (accessed on 11 August 2023).
  86. Evangelista, C.R.; Partelli, F.L.; de Ferreira, E.P.; Correchel, V. Atividade Enzimática Do Solo Sob Sistema de Produção Orgânica e Convencional Na Cultura da Cana-de-Açúcar Em Goiás. Semin. Cienc. Agrar. 2012, 33, 1251–1262. [Google Scholar] [CrossRef]
  87. Gupta, V.V.S.R.; Roper, M.M.; Thompson, J.; Pratley, J.E.; Kirkegaard, J. Harnessing the Benefits of Soil Biology in Conservation Agriculture. In Australian Agriculture in 2020: From Conservation o Automation; Pratley, J., Kirkegaard, J., Eds.; Charles Sturt University: Wagga Wagga, NSW, Australia, 2020; pp. 237–253. [Google Scholar]
  88. Barbieri, M.; Dossim, M.F.; Nora, D.D.; dos Santos, W.B.; Bevilacqua, C.B.; de Andrade, N.; Boeni, M.; Deuschle, D.; Jacques, R.J.S.; Antoniolli, Z.I. Ensaio Sobre a Bioatividade Do Solo Sob Plantio Direto Em Sucessão e Rotação de Culturas de Inverno e Verão. Rev. Ciências Agrárias 2019, 42, 122–134. [Google Scholar] [CrossRef]
  89. Guangming, L.; Xuechen, Z.; Xiuping, W.; Hongbo, S.; Jingsong, Y.; Xiangping, W. Soil Enzymes as Indicators of Saline Soil Fertility under Various Soil Amendments. Agric. Ecosyst. Environ. 2017, 237, 274–279. [Google Scholar] [CrossRef]
  90. Li, J.; Niu, L.; Zhang, Q.; Di, H.; Hao, J. Impacts of Long-Term Lack of Potassium Fertilization on Different Forms of Soil Potassium and Crop Yields on the North China Plains. J. Soils Sediments 2017, 17, 1607–1617. [Google Scholar] [CrossRef]
Figure 1. Biweekly accumulations of rainfall (mm) and average temperatures (°C) during the experiments. Caiuá—SP, 2017, 2018, and 2019.
Sustainability 15 13829 g001
Figure 2. Biplots for principal component analysis (PCA) of physical and chemical fractions of soil organic matter, carbon stocks, and physical and chemical soil properties under different agricultural systems and crops. FAF stock: fulvic acid fraction stock; HAF stock: humic acid fraction stock; HU stock: humin stock; Total N stock: total nitrogen stock; POC stock: particulate organic carbon stock; TOC stock: total organic carbon stock; M-C stock: mineral-associated carbon stock; MA: macroporosity; CEC: cation exchange capacity.
Sustainability 15 13829 g002
Figure 3. Biplot for principal component analysis (PCA) of soybean GY (soybean grain yield), corn GY (corn grain yield), soil temperature, soil moisture, and soil enzyme activity during soybean cultivation under different production systems and crops.
Sustainability 15 13829 g003
Figure 4. Heatmap of changes in soil properties as a function of cropping system in sandy soil. The dendrogram on the left side of the map indicates management groupings based on similar patterns of variation. FAF stock: fulvic acid fraction stock; HAF stock: humic acid fraction stock; HU stock: humin stock; Total N stock: total nitrogen stock; POC stock: particulate organic carbon stock; TOC stock: total organic carbon stock; M-C stock: mineral-associated carbon stock; MA: macroporosity; CEC: cation exchange capacity.
Sustainability 15 13829 g004
Figure 5. Heatmap of variations in corn GY and soil temperature, moisture, and enzymatic activity during soybean cultivation as a function of the cultivation system in sandy soil. The dendrogram on the left side of the map indicates management groupings based on similar patterns of variation.
Sustainability 15 13829 g005
Table 1. Descriptive statistics of physical and chemical indicators of soil fertility 1.
ParameterMinimumMeanMaximumSDCVMinimumMeanMaximumSDCV
20172019
FAF stock (t ha−1)-----1.01.52.20.3725
HAF stock (t ha−1)-----0.51.21.80.3631
HU stock (t ha−1)-----3.05.18.11.2324
Total N stock (t ha−1)-----1.01.42.10.2619
POC stock (t ha−1)-----2.24.05.91.0125
MA (m−3 m−3)-----0.10.20.30.0424
Al (mmolc dm−3)-----0.10.32.00.64125
TOC stock (t ha−1)11.0912.714.851.07810.613.718.61.8514
M-C stock (t ha−1)6.469.1011.681.50175.99.713.62.526
pH (CaCl2)5.105.636.900.4384.85.46.20.336
K (mmolc dm−3)1.302.905.901.35461.32.85.01.0638
Ca (mmolc dm−3)16.0030.71162.0030.55998.014.326.04.2330
Mg (mmolc dm−3)6.0013.5762.0011.57855.08.721.03.6842
H+Al (mmolc dm−3)10.0016.5722.003.201911.015.625.03.6123
CEC (mmolc dm−3)41.3063.55235.6040.186330.941.459.98.2420
Cu (mmolc dm−3)0.300.580.800.15260.30.50.80.1533
Fe (mmolc dm−3)2.006.6211.002.52386.013.429.06.5449
Mn (mmolc dm−3)4.808.8013.702.64304.27.512.72.6435
B (mmolc dm−3)0.080.170.340.0739-----
Zn (mmolc dm−3)0.401.041.900.3836-----
1 Evaluation at the end of the soybean cycle. FAF stock: fulvic acid fraction stock; HAF stock: humic acid fraction stock; HU stock: humin stock; total N stock: total nitrogen stock; POC stock: particulate organic carbon stock; TOC stock: total organic carbon stock; M-C Stock: mineral-associated carbon stock; MA: macroporosity, CEC: cation exchange capacity; SD: standard error of the mean; CV: coefficient of variation, N = 21.
Table 2. Descriptive statistics of crop yields and soil enzyme activity, moisture, and temperature.
ParameterMinimumMeanMaximumSDCVMinimumMeanMaximumSDCV
2017/182018/19
Soybean GY (kg ha−1)2442318534992739-----
Corn GY (kg ha−1)3979570872749471711731857270541022
Temperature (°C)30.534.041.93.31029.032.741.02.310
Moisture (%)4.56.88.71.2174.77.311.92.129
β-Glucosidase *63.076.490.98.61162.396.9139.320.922
Phosphatase *141.4319.8454.583.02623.050.692.517.835
Arylsulfatase *12.228.657.112.44311.624.350.811.939
Soybean GY: soybean grain yield; Corn GY: corn grain yield; CV: coefficient of variation, n = 20. * µg PNP kg−1 h−1.
Table 3. Analysis of the principal components explaining the variations in the physical and chemical fractions of soil organic matter, carbon stock, and physical and chemical properties of the soil under different agricultural production systems and crop types.
----------2017--------------------2019----------
PCAPC1PC2PC1PC2
Eigenvalue6.962.677.904.26
Explained variance (%)53.5720.5143.9123.69
Cumulative variance (%)53.5774.0843.9167.60
Parameters 1Correlation 2
FAF stock--0.90−0.03
HAF stock--0.530.05
HU stock--0.700.22
Total N stock--0.690.29
POC stock--0.590.59
MA--−0.48−0.05
Al 0.44−0.64
TOC stock0.670.590.880.19
M-C stock0.740.440.64−0.11
pH−0.850.40−0.360.91
K0.520.580.82−0.24
Ca−0.690.600.400.84
Mg−0.730.620.290.91
H+Al0.89−0.020.70−0.60
CEC−0.650.650.750.54
Cu0.870.220.73−0.28
Fe0.88−0.090.85−0.42
Mn0.730.070.73−0.05
B0.780.15--
Zn0.310.63--
1 Evaluation at the end of the soybean cycle. 2 Correlations considered in the principal component analysis. FAF stock: fulvic acid fraction stock; HAF stock: humic acid fraction stock; HU stock: humin stock; Total N stock: total nitrogen stock; POC stock: particulate organic carbon stock; TOC stock: total organic carbon stock; M-C stock: mineral-associated carbon stock; MA: macroporosity; CEC: cation exchange capacity.
Table 4. Principal component analysis of corn and soybean grain yields and soil temperature, moisture, and enzymatic activity during soybean crops under different production systems and crops.
PCAPC1PC2PC1PC2
----------2017--------------------2019----------
Eigenvalue4.071.293.091.44
Explained variance (%)58.1018.3751.5124.04
Cumulative variance (%)58.1076.4851.5175.55
Parameter 1Correlation 2
Corn grain yield0.88−0.200.59−0.21
Soybean grain yield−0.020.90--
Temperature 3−0.75−0.36−0.680.55
Moisture 10.830.370.56−0.72
β-Glucosidase0.84−0.360.850.44
Phosphatase0.82−0.190.750.61
Arylsulfatase0.810.090.820.09
1 Soil temperature and moisture were measured during the soybean cycle. Enzyme activity was evaluated at the end of the soybean cycle. 2 Correlations considered for principal component analysis. 3 Soybean GY: soybean grain yield; Corn GY: corn grain yield.
Disclaimer/Publisher’s Note: The statements, opinions and data contained in all publications are solely those of the individual author(s) and contributor(s) and not of MDPI and/or the editor(s). MDPI and/or the editor(s) disclaim responsibility for any injury to people or property resulting from any ideas, methods, instructions or products referred to in the content.

