Article

Effects of Cornices on Wind Loads of Solar Panels Mounted on Gable Roof Building

1
College of Civil Engineering and Architecture, Nanxun Campus, Zhejiang University of Water Resources and Electric Power, Huzhou 313009, China
2
Hangzhou Jiangnan Talent Service Co., Ltd., Hangzhou 310009, China
3
China Energy Engineering Group, Zhejiang Electric Power Design Institute Co., LTD., Hangzhou 310012, China
4
Institute of Structural Engineering, Zhejiang University, Hangzhou 310058, China
*
Author to whom correspondence should be addressed.
Sustainability 2023, 15(18), 13805; https://doi.org/10.3390/su151813805
Submission received: 20 July 2023 / Revised: 8 September 2023 / Accepted: 13 September 2023 / Published: 15 September 2023
(This article belongs to the Section Sustainable Engineering and Science)

Abstract

:
The effects of various parameters of the solar panel and surrounding structure on wind loads acting on solar panels have been extensively investigated in prior studies. However, the parameter of cornice length has not been considered. With varying lengths of cornices, solar panels can be positioned either near or far away from the roof corner and edge, which are the locations where the largest wind-induced suction forces are likely to occur. To examine the effects of cornices, a wind tunnel test was conducted to measure the wind pressures on a solar module installed on a residential gable roof building. The cornice lengths varied from 0 m to 1.6 m, with an interval of 0.4 m. The results show that when wind blows perpendicular to the roof ridge, cornice can reduce the mean, STD, and peak pressure coefficients on the upper and lower surfaces and resulting net values. However, it should be noted that the most unfavorable area-averaged minimum peaks in the middle and trailing zones exhibit a gradual increase with the growing cornice length. Considering the potential risk of solar module failure resulting from high wind-induced suction forces, more caution is needed when installing solar modules on roofs with larger cornices.

1. Introduction

Solar panels, as a widely adopted renewable energy source, have been extensively utilized in numerous countries. The utilization of solar panels offers notable advantages, such as the efficient generation of electric power close to energy consumers, as well as the absence of any supplementary land requirements [1,2,3,4,5]. Wind loads on solar panels, a crucial aspect in the design of solar photovoltaic systems, are inadequately addressed by existing design standards [3,4,5,6]. However, a secure and cost-effective wind-resistant design of solar photovoltaic systems requires accurate information on the wind load estimation.
Wind-induced high suction force can potentially result in failure of both the components/claddings and/or the main roof structure. Similarly, solar photovoltaic systems installed on the building roof may experience panel failure and even roof failure. Many studies have been conducted with the aim of quantifying the wind loads experienced by solar panels installed on building roofs. Shademan and Hangan [4] conducted a comprehensive investigation to examine the impact of inclination angle on the wind loads experienced by solar panels. Dai et al. [5] conducted comprehensive experiments to investigate the effects of panel location, inclination angle, and building height on wind loads of isolated solar panels installed on the rooftop of a tall building. They observed that the mean and peak wind pressure coefficients of solar panels decreased with the increase in building height. Furthermore, buildings with lower heights were prone to induce more significant fluctuations of wind loads on solar panels. Aly and Bitsuamlak [6] investigated the wind loads on solar panels installed on low-rise buildings with gable roofs. They conducted a comparison between the wind loads experienced by solar panels with the provisions outlined by ASCE for residential bare roofs and found that the testing wind loads showed a good agreement with the provisions. Kopp et al. [7] analyzed the aerodynamic mechanisms for wind loads on tilted solar arrays on flat roofs of low-rise buildings. Furthermore, Pratt and Kopp [8] investigated the wind field around tilted solar arrays. They found that the mean flow above the array was not significantly altered compared to that observed for a bare roof. However, the presence of the array had a noteworthy impact on the turbulence around the panels. Alrawashdeh and Stathopoulos [9] conducted a study on the impact of geometric scale on wind loads of roof-mounted solar panels when simulated by a wind tunnel test. They emphasize the need for caution when solar panels are tested in ABLWTs. Kopp and Banks [10] suggested that model scales of 1/50 or larger were advisable when conducting tests on wind loads of roof-mounted solar panels in ABLWTs in order to accurately model the size of the gaps among panels and between panels and the building roof. Stenabaugh et al. [11] employed wind tunnel tests to examine the change of wind loads when altering the gaps between individual modules and the clearance above the roof surface. Their findings revealed that lower net wind loads can be yielded if the gaps are enlarged between modules or the clearances above the roof surface are reduced. Naeiji et al. [12] tested the wind loads on flat, gable, and hip-roof buildings. They discovered that the critical wind directions associated with the largest peak force coefficients depended on both roof type and tilt angle of the solar panel. Notably, tilt angle was the most critical parameter in determining the resulting peak wind loads. The wind loads on solar panels mounted on gable roofs were also investigated by Geurts and Blackmore [13]. Their findings were similar to Naeiji et al. [12]. Wang et al. [14] employed large eddy simulations (LES) to investigate the flow characteristics around flat roof-mounted solar arrays. The study revealed that the peak uplift could attributed to both the flow separation and reattachment induced by the building edge and the local flow separations at the higher edges of the solar panels. Although the CFD simulation provided valuable insights into the flow field around solar panels, the numerical modeling in the LES can become time-consuming, particularly when dealing with high Reynolds numbers [15]. Wang et al. [16] compared the tested wind pressure of solar panels on flat and slope roofs with the design values calculated by the provisions outlined by ASCE 7-16 [17] and JIS C 8955:2017 [18]. Results showed that the largest wind pressures determined through wind tunnel testing were much larger than the calculated values by ASCE 7-16 while smaller than the values by JIS C 8955. In the NB/T 10115 standard [19], wind loads on solar panels are relevant to the gust factor and shape factor. However, the shape factor in this standard is determined by the tilt angle of the solar panel. Effects of other factors, such as roof height, parapet, and cornice, are not considered in NB/T 10115. In the newly published American standard ASCE 7-22 [20], wind loads of solar panels mounted on a building roof are calculated as external pressures for C&C of a roof with respective roof zoning multiplying two solar panel-related parameters, i.e., array edge factor and pressure equalization factor.
Wind loads acting on solar panels are generally affected by both the solar panel itself and its surroundings. The parameters of a solar panel include the tilt angle and panel dimensions, while the parameters of its surroundings encompass the building height, building plan dimensions, roof type, and slope, as well as the gaps between the panels and the building roof. The effects of these parameters on wind loads of solar panels have been studied. However, the effects of cornice on wind loads of solar panels have not been studied in the previous literature. With different lengths of cornices, solar panels may be located near or far away from the roof corner and edge, where the largest wind-induced suction force may occur. To investigate the effects of cornices, a wind tunnel test is conducted to measure the wind pressures on solar modules mounted on residential gable roof buildings with cornice lengths ranging from 0 m to 1.6 m at an interval of 0.4 m. Then, the wind pressure characteristics of solar modules without cornice are discussed. Finally, the effects of cornice on wind loads of solar module are investigated.

2. Experimental Procedure

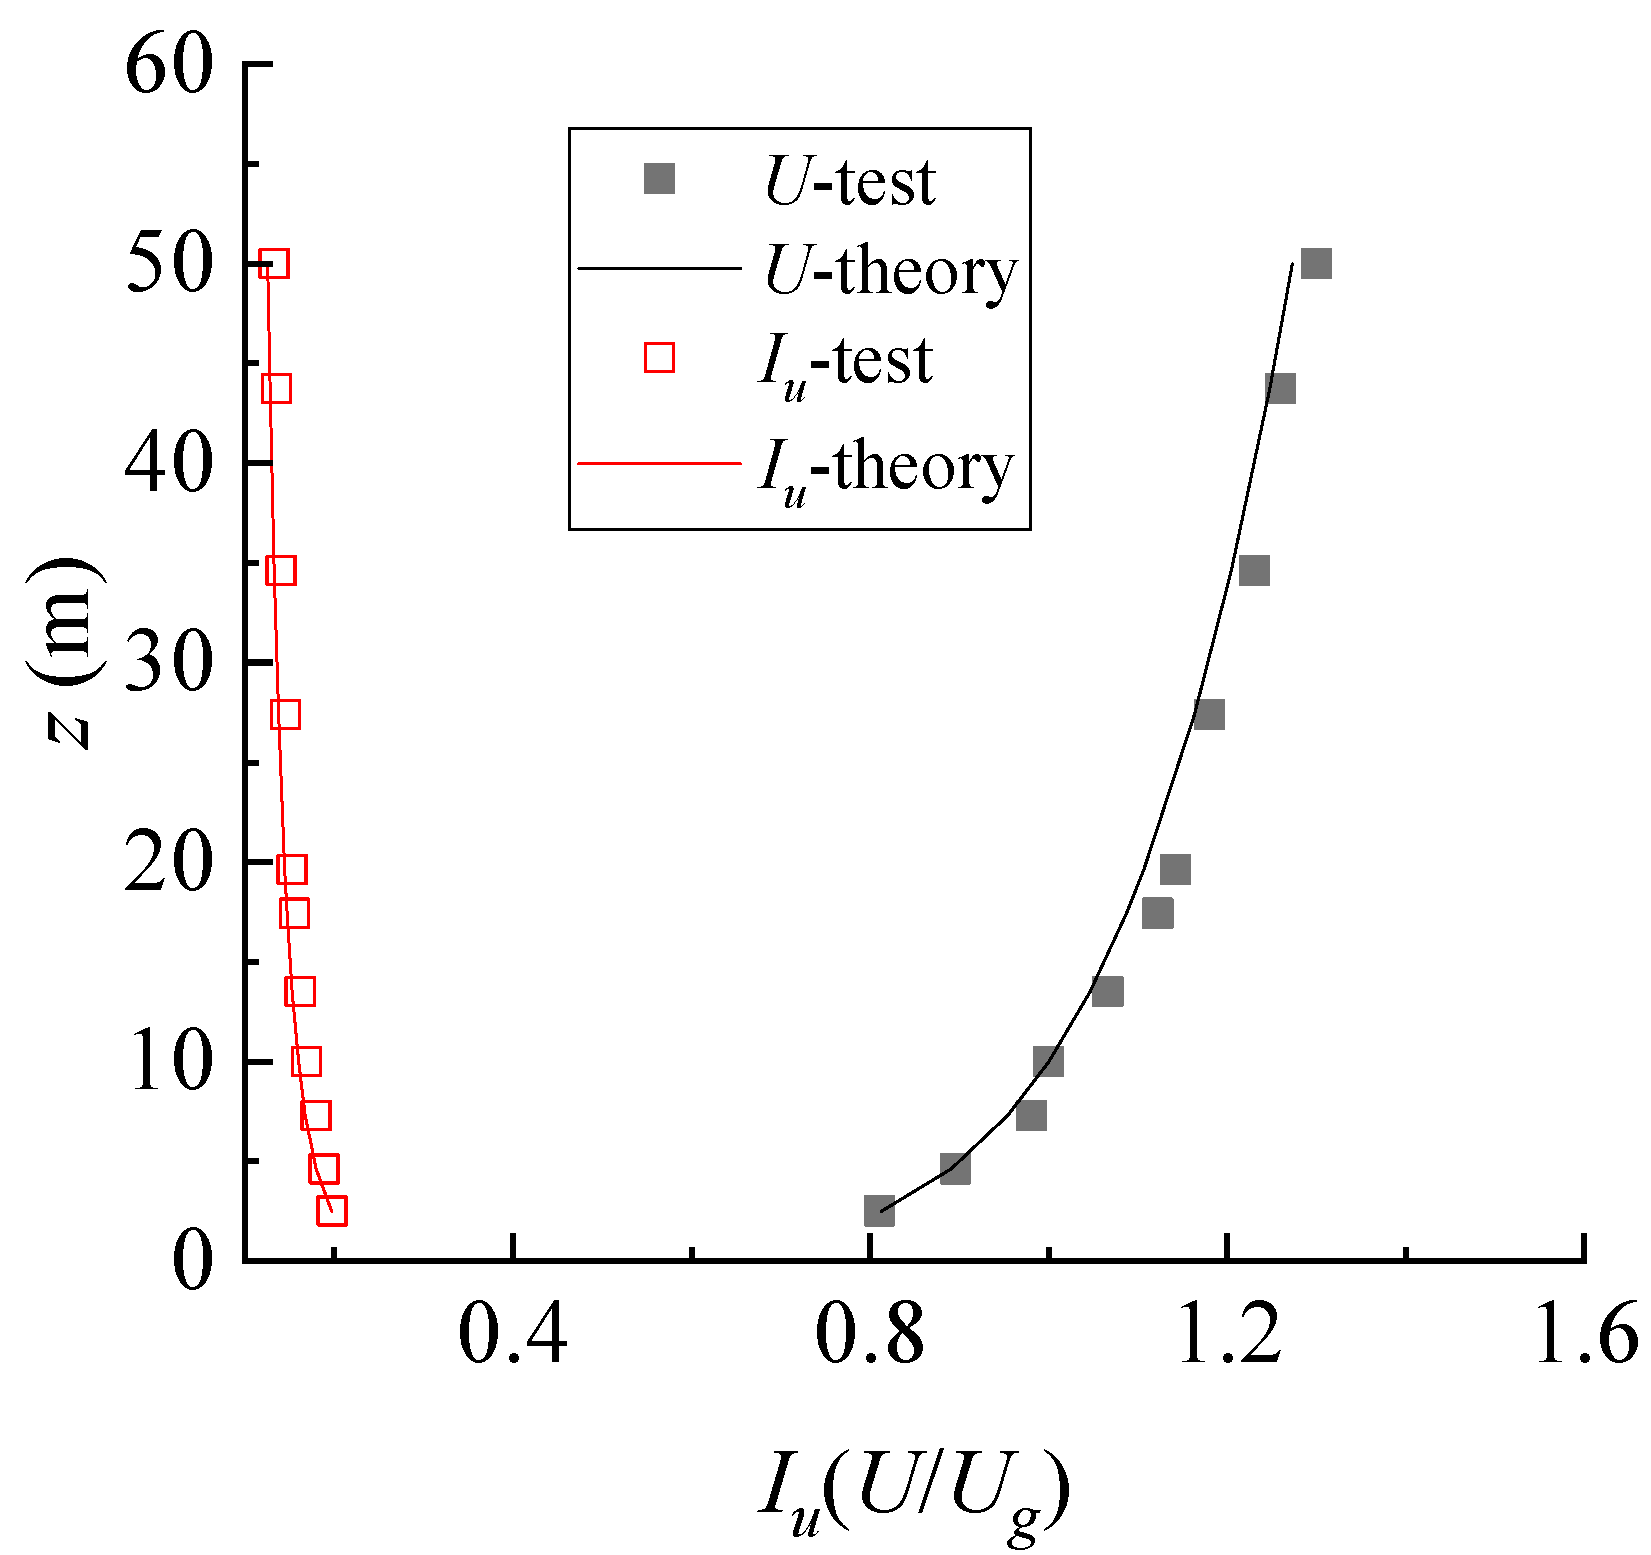
2.1. Terrain Simulation

Wind pressure measurements were conducted in the Boundary Layer Wind Tunnel (BLWT) ZD-1 at Zhejiang University. The work section of BLWT ZD-1 was 4 m wide and 3 m high. An open country terrain was simulated, and the target power-law exponent of the mean wind velocity was set to 0.15 [21]. The measured profiles of mean wind velocity and turbulence intensity are illustrated in Figure 1. Data points are measured profiles, while the solid lines are profiles specified in the standard GB 50009-2012 [21]. The mean wind speed profile has been normalized to a reference height of 10.38 m. The longitudinal turbulence intensity at the reference height was 16.9%. As shown, the measured profiles of mean wind speed and turbulence intensity are reasonably consistent with the target profiles specified in the GB 50009-2012 for open country terrain [21].

2.2. Model Design

The solar module was mounted on a gable-roof, low-rise residential building, as shown in Figure 2. The building configuration included two parts, i.e., one fixed part -the main body, and one flexible part—cornices. The residential building featured a roof slope of 30°, plan dimensions of 9 m (=B) by 14 m (=D), an eave height of 6.6 m (=H), and a ridge height of 9.2 m (=h) in full-scale, which resulting a mean roof height of 7.9 m. The solar module, having plan dimensions of 4.8 m (=b) × 13.6 m (=d), was installed bilateral symmetrically, parallelly on the sloping roof. The clearance (∆S) between the lower surface of the module and the roof was set as 10 cm, which satisfied the Chinese executive orders that require the clearance between the lower surface of the solar module and the sloped roof to be less than 30 cm. The setbacks (s) from the edges of the solar module to the roof ridge, eave, and two ends were 0.2 m, respectively. Aly and Bitsuamlak [4] presented that solar panel modules experienced high net minimum pressures over roof corner and edge zones; thus, five kinds of cornices with lengths of 0 m to 1.6 m at an interval of 0.4 m were constructed, which represent narrow, medium and wide cornice. Thus, the length (L) of the building roof can be calculated as L = 4.5/cos30° + c (m). Gaps between individual modules were not considered in the model design, as solar modules are practically installed on purlins, and the gaps are blocked by purlins. The geometrical scale of the simulated flow and building model was 1/25. The maximum blockage ratio was less than 2%. Photographs of experimental models with cornice lengths (c) of 0 m, 0.4 m, 0.8 m, 1.2 m, and 1.6 m in the wind tunnel are displayed in Figure 3.
Wind pressures on the upper and lower surfaces were measured by 280 pressure taps, i.e., 7 × 20 taps drilled on each surface, as shown in Figure 2. This study focused on the wind pressures on solar modules, and no taps were drilled on the building and roof. Wind pressures on the solar module were measured for 90 s at a sampling frequency of 312.5 Hz for wind directions clockwise from 0° to 180° at an interval of 15°, where 0° was perpendicular to the roof ridge, as shown in Figure 2. Thus, more than 28,000 data were recorded at each tap for each wind incidence angle.

2.3. Data Processing

The instantaneous wind pressure coefficient on the upper ( C p u , i ( t ) ) and lower ( C p l , i ( t ) ) surfaces of a solar module at the pressure tap i can be obtained by the instantaneous wind pressure ( P u ( l ) , i ( t ) ) and expressed as
C p u ( l ) , i ( t ) = P u ( l ) , i ( t ) P 1 2 ρ U H 2
where P u ( l ) , i ( t ) is the recorded pressure on the upper or lower surface of tap i at time t , ρ is the air density, U H is the mean wind speed at reference height, P is the ambient atmospheric pressure. Positive values of C p u ( l ) , i ( t ) indicate that wind loads act toward the surfaces of the module, and the negative values of C p u ( l ) , i ( t ) indicated that wind loads act deviating from the surfaces. The net pressure coefficient ( C p n , i ( t ) ) resulted from the associated upper and lower pressure coefficients can be obtained as
C p n , i ( t ) = C p u , i ( t ) C p l , i ( t )
According to Equation (2), the sign of C p n , i ( t ) is consistent with C p u , i ( t ) , and the positive values of C p n , i ( t ) indicated that wind loads act toward module. Area-averaged pressure coefficients are obtained based on the time histories of wind pressure coefficients recorded at the taps. The instantaneous area-averaged pressure coefficient for a given area on the upper surface, i.e., C p A u ( t ) is calculated as
C p A u ( t ) = i = 1 n C p u , i ( t ) × A i A
where A i is the associated tributary area at tap i , A is the total area belong to a given zone, and n is the number of taps in the given zone.
The maximum and minimum peak pressure coefficients are calculated by CookMayne’s “Best Linear Unbiased Estimator (BLUE)” [22,23]. As the wind pressure at each tap was measured at 13 wind directions, the most unfavorable maximum and minimum peak pressure coefficients are defined as the largest value in magnitude of maximum and minimum peak pressure coefficients among all wind directions, respectively.

3. Results

Figure 4 presents the distributions of mean, STD, and peak pressure coefficients on the upper surface of the solar module, which is instrumented on the 30°-sloped gable roof. When the wind direction (θ) is perpendicular to the roof ridge (i.e., θ = 0°), the mean pressure coefficients on the central area of the upper surface are nearly zero, resembling those observed on a gable roof. However, the areas near the roof eave and ridge experience significantly larger magnitudes of negative pressure coefficients. The largest mean negative pressure coefficient appearing close to the windward roof eave is about −0.4 due to the incoming flow separation. The STD pressure coefficients decrease gradually on the upper surface along the wind direction. The minimum peak pressure coefficients decrease rapidly along the wind direction, with a strong value of −1.8 close to the leading corner and roof eave. The upper surface exhibits smaller maximum peak pressure coefficients accompanied by smaller changes in gradient. The largest mean negative pressure coefficient, observed in proximity to the windward roof eave, is approximately −0.4, resulting from flow separation induced by the incoming wind. When θ = 45°, a small area with mean pressure coefficients of 0 appears along with the oblique wind direction. The mean pressure coefficients near the roof eave and ridge exhibit a close resemblance, comparable to those observed at a wind direction of 0°. The leading corner exhibits higher minimum peak pressure coefficients with rapid change in gradient. Additionally, the largest minimum peak pressure coefficient is about −1.8, which is also comparable with that at θ = 0°. When θ = 90°, the windward edge experiences larger mean and minimum peak pressure coefficients while smaller maximum peak pressure coefficients. The largest mean pressure coefficient reaches 1.0, which is nearly twice as high as that observed at wind directions of 0° and 45°. The largest minimum peak pressure coefficient reaches −2.4, which is approximately 30% larger than that observed at wind directions of 0° and 45°. It is indicated that the conical vortex generated by the roof edge at the oblique wind direction has a significant impact on the wind loads of the solar module.
Figure 5 presents the distributions of mean, STD, and peak pressure coefficients on the lower surface of the solar module instrumented on the 30°-sloped gable roof. When θ = 0°, the area close to the roof eave experiences smaller mean pressure coefficients, while the area close to the roof ridge and edges experiences larger mean pressure coefficients, which is opposite of that on the upper surface. Larger minimum peak pressure coefficients also appear in the area close to the roof edge, which is different from that on the upper surface, where larger minimum peak pressure coefficients appear in the area close to the eave. This may be attributed to the accelerated wind flow exiting the cavity through the passage formed by the gable roof edge and solar module. When θ = 45°, the larger mean and minimum peak pressure coefficients also appear in the area near the roof ridge. The largest mean pressure coefficient reaches −0.7, which is approximately 75% larger than that observed on the upper surface. At the same time, the largest minimum peak pressure coefficient is comparable with that observed on the upper surface. When θ = 90°, the largest minimum peak pressure coefficient on the lower surface is approximately 33% smaller than the value on the upper surface.
Figure 6 displays the distributions of mean, STD, and peak net pressure coefficients on the solar module. When θ = 0° and 45°, although the wind forces acting on upper and lower surfaces are suction forces, the mean net pressure coefficients are positive in most areas due to the dominance of suction forces on the lower surface compared to those on the upper surface. While at θ = 90°, since the mean pressure coefficients on the upper and lower surfaces exhibit comparable distributions, the resulting mean net pressure coefficients are nearly zero. The distributions of the STD net pressure coefficients are relatively small, suggesting minimal fluctuation. The largest minimum peak net pressure coefficients under the three wind directions are −1.6, −1.2, and −1.2, respectively, observed at the area near the roof eave, leading corner along the wind direction, and near the roof edge. Moreover, the maximum peak net pressure coefficients are significantly larger than that observed on the upper and lower surfaces. The largest maximum peak net pressure coefficient reaches 1.2 in the area near the roof eave and edge under the wind direction of 0°, which is twice that of those observed on the upper surface and three times that of those observed on the lower surface. Furthermore, the largest maximum peak net pressure coefficients in the area near the roof eaves are approximately equal to the largest minimum values.

4. Discuss

4.1. Effects of Cornice on Wind Loads of Solar Module at Wind Direction Perpendicular to Roof Ridge

The mean and minimum peak pressure coefficients on the solar module, as depicted in Figure 4, Figure 5 and Figure 6, indicate distinct wind pressure distributions between the end and inner sections of the solar module when the wind direction is perpendicular to the roof ridge. In the following analysis, three sections, i.e., the end Section 1–1, the 1/4 Section 2–2, and the center Section 3–3, displayed in Figure 7, are selected to examine the impact of cornice at θ = 0°, where the length of cornice varies from 0 m to 1.6 m.
The mean pressure coefficients at the three typical sections on upper and lower surfaces and the resulting mean net pressure coefficients with cornices (c) ranging from 0 m to 1.6 m with an interval of 0.4 m are displayed in Figure 8, in which x represents the horizontal projection distance extending from the measurement tap to the roof eave. Generally, cornice has a significant impact on the mean pressure coefficients of the end section (Section 1–1) while less impact on the mean pressure coefficients of 1/4 (Section 2–2) and center (Section 3–3) sections. For the end section (Section 1–1), when the cornice reaches 0.8 m, the mean pressure coefficients on the upper and lower surfaces transition from negative values to near zero, and the magnitude at the leading edge on the lower surface is reduced by approximately 85%. After reaching 0.8 m, the mean pressure coefficients on the upper and lower surfaces remain almost unchanged. However, the mean net pressure coefficients remain unchanged when the cornice reaches 0.4 m and reduces by approximately 40% at the leading edge. For the 1/4 (Section 2–2) and center (Section 3–3) sections, cornices primarily affect the mean pressure at the leading taps. The mean net pressure coefficients at the leading taps are negative in the absence of cornices but change to positive values when cornices are present.
The STD pressure coefficients at the three typical sections on upper and lower surfaces and the resulting STD net pressure coefficients with cornices are shown in Figure 9. It can be observed that cornices effectively reduce the fluctuation of wind pressure at the leading taps, particularly at the leading corner taps. Increasing cornice from 0 m to 0.4 m resulted in a significant reduction of approximately 40% in the STD pressure coefficients on the upper surface. Additionally, the net pressure coefficients at the leading corner tap experienced a substantial decrease of approximately 65%.
It should also be noted that once the cornice height reaches 0.8 m, there is a remarkable similarity in the fluctuations of wind pressures on the upper surface at the end section (Section 1–1) and 1/4 section (Section 2–2). This similarity is also evident in the net pressure observed at the same taps.
The minimum peak pressure coefficients at three representative sections, both on the upper and lower surfaces, along with the corresponding minimum peak net pressure coefficients in the presence of cornices, are depicted in Figure 10. The influence of cornices on the minimum peak pressure coefficients of one side surface differs from its impact on the minimum peak net pressure coefficients. For both the upper and lower surfaces, the minimum peak pressure coefficients exhibit a gradual reduction as the cornice length increases. This reduction is particularly pronounced for the values observed on the end section (Section 1–1) of the lower surface. However, the impact of cornices on the minimum peak net pressure coefficients is not as pronounced when compared to the effects observed on the values of the individual side surface. By increasing the cornice length from 0 m to 0.4 m, there is a significant reduction in the minimum peak net pressure coefficients at the leading taps of the end (Section 1–1), 1/4 (Section 2–2), and center (Section 3–3) section. The mentioned leading taps demonstrate reductions of approximately 69%, 80%, and 68%, respectively. However, as the cornice length continues to increase beyond the aforementioned values, the minimum peak net pressure coefficients exhibit negligible changes.
Figure 11 presents the maximum peak pressure coefficients at three representative sections, both on the upper and lower surfaces, along with the corresponding maximum peak net pressure coefficients in the presence of cornices. As depicted, the influence of cornices on the maximum and minimum peak pressure coefficients exhibits noticeable differences. Cornices have a significant impact on the maximum peak pressure coefficients observed at the end section (Section 1–1), while their influence on the values of the 1/4 section (Section 2–2) and center section (Section 3–3) is comparatively less pronounced. The maximum peak net pressure coefficients exhibit a rapid decrease initially and then gradually diminish as the cornice length increases. By increasing the cornice length from 0 m to 0.4 m, the maximum peak net pressure coefficients at the leading taps experience a reduction of approximately 36%. However, the maximum peak pressure coefficients on the upper and lower surfaces of the end section (Section 1–1) exhibit an increasing trend until the cornice height reaches 0.8 m. Beyond this value, further increases in the cornice height do not result in any additional increase in the maximum peak pressure coefficients.
In general, cornice has the effect of reducing the mean, standard deviation (STD), and peak pressure coefficients on both the upper and lower surfaces of the structure, as well as the resulting net values. However, once the cornice reaches a certain length, its influence on the wind loads acting on gable-roof-mounted panels tends to stabilize. At this point, further increases in cornice length may have limited additional impact on the wind load distribution. This finding suggests the existence of an optimal cornice length beyond which the structural response remains relatively constant in terms of wind loads. The mechanism by which a cornice reduces wind loads on panels can be likened to the concept of setbacks. Similar to setbacks in building design, the presence of a cornice creates a barrier that alters the flow patterns and reduces the impact of the vortex on the panels. Hence, the wind loads, particularly the peak wind loads, are reduced as a result of the cornice’s impact, particularly at wind directions of 0°. This analogy helps to conceptualize and understand the role of the cornice in mitigating wind loads on the panels.

4.2. Effects of Cornices on Most Unfavorable Peak Net Pressure Coefficients among All Wind Directions

The most critical aspect of wind resistant structural design is the determination of the most unfavorable peak net pressure coefficients. These coefficients represent the envelope values derived from the peak net pressure coefficients across all wind directions. Figure 12 and Figure 13 illustrate the distributions of the most unfavorable minimum and maximum peak net pressure coefficients across all wind directions, taking into account different cornice sizes (c) of 0 m, 0.4 m, 0.8 m, 1.2 m, and 1.6 m. With c = 0 m, larger negative and positive values occur in the zones near the corner and short edge. The minimum and maximum peak net pressure coefficients range from −1.0 to −2.0 and from 0.8 to 2.0, respectively. However, it is worth noting that the larger maximum peak net pressure coefficients primarily occur in the corners. If the corners are eliminated, the distribution of maximum peak net pressure coefficients becomes more uniform.
It can be observed from Figure 12 and Figure 13 that cornices have a significant impact on the most unfavorable minimum and maximum peak net pressure coefficients. By increasing the cornice length from 0 m to 1.6 m, the negative pressure coefficients near the roof eave exhibit a decrease, while they show an increase over the inner zone. When considering cornices of varying lengths, the most unfavorable minimum peak net pressure coefficients near the roof eave range from approximately −0.8 to −1.0. These coefficients experience a reduction of approximately 38% to 50% compared to the values observed without any cornice (0 m). In the middle of the panel, the most unfavorable minimum peak net pressure coefficient reaches −1.8 with cornices of 1.2 m and 1.6 m, whereas it remains around −1.0 in the absence of a cornice (0 m). The positive pressure coefficients exhibit an increase in proximity to the short edge. The most unfavorable maximum peak net pressure coefficient reaches 1.6 when the cornice increases to 0.8 m, which is much larger than the value of 1.0 with a cornice of 0 m. Considering the observation that cornice can decrease the peak net pressure coefficients when the wind blows perpendicular to the roof ridge mentioned in Section 4, the increase in the most unfavorable net pressure coefficients with cornice occurs at oblique wind directions. In other words, a longer length of cornice can lead to larger unfavorable minimum and maximum peak net pressure coefficients, particularly when subjected to oblique wind directions.
In the wind-resistant design of both components/claddings and the main roof structure, standards such as ASCE 7-22 and JIS C: 8955 utilize area-averaged pressure coefficients over zones rather than local pressure coefficients. This approach ensures a more comprehensive consideration of the wind loads acting on the structure. To provide a quantitative description of the effects of cornice on the area-averaged minimum and maximum peak net pressure coefficients, the module is subdivided into 15 zones, as shown in Figure 14. The most unfavorable area-averaged minimum and maximum peak net pressure coefficients over the 15 zones and the corresponding most unfavorable wind directions are shown in Figure 15, in which the upper values are pressure coefficients, and the lower values are associated wind directions. The most unfavorable area-averaged minimum peaks are −1.08, −0.93, −1.03, −1.20, and −1.15 with cornices of 0 m, 0.4 m, 0.8 m, 1.2 m, and 1.6 m, respectively, which are smaller than the worst peaks (−1.5) calculated by Stenabaugh [11] using wind tunnel test data of a similar model. This could be attributed to the relatively smaller area assigned to each zone in Stenabaugh’s study. The most unfavorable area-averaged minimum peaks in the middle and trailing zones increase gradually with the increase in cornice, especially in the center zone of the module, increasing from −0.78 to −1.15 when the cornice increases from 0 m to 1.6 m. The effects of the cornice on the most unfavorable area-averaged minimum peaks near the roof eave are less significant. The associated most unfavorable winds are oblique winds for the minimum peaks, mainly ranging from 105° to 135°, and changing little with cornice length. However, the effects of the cornice on the most unfavorable area-averaged maximum peaks are opposite to the minimum values in the leading and middle zones. Increasing cornice from 0 m to 1.6 m, the most unfavorable area-averaged maximum peaks in the two leading corner zones decrease from 0.98 to 0.52 and 1.13 to 0.56, respectively. In the trailing corner, the most unfavorable area-averaged maximum peak increases from 0.69 to 1.01. The most unfavorable winds associated with maximum peaks are headwinds and rarely change with the increase in cornice. In general, as the length of the cornice increases, the minimum peak values tend to increase, while the maximum peak values tend to decrease. Due to the potential failure of solar modules caused by the high suction forces induced by wind, it is crucial to exercise greater caution when installing solar modules on roofs with larger cornices.

5. Conclusions

Wind tunnel tests were conducted to measure the wind pressure on solar modules installed on a gable roof building, specifically focusing on the effects of different lengths of cornice. The cornice varied from 0 m to 1.6 m with an interval of 0.4 m, and the testing wind direction varied from 0° to 180°.
When the wind blows perpendicular to the roof ridge, the cornice exerts a significant influence on the mean local pressure coefficients of the end section, while its impact on the values of the inner zone is relatively less pronounced. At the end section, the mean pressure coefficients on the upper and lower surfaces transition from negative values to values near zero, while the magnitude at the leading edge on the lower surface is reduced by approximately 85% when the cornice length reaches 0.8 m. Cornices effectively reduce the fluctuation of wind pressure, particularly at the leading-edge taps and even more so at the leading corner taps. The minimum peak pressure coefficients on both the upper and lower surfaces exhibit a gradual reduction as the length of the cornices increases, particularly for the values observed on the end section of the lower surface. However, the impact of cornices on the minimum peak net pressure coefficients is not evident. In contrast to the negative peaks, the maximum peak pressure coefficients on both the upper and lower surfaces of the end section exhibit an increasing trend until the cornice length reaches 0.8 m. Subsequently, the maximum peak coefficients stabilize and cease to increase further as the cornice length continues to increase.
Regarding the most unfavorable peak net pressure coefficients, the negative peaks decrease in proximity to the roof eave while they increase across the inner zone as the cornice height is increased from 0 m to 1.6 m. With cornices of varying lengths, the most unfavorable minimum peaks near the roof eave range from approximately −0.8 to −1.0. These values represent a decrease of about 38% to 50% compared to the minimum peak value observed without a cornice (i.e., with a cornice length of 0 m). The most unfavorable maximum peak reaches 1.6 when the cornice length increases to 0.8 m, which is significantly larger than the value of 1.0 observed without a cornice.
In terms of the most unfavorable area-averaged peak net pressure coefficients, the minimum peaks in the middle and trailing zones exhibit a gradual increase with the growing cornice length. This effect is particularly noticeable in the center zone of the module, where the minimum peak coefficient rises from −0.78 to −1.15 as the cornice length increases from 0 m to 1.6 m. The associated most unfavorable winds are oblique winds for the minimum peaks, primarily ranging from 105° to 135°. Due to the potential failure of solar modules caused by the high suction forces induced by wind, it is crucial to exercise greater caution when installing solar modules on roofs with larger cornices.

Author Contributions

Conceptualization, Z.T., J.Y., X.Z. and D.W.; methodology, G.S. and S.Y.; investigation, Z.T. and J.Y.; writing—original draft preparation, Z.T. and J.Y.; writing—review and editing, G.S. All authors have read and agreed to the published version of the manuscript.

Funding

This research was funded by the Zhejiang Provincial Natural Science Foundation of China (No. LTGS23E080003, LGG22E080018).

Institutional Review Board Statement

Not applicable.

Informed Consent Statement

Not applicable.

Data Availability Statement

Not applicable.

Acknowledgments

The authors greatly appreciate the support from the Zhejiang Provincial Natural Science Foundation of China under Grant No. LTGS23E080003 and LGG22E080018. The authors would also like to appreciate the strong support of the “Nanxun Young Scholars” project. The opinions and statements do not necessarily represent those of the sponsors.

Conflicts of Interest

The authors declare no conflict of interest.

References

  1. Jubayer, C.M.; Hangan, H. A numerical approach to the investigation of wind loading on an array of ground mounted solar photovoltaic (PV) panels. J. Wind Eng. Ind. Aerodyn. 2016, 153, 60–70. [Google Scholar] [CrossRef]
  2. Zhao, X.G.; Xie, Y.M. The economic performance of industrial and commercial rooftop photovoltaic in China. Energy 2019, 187, 115961. [Google Scholar]
  3. Wood, G.S.; Denoon, R.O.; Kwok, K.C.S. Wind loads on industrial solar panel arrays and supporting roof structure. Wind. Struct. 2001, 4, 481–494. [Google Scholar] [CrossRef]
  4. Shademan, M.; Hangan, H. Wind loading on solar panels at different inclination angles. In Proceedings of the 11th American Conference on Wind Engineering, American Association of Wind Engineering, Fort Collins, CO, USA, 22–26 June 2009. [Google Scholar]
  5. Dai, S.F.; Liu, H.J.; Yang, J.H.; Peng, H.Y. Wind loads on roof-mounted isolated solar panels of tall buildings through wind tunnel testing. Solar Energy 2022, 231, 607–622. [Google Scholar] [CrossRef]
  6. Aly, A.M.; Bitsuamlak, G. Wind-Induced Pressures on Solar Panels Mounted on Residential Homes. J. Archit. Eng. 2014, 20, 04013003. [Google Scholar] [CrossRef]
  7. Kopp, G.A.; Farquhar, S.; Morrison, M.J. Aerodynamic mechanisms for wind loads on tilted, roof-mounted, solar arrays. J. Wind. Eng. Ind. Aerodyn. 2012, 111, 40–52. [Google Scholar] [CrossRef]
  8. Pratt, R.N.; Kopp, G.A. Velocity measurements around low-profile, tilted, solar arrays mounted on large flat-roofs, for wall normal wind directions. J. Wind. Eng. Ind. Aerodyn. 2013, 123, 226–238. [Google Scholar] [CrossRef]
  9. Alrawashdeh, H.; Stathopoulos, T. Wind loads on solar panels mounted on flat roofs: Effect of geometric scale. J. Wind. Eng. Ind. Aerodyn. 2020, 206, 104339. [Google Scholar] [CrossRef]
  10. Kopp, G.A.; Banks, D. Use of the Wind Tunnel Test Method for Obtaining Design Wind Loads on Roof-Mounted Solar Arrays. J. Struct. Eng. 2013, 139, 284–287. [Google Scholar] [CrossRef]
  11. Stenabaugh, S.E.; Iida, Y.; Kopp, G.A.; Karava, P. Wind loads on photovoltaic arrays mounted parallel to sloped roofs on low-rise buildings. J. Wind. Eng. Ind. Aerodyn. 2015, 139, 16–26. [Google Scholar] [CrossRef]
  12. Naeiji, A.; Raji, F.; Zisis, I. Wind loads on residential scale rooftop photovoltaic panels. J. Wind. Eng. Ind. Aerodyn. 2017, 168, 228–246. [Google Scholar] [CrossRef]
  13. Geurts, C.; Blackmore, P. Wind loads on stand-off photovoltaic systems on pitched roofs. J. Wind. Eng. Ind. Aerodyn. 2013, 123, 239–249. [Google Scholar] [CrossRef]
  14. Wang, J.; Phuc, P.V.; Yang, Q.; Tamura, Y. LES study of wind pressure and flow characteristics of flat-roof-mounted solar arrays. J. Wind. Eng. Ind. Aerodyn. 2020, 198, 104096. [Google Scholar] [CrossRef]
  15. Pfahl, A.; Uhlemann, H. Wind loads on heliostats and photovoltaic trackers at various Reynolds numbers. J. Wind. Eng. Ind. Aerodyn. 2011, 99, 964–968. [Google Scholar] [CrossRef]
  16. Wang, J.; Yang, Q.; Hui, Y. Comparisons of design wind pressures on roof-mounted solar arrays between wind tunnel tests and codes and standards. Adv. Struct. Eng. 2021, 24, 653–666. [Google Scholar] [CrossRef]
  17. ASCE-7-16; Minimum Design Loads for Buildings and Other Structures. American Society of Civil Engineers: Reston, VA, USA, 2016.
  18. JIS C 8955-2017; Design Guide on Structures for Photovoltaic Array. Japanese Industrial Standard: Tokyo, Japan, 2017.
  19. NB/T 10115-2018; Code for Design of Photovoltaic Modules Support Structures. China Jihua Press: Beijing, China, 2018.
  20. ASCE 7-22; Minimum Design Loads for Buildings and Other Structures. American Society of Civil Engineers: Reston, VA, USA, 2022.
  21. GB 50009-2012; Load Code for the Design of Building Structures. China Architecture and Building Press: Beijing, China, 2012.
  22. Cook, N.J.; Mayne, J.R. A novel working approach to the assessment of wind loads for equivalent static design. J. Wind. Eng. Ind. Aerodyn. 1979, 4, 149–164. [Google Scholar] [CrossRef]
  23. Lieblein, J. Efficient Methods of Extreme Value Methodology; UK Department of Commerce, Report 74-602; National Bureau of Standards: Gaithersburg, MD, USA, 1974.
Figure 1. Wind field of an open country terrain.
Sustainability 15 13805 g001
Figure 2. Schematic diagram of experimental model.
Sustainability 15 13805 g002
Figure 3. Photographs of experimental models with cornices length c = 0 m, 0.4 m, 0.8 m, 1.2 m, 1.6 m, and upstream terrain.
Sustainability 15 13805 g003
Figure 4. External (upper surface) pressure coefficients of solar modules on gable roofs without cornices at θ = (a) 0°, (b) 45°, (c) 90°.
Sustainability 15 13805 g004
Figure 5. Cavity (lower surface) pressure coefficients of solar modules on gable roofs without cornices at θ = (a) 0°, (b) 45°, (c) 90°.
Sustainability 15 13805 g005
Figure 6. Net pressure coefficients of solar modules on gable roofs without cornices at θ = (a) 0°, (b) 45°, (c) 90°.
Sustainability 15 13805 g006
Figure 7. Schematic of a typical cross-section of a solar module.
Sustainability 15 13805 g007
Figure 8. Mean pressure coefficients along cross Sections 1~3 of solar modules on gable roofs with cornices.
Sustainability 15 13805 g008
Figure 9. STD pressure coefficients along cross Sections 1~3 of solar modules on gable roofs with cornices.
Sustainability 15 13805 g009
Figure 10. Minimum peak pressure coefficients along cross Sections 1~3 of solar modules on gable roofs with cornices.
Sustainability 15 13805 g010
Figure 11. Maximum peak pressure coefficients along cross Sections 1~3 of solar modules on gable roofs with cornices.
Sustainability 15 13805 g011
Figure 12. Most unfavorable minimum peak net pressure coefficients of solar modules on gable roofs with cornices.
Sustainability 15 13805 g012
Figure 13. Most unfavorable maximum peak net pressure coefficients of solar module on gable roof with cornices.
Sustainability 15 13805 g013
Figure 14. Division of the solar module.
Sustainability 15 13805 g014
Figure 15. The most unfavorable area-averaged peak net pressure coefficients on solar modules and associated wind directions with various clearances.
Sustainability 15 13805 g015
Disclaimer/Publisher’s Note: The statements, opinions and data contained in all publications are solely those of the individual author(s) and contributor(s) and not of MDPI and/or the editor(s). MDPI and/or the editor(s) disclaim responsibility for any injury to people or property resulting from any ideas, methods, instructions or products referred to in the content.

