Article

Impact of Revenue Generated via Composting and Recycling of Wastes Produced in the Greenhouse Tomato Supply Chain on Reducing Income Inequality: A Case Study of Türkiye

Department of Agricultural Economics, Faculty of Agriculture, Ondokuz Mayis University, Samsun 55139, Turkey
Sustainability 2023, 15(18), 13801; https://doi.org/10.3390/su151813801
Submission received: 21 August 2023 / Revised: 12 September 2023 / Accepted: 14 September 2023 / Published: 15 September 2023

Abstract

:
Investigating the potential impacts of composting and recycling wastes on income distribution is crucial to promote a fairer and more sustainable fresh tomato supply chain (FTSC). Therefore, this study aims to explore the potential of generating extra income from recycling of tomatoes waste generated along the FTSC, and to analyze the impact of that extra income on reducing income inequality among the FTSC actors. Data were collected from 136 greenhouse tomato producers, 60 wholesalers, 18 exporters, 120 domestic retailers, 22 overseas retailers, and 3 recycling facilities in Türkiye. Marketing cost, absolute marketing margin, relative marketing margin and net profit margin were used to economically analyze the FTSCs. Research results showed that the net profit share of the producers decreased with the increasing number of intermediaries. Additionally, revenue generated from composting and recycling of product loss and wastes increased the welfare of greenhouse producers more than the other supply chain actors. When taking into account the revenue generated from composting and recycling of wastes, the net profit of the producers increased by 9.85% at first FTSC, while it increased by 8.29% and 9.21% in the second and third FTSCs, respectively, compared to the prevailing conditions. The retailers were benefitted more from the extra revenue generated via composting and recycling of wastes compared to the wholesalers and exporters. However, the income gain of the domestic retailers and wholesalers from recycling was more when compared to the overseas ones. Close cooperation between producers, wholesalers, exporters, retailers, and recycling facilities is essential for the effective implementation of waste recycling initiatives. Organizing training and education programs focused on waste management can increase the extra income that producers and active intermediaries in FTSCs can generate from composting and recycling of tomato wastes. Offering financial incentives, grants, or subsidies can encourage producers and other actors within the supply chain to adopt waste recycling practices. Continuous research and innovation are crucial in identifying and developing new technologies, processes, and strategies to minimize food loss and waste. Introducing fair-trade practices may help to balance the income distribution among FTSC actors.

1. Introduction

The fresh tomato supply chain (FTSC) is a network of complex activities involving producers, wholesalers, exporters, and retailers. Resilience against fluctuations in market variables such as price, cost, etc., and climate change shapes the efficiency of the supply chain. Sustainability and efficiency of FTSC are highly related with the quality of relationship and income distribution among the supply chain actors [1,2]. Unfortunately, income distribution among the supply chain actors have been mostly unfair. Particularly, producers receive a smaller share of the profits generated along the supply chain compared to others [3,4,5,6]. This inequality leads to a decrease in the producer’s net profit and marketing efficiency [7,8]. On the other hand, inefficiencies arising in FTSCs lead to wastage of natural and economic resources, and create food waste (FW) along the supply chains, resulting in negative economic, environmental and social impacts.
The imbalance in income distribution may result in reduced incentives for producers to invest in their farms or to improve production processes, ultimately leading to a less sustainable supply chain [9]. Recently, efforts have been undertaken to address this issue and increase the power of producers, with one such approach being generating income via recycling of wastes. Recycling of wastes can provide an additional source of revenue for actors and enhance their bargaining power. The income disparity among actors in the food supply chain can be addressed by generating income from recycling food loss (FL) and FW.
FL and FW cause significant economic losses for actors involved in the food production and supply chains, particularly in the vegetable supply chain. FL occur before the food reaches the consumers, while FW is a more complex issue related to retail, the food service sector, and consumers [10]. The agricultural food supply chain experiences the highest loss rate in the first link, which is agricultural production. The FL in other nodes is relatively lower as compared to agricultural production. Therefore, the opportunity of generating extra income from FL and FW recycling for producers is more than that of wholesalers and retailers.
The FL rate for perishable products, such as tomatoes, is relatively high due to various reasons, including incorrect handling during loading and unloading, poor product storage conditions, unsuitable storage conditions, lack of a clean and sterile environment, insufficient ventilation and cooling systems, lack of pre-cooling after loading, and errors in packaging and sizing of tomatoes [11,12]. And also, the geographical distance between the tomato production and consumption sales points, as well as the limited accessibility of remote locations, have been considered as significant factors contributing to FL and FW [13,14]. For this reason, imbalanced income distribution among actors in the tomato supply chain is quite high [3,4,5,6]. FL generated along the supply chain due to spoilage of fresh products and FW have been important factors in engendering price fluctuations and income inequality [7,15,16,17,18,19,20,21,22,23,24,25,26,27,28].
Over the years, several studies have been conducted to determine the reasons for post-harvest losses of tomatoes, understand the relationships among actors in the supply chain, and explore the scope of reducing FL and increasing profits [5,29]. These studies have revealed that nearly half of the tomatoes produced are spoiled before consumption, and factors such as inadequate raw materials, reliability of logistics networks, technological capabilities, coordination among actors, economic and environmental factors, policies, and market fluctuations affect the performance of the supply chain and lead to losses [30,31]. Therefore, this study focused on the prospect of generating extra income from recycling of fresh tomatoes waste to balance the income distribution among the FTSC actors. Tomatoes are among the most widely consumed vegetables globally, with a significant proportion of the global supply chain being located in developing countries. Türkiye is the world’s third largest tomato producer, with an annual production of approximately 13 million tons [10]. The consumption of tomatoes in Türkiye is primarily in the form of fresh produce or processed goods, such as tomato paste, and dried or canned products [32]. Moreover, Türkiye’s tomato exports amount to roughly 519 thousand tons, while approximately 226 thousand tons of tomatoes are processed domestically [33,34]. Türkiye is selected as a research area as it is a major tomato-producing region, which makes it a good example to reveal the crucial role of income generated via recycling of fresh tomatoes wastes in reducing inequalities among the tomato supply chain actors.
Previous studies have examined FL and FW along the supply chain [30,35,36,37,38]. However, the impact of the economic benefits resulting from recycling on income distribution is yet to be explored. Since FTSC can become more sustainable, efficient, and equitable via generating income from recycling of FW, this study seeks to explore the potential of recycling FW generated along FTSC to reduce income inequality and benefit producers. Specifically, this study examines the link between extra income generated from recycling of wastes and income inequality along the FTSC, with a particular focus on the impact on producers income. The hypothesis of the research is that that recycling of tomatoes wastes generated along the FTSC can serve as an alternative income source for producers, thereby reducing income inequality and contributing to a more sustainable supply chain. By drawing on empirical and theoretical evidence from similar contexts, the hypothesis of this study posits that recycling of tomato wastes generated within the FTSC can create alternative income sources for producers, mitigate income inequality and foster sustainability, accompanied by resource optimization, income diversification, local job creation, and cost reduction. Overall, the aims of this study were to explore the potential of generating extra income from recycling of tomatoes wastes produced along the FTSC, and to calculate the contribution of this extra in reducing income inequality among the FTSC actors.

2. Materials and Methods

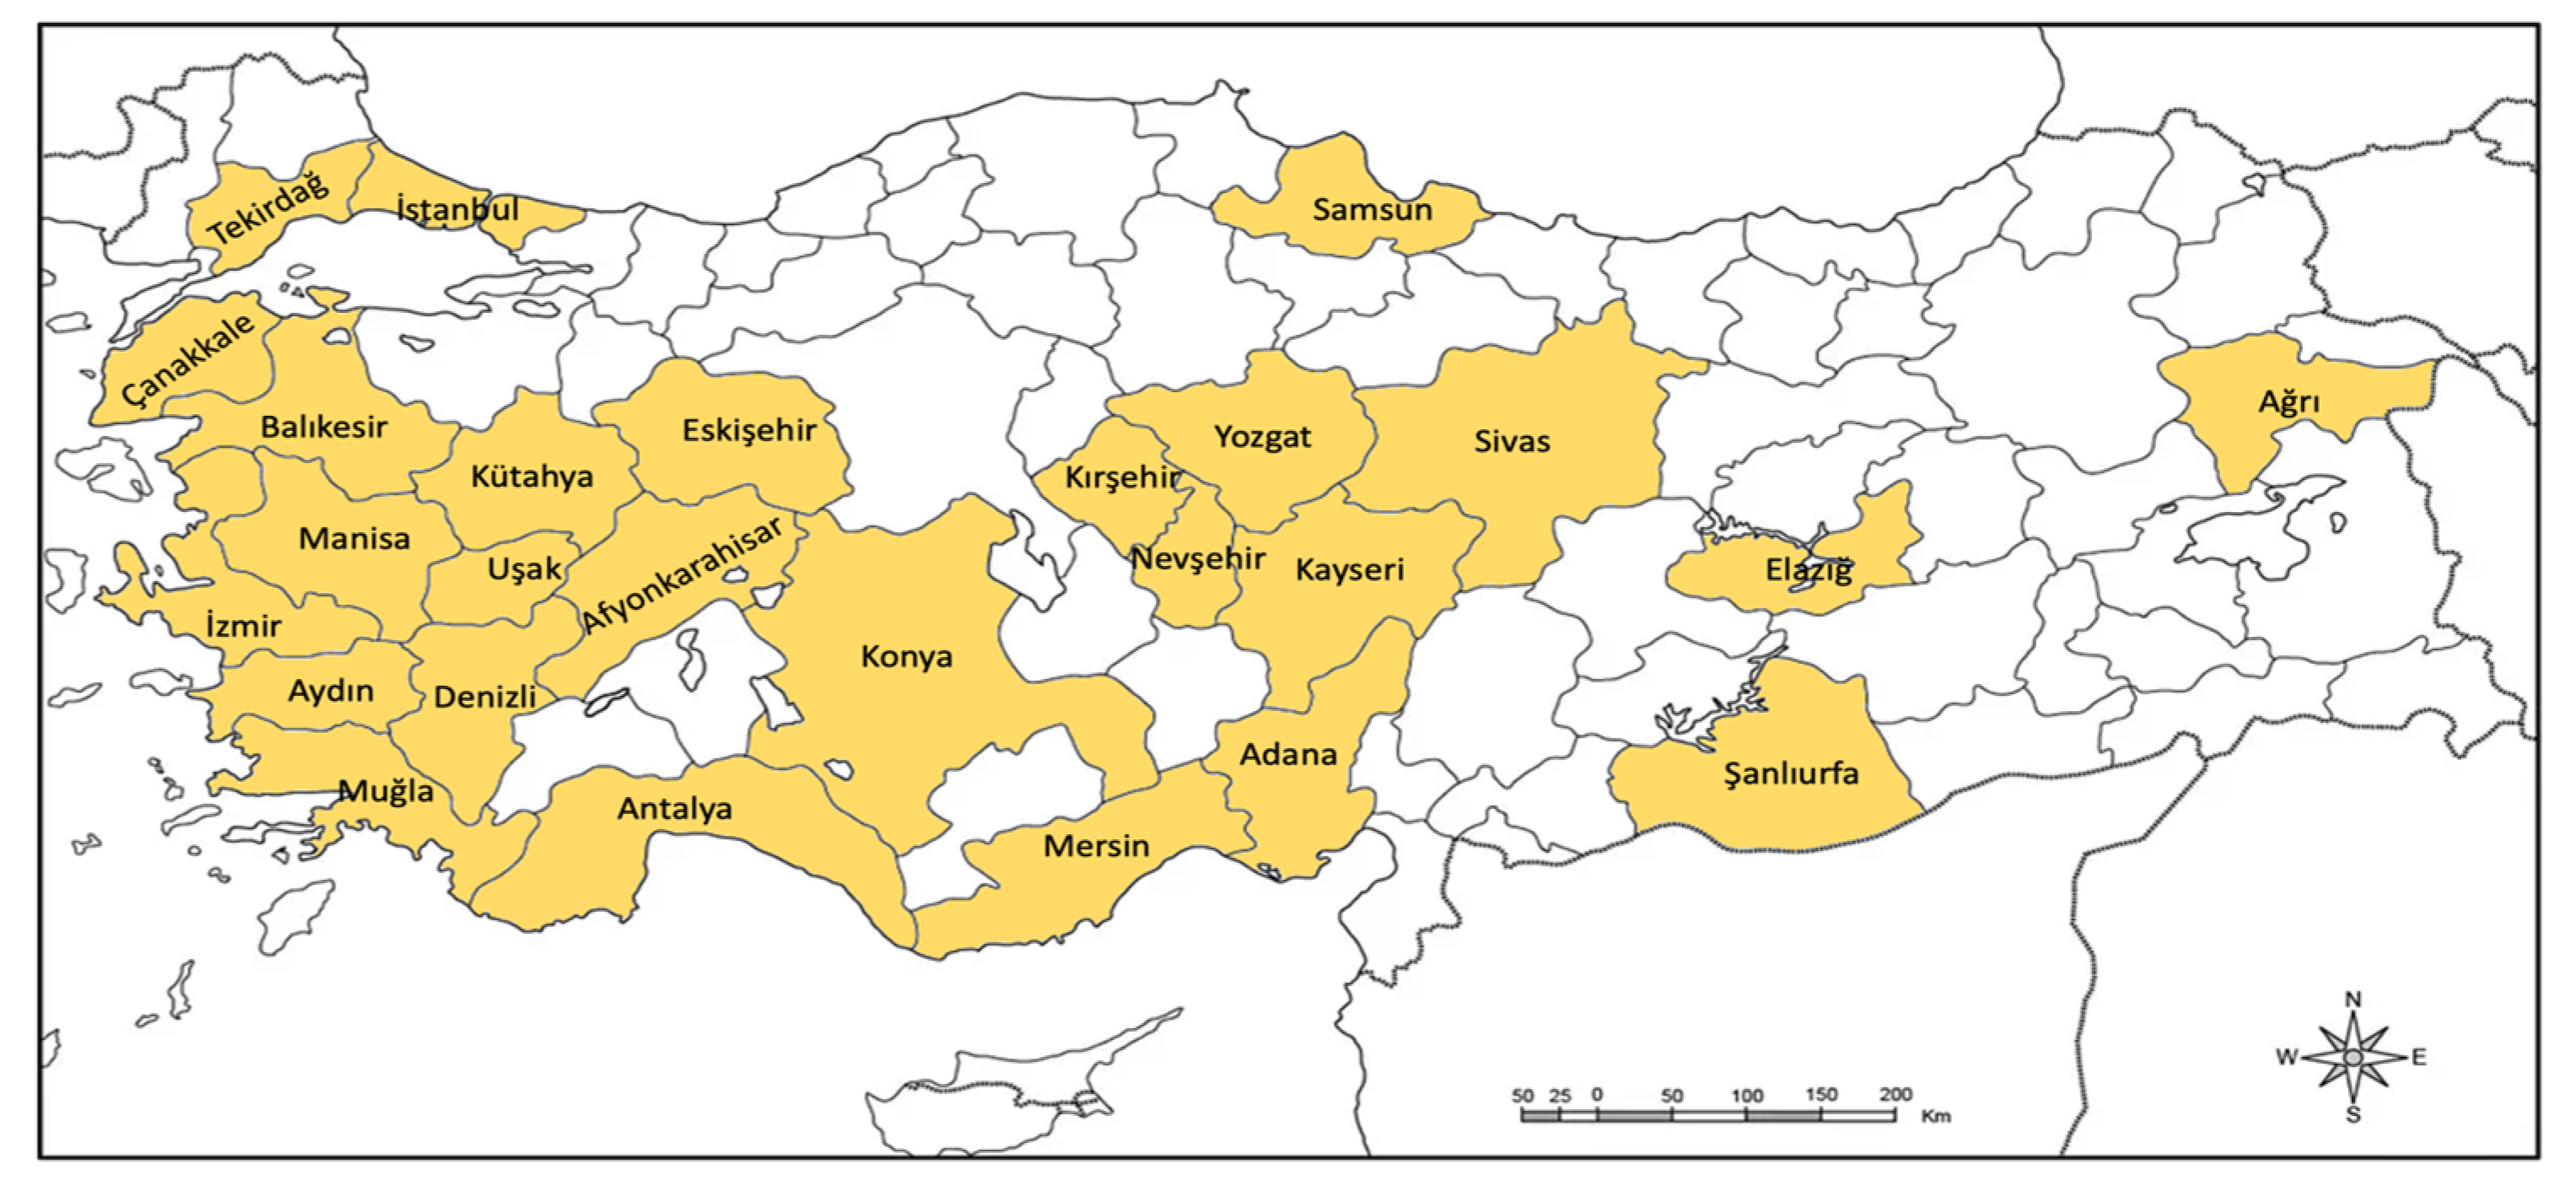
2.1. Study Area and Data Collection

In Türkiye, tomatoes are cultivated both in open field and under greenhouse conditions. However, this study focused only on the greenhouse producers who utilize soilless agriculture technology for cultivating tomatoes; it also focused on the wholesalers, exporters and retailers involved in Turkish FTSC. Fresh tomatoes cultivated under greenhouse conditions with soilless farming technology in Türkiye are distributed to end-consumers via three distinct supply chains. The flow of these supply chains are depicted in Figure 1.
The first FTSC involves a progression from the producers to the wholesalers, followed by an exporter company and retailers to supply the fresh tomatoes to overseas consumers. The second FTSC involves producers, wholesalers and retailers (greengrocers, supermarkets, and local markets) who supply the products to the end-consumers. The third FTSC is a shorter one compared to the other two supply chains. Fresh tomatoes are transported from the greenhouse producers to the consumers by retailers (greengrocers, supermarkets, and local markets). Around 60.65% of the Turkish greenhouse tomato producers followed the first FTSC, while 23.64% and 15.71% followed the second and third FTSCs, respectively.
Greenhouse tomato production with soilless agriculture technology is carried out in 26 different provinces of Türkiye, and this study included all the active tomato producers. The province with the highest greenhouse tomato production using soilless agriculture technology is Antalya, which constitutes 22.8% of the total Turkish tomato production, followed by the provinces of Afyonkarahisar and Şanlıurfa with 20.6% and 9.6%, respectively (Figure 2).
The tomatoes produced under greenhouse conditions are supplied to both domestic and overseas market. Consumers living in Antalya, Bursa, and Istanbul have the highest share in domestic tomato consumption. Russia and Ukraine are the top importers of Turkish tomatoes [10].
The producer-level research data were collected from 136 producers during the production period of 2021–2022 using well-structured questionnaires. Questionnaires covered questions for measuring the variables of production quantity, associated costs (such as those related to fertilizers, pesticides, heating, growing medium, irrigation, electricity, seeds, seedlings, etc.), waste varieties, and amounts.
Due to difficulties in determining the exact number and characteristics of intermediaries, a snowball sampling method was used to ensure that each link’s number of intermediaries equals the number of tomato producers. Snowball sampling has been preferred in previous studies on the tomato supply chain conducted by [39,40,41]. Using the snowball sampling method, a total of 220 intermediaries were identified, and individuals were interviewed across various stages of the tomato supply chain. Selection bias was reduced by tracking down the intermediaries (wholesalers, exporters, and retailers) to whom the producers sold their fresh tomatoes. The data were collected via questionnaires from 60 wholesalers, 120 retailers who purchased from wholesalers, 18 exporters, and 22 overseas retailers in the examined FTSCs. These data were acquired through individual interviews with each actor included in the tomato supply chain, comprising information on tomato purchasing and selling prices, costs associated with various aspects of the supply chain (storage, labor, transportation, packaging, etc.), as well as the types and quantities of waste produced along the supply chain.
In addition, data obtained from 3 recycling facilities, which recycled tomatoes waste generated in the examined FTSCs, through semi structured individual interviews were used in the study.

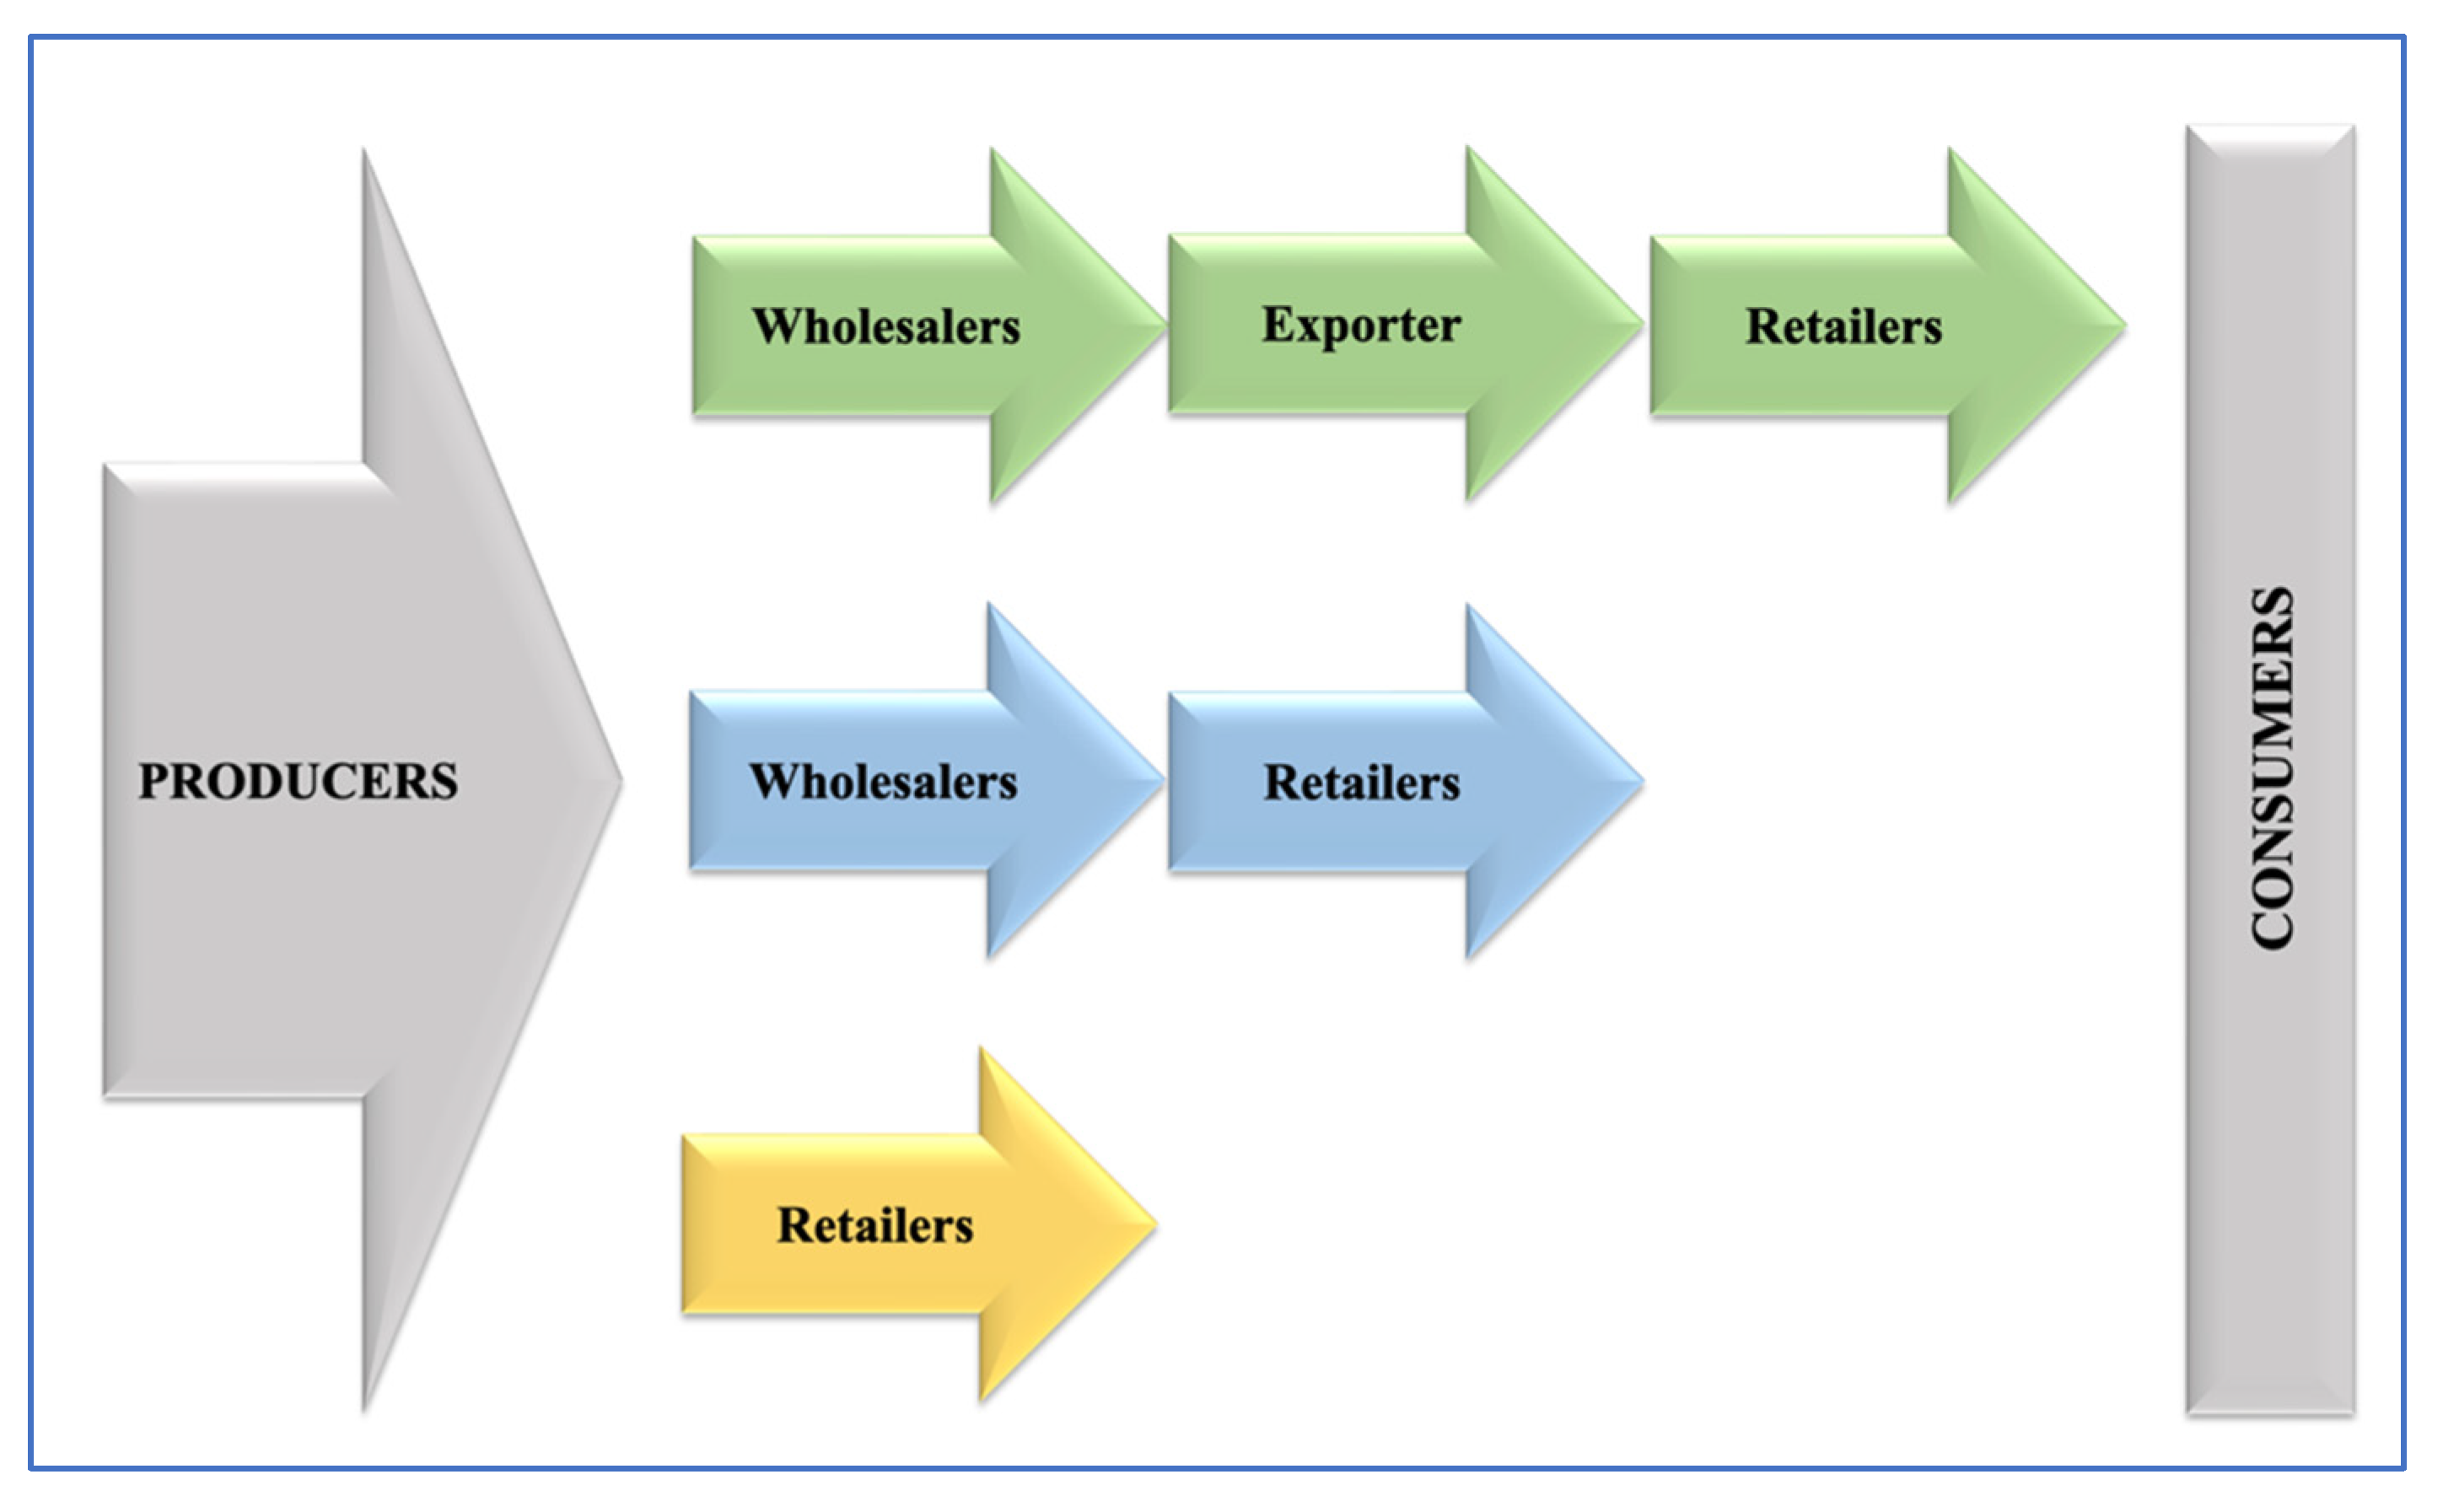
2.2. Assessing Income Distribution along the Tomato Supply Chain

Production expenses, revenue, net profit per kilogram of fresh tomato produced and sold, and value added generated along the tomato value chains were calculated for assessing revenue distribution. Value added was the difference between selling prices of tomatoes at relevant levels of the value chain, and it is attributed to absolute marketing margin. The net profit generated in each node of the FTSC was divided by its corresponding revenue when calculating the net profit margin. Net profit was the amount of revenue exceeding the sum of the variable and fixed expenses. Since all calculations is on a kilogram basis, tomato price equaled the revenue of intermediaries in each node of the tomato value chains. The variable cost of tomato production included the expenses of fertilizer, heating, growing media, irrigation, electricity, and other expenses. For wholesalers, exporters, and retailers, variable costs were packaging, transport, storing, labor, rent payment, promotion, and general administrative costs. The fixed costs of intermediaries were depreciation, repair–maintenance, rent payment, insurance, interest, and tax.
Share of intermediaries in total net profit and relative marketing margin was also calculated for exploring revenue distribution along the FTSCs. The value added of intermediaries was divided by the total value added generated along the tomato value chain to calculate the relative marketing margin. Similarly, the net profit of intermediaries was divided by the total net profit of tomato value chains to calculate the share of intermediaries in net profit.

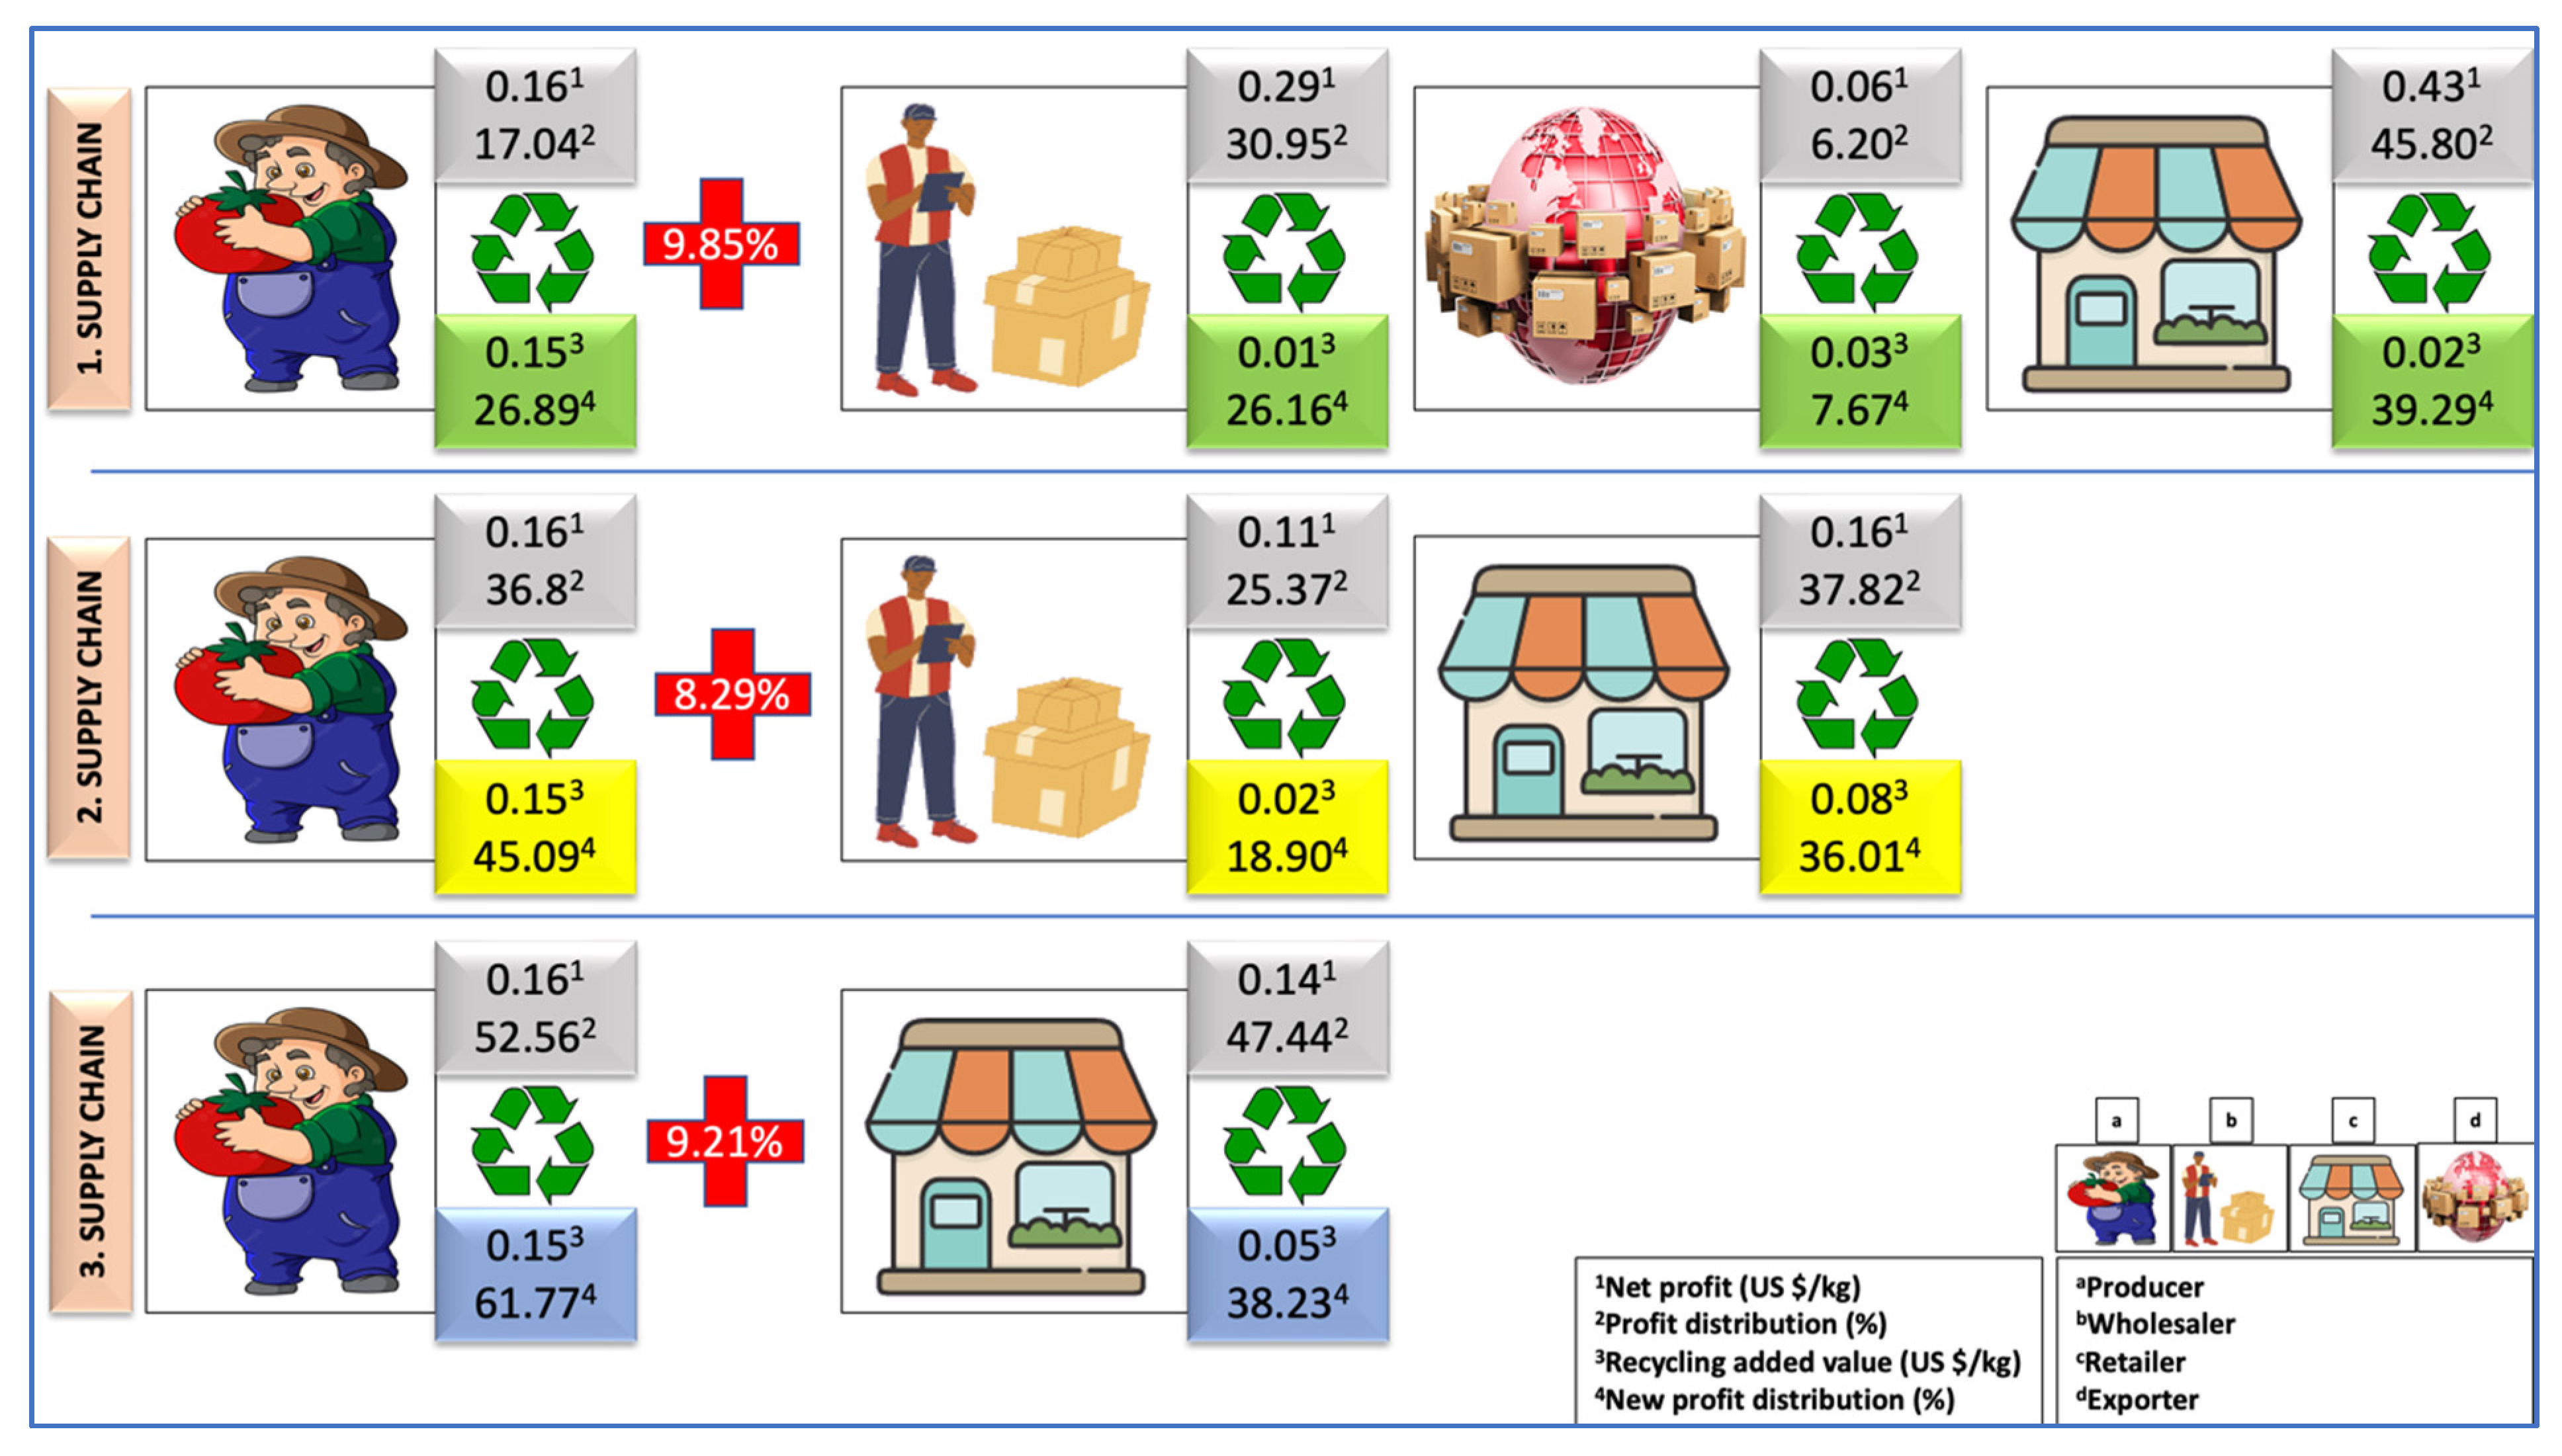
2.3. Exploring the Effect of Revenue Generated from Recycling of Tomato Waste on Income Distribution

Revenue generated from recycling tomato waste along the tomato supply chain and current income distribution among supply chain actors were used to explore the effect of extra revenue generated from recycling of tomato waste on income distribution. When calculating the revenue generated from waste recycling, the amount of waste generated at each node of the tomato supply chains was determined first based on the responses of intermediaries. At the producer level, tomato waste was identified and classified into two different groups: agricultural wastes and other wastes. Agricultural wastes included wastes of plant, product, growing media and drainage. Viol, plastic cases, boxes, greenhouse glass, greenhouse plastic covers and ropes constituted other wastes. Product waste, pallet waste and box/cardboard waste were the waste generated at the wholesaler, importer and retailer levels, respectively. Next, the revenue generated from recycling of each type of waste was calculated based on data from the recycling facilities.
Producing compost from organic plant and product waste was used as a recycling method at the producer level based on the findings of [42]. Ref. [42] stated that composting, producing animal feed, and producing soil conditioners were the alternative recycling methods for organic tomatoes waste, and composting organic tomato waste was economically more feasible as compared to other recycling alternatives. Based on the data obtained from recycling facilities, the economic revenue of organic plants and product wastes per kilogram were USD 0.20 and USD 0.16, respectively. Compost price was USD 0.2916 per kilogram when the income generated from recycling tomatoes waste was calculated in this study. The compost prices in Türkiye were relatively higher compared to other parts of the world: USD 0.085 in Indonesia, USD 0.093 in Taiwan, USD 0.25 in Malaysia, USD 0.18 in Sri Lanka, and USD 0.126 in China [43,44,45].
In general, growing media wastes can be reused in landscaping work worldwide [46,47,48], and they are used for that very purpose in Türkiye as well. Therefore, in this study, we estimated the economic revenue generated from reusing growing media wastes in landscaping works to be USD 0.08. Drainage waste is also one of the important wastes generated in tomato production under greenhouse conditions with soilless agriculture [49]. In this study, the revenue generated from recycling drainage wastes was estimated to be USD 0.36 per kilogram of drainage waste. The revenues obtained from recycling of per kilogram wastes of viol, plastic case, box, pesticide box, greenhouse glass, plastic cover and rope were USD 0.24, USD 0.37, USD 0.26, USD 0.26, USD 0.14, USD 0.47 and USD 0.5, respectively, while that of cardboard and pallet wastes were USD 0.11 and USD 0.14, respectively. The total revenue of tomato wastes was calculated by multiplying the amounts of tomato wastes with the corresponding prices.
The difference between current income distribution and income distribution after adding the revenue generated from recycling of tomatoes wastes was attributed to the effect of revenue generated from recycling of tomato wastes.

3. Research Findings and Discussion

Research results showed that the land size of tomato farms was 5.45 hectares, and total tomatoes production was 2376 tons per year. The production cost per-kilogram of tomatoes was US 0.66, and variable expenses constituted 72% of the total unit production cost. The share of fertilizer, heating, growing media, and irrigation and electricity expenses in total variable cost of tomato production were 17%, 21%, 9% and 11%, respectively, while the rest was other expenses. Depreciation cost had the largest share in fixed cost of tomato production, with 74%.
In the first FTSC, the farm gate price of tomato was US 0.81/kg, and the consumer price per 1 kg of tomato was US 3.77. The absolute marketing margin between producers and consumers was US 2.96/kg, and between producers and wholesalers was US 0.96/kg; it was US 0.62/kg between wholesalers and exporters, and US 1.37/kg between exporters and retailers. The retailers had the highest relative marketing margin among the fresh tomato supply chain actors, while the exporters had the lowest margin. The tomato producers received around 22% of the consumer’s payment for one kilogram of tomato. Regarding the marketing expenses, it was clear that retailers had the higher marketing expenses along the fresh tomato supply chain. Wholesalers spent US 0.67 for transferring one kilogram of tomatoes to the exporters. The share of expenses of transport and boxes/cardboards were 18% and 66%, respectively. The cost of transporting one kilogram of tomatoes from exporters to retailers was US 0.50, while the cost of other things was US 0.07. The total expenses at the retailer level were US 0.94 per kilogram, and 77% of it was packaging expenses. Based on the net profit margin (NPM) of the income distribution among the FTSC actors, it was clear that retailers had the highest net profit, followed by wholesalers, producers and exporters (Table 1).
In the second FTSC, the farm gate price of tomato was US 0.81/kg, and the consumer price per 1 kg of tomato was US 1.56. The absolute marketing margin between producers and consumers was US 0.75/kg, between producers and wholesalers was US 0.35/kg, and between wholesalers and retailers was US 0.40/kg. Producers in the second FTSC had higher marketing expenses. Wholesalers spent US 0.24 for transferring one kilogram of tomatoes to exporters. The share of expenses of transport, pallets and boxes/cardboards were 54%, 17% and 13%, respectively. Depending on the type of retailers, the share of expenses differed; the expenses of greengrocer, supermarket and local market retailers were US 0.20, US 0.23 and US 0.31, respectively. Producers had the highest NPM, followed by retailers and wholesalers (Table 1).
In the third FTSC, the absolute marketing margin was US 0.72/kg and the consumer price of tomato was US 1.53/kg. The relative marketing margin of the producers was higher than that of retailers. Retailers in the third FTSC spent US 0.57 for transferring one kilogram of tomatoes to consumers. The share of transport expenses in total unit cost was 91%. The net profit of producers was US 0.16/kg, and that of retailers was US 0.14/kg (Table 2). Since the total net income of FTSC actors is highly dependent on both the quantities sold and the net profit of actors at each FTSC level, it is vital to consider the quantities sold by FTSC actors to accurately determine income distributions. Upon considering the quantities sold by actors, it was clear that the first FTSC generated a total net income of around USD 3 million, while the income generation of the second and third ones were USD 218 and 563 thousand. The rank of the producers at first, second and third FTSCs were 4, 2, and 3, respectively. The share of the producers in the total net income of each FTSC increased from the longest to the shortest FTSC. Producers and wholesalers had more total net income at overseas FTSCs than domestic ones. However, the total net income of retailers in the third FTSC was higher than that of the overseas ones (Table 2).
Based on the research results, it was clear that producers had the highest net profit margin in all FTSCs. This finding confirmed the results of previous studies conducted by [50,51,52]. In contrast, some previous studies reported that net profit margin of the producers was the lowest [53,54]. The net profit share of the producers decreased with the increasing number of intermediaries. The net profit share of producers exceeded that of the retailers in the third FTSC. This research finding corroborated the results of [52,55,56,57].
Annually, 1802 tons of tomato wastes were produced per 323,125.64 tons of total fresh tomato production in the 5.45 hectares of greenhouse farm lands. Extra revenue generated from composting plant waste, reusing drainage, growing media waste and recycling other wastes were USD 315 per greenhouse farm and USD 57.8 per hectare. Agricultural waste constituted 93.3% of the revenue generated from tomato wastes, while revenue generated from other wastes was 6.7%. The shares of plant waste in the amount of total tomato production waste and extra revenue were 84.37% and 96.23%, respectively, followed by growing media waste and drainage waste. Among other waste types, the most significant contributors to revenue are viol, with 45.7%, and greenhouse glass, with 23.7% (Table 3).
The amount of waste generated at all FTSC stages and their economic values are depicted in Table 4. The findings revealed that at all FTSCs, the largest product loss and pallet waste occurred at the exporter level, followed by the retailer level. However, box and cardboard wastes predominantly occurred at the retailer level, followed by exporter and wholesaler levels. The retailers generated the highest extra revenue from recycling box/cardboard waste at all FTSCs, whereas exporters generated the highest extra revenue from recycling product loss and pallet waste (Table 4).
Research results revealed that revenue gained from composting, reusing and recycling of loss and waste increased the welfare of producers growing tomatoes under greenhouse conditions more than the other supply chain actors. Particularly, at second FTSC, the producers ranked first in terms of welfare promotion. At first FTSC, the producers ranked above the wholesalers. When the revenue generated from composting and recycling of waste is taken into account, it can be seen that the producers increased their net profit by 9.85% at first FTSC, followed by 8.29% and 9.21%, respectively, at second and third FSTCs, as compared to the prevailing conditions. The retailers were benefitted more from the extra revenue generated via composting and recycling of wastes as compared to the wholesalers and exporters. Additionally, the income generated by the retailers and wholesalers from recycling in domestic FTSCs was more when compared to the overseas one (Figure 3).

4. Conclusions

This study aimed to highlight how extra income generated from composting and recycling tomato wastes impacted the income distribution of all FTSC actors. The results showed that composting, reusing and recycling of loss and waste increased the welfare of producers who grew tomatoes under greenhouse conditions more than the other supply chain actors. In addition, the share of the producers in total net income at each FTSC increased from the longest FTSC to shortest one. Research findings also showed that extra income generated from composting and recycling of wastes had a more positive impact on domestic FTSCs when compared to that of overseas FTSCs. Therefore, the results confirmed that composting and recycling of tomato wastes can serve as an alternative income source for producers, helping to reduce income inequality and contribute to a more sustainable supply chain.
Close cooperation between producers, wholesalers, exporters, retailers, and recycling facilities is essential for the effective implementation of waste recycling initiatives. This collaboration can also lead to the development of innovative solutions and best practices for reducing food loss and waste along the FTSC. Organizing training and education programs focused on waste management, as well as increasing the efficiency of communication across all FTSC actors, can also help the producers and active intermediaries to increase the income generated from composting and recycling of tomato wastes, and help to ensure an equal distribution of income. Additionally, offering financial incentives, grants, or subsidies, and facilitating access to appropriate investment sources, can encourage producers and other actors within the supply chain to adopt waste recycling practices, thereby enhancing the revenue of each FTSC actors. Continuous research and innovations are crucial for identifying and developing new technologies, processes, and strategies to minimize food loss and waste. Introducing these changes will allow the tomato supply chain to achieve more equitable profit sharing, while also contributing to a more sustainable and ecologically conscientious future. On the other hand, implementation of fair-trade practices will help to ensure that income distribution is balanced among FTSC actors. Regulating competitive market conditions along the FTSC can also positively affect income distribution.
Future research in tomato value chain could extent the scope from fresh tomato to processed tomato when exploring the link between revenue generated from composting and recycling and income inequality along the FTSC. In addition, the effects of supply chain monitoring and technology adoption on income distribution among the fresh and processed tomato chain actors could be examined. By considering these factors, stakeholders could benefit from an in-depth understanding of the mechanisms of inequality in income distribution.

Funding

This research received no external funding.

Institutional Review Board Statement

Not applicable.

Informed Consent Statement

Not applicable.

Data Availability Statement

Not applicable.

Conflicts of Interest

The author declares no conflict of interest.

References

  1. Anastasiadis, F.; Apostolidou, I.; Michailidis, A. Mapping sustainable tomato supply chain in Greece: A framework for research. Foods 2020, 9, 539. [Google Scholar] [CrossRef] [PubMed]
  2. Sharma, M.; Shah, J.K.; Joshi, S. Modeling enablers of supply chain decarbonisation to achieve zero carbon emissions: An environment, social and governance (ESG) perspective. Environ. Sci. Pollut. Res. 2023, 30, 76718–76734. [Google Scholar] [CrossRef] [PubMed]
  3. Gautam, S.; Acedo, A.L.; Schreinemachers, P.; Subedi, B.P. Volume and value of postharvest losses: The case of tomatoes in Nepal. Br. Food J. 2017, 119, 2547–2558. [Google Scholar] [CrossRef]
  4. Secondi, L.; Principato, L.; Ruini, L.; Guidi, M. Reusing food waste in food manufacturing companies: The case of the tomato-sauce supply Chain. Sustainability 2019, 11, 2154. [Google Scholar] [CrossRef]
  5. Chaboud, G.; Moustier, P. The role of diverse distribution channels in reducing food loss and waste: The case of the Cali tomato supply chain in Colombia. Food Policy 2021, 98, 101881. [Google Scholar] [CrossRef]
  6. Mohan, A.; Krishnan, R.; Arshinder, K.; Vandore, J.; Ramanathan, U. Management of postharvest losses and wastages in the Indian tomato supply chain—A temperature-controlled storage perspective. Sustainability 2023, 15, 1331. [Google Scholar] [CrossRef]
  7. Imtiyaz, H.; Soni, P. Evaluation of marketing supply chain performance of fresh vegetables in Allahabad district, India. Int. J. Manag. Sci. Bus. Res. 2014, 3, 72–83. [Google Scholar]
  8. Traub, L.N.; Jayne, T. The effects of price deregulation on maize marketing margins in South Africa. Food Policy 2008, 33, 224–236. [Google Scholar] [CrossRef]
  9. Quintana, A.A.; Chong, M.; Cordova, M.L.; Camaro, P.J. The impact of logistics on marketing margin in the Philippine agricultural sector. J. Econ. Financ. Account. Stud. 2021, 3, 300–318. [Google Scholar] [CrossRef]
  10. FAO. FAOSTAT—FAO Database for Food and Agriculture; FAO FAOSTAT, from Food and agriculture Organisation of United Nations (FAO): Rome, Italy, 2021. [Google Scholar]
  11. Tatlıdil, F.F.; Dellal, İ.; Bayramoğlu, Z. Food Losses and Waste in Turkey; Food and Agriculture Organization of the United Nations Country Report; FAO: Rome, Italy, 2013. [Google Scholar]
  12. Karthick, K.; Boris Ajit, A.; Subramanaian, V.; Anbuudayasankar, S.P.; Narassima, M.S.; Hariharan, D. Maximising profit by waste reduction in postharvest Supply Chain of tomato. Br. Food J. 2023, 125, 626–644. [Google Scholar] [CrossRef]
  13. Kumar, S.; Underhill, S.; Kumar, S. Postharvest physical risk factors along the tomato supply chain: A case study in Fiji. In Proceedings of the Crawford Fund 2016 Annual Conference, Canberra, Australia, 29–30 August 2016; Volume 941, pp. 1867–2017. [Google Scholar]
  14. Mashau, M.E.; Moyane, J.N.; Jideani, I.A. Assessment of post-harvest losses of fruits at Tshakhuma fruit market in Limpopo Province, South Africa. Afr. J. Agric. Res. Acad. J. 2012, 7, 4145–4150. [Google Scholar]
  15. Anil, K.; Arora. Post-harvest management of vegetables in Uttar Pradesh hills. Indian J. Agric. Mark. 1999, 13, 6–14. [Google Scholar]
  16. Gupta, S.P.; Rathore, N.S. Disposal pattern and constraints in vegetable market: A case study of Raipur District of Madhya Pradesh. Agric. Mark. 1999, 42, 52–59. [Google Scholar]
  17. More, S.S. Economics of Production and Marketing of Banana in Maharashtra State. Master’s Thesis, University of Agricultural Science, Dharwad, India, 1999. [Google Scholar]
  18. Begum, A.; Raha, S.K. Marketing of Banana in selected areas of Bangladesh. Econ. Aff. Kolkata 2002, 47, 158–166. [Google Scholar]
  19. Sudha, M.; Gajanana, T.M.; Murthy, S.D.; Dakshinamoorthy, V. Marketing practices and post-harvest loss assessment of pineapple in Kerala. Indian J. Agric. Mark. 2002, 16, 56–65. [Google Scholar]
  20. Murthy, S.D.; Gajanana, T.M.; Sudha, M. Marketing practices and post-harvest loss estimated in Mango var. Baganpalli at different stages of marketing—A methodological perspective. Agric. Econ. Res. Rev. 2002, 15, 188–200. [Google Scholar]
  21. Singh, S.; Chauhan, S.K. Marketing of Vegetables in Himachal Pradesh. Agric. Mark. 2004, 44, 5–10. [Google Scholar]
  22. Bala, B. Marketing system of apple in hills problems and prospects (A case of Kullu district, Himachal Pradesh). Indian J. Agric. Mark. 2006, 8, 285–293. [Google Scholar]
  23. Murthy, D.S.; Gajanana, T.M.; Sudha, M.; Dakshinamoorthy. Marketing Losses and their impact on marketing margins: A case study of banana in Karnataka. Agric. Econ. Res. Rev. 2007, 20, 47–60. [Google Scholar]
  24. Adeoye, I.B.; Odeleye, O.M.O.; Babalola, S.O.; Afolayan, S.O. Economic Analysis of Tomato Losses in Ibadan Metropolis, Oyo State, Nigeria. Afr. J. Basic Appl. Sci. 2009, 1, 87–92. [Google Scholar]
  25. Rupali, P.; Gyan, P. Marketable Surplus and marketing efficiency of Vegetables in Indore District: A Micro Level Study. IUP J. Agric. Econ. 2010, 7, 84–93. [Google Scholar]
  26. Barakade, A.J.; Lokhande, T.N.; Todkari, G.U. Economics of onion cultivation and its marketing pattern in Satara district of Maharastra. Int. J. Agric. Sci. 2011, 3, 110–117. [Google Scholar]
  27. Chauhan, C. India Wastes More Farm Food than China: UN. Hindustan Times, 12 September 2013. [Google Scholar]
  28. Biswas, A.K.; Tortajada, C. India Must Tackle Food Waste. 2014. Available online: https://www.weforum.org/agenda/2014/08/india-perishable-food-waste-population-growth/ (accessed on 5 May 2021).
  29. Ghezavati, V.R.; Hooshyar, S.; Tavakkoli-Moghaddam, R. A Benders’ decomposition algorithm for optimizing distribution of perishable products considering postharvest biological behavior in agri-food supply chain: A case study of tomato. Cent. Eur. J. Oper. Res. 2017, 25, 29–54. [Google Scholar] [CrossRef]
  30. Handayati, Y.; Simatupang, T.M.; Perdana, T. Agri-food supply chain coordination: The state-of-the-art and recent developments. Logist. Res. 2015, 8, 1–15. [Google Scholar] [CrossRef]
  31. Emana, B.; Afari-Sefa, V.; Nenguwo, N.; Ayana, A.; Kebede, D.; Mohammed, H. Characterization of pre- and postharvest losses of tomato supply chain in Ethiopia. Agric. Food Secur. 2017, 6, 1–11. [Google Scholar] [CrossRef]
  32. Laroche, M.; Bergeron, J.; Barbaro-Forleo, G. Targeting consumers who are willing to pay more for environmentally friendly products. J. Consum. Mark. 2001, 18, 503–520. [Google Scholar] [CrossRef]
  33. TURKSTAT. 2022. Available online: http://www.tuik.gov.tr (accessed on 10 April 2023).
  34. Trade Map. 2023. Available online: trademap.org (accessed on 10 April 2023).
  35. Underhill, S.J.R.; Kumar, S. Quantifying postharvest losses along a commercial tomato supply chain in Fiji: A case study. J. Appl. Hortic. 2015, 17, 199–204. [Google Scholar] [CrossRef]
  36. McKenzie, T.J.; Singh-Peterson, L.; Underhill, S.J.R. Quantifying postharvest loss and the implication of market-based decisions: A case study of two commercial domestic tomato supply chains in Queensland, Australia. Horticulturae 2017, 3, 44. [Google Scholar] [CrossRef]
  37. Asrat, F.; Ayalew, A.; Degu, A. Food science and technology postharvest loss assessment of tomato (Solanum lycopersicum L.) in Fogera. Turk. J. Agric. 2019, 7, 1146–1155. [Google Scholar]
  38. Özdemir, I.S.; Semizer, H. Effect of good and poor postharvest handling practices on the losses in lettuce and tomato supply chains. Gida/J. Food 2021, 46, 859–871. [Google Scholar] [CrossRef]
  39. Mwagike, L. The Effect of social networks on performance of fresh tomato supply chain in Kilolo District, Tanzania. Int. J. Bus. Econ. Res. 2015, 4, 238–243. [Google Scholar] [CrossRef]
  40. Sarma, P.K. Postharvest losses of tomato: A value chain context of Bangladesh. Int. J. Agric. Educ. Ext. 2018, 4, 085–092. [Google Scholar]
  41. Maige, L.S. Analysis on The Factors for Tomato Supply Chain Performance: A Case of Kilosa District; College of Business Education: Dar es Salaam, Tanzania, 2022. [Google Scholar]
  42. Türkten, H. Environmental Efficiency of Tomato Growing Farms Having Soilless Culture System and Economic Analysis of Waste Utilization Methods. Ph.D. Thesis, Ondokuz Mayıs University, Samsun, Turkey, 2021. [Google Scholar]
  43. Chen, Y.-T. A cost analysis of food waste composting in Taiwan. Sustainability 2016, 8, 1210. [Google Scholar] [CrossRef]
  44. Pandyaswargo, A.H.; Premakumara, D.G.J. Financial sustainability of modern composting: The economically optimal scale for municipal waste composting plant in developing Asia. Int. J. Recycl. Org. Waste Agric. 2014, 3, 1–14. [Google Scholar] [CrossRef]
  45. Zulkepli, N.E.; Muis, Z.A.; Mahmood, N.A.N.; Hashim, H.; Ho, W.S. Cost benefit analysis of composting and anaerobic digestion in a community: A review. Chem. Eng. Trans. 2017, 56, 1777–1782. [Google Scholar]
  46. Montero, J.I.; Antón, M.A.; Torrellas, M.; Ruijs, M.; Vermeulen, P. EUPHOROS Deliverable 5. Report on Environmental and Economic Profile of Present Greenhouse Production Systems in Europe. European Commission FP7 RDT Project Euphoros (Reducing the Need for External Inputs in High Value Protected Horticultural and Ornamental Crops). 2009. Available online: http://www.euphoros.wur.nl/UK (accessed on 11 September 2023).
  47. Boldrin, A.; Hartling, K.R.; Laugen, M.; Christensen, T.H. Environmental in- ventory modelling of the use of compost and peat in growth media preparation. Resour. Conserv. Recycl. 2010, 54, 1250–1260. [Google Scholar] [CrossRef]
  48. Gruda, N.S. Increasing sustainability of growing media constituents and stand-alone substrates in soilless culture systems. Agronomy 2019, 9, 298. [Google Scholar] [CrossRef]
  49. Mielcarek, A.; Rodziewicz, J.; Janczukowicz, W.; Dobrowolski, A. Analysis of wastewater generated in greenhouse soilless tomato cultivation in central Europe. Water 2019, 11, 2538. [Google Scholar] [CrossRef]
  50. Chaudhary, K.R. Analysis of Tomato Marketing System in Lalitpur District, Nepal. Master’s Thesis, Van Hall Larenstein University of Applied Sciences, Leeuwarden, the Netherlands, 2010. [Google Scholar]
  51. Singh, K.; Asress, F.C. Determining working capital solvency level and its effect on profitability in selected Indian manufacturing firms. 2010. Available online: http://repository.kln.ac.lk/handle/123456789/4511 (accessed on 11 September 2023).
  52. Kaveri Gosavi, D.H.; Ratnaparkhe, A.N. Price spread, market margin and marketing efficiency in cauliflower marketing in Maharashtra. Pharma Innov. J. 2021, SP-10, 400–403. [Google Scholar]
  53. Pipera, D.; Pagria, I.; Musabelliu, B. Alternatives for improving management of the value chain for greenhouse tomato production in Albania. In Proceedings of the KONFERENCA E KATËRT, Pristina, Kosovo, 1 February 2022; pp. 235–251. [Google Scholar]
  54. Eltahir, M.E.S.; Fadl, K.E.M.; Hamad, M.A.A.; Safi, A.I.A.; Elamin, H.M.A.; Abutaba, Y.I.M.; Musa, F.I.; Mahmoud, T.E.; Alemeu, A.; Abdelrhman, H.A.; et al. Tapping Tools for Gum Arabic and Resins Production: A Review Paper. Am. J. Eng. Technol. Manag. 2023, 8, 33–40. [Google Scholar]
  55. Xaba, B.G.; Masuku, M.B. Factors affecting the productivity and profitability of vegetables production in Swaziland. J. Agric. Stud. 2013, 1, 37–52. [Google Scholar]
  56. Chauhan, A.; Singh, A. A hybrid multi-criteria decision making method approach for selecting a sustainable location of healthcare waste disposal facility. J. Clean. Prod. 2016, 139, 1001–1010. [Google Scholar] [CrossRef]
  57. Bhandari, R.; Neupane, N.; Adhikari, D.P. Climatic change and its impact on tomato (Lycopersicum esculentum L.) production in plain area of Nepal. Environ. Chall. 2021, 4, 100–129. [Google Scholar] [CrossRef]
Figure 1. Flowchart of alternative Turkish FTSC.
Sustainability 15 13801 g001
Figure 2. The distribution of Turkish greenhouse tomato farms.
Sustainability 15 13801 g002
Figure 3. Change in profit distribution after waste composting and recycling.
Sustainability 15 13801 g003
Table 1. Marketing margins for the tomato supply chain by FTSC.
Price (USD/kg) (1)Cumulative (%) (2)Absolute Marketing Margin (USD/kg) (3)Relative Marketing Margin (%) (4)Cost (USD/kg) (5)Net Profit (USD/kg) (6)Profit Distribution (%) (7)Net Profit Margin (%) (8) = (6)/(1)
1. Supply chain
Producer0.8121.620.8121.620.660.1617.040.20
Wholesaler1.7747.040.9625.420.670.2930.950.16
Exporter2.4063.600.6216.570.570.066.200.02
Retailer3.77100.001.3736.400.940.4345.800.11
Total3.77-3.77100.002.830.93100.000.25
2. Supply chain
Producer0.8152.190.8152.190.660.1636.800.20
Wholesaler1.1674.460.3522.260.240.1125.370.09
Retailer1.56100.000.4025.540.240.1637.820.10
Total1.56-1.56100.001.130.43100.000.28
3. Supply chain
Producer0.8153.200.8153.200.660.1652.560.20
Retailer1.53100.000.7246.800.570.1447.440.09
Total1.53-1.53100.001.230.30100.000.20
Table 2. Total net income of FTSC actors and income distributions.
Total Tomatoes Supply (Ton)Number of Active Actors in Each NodesQuantity of Tomatoes Sold by FTSC Actors (Ton/Actor)Net Profit (USD/Ton)Total Net Income (USD)Share in Total Net FTSC Income (%)Rank of the Actors
First FTSC
Producer195,992.64136.001441.12160.00230,579.587.794
Wholesaler194,969.2060.003249.49290.00942,351.1331.822
Exporter186,597.8218.0010,366.5560.00621,992.7321.003
Retailer183,335.1669.002657.03439.001,166,436.7439.391
Total 930.002,961,360.19100.00
Second FTSC
Producer50,750.34136.00373.16160.0059,706.2827.323
Wholesaler50,674.7060.00844.58110.0092,903.6242.511
Retailer49,464.44120.00412.20160.0065,952.5930.182
Total 430.00218,562.49100.00
Third FTSC
Producer76,382.66136.00561.64160.0089,861.9515.962
Retailer74,360.9022.003380.04140.00473,205.7384.041
Total 300.00563,067.68100.00
Wastage ratio for producers, exporters, wholesalers and retailers were 5%, 10%, 12% and 12%, respectively.
Table 3. Loss and waste that occurred during greenhouse tomato production.
Waste Amount (Tons)Value USD
Mean%Mean%
Agricultural waste1763.6297.87302.8196.23
        Plant waste1520.4184.37261.0182.95
                  Plant waste during production1174.0865.15233.0474.06
                  Plant waste after harvesting346.3419.2227.978.89
        Product waste0.160.010.020.01
        Growing media waste164.019.1013.624.33
        Drainage79.044.3928.158.95
Other waste38.432.1311.853.77
      Viol0.330.020.080.03
      Plastic case14.650.815.421.72
      Box7.500.421.980.63
      Medicine box0.830.050.220.07
      Greenhouse glass4.220.230.600.19
      Greenhouse plastic cover6.020.332.820.90
      Rope4.890.270.740.24
Total tomato production waste1802.04100.00314.66100.00
Table 4. Product loss and wastes arising along the tomato supply chain and their economic value.
Box and Cardboard WastePallet WasteProduct Loss
Waste Amount (Tons)Value USDWaste Amount (Tons)Value USDWaste Amount (Tons)Value USD
MeanMeanMeanMeanMeanMean
1. Supply chain
Wholesalers86.49776.339.85551.37.5937.1
Exporter90.010,185.9181.525,340.061.67665.2
Retailers95.810,840.7132.218,462.222.52806.2
2. Supply chain
Wholesalers50.95767.610.91518.20.669.3
Retailers 91.010,296.3140.019,543.68.91108.2
3. Supply chain
Retailers52.05890.3135.318,895.014.91851.2
Disclaimer/Publisher’s Note: The statements, opinions and data contained in all publications are solely those of the individual author(s) and contributor(s) and not of MDPI and/or the editor(s). MDPI and/or the editor(s) disclaim responsibility for any injury to people or property resulting from any ideas, methods, instructions or products referred to in the content.

