
Seismic and Tsunami Risk Analysis for Installing Resilient Power Systems Based on Isolated Microgrids on Buildings: The Case of Puerto Ayora in Santa Cruz Island, Galapagos


Abstract
:1. Introduction
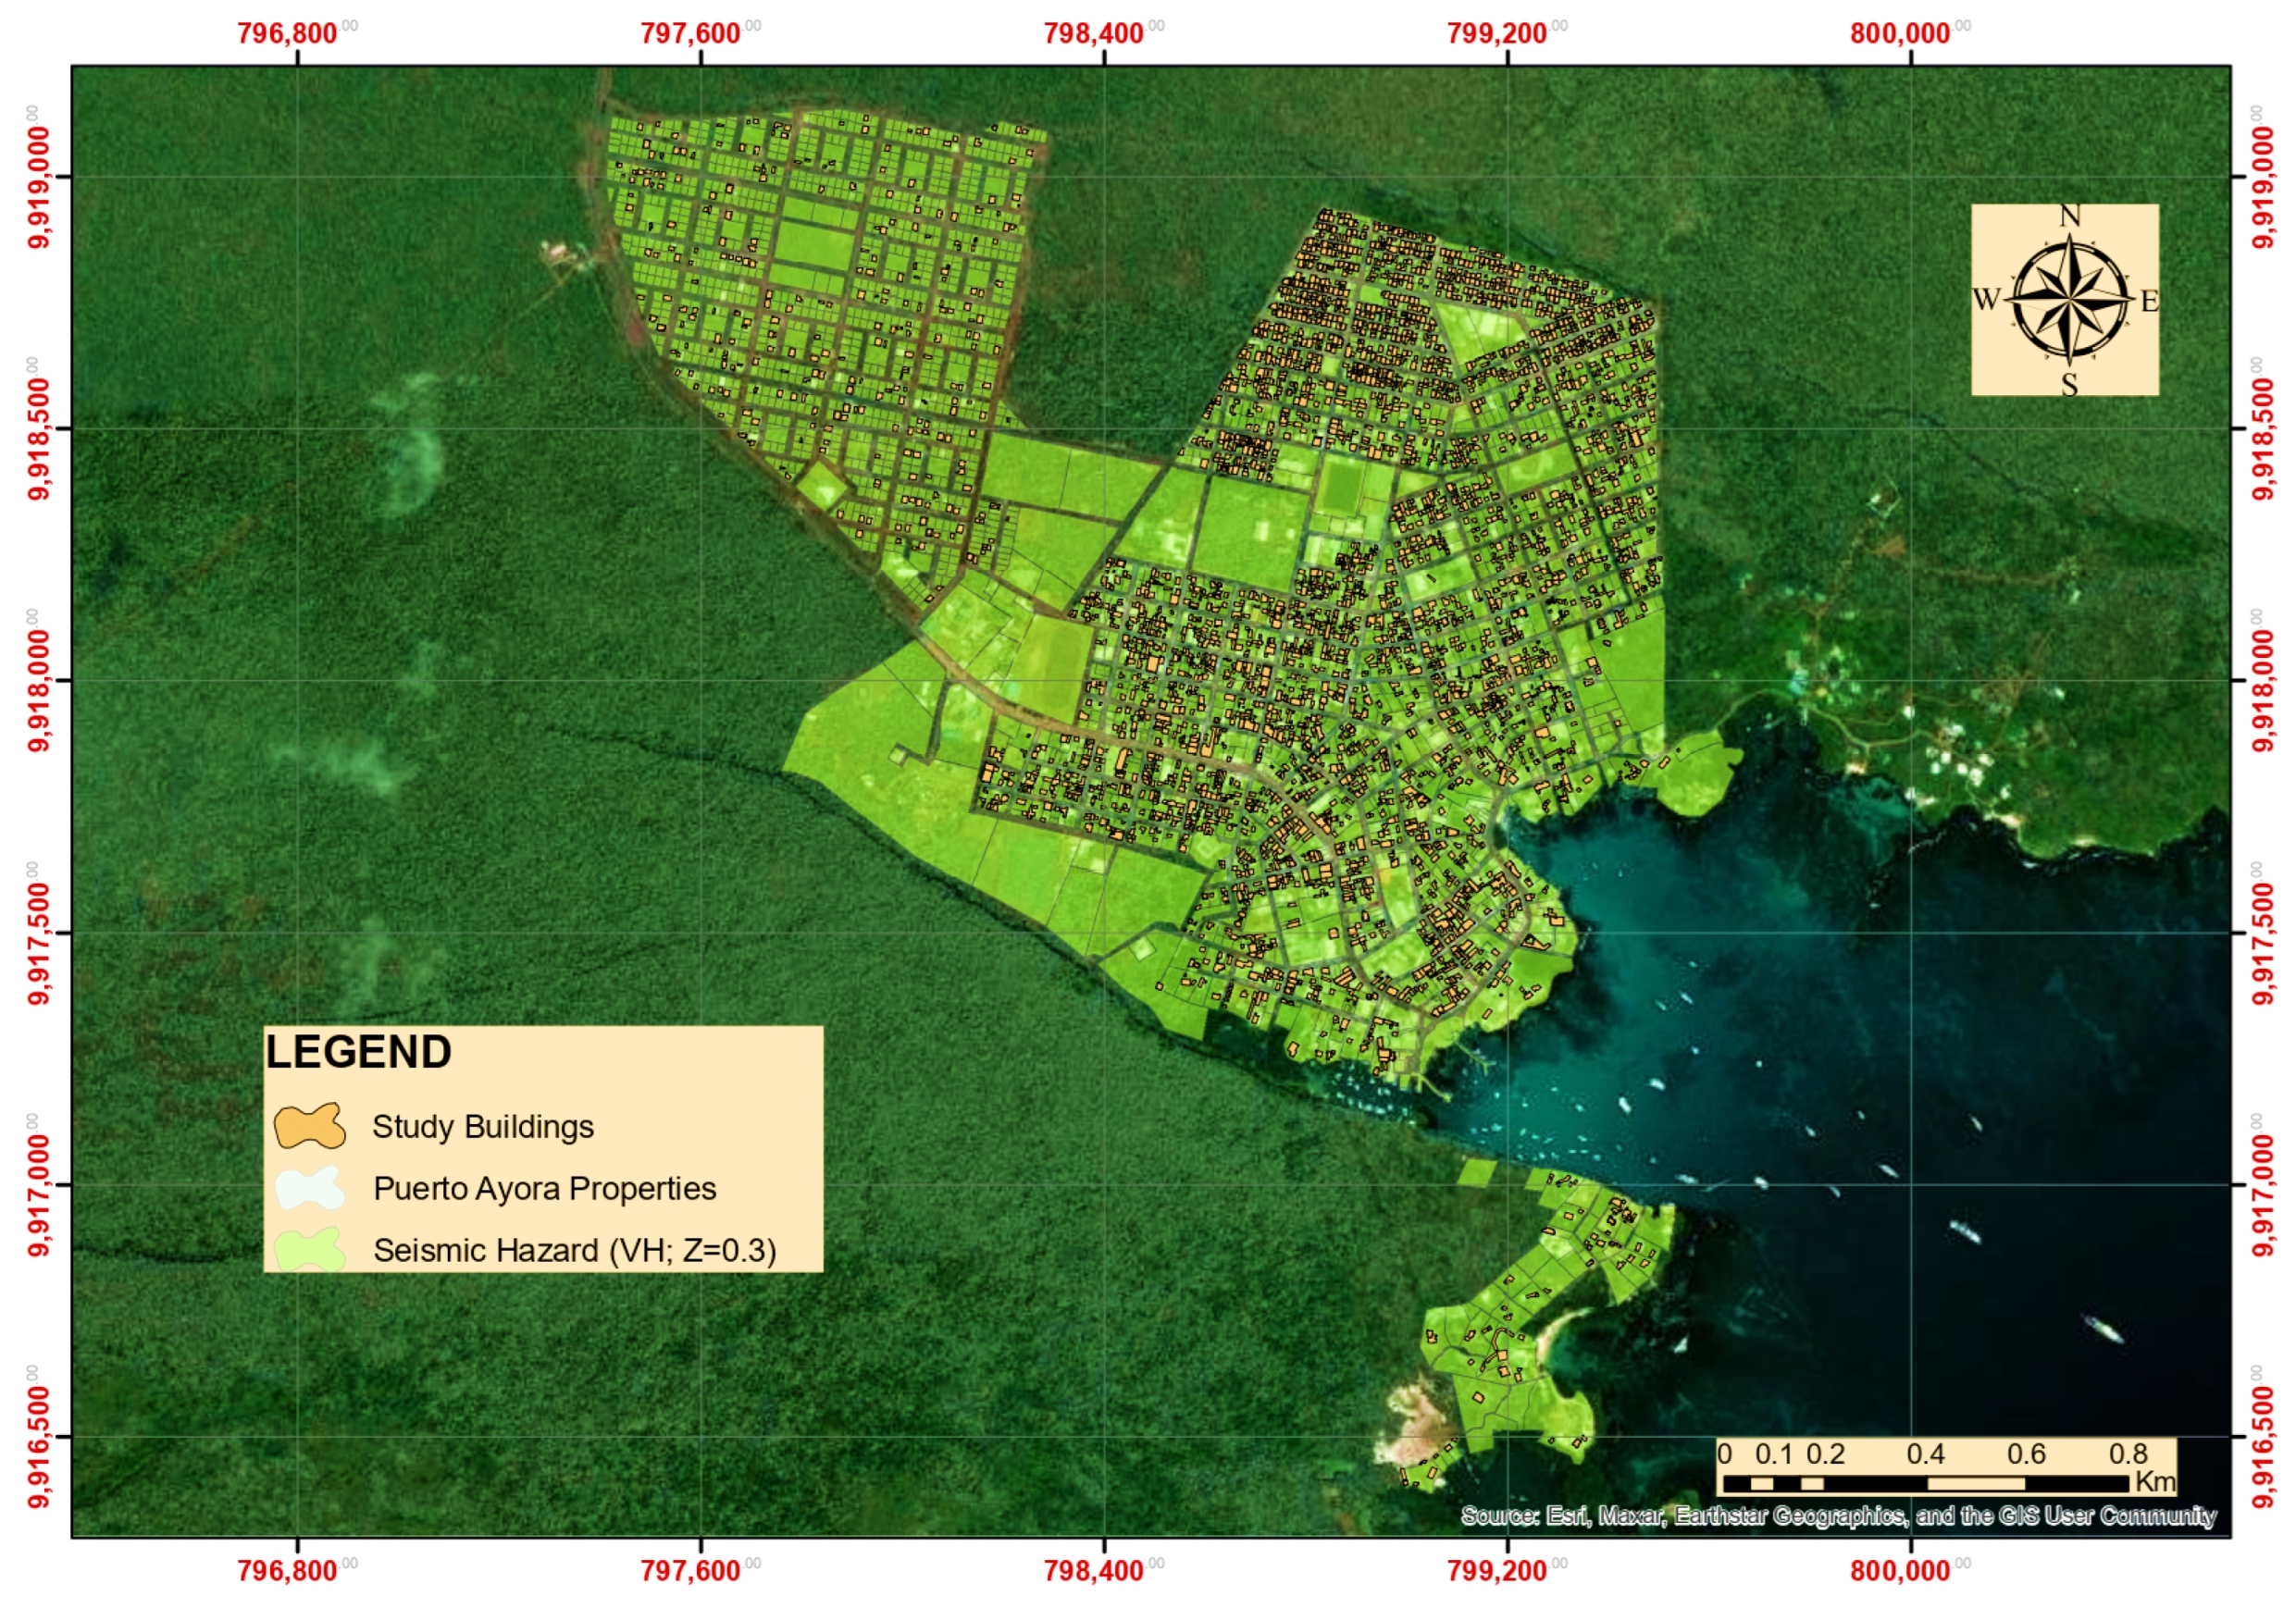
- Hazard, exposure, vulnerability, and risk index maps due to earthquakes and tsunamis for 517 Puerto Ayora—Santa Cruz Island studied properties using the FEMA P-154 and FEMA P-646 methodologies.
- Quantification of earthquake- and tsunami-vulnerable buildings and the principal factors causing high-risk indexes.
- General recommendations to install photovoltaic systems infrastructure on identified non-vulnerable buildings.
2. Methods
2.1. Earthquake Risk
2.1.1. Earthquake Hazard
2.1.2. Earthquake Exposure
2.1.3. Earthquake Vulnerability
2.2. Tsunami Risk
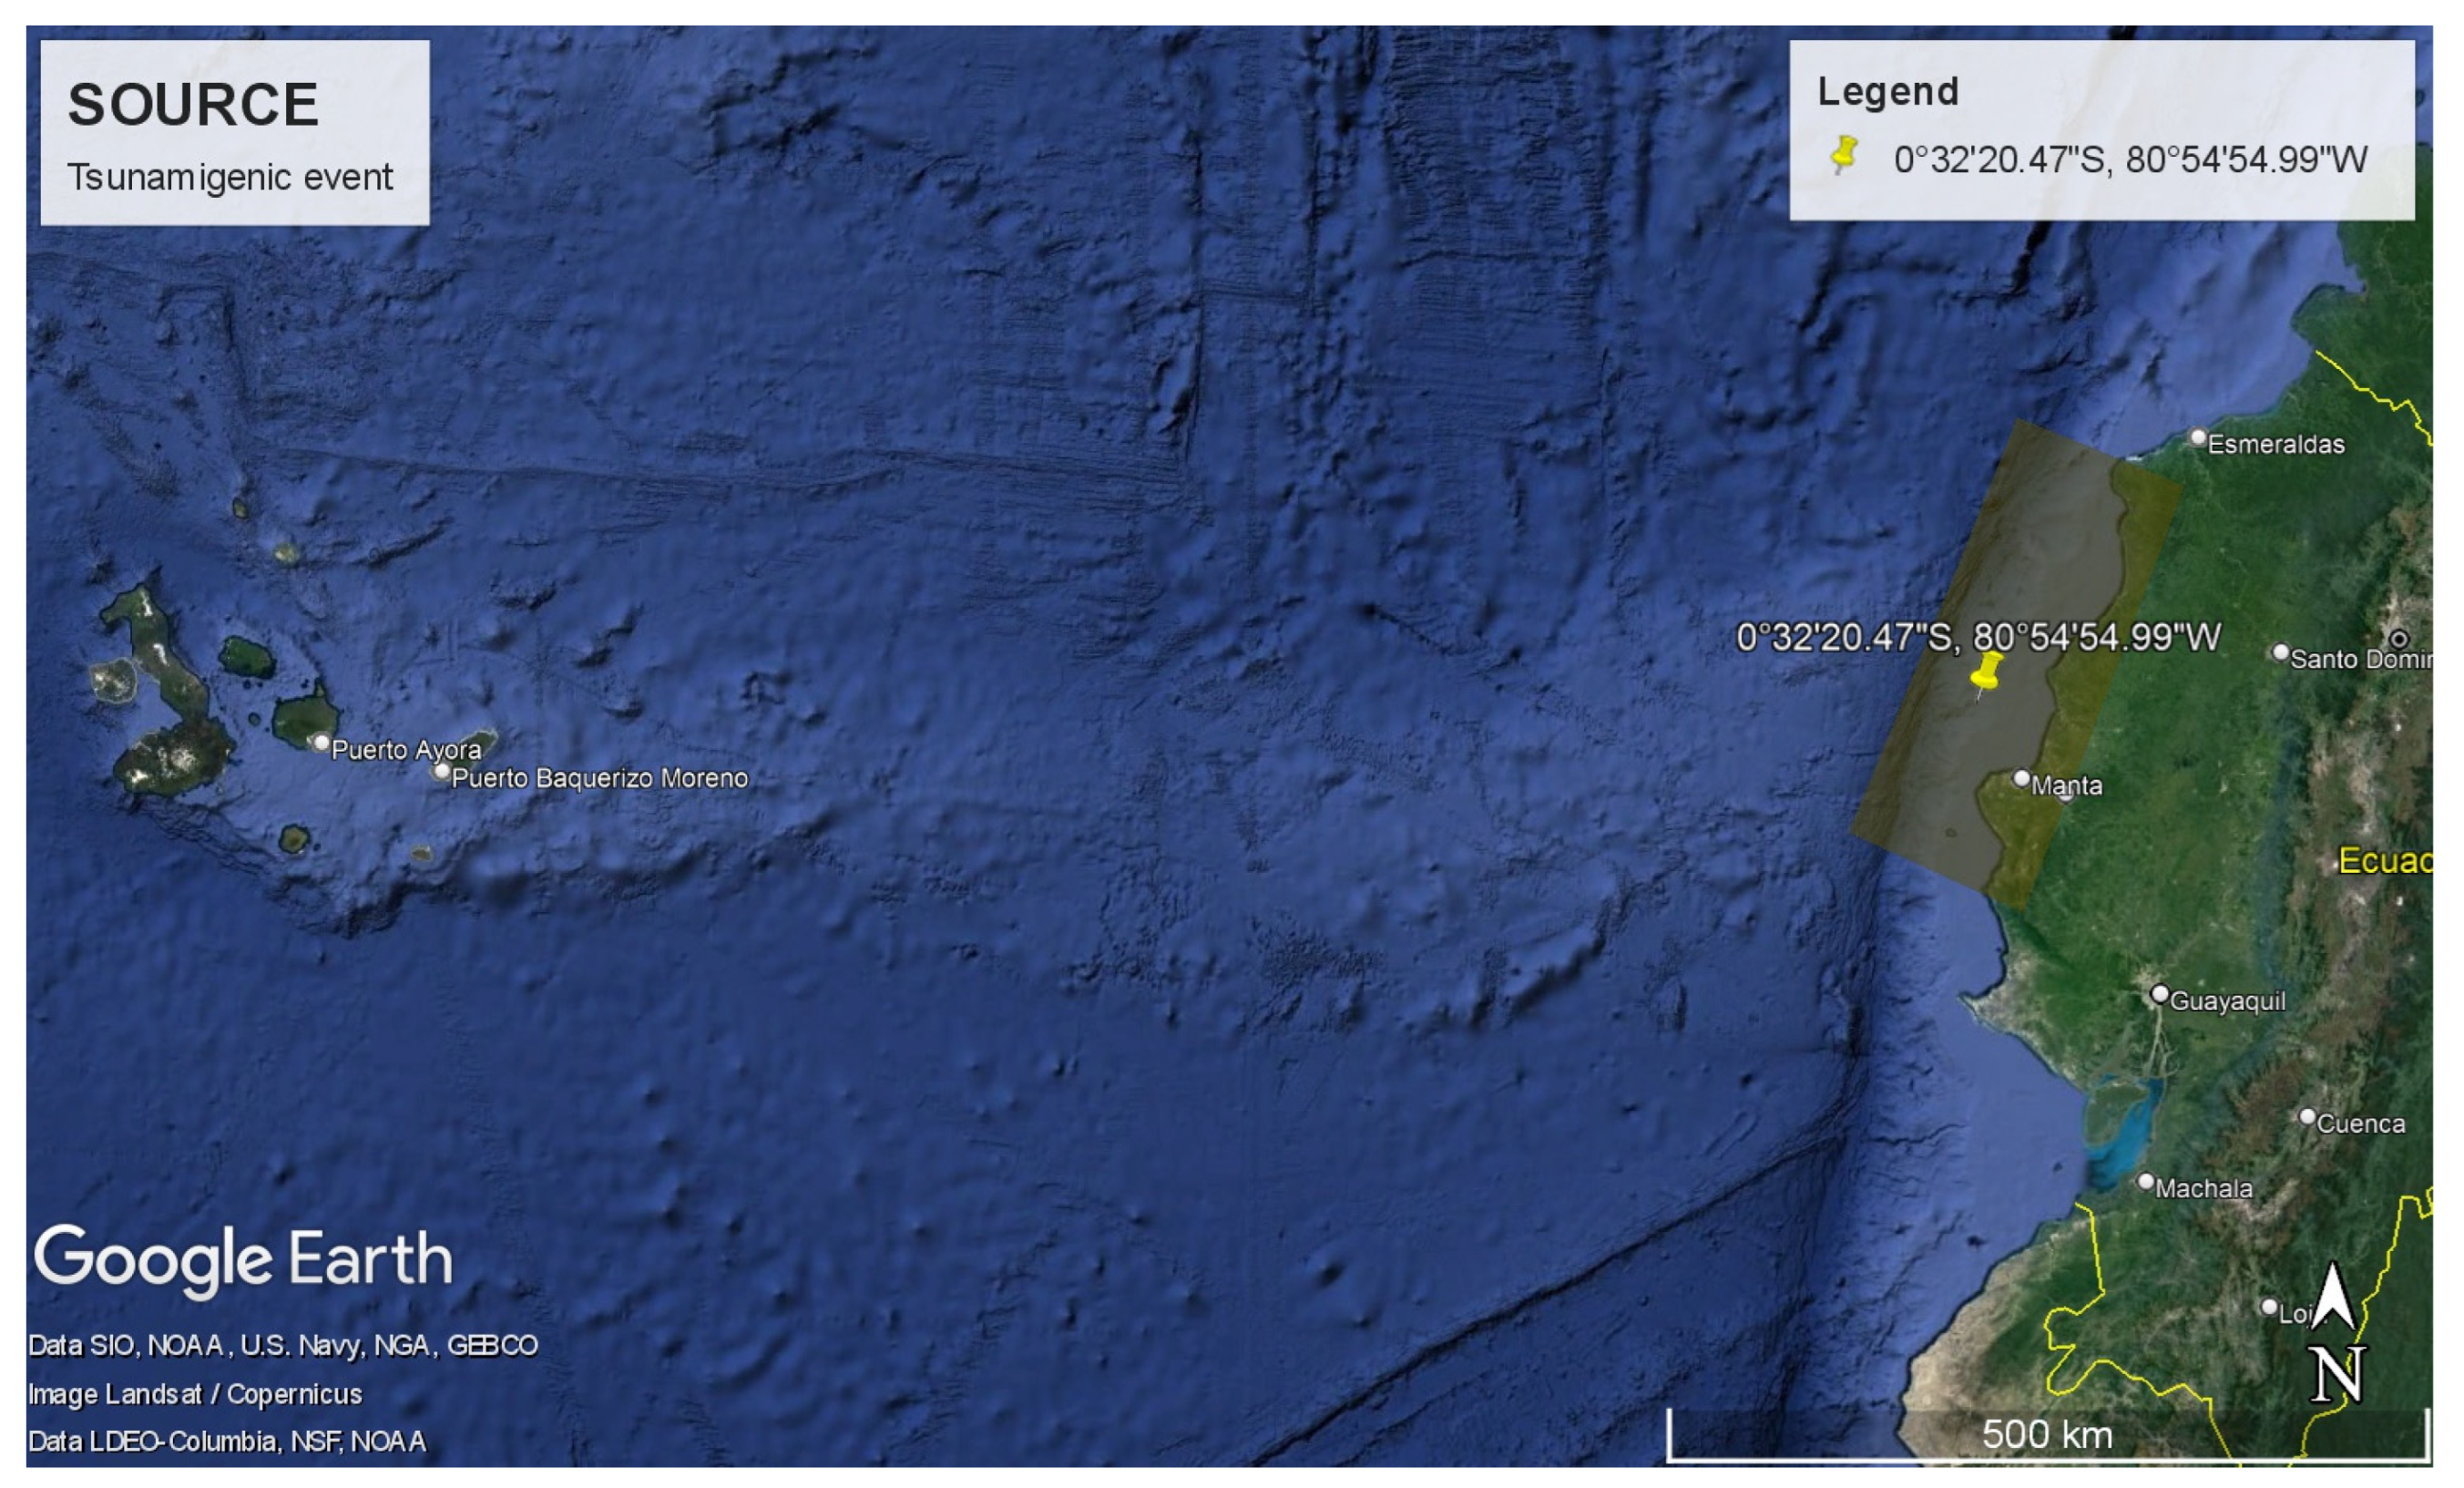
2.2.1. Tsunami Hazard
2.2.2. Tsunami Exposure
2.2.3. Tsunami Vulnerability and Numerical Simulation
3. Results
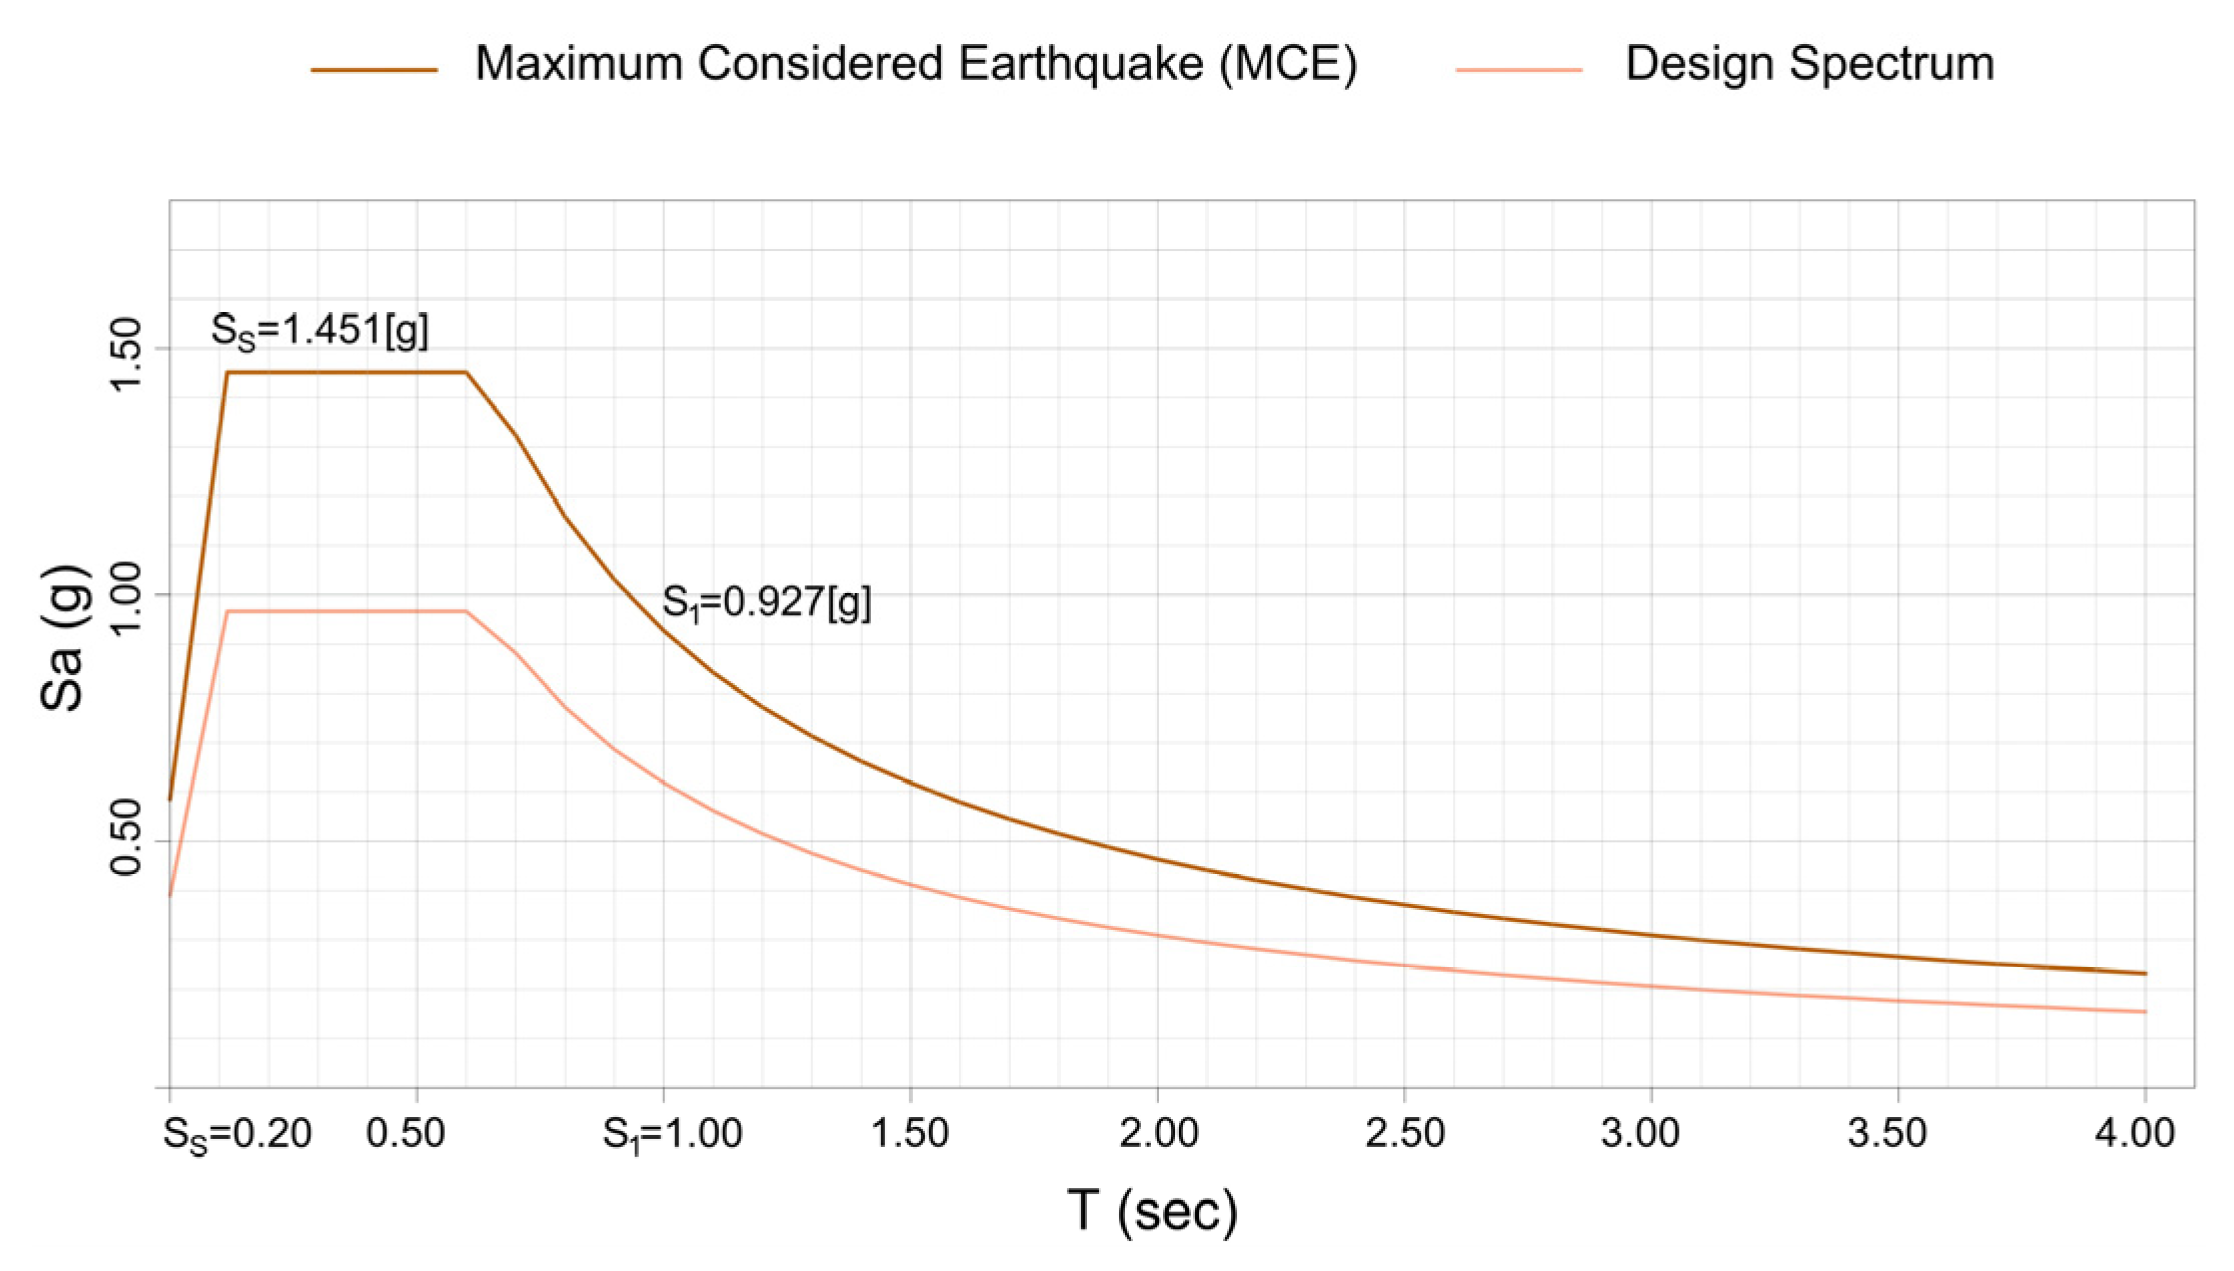
3.1. Puerto Ayora Earthquake Hazard
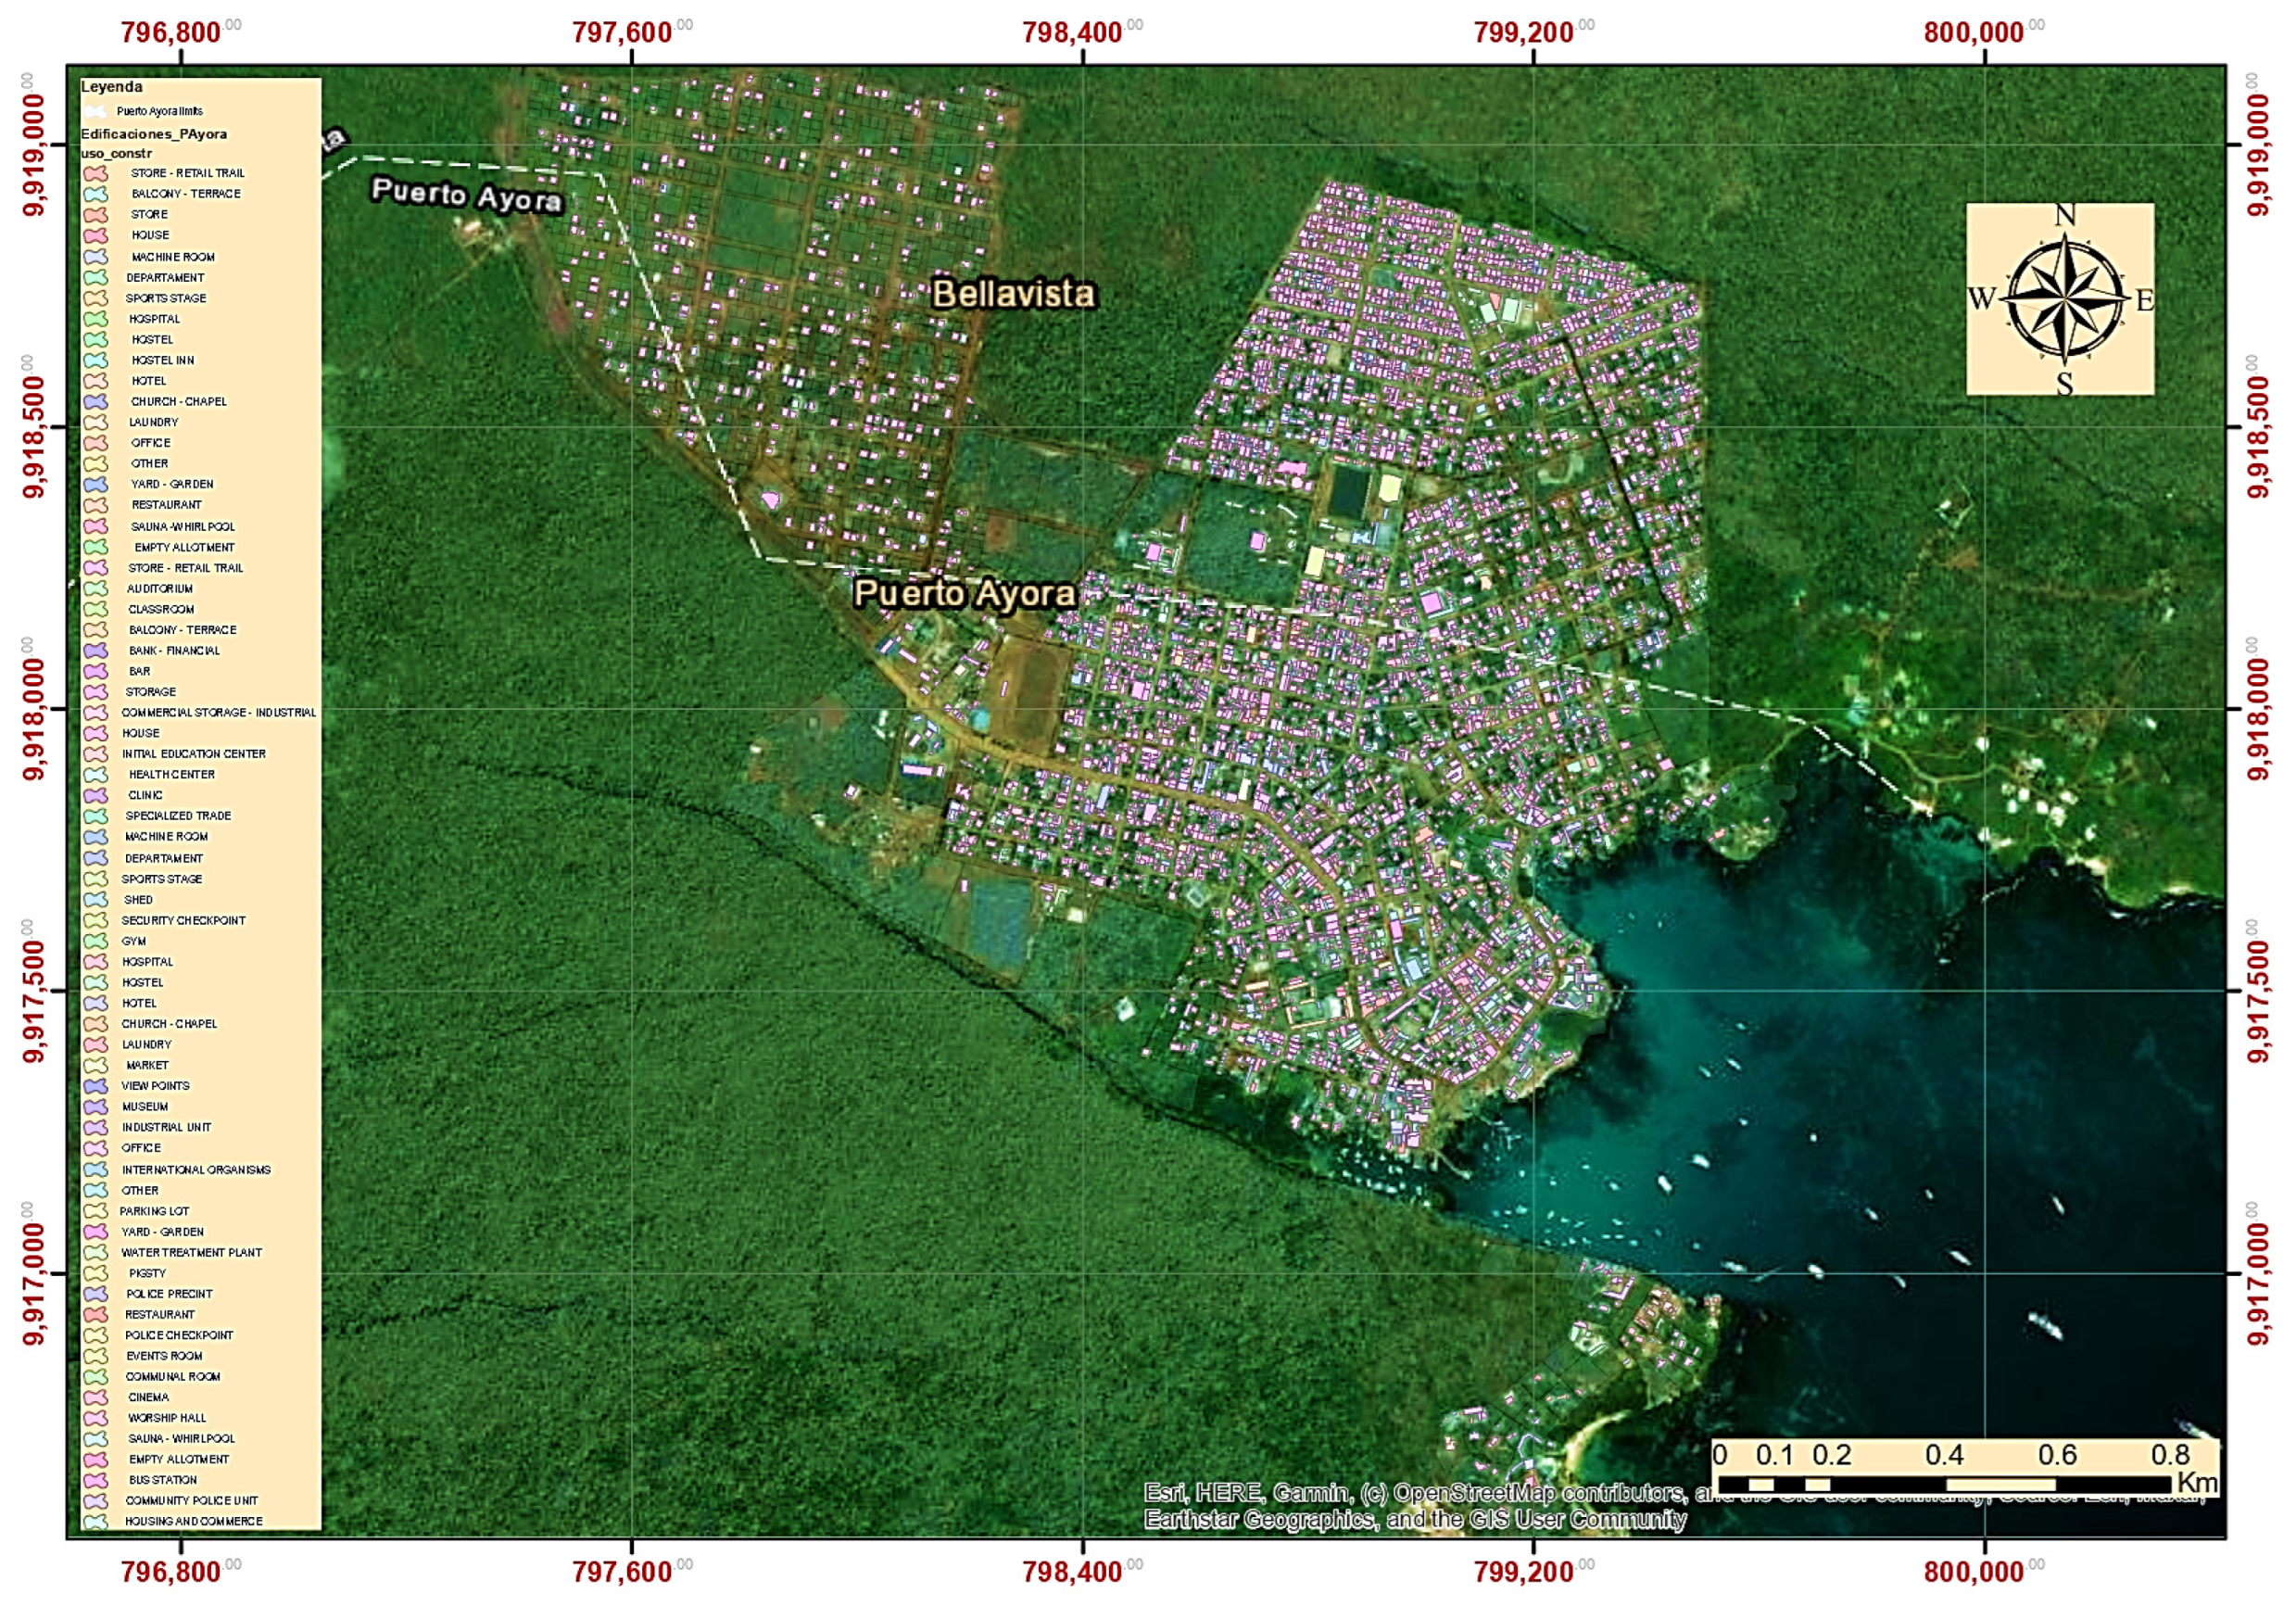
3.2. Puerto Ayora Exposure
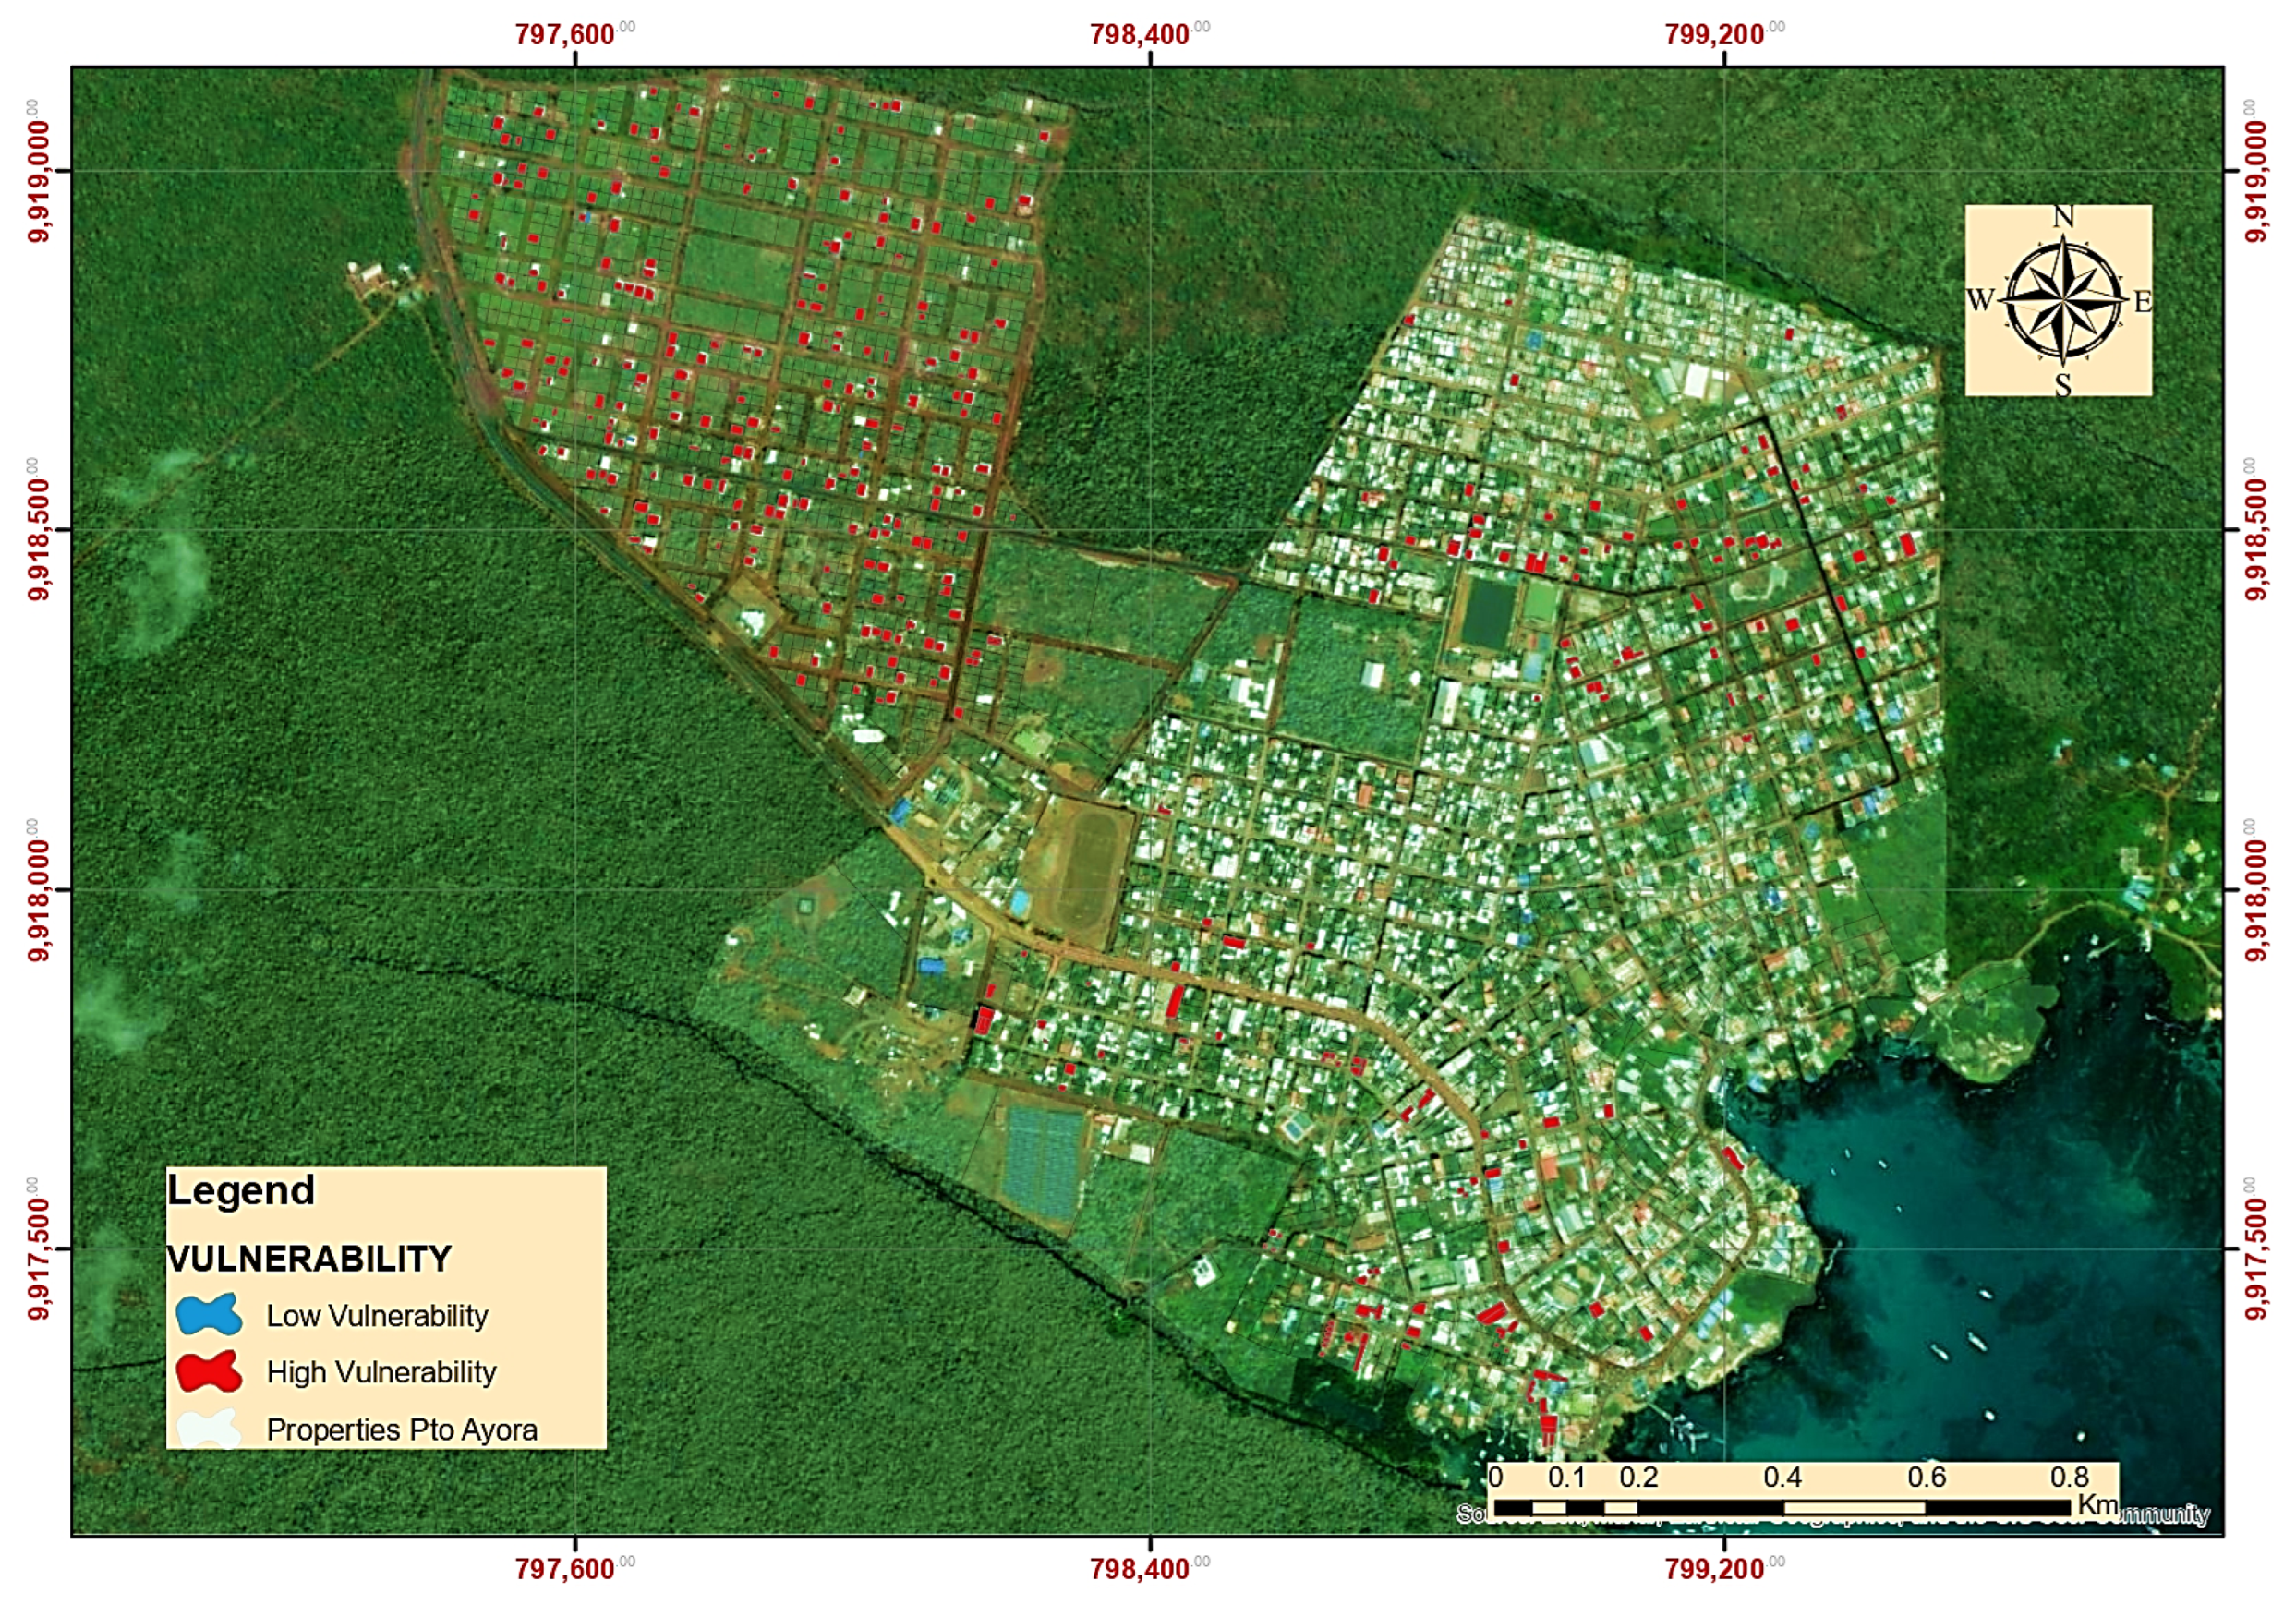
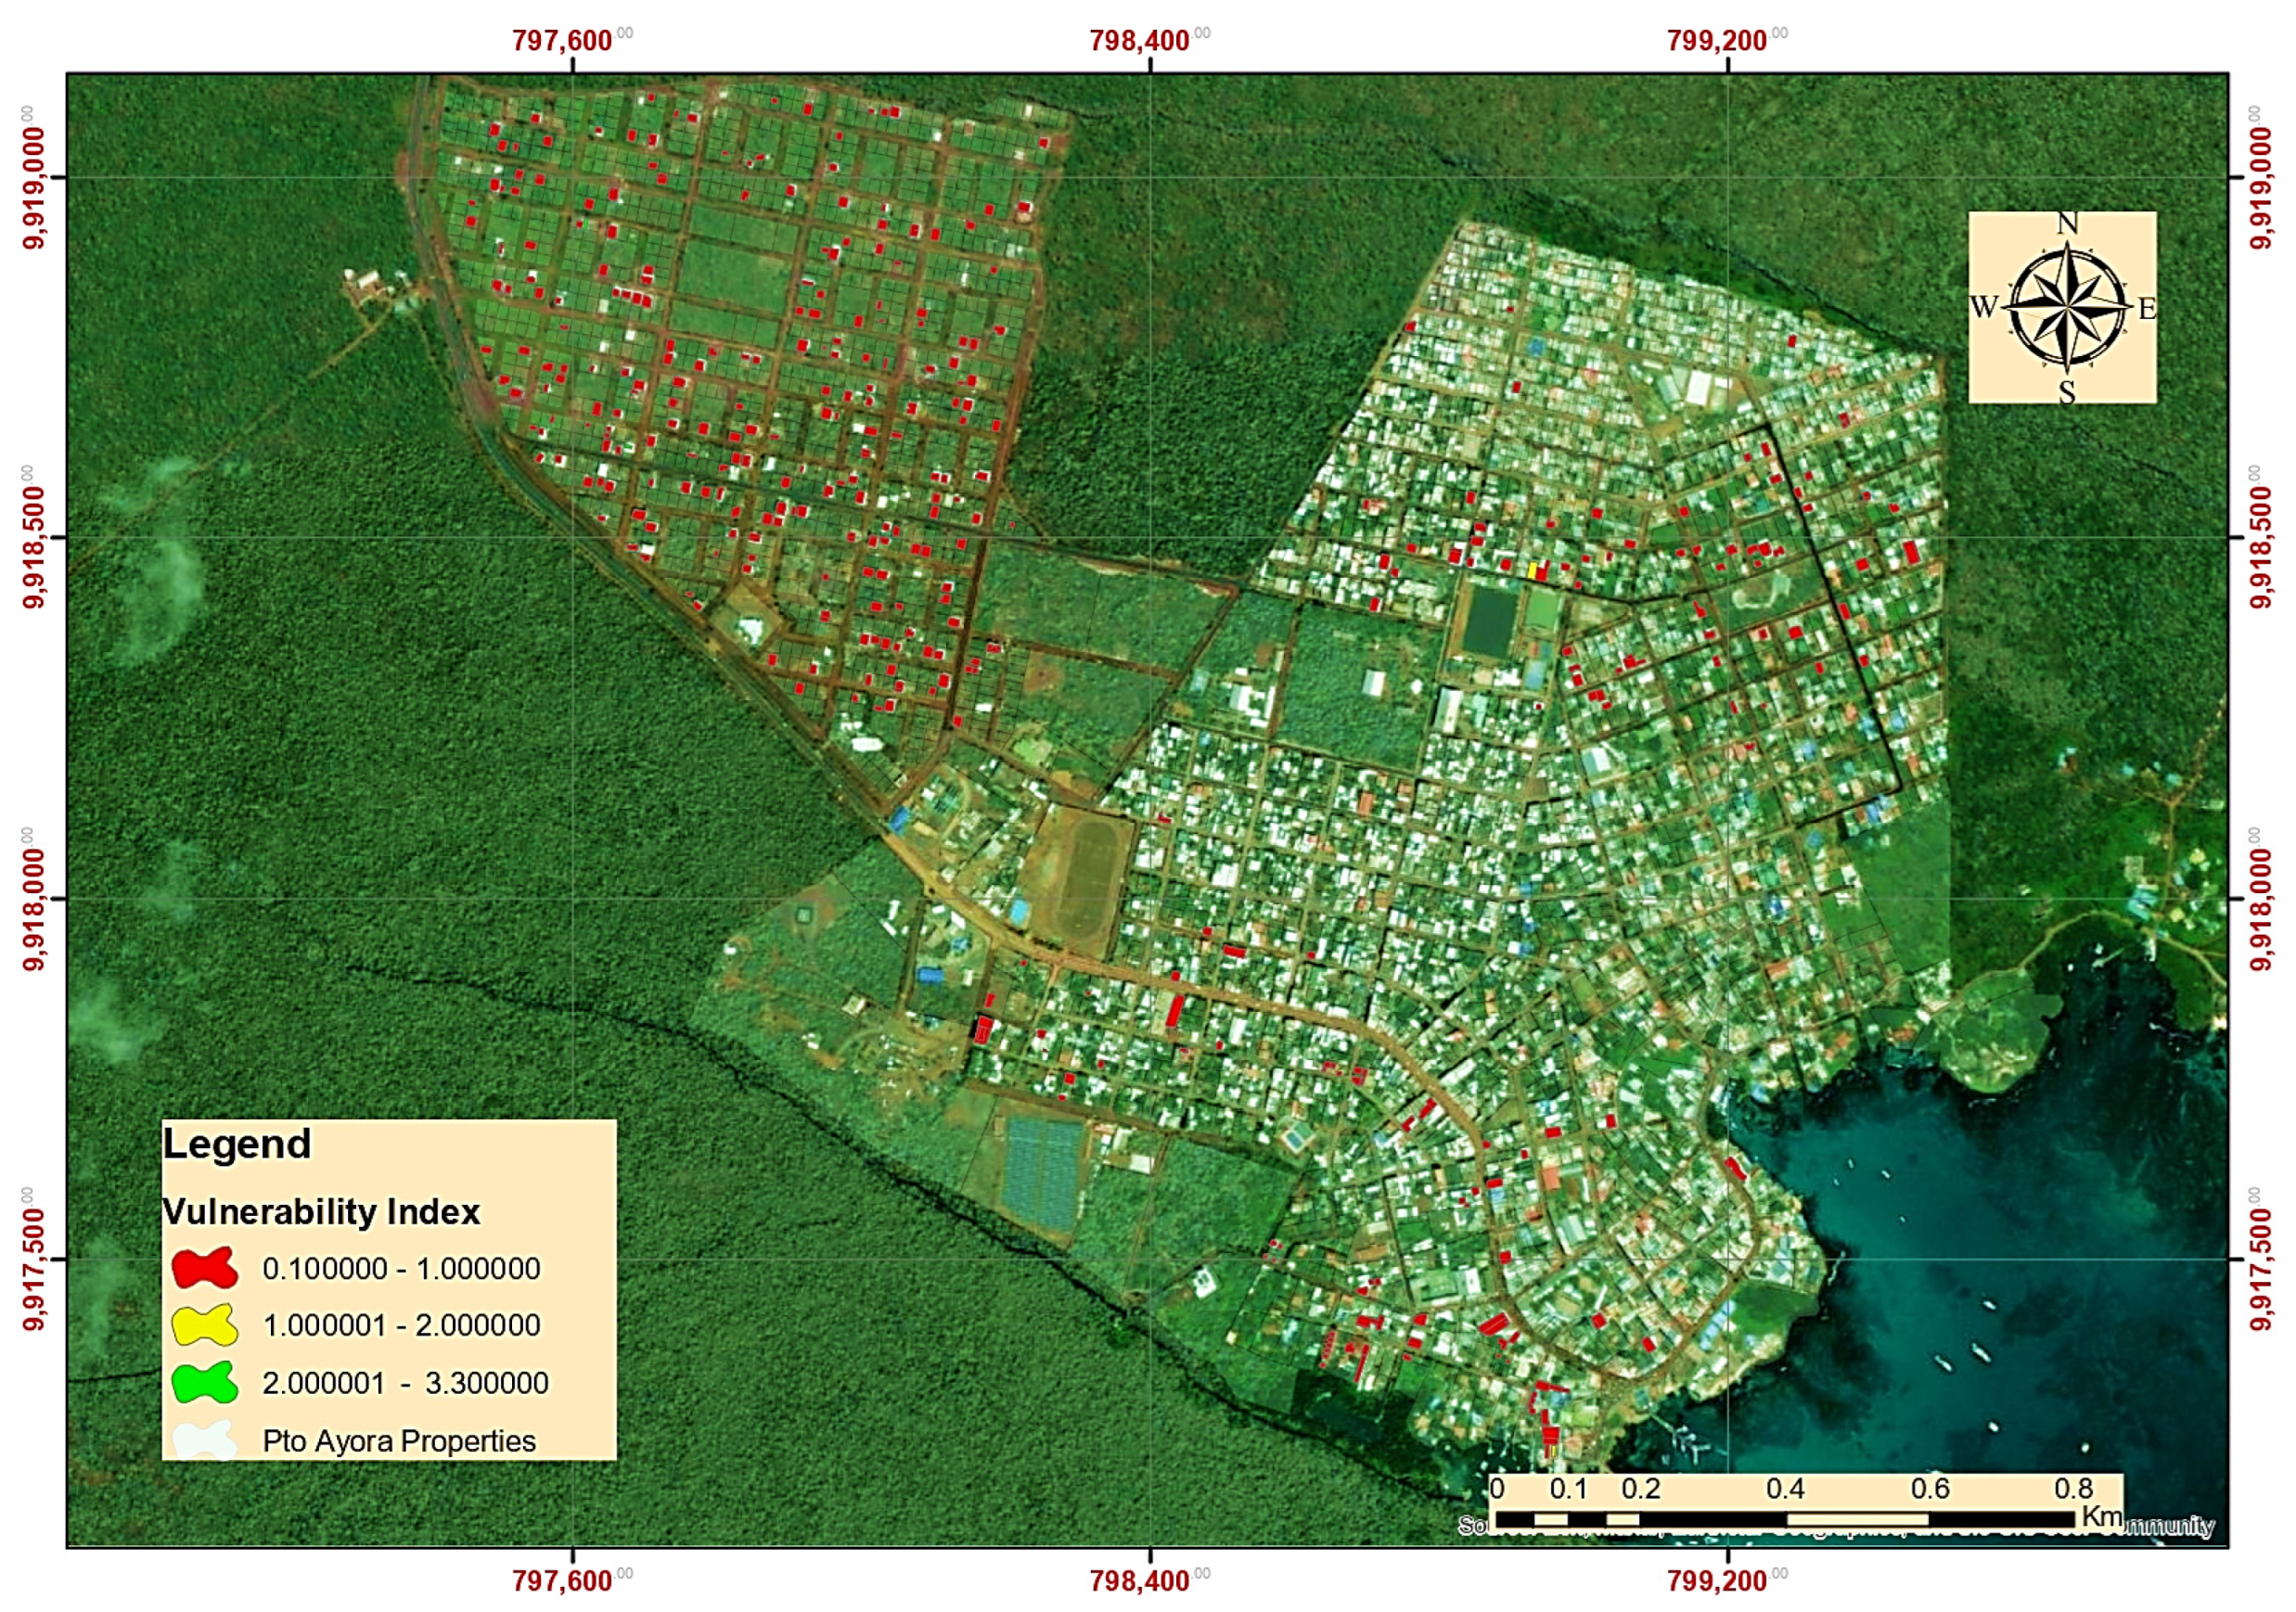
3.3. Seismic Vulnerability of the Santa Cruz Island
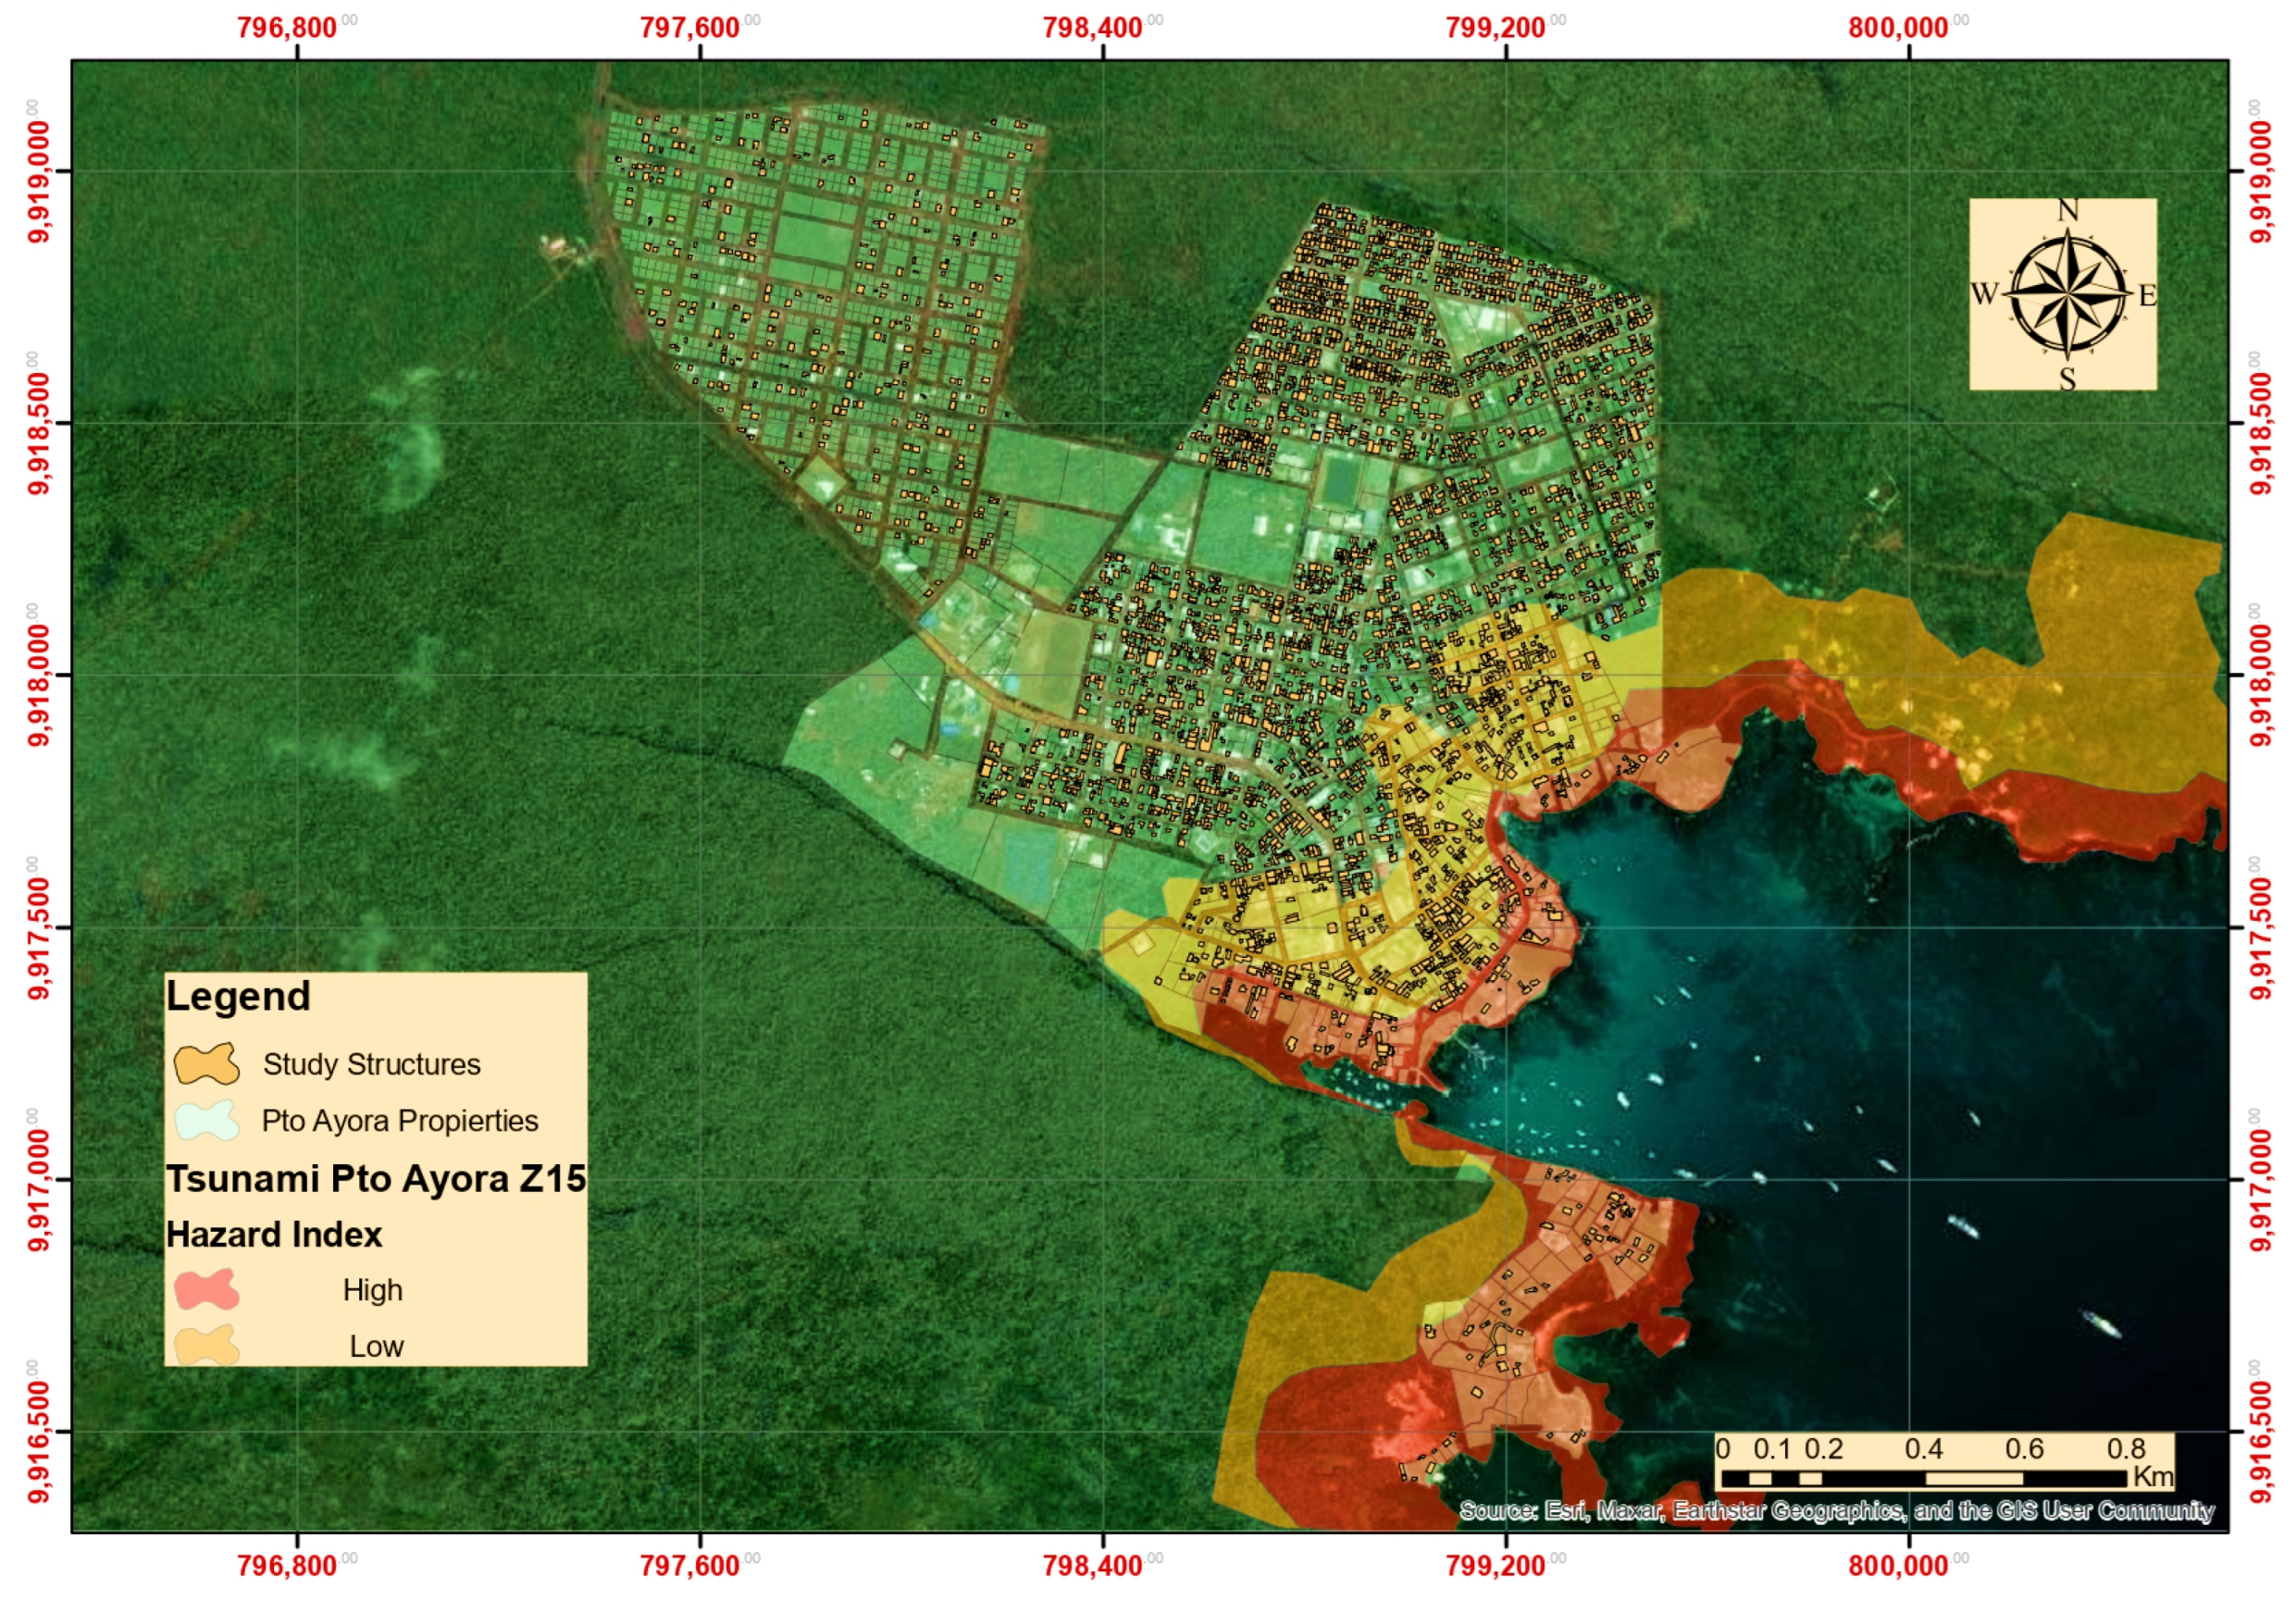
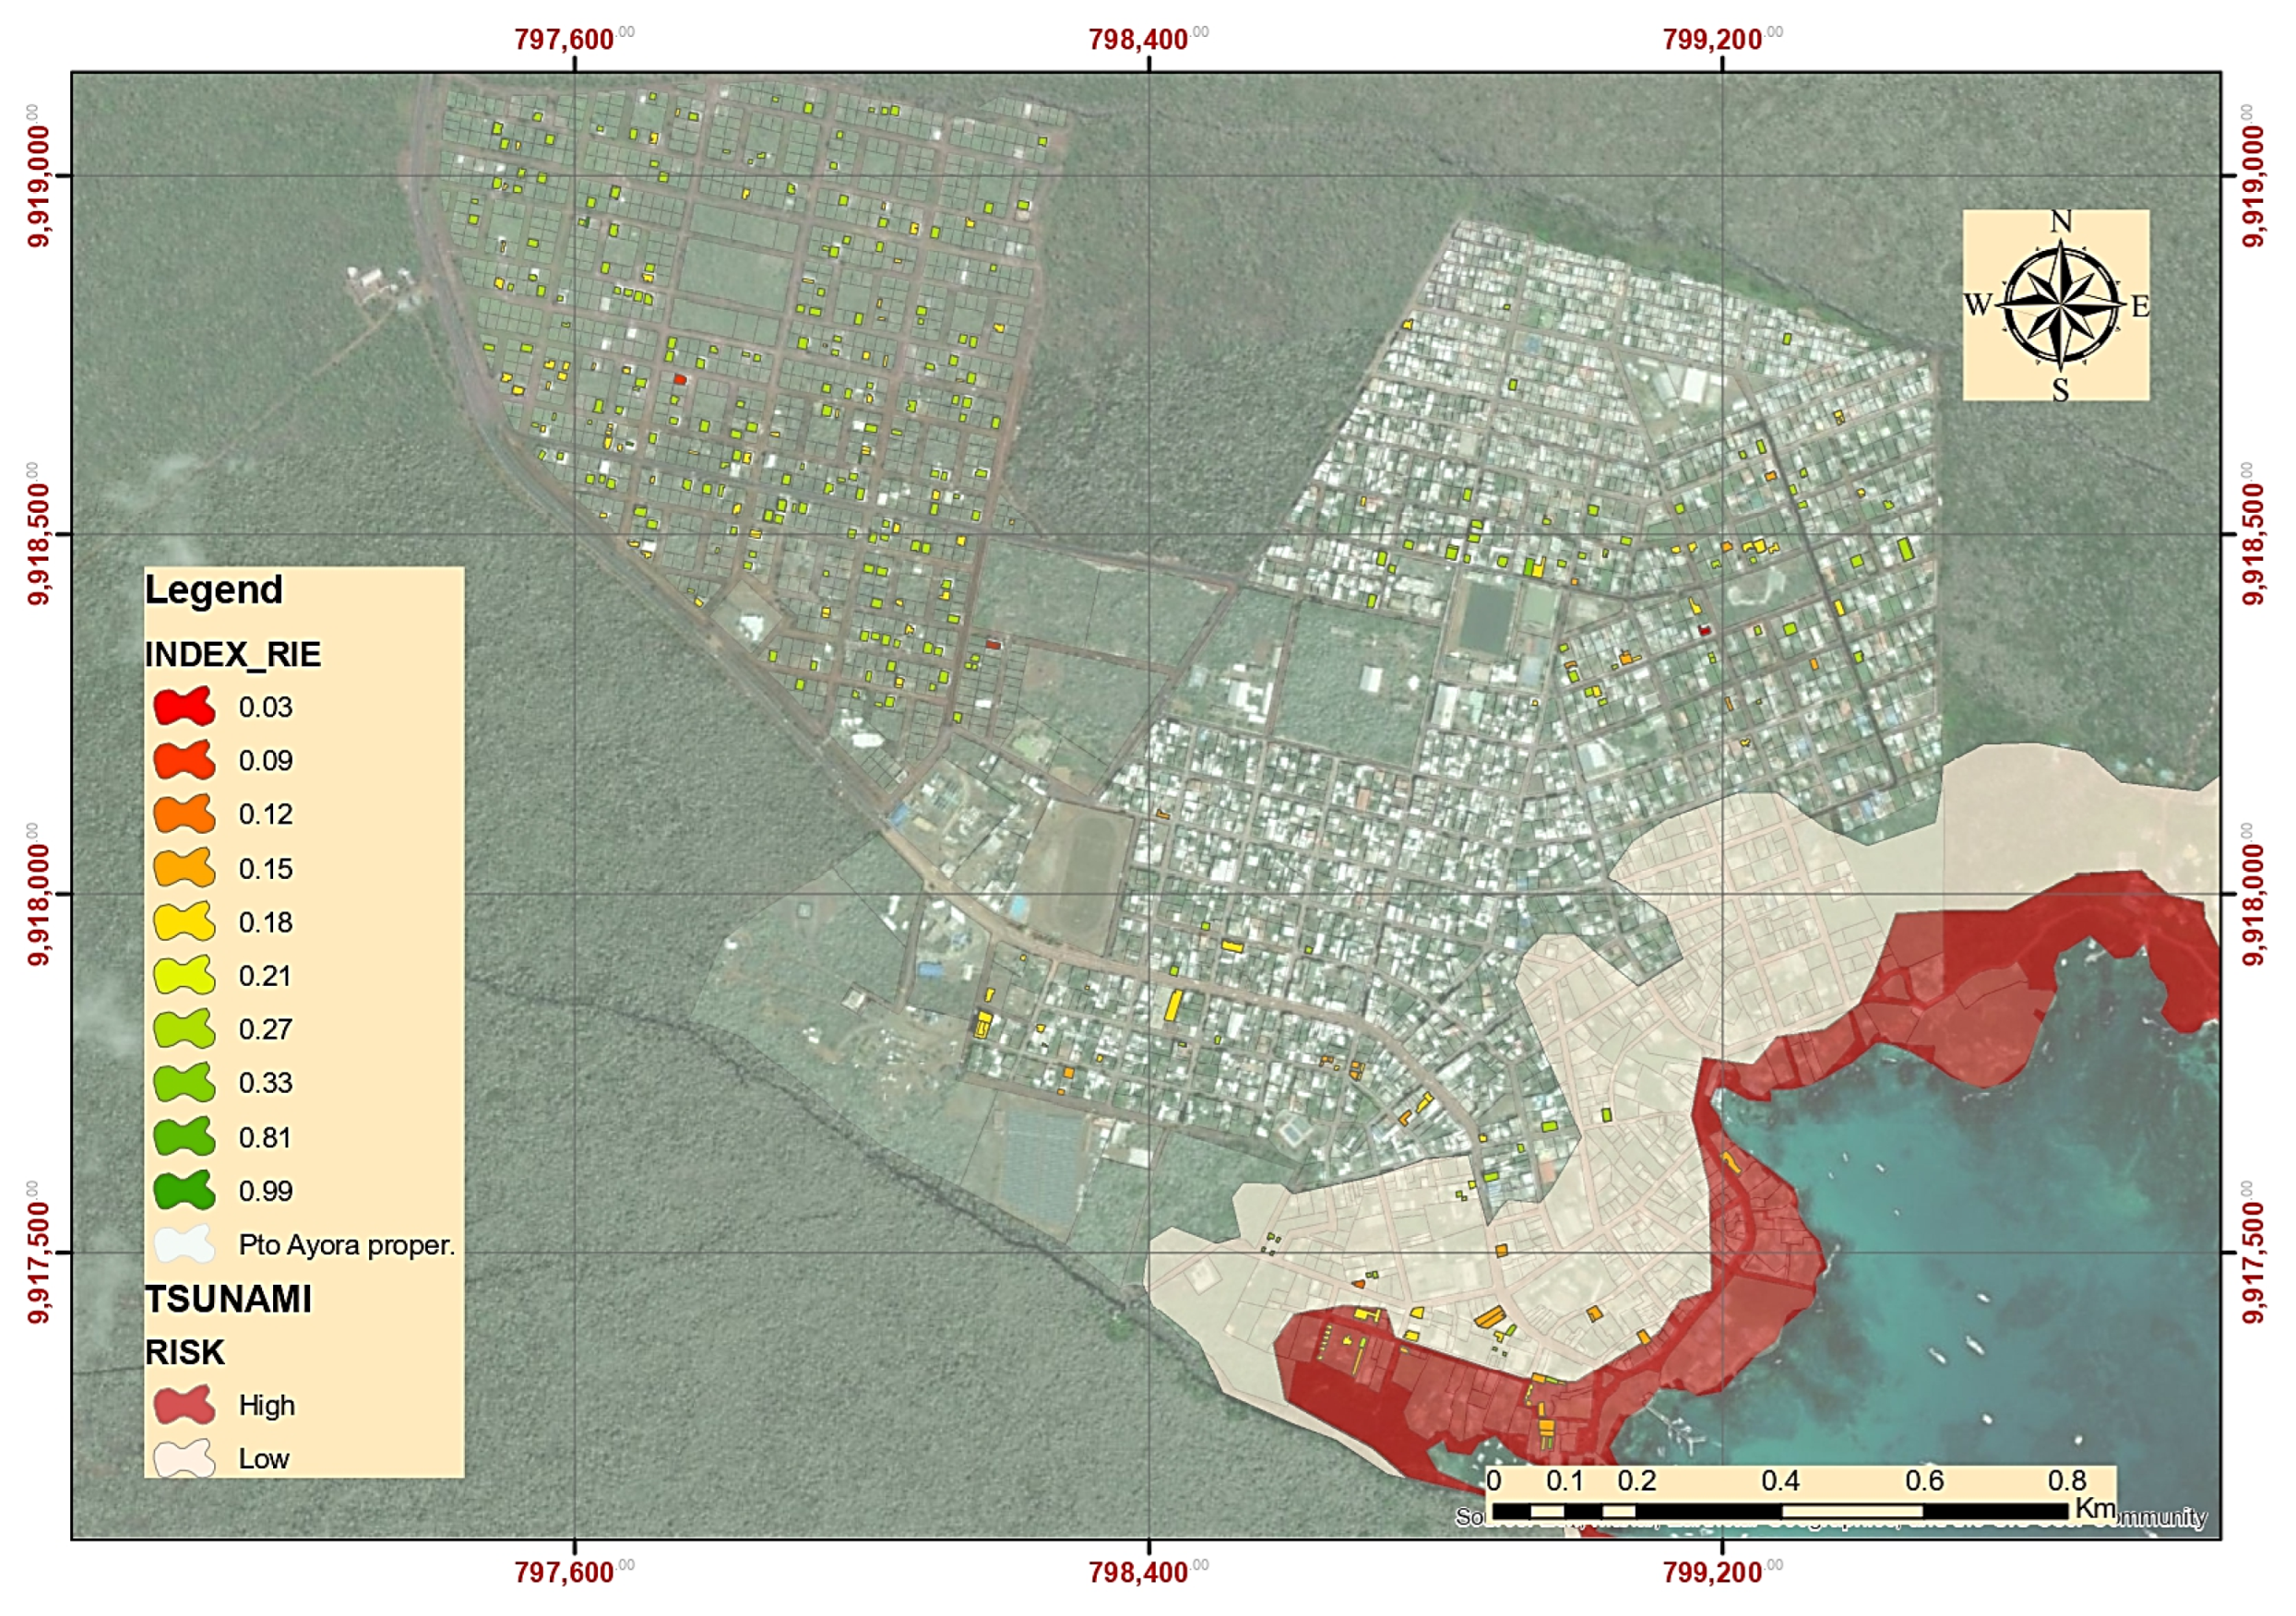
3.4. Vulnerability to Tsunami Santa Cruz Island
4. Discussion
5. Conclusions
Author Contributions
Funding
Institutional Review Board Statement
Informed Consent Statement
Data Availability Statement
Conflicts of Interest
Nomenclature
| Acronyms | |
| CMRF | Concrete moment resisting frame |
| CFUM | Concrete frame with unreinforced masonry infill walls |
| DG | Distributed generation |
| FEMA | Federal Emergency Management Agency |
| GAD | Decentralized autonomous government |
| IGM | Military Geographic Institute |
| INEC | National Institute of Statistics and Censuses |
| INOCAR | Oceanographic Institute of the Ecuadorian Navy |
| LMF | Light metal frame |
| LWF | Light wood frame single or multiple-family dwellings |
| MCE | Maximum considered earthquake |
| NEC | Ecuadorian Construction Standard |
| NOAA | National Oceanic and Atmospheric Administration |
| PGA | Peak ground acceleration |
| SFUM | Steel frame with unreinforced masonry infill walls |
| SGR | Risk Management Secretariat |
| TUNAMI N2 | Tohoku University Numerical Analysis Model for Investigation of Near-Field Tsunamis |
| UMWB | Unreinforced masonry bearing-wall buildings |
| Variables | |
| D | Water depth [m] |
| E | Exposure [-] |
| ek | Margin of error [%] |
| Fa | Soil amplification coefficient considering site effects [-] |
| Fd | Soil amplification coefficient considering displacement [-] |
| Fs | Soil amplification coefficient considering soil behavior [-] |
| G | Gravity acceleration [m/s2] |
| H | Hazard [-] |
| k | Sample size [units] |
| M | Velocity flux in x direction [m3/s] |
| N | Velocity flux in y direction [m3/s] |
| Nk | Population size [units] |
| n | Manning roughness coefficient [s/m1/3] |
| pk | Sample portion [-] |
| R | Seismic risk [-] |
| r | Soil factor [-] |
| Sa | Spectral acceleration [m/s2] |
| SS, S1 | Short- and Long-Period Spectral Accelerations [m/s2] |
| T | Fundamental period of the structure [s] |
| T0, TC | Limits of the period domain in which the spectral acceleration reaches its |
| maximum values [s] | |
| TL | Long-period transition period [s] |
| u | Velocity in x direction [m/s] |
| V | Vulnerability [-] |
| Z | Mapped design earthquake peak ground acceleration [-] |
| Zk | Critical value of the normal distribution at the required confidence level [units] |
| v | Velocity in y direction [m/s] |
| f | Wave height [m] |
| h | Ratio between the spectral acceleration at the structural period T = 0.1 s and the PGA for the selected return period [-] |
References
- Ayala-Pico, J.; Arcos-Aviles, D.; Ibarra, A.; Fernandez, C.; Guinjoan, F.; Martinez, W. Current development of electricity generation systems in the Galapagos Islands—Ecuador. Renew Energy Focus 2023, 46, 88–102. [Google Scholar] [CrossRef]
- Rodriguez, H. Proyecto de Energias Renovables para Galapagos-ERGAL. 2015. Available online: https://erc.undp.org/evaluation/documents/download/8624 (accessed on 10 May 2023).
- Naciones Unidas/CEPAL. Agenda 2030 y los Objetivos de Desarrollo Sostenible: Una oportunidad para América Latina y el Caribe. Available online: https://repositorio.cepal.org/bitstream/handle/11362/40155/24/S1801141_es.pdf (accessed on 2 August 2023).
- Ministerio de Energía y Recursos Naturales No Renovables. Plan Maestro de Electricidad 2018–2027. Quito, 2019. Available online: https://www.cnelep.gob.ec/wp-content/uploads/2020/01/Plan-Maestro-de-Electricidad-2018-2027.pdf (accessed on 15 July 2023).
- Keegan, D. Viabilidad Económica de la Implementación de Energía Fotovoltaica Residencial en la Isla San Cristóbal, Galápagos. Bachelor’s Thesis, Universidad San Francisco de Quito, Quito, Ecuador, 2021. [Google Scholar]
- Guanoluisa, R.; Arcos-Aviles, D.; Flores-Calero, M.; Martinez, W.; Guinjoan, F. Photovoltaic Power Forecast Using Deep Learning Techniques with Hyperparameters Based on Bayesian Optimization: A Case Study in the Galapagos Islands. Sustainability 2023, 15, 12151. [Google Scholar] [CrossRef]
- Cano, A.; Arévalo, P.; Jurado, F. A comparison of sizing methods for a long-term renewable hybrid system. Case study: Galapagos Islands 2031. Sustain. Energy Fuels 2021, 5, 1548–1566. [Google Scholar] [CrossRef]
- Icaza-Alvarez, D.; Jurado, F.; Tostado-Véliz, M.; Arevalo, P. Decarbonization of the Galapagos Islands. Proposal to transform the energy system into 100% renewable by 2050. Renew Energy 2022, 189, 199–220. [Google Scholar] [CrossRef]
- International Energy Agency. World Energy Outlook 2022, Paris. Available online: https://www.iea.org/reports/world-energy-outlook-2022 (accessed on 20 July 2023).
- International Energy Agency. Tracking Clean Energy Progress 2023, Paris. Available online: https://www.iea.org/reports/tracking-clean-energy-progress-2023 (accessed on 20 July 2023).
- Arcos-Aviles, D.; Pascual, J.; Marroyo, L.; Sanchis, P.; Guinjoan, F. Fuzzy Logic-Based Energy Management System Design for Residential Grid-Connected Microgrids. IEEE Trans. Smart Grid 2018, 9, 530–543. [Google Scholar] [CrossRef]
- Arcos-Aviles, D.; Pascual, J.; Guinjoan, F.; Marroyo, L.; García-Gutiérrez, G.; Gordillo-Orquera, R.; Llanos-Proaño, J.; Sanchis, P.; Motoasca, T.E. An Energy Management System Design Using Fuzzy Logic Control: Smoothing the Grid Power Profile of a Residential Electro-Thermal Microgrid. IEEE Access 2021, 9, 25172–25188. [Google Scholar] [CrossRef]
- Rodriguez, M.; Arcos-Aviles, D.; Martinez, W. Fuzzy logic-based energy management for isolated microgrid using meta-heuristic optimization algorithms. Appl. Energy 2023, 335, 120771. [Google Scholar] [CrossRef]
- Raturi, A.; Singh, A.; Prasad, R.D. Grid-connected PV systems in the Pacific Island Countries. Renew. Sustain. Energy Rev. 2016, 58, 419–428. [Google Scholar] [CrossRef]
- Qiblawey, Y.; Alassi, A.; ul Abideen, M.Z.; Banales, S. Techno-economic assessment of increasing the renewable energy supply in the Canary Islands: The case of Tenerife and Gran Canaria. Energy Policy 2022, 162, 112791. [Google Scholar] [CrossRef]
- Garabitos Lara, E.; Santos García, F. Review on viability and implementation of residential PV-battery systems: Considering the case of Dominican Republic. Energy Rep. 2021, 7, 8868–8899. [Google Scholar] [CrossRef]
- COE. The Path to a Carbon Free Island: Jeju-Republic of Korea. 2019. Available online: http://www.sustainablesids.org/wp-content/uploads/2019/01/COE-Case-Study-in-Sustainable-Energy-The-Path-to-a-Carbon-free-Island-Jeju-Republic-of-Korea-2019.pdf (accessed on 20 July 2023).
- Miara, A.; Macknick, J.E.; Vörösmarty, C.J.; Tidwell, V.C.; Newmark, R.; Fekete, B. Climate and water resource change impacts and adaptation potential for US power supply. Nat. Clim. Chang. 2017, 7, 793–798. [Google Scholar] [CrossRef]
- Federal Emergency Management Agency. Earthquake-Resistant Design Concepts: An Introduction to Seismic Provisions for New Buildings Second Edition (FEMA P-749/September 2022); FEMA: Washington, DC, USA, 2022. Available online: https://www.fema.gov/sites/default/files/documents/fema_p-749-earthquake-resistant-design-concepts_112022.pdf (accessed on 7 September 2023).
- Vizconde, A.; Delgado, R. Evaluación del Riesgo Sísmico de Edificaciones Existentes en la Isla Isabela, Galápagos. J. Sci. Res. Rev. Cienc. Investig. 2018, 3, 102–109. [Google Scholar]
- Balladares, G.; Serrano, M.; Vásquez, R. Análisis de las Amenazas Naturales y el grado de preparación de la población en la isla Santa Cruz, Galápagos. Rev. Cienc. Segur. Def. 2019, 4, 75–106. [Google Scholar]
- Renter, W. Pronóstico de tsunamis para las islas Galápagos. Acta Ocean Del. Pacífico 2013, 18, 151–161. [Google Scholar] [CrossRef]
- Contreras López, M. Riesgo de Tsunami en Ecuador. Ingenius 2008, 2, 68–75. [Google Scholar] [CrossRef]
- Contreras López, M. Cronología de Tsunamis en Ecuador desde 1586 a 2012. Técnica Rev. Las Agrocienc. 2013, 11, 50–59. [Google Scholar] [CrossRef]
- Chávez, D. Análisis de Riesgo de la Infraestructura en Puerto Ayora (Galápagos) Ante Amenazas Naturales, Sismo y Tsunami, para una Posible Instalación Técnica de Paneles Fotovoltaicos. Bachelor’s Thesis, Universidad de las Fuerzas Armadas ESPE, Sangolquí, Ecuador, 2023. [Google Scholar]
- Prunier, Y.; Chuet, D.; Nicolay, S.; Hamon, G.; Darnon, M. Optimization of photovoltaic panel tilt angle for short periods of time or multiple reorientations. Energy Convers. Manag. X 2023, 20, 100417. [Google Scholar] [CrossRef]
- Serrano-Guerrero, X.; Cantos, E.; Feijoo, J.-J.; Barragán-Escandón, A.; Clairand, J.-M. Optimal Tilt and Orientation Angles in Fixed Flat Surfaces to Maximize the Capture of Solar Insolation: A Case Study in Ecuador. Appl. Sci. 2021, 11, 4546. [Google Scholar] [CrossRef]
- ASCE/SEI. Minimum Design Loads and Associated Criteria for Buildings and Other Structures; ASCE/SEI: Reston, VA, USA, 2017. [Google Scholar] [CrossRef]
- Federal Emergency Management Agency. Rapid Visual Screening of Buildings for Potential Seismic Hazards: A Handbook, 3rd ed.; Federal Emergency Management Agency: Washington, DC, USA, 2015.
- Federal Emergency Management Agency. Guidelines for Design of Structures for Vertical Evacuation From Tsunamis. 2019. Available online: https://www.fema.gov/sites/default/files/2020-08/fema_earthquakes_guidelines-for-design-of-structures-for-vertical-evacuation-from-tsunamis-fema-p-646.pdf (accessed on 18 July 2023).
- Calderon, A.; Yepes-Estrada, C.; Celi, C.; Marrero, J.; Yepes, H.; Alarcón, F.; Ordoñez, J. Evaluación de Riesgo Sísmico para el Distrito Metropolitano de Quito. Quito, 2022. Available online: https://cloud-storage.globalquakemodel.org/public/wix-new-website/pdf-collections-wix/publications/TREQ%20deliverables/reports/TREQ_D261_Riesgo_Sismico_Quito_v1.00.pdf (accessed on 10 May 2023).
- Federal Emergency Management Agency. Risk Management Series: Primer for Design Professionals: Communicating with Owners and Managers of New Buildings on Earthquake Risk (FEMA 389/January 2004); FEMA: Washington, DC, USA, 2004; Available online: https://mitigation.eeri.org/files/fema389.pdf (accessed on 10 May 2023).
- Ansell, J.; Wharton, F. Risk: Analysis, Assessment, and Management, 1st ed.; John Wiley and Sons Ltd.: West Sussex, UK, 1992. [Google Scholar]
- Vahdat, K.; Smith, N.J. Multidisciplinary Integrated Tools in Seismic Risk Management. In Proceedings of the TG65 W065—Spec Track 18th CIB World Build Congress, Salford, UK, 10–13 May 2010; pp. 447–458. [Google Scholar]
- Davidson, R.; Shah, H. An Urban Earthquake Disaster Risk Index; Stanford University: Stanford, CA, USA, 1997; Available online: https://searchworks.stanford.edu/view/zy159jm6182 (accessed on 15 July 2023).
- Ministro de Desarrollo Urbano y Vivienda. Norma Ecuatoriana de la Construcción. Peligro Sísmico—Diseño Sismo Resistente. Quito, 2015. Available online: https://www.habitatyvivienda.gob.ec/documentos-normativos-nec-norma-ecuatoriana-de-la-construccion/ (accessed on 20 July 2023).
- Aguiar, R. Probabilistic seismic hazard analysis of Muisne hospital. Ciencia 2018, 19, 413–430. [Google Scholar] [CrossRef]
- Cardona, O.; Ordaz, M.; Reinoso, E.; Yamín, L.; Barbat, A. Enfoque integral para la evaluación probabilista del riesgo (CAPRA): Iniciativa internacional para la efectividad de la gestión del riesgo de desastre. In Proceedings of the Congreso Nacional de Ingeniería Sísmica, Granada, Spain, 18–20 May 2011; pp. 1–12. [Google Scholar]
- Cunalata Vásquez, F.E.; Caiza Sánchez, P.E. Estado del Arte de Estudios de Vulnerabilidad Sísmica en Ecuador. Rev. Politécnica 2022, 50, 55–64. [Google Scholar] [CrossRef]
- Paredes, I.; Pachar, B. Estudio de la Vulnerabilidad Sísmica de las ocho Estructuras del Midena, Mediante la Metodología fema p-154, y Propuesta de Reforzamiento Estructural en la Edificación más Vulnerable. Bachelor’s Thesis, Universidad de las Fuerzas Armadas ESPE, Sangolquí, Ecuador, 2019. [Google Scholar]
- Rodriguez, Y.; Aguilar, A.; Palazzo, G. Evaluación de la vulnerabilidad sísmica de un conjunto de edificios educacionales en Ecuador. In Proceedings of the 26th Jornadas Argentinas de Ingenierí, Estructural, Virtual, 10–14 May 2021. [Google Scholar]
- Behrens, J.; Løvholt, F.; Jalayer, F.; Lorito, S.; Salgado-Gálvez, M.A.; Sørensen, M.; Abadie, S.; Aguirre-Ayerbe, I.; Aniel-Quiroga, I.; Babeyko, A.; et al. Probabilistic Tsunami Hazard and Risk Analysis: A Review of Research Gaps. Front. Earth Sci. 2021, 9, 628772. [Google Scholar] [CrossRef]
- Instituto Oceanográfico y Antártico de la Armada. Mapa de Inundación por tsunami Puerto Baquerizo Moreno. Guayaquil, 2022. Available online: https://www.inocar.mil.ec/web/index.php/estudio-de-tsunamis (accessed on 15 August 2023).
- Instituto Geográfico Militar (IGM). Available online: http://www.geograficomilitar.gob.ec/ (accessed on 8 August 2023).
- Oishi, Y.; Imamura, F.; Sugawara, D. Near-field tsunami inundation forecast using the parallel TUNAMI-N2 model: Application to the 2011 Tohoku-Oki earthquake combined with source inversions. Geophys. Res. Lett. 2015, 42, 1083–1091. [Google Scholar] [CrossRef]
- Guerrero Castillo, A.M.; Sánchez, E.R. Evaluación de la amenaza por tsunami en poblaciones del sur, centro y norte del litoral pacífico colombiano. Boletín Científico CIOH 2019, 38, 10–25. [Google Scholar] [CrossRef]
- Gobierno Autónomo Descentralizado Municipal del Cantón Santa Cruz (GADMSC). Agenda de Reducción de Riesgo del Cantón Santa Cruz. (Terremoto y Tsunami). Santa Cruz, 2020. Available online: http://www.gadsantacruz.gob.ec/wp-content/uploads/2020/10/AGENDA-DE-REDUCCION-DE-RIESGOS-DEL-CANTON-SANTA-CRUZ.pdf (accessed on 5 May 2023).
- Bonilla, A.; Durán, G.; Bayón, M.; Santelices, C.; Villavicencio, J. Puerto Ayora (Galápagos): Entre el Turismo Internacional y la Expansión Mediante Redes Clientelares; FLASCO: Quito, Ecuador, 2020. [Google Scholar]
- Haro, A.; Sinde, I.; Durán, R.; Bonifaz, H.; Morales, E. Insights of the rapid vulnerability assessment of the city of Bahía de Caráquez in Ecuador. In Proceedings of the 2nd International Conference on Natural Hazards and Infrastructure, Chania, Greece, 23–26 June 2019; pp. 1–10. [Google Scholar]
- Ballesteros-Salazar, K.S.; Caizaguano-Montero, D.G.; Haro-Báez, A.G.; Toulkeridis, T. Case Study of the Application of an Innovative Guide for the Seismic Vulnerability Evaluation of Schools Located in Sangolquí, Interandean Valley in Ecuador. Buildings 2022, 12, 1471. [Google Scholar] [CrossRef]
- Yépez, F.; Yépez, O. Role of construction materials in the collapse of R/C buildings after Mw 7.8 Pedernales—Ecuador earthquake, April 2016. Case Stud. Struct. Eng. 2017, 7, 24–31. [Google Scholar] [CrossRef]
- Lanning, F.; Haro, A.G.; Liu, M.K.; Monzón, A.; Monzón-Despang, H.; Schultz, A.; Tola, A.; Diaz-Fanas, G.; Antonaki, N.; Nikolaou, S.; et al. EERI Earthquake Reconnaissance Team Report: M7.8 Muisne, Ecuador Earthquake on April 16, 2016; Earthquake Engineering Research Institute (EERI): Oakland, CA, USA, 2016. [Google Scholar]
- Igualt, F. Evaluación de vulnerabilidad física y adaptabilidad post-tsunami en Concón, zona central de Chile. Rev. AUS 2017, 30, 53–58. [Google Scholar] [CrossRef]
- Cacuango, D.; Guilcaso, B.; Sailema, W. Evaluación de la Resistencia a Sismos y Tsunamis de Edificaciones Existentes en Manta en Manabí. Bachelor’s Thesis, Universidad de las Fuerzas Armadas ESPE, Sangolquí, Ecuador, 2021. [Google Scholar]
- Cano, M.; Dávila, C. Consideraciones Sísmicas para la Instalación de Sistemas Fotovoltaicos en Terrazas Planas de Hormigón Armado: ESTUDIO de caso. Bachelor’s Thesis, Universidad de las Fuerzas Armadas ESPE, Sangolquí, Ecuador, 2021. [Google Scholar]


| Seismic Zone | I | II | III | IV | V | VI |
|---|---|---|---|---|---|---|
| Z factor 1 | 0.15 | 0.25 | 0.30 | 0.35 | 0.40 | 0.50 |
| Seismic hazard characterization | Intermediate | High | High | High | High | Very High |
| Variable | Definition | Value | Units |
|---|---|---|---|
| Z | Mapped design earthquake peak ground acceleration | 0.30 | g |
| Fa | Soil amplification coefficient considering site effects | 1.25 | - |
| Fd | Soil amplification coefficient considering displacement | 1.19 | - |
| Fs | Soil amplification coefficient considering soil behavior | 1.02 | - |
| To, Tc | Limits of the period domain in which the spectral acceleration reaches its maximum values | 0.10 0.53 | s s |
| TL | Long-period transition period | 2.86 | s |
| Seismicity Region | Spectral Acceleration Response Ss (Short Period or 0.2 s) | Spectral Acceleration Response S1 (Long Period or 1.0 s) |
|---|---|---|
| Low | Ss < 0.250 g | S1 < 0.100 g |
| Moderate | 0.250 g ≤ Ss < 0.500 g | 0.100 g ≤ S1 < 0.200 g |
| Moderate-High | 0.500 g ≤ Ss < 1.000 g | 0.200 g ≤ S1 < 0.400 g |
| High | 1.000 g ≤ Ss < 1.500 g | 0.400 g ≤ S1 < 0.600 g |
| Very High | Ss ≥ 1.500 g | S1 ≥ 0.600 g |
| Typology | Description | Quantity Buildings | Vulnerability | Percentage of Buildings |
|---|---|---|---|---|
| C1/C3 | CMRF-CFUM | 257 | High: 0–2 | 49.71% |
| S3/C1/C3 | LMF-CMRF-CFUM | 58 | High: 0–2 | 11.22% |
| S3/C3/URM | LMF-CFUM-UMWB | 21 | High: 0–2 | 4.06% |
| S3/S5 | LMF-SFUM | 3 | High: 0–2 | 0.58% |
| URM/C3 | UMWB-CFUM | 1 | High: 0–2 | 0.19% |
| URM/S3 | UMWB-LMF | 4 | High: 0–2 | 0.77% |
| URM/S3/S5 | UMWB-LMF-SFUM | 2 | High: 0–2 | 0.39% |
| W1 | LWF | 1 | High: 0–2 | 0.19% |
| 2 | Low: >2 | 0.39% | ||
| W1/C1/C3 | LWF-CMRF-CFUM | 63 | High: 0–2 | 12.19% |
| W1/C3/URM | LWF-CFUM-UMWB | 76 | High: 0–2 | 14.70% |
| W1/S3 | LWF-LMF | 1 | Low: >2 | 0.19% |
| W1/S3/S5 | LWF-LMF-SFUM | 1 | High: 0–2 | 0.19% |
| W1/URM | LWF-UMWB | 27 | High: 0–2 | 5.22% |
| TOTAL | 517 | 100.00% |
| Vulnerability | Structures Quantity | Actions to Take |
|---|---|---|
| Structures that do not exceed the limit of ≥2 | 514 | Requires a detailed assessment |
| Structures that exceed the limit of ≥2 | 3 | Non-vulnerable structures |
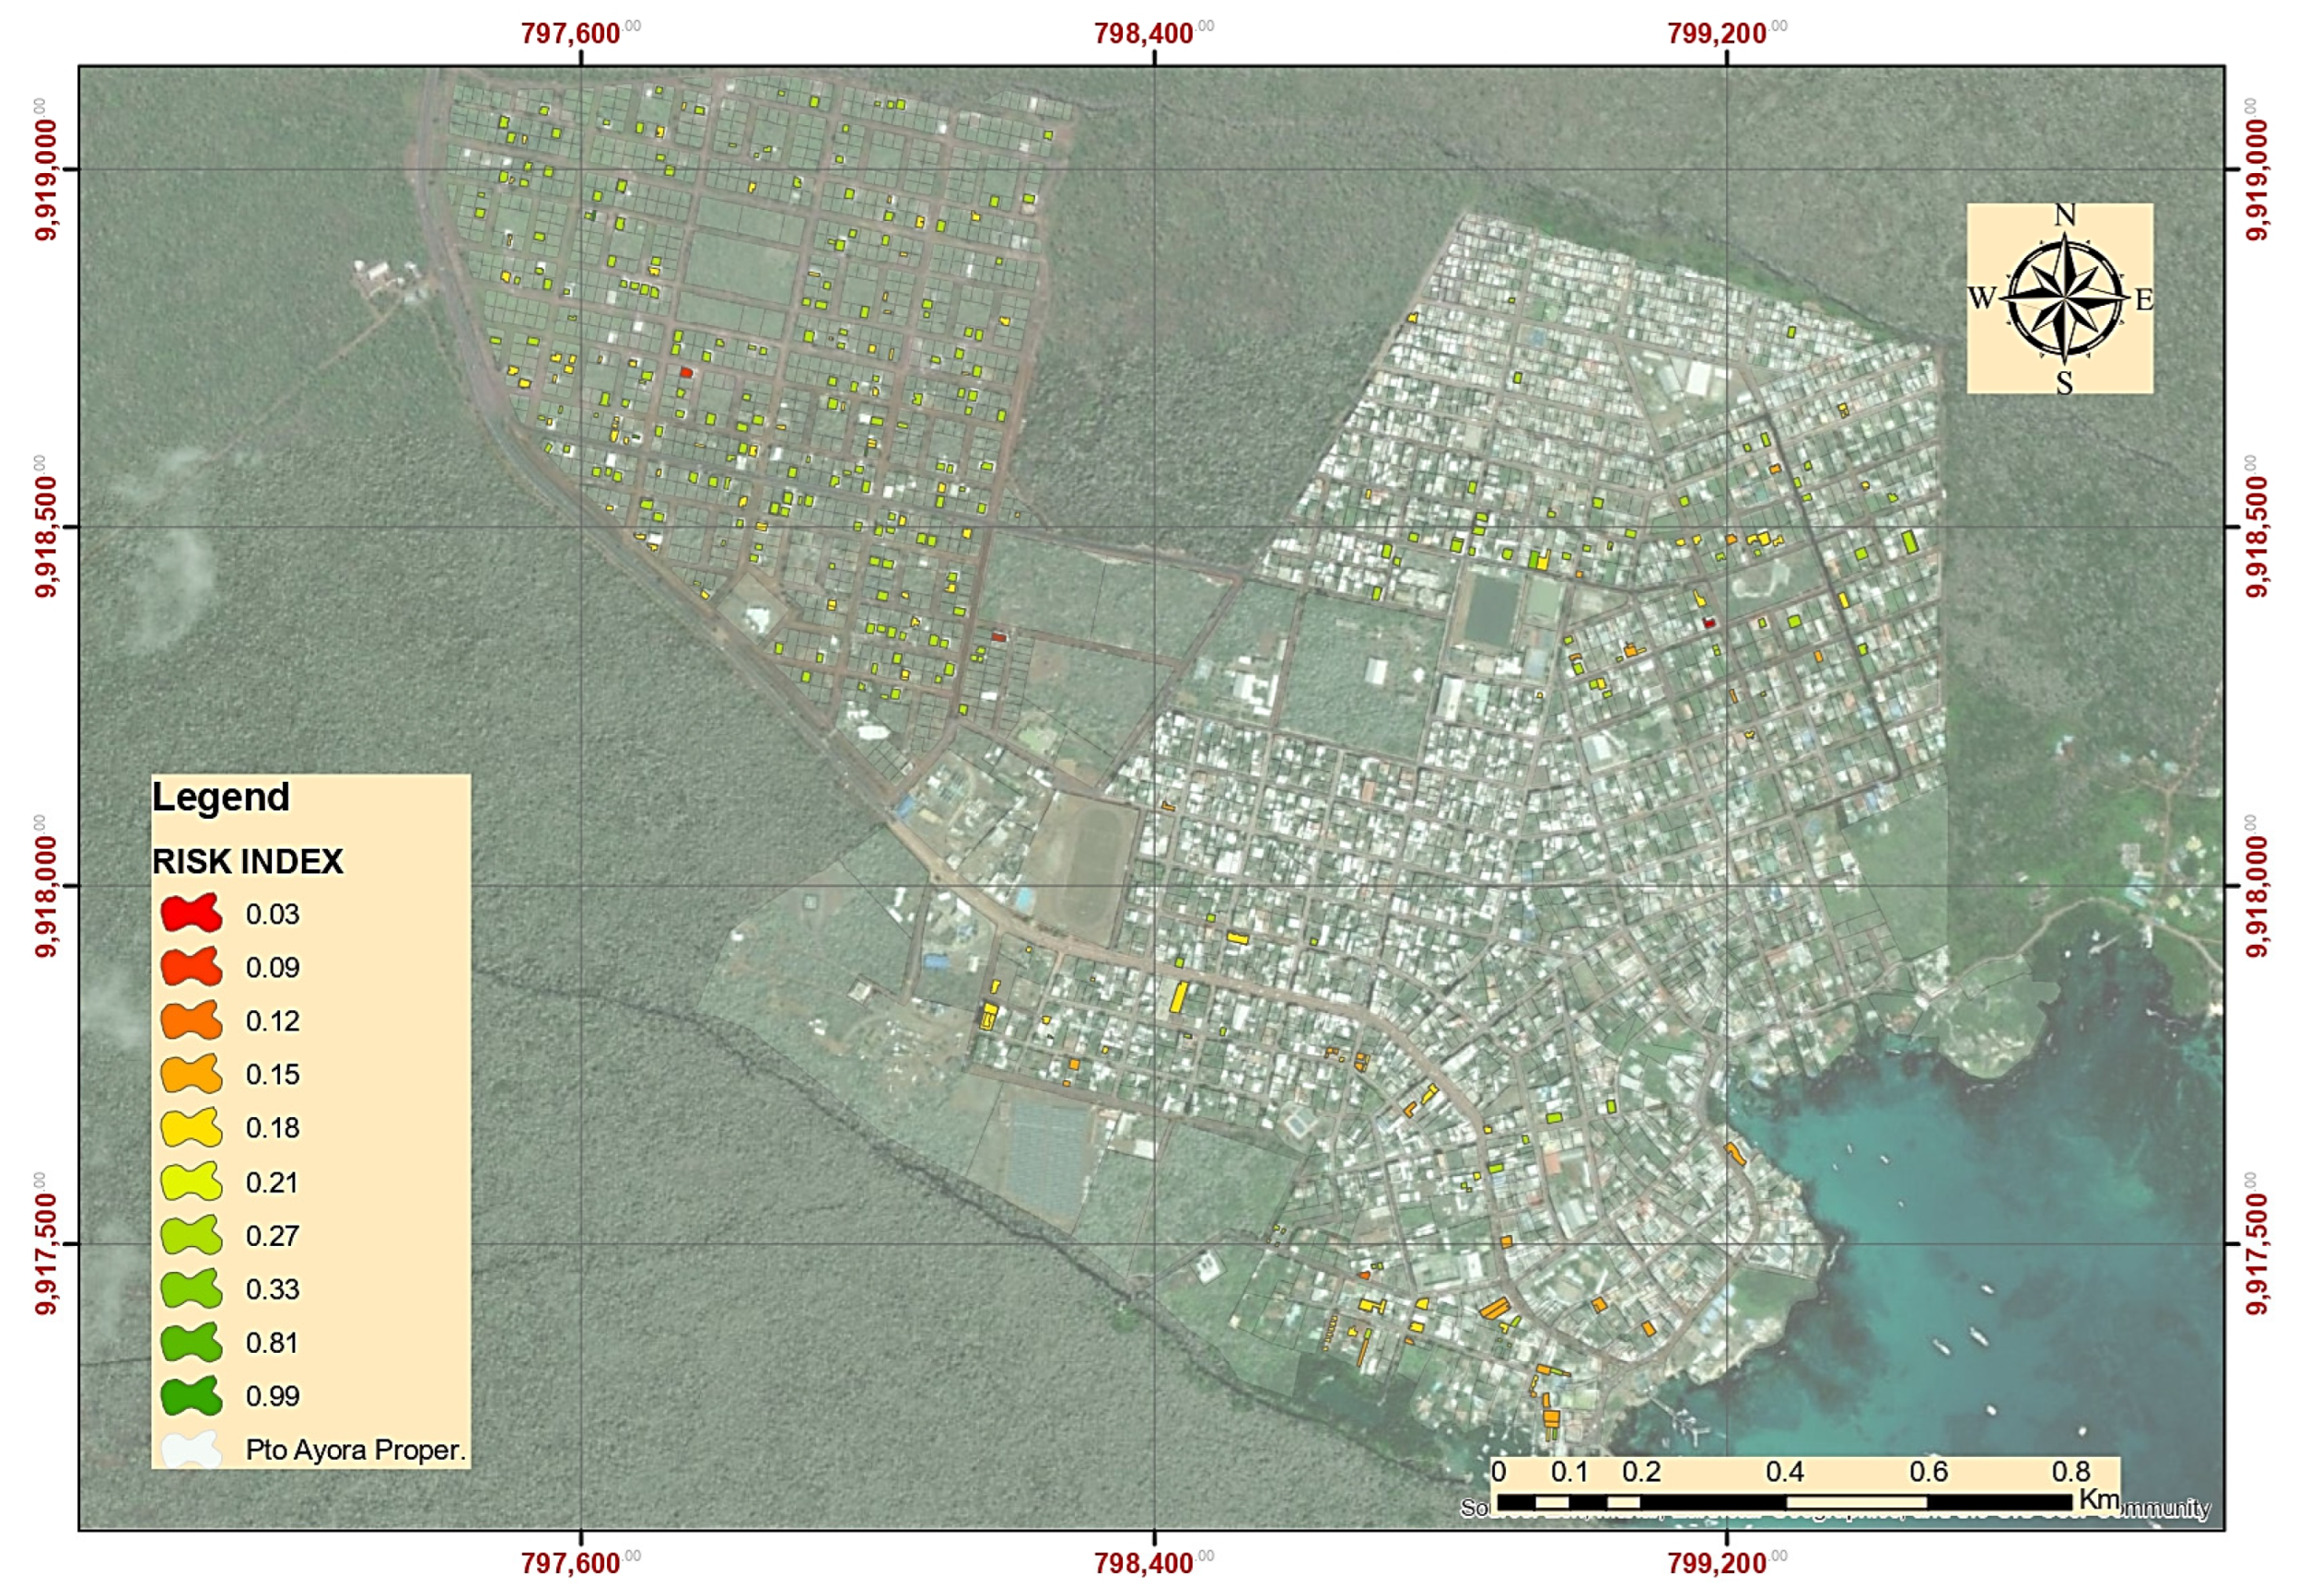
| Risk Index R = H × E × V | Number of Buildings | Percentage of Buildings |
|---|---|---|
| 0.03 | 3 | 0.58% |
| 0.09 | 4 | 0.77% |
| 0.12 | 2 | 0.39% |
| 0.15 | 69 | 13.35% |
| 0.18 | 132 | 25.53% |
| 0.21 | 3 | 0.58% |
| 0.27 | 299 | 57.83% |
| 0.33 | 2 | 0.39% |
| 0.81 | 1 | 0.19% |
| 0.99 | 2 | 0.39% |
| TOTAL | 517 | 100.00% |
Disclaimer/Publisher’s Note: The statements, opinions and data contained in all publications are solely those of the individual author(s) and contributor(s) and not of MDPI and/or the editor(s). MDPI and/or the editor(s) disclaim responsibility for any injury to people or property resulting from any ideas, methods, instructions or products referred to in the content. |
© 2023 by the authors. Licensee MDPI, Basel, Switzerland. This article is an open access article distributed under the terms and conditions of the Creative Commons Attribution (CC BY) license (https://creativecommons.org/licenses/by/4.0/).
Share and Cite
Haro-Baez, A.G.; Chavez, D.; Camino, C.; Arcos-Aviles, D. Seismic and Tsunami Risk Analysis for Installing Resilient Power Systems Based on Isolated Microgrids on Buildings: The Case of Puerto Ayora in Santa Cruz Island, Galapagos. Sustainability 2023, 15, 13769. https://doi.org/10.3390/su151813769
Haro-Baez AG, Chavez D, Camino C, Arcos-Aviles D. Seismic and Tsunami Risk Analysis for Installing Resilient Power Systems Based on Isolated Microgrids on Buildings: The Case of Puerto Ayora in Santa Cruz Island, Galapagos. Sustainability. 2023; 15(18):13769. https://doi.org/10.3390/su151813769
Chicago/Turabian StyleHaro-Baez, Ana Gabriela, Diego Chavez, Cristina Camino, and Diego Arcos-Aviles. 2023. "Seismic and Tsunami Risk Analysis for Installing Resilient Power Systems Based on Isolated Microgrids on Buildings: The Case of Puerto Ayora in Santa Cruz Island, Galapagos" Sustainability 15, no. 18: 13769. https://doi.org/10.3390/su151813769
APA StyleHaro-Baez, A. G., Chavez, D., Camino, C., & Arcos-Aviles, D. (2023). Seismic and Tsunami Risk Analysis for Installing Resilient Power Systems Based on Isolated Microgrids on Buildings: The Case of Puerto Ayora in Santa Cruz Island, Galapagos. Sustainability, 15(18), 13769. https://doi.org/10.3390/su151813769