Article

River Flood Risk Assessment in Communities of the Peruvian Andes: A Semiquantitative Application for Disaster Prevention

by
Dennis Ccopi-Trucios
1,
Brissette Barzola-Rojas
1,
Sheyla Ruiz-Soto
1,
Edwin Gabriel-Campos
1,2,*,
Kevin Ortega-Quispe
1 and
Franklin Cordova-Buiza
3,4
1
Faculty of Engineering, Professional School of Environmental Engineering, Universidad Continental, Huancayo 12000, Peru
2
Academic Department of Geographic Sciences, Universidad Nacional Mayor de San Marcos, Lima 15081, Peru
3
Research, Innovation, and Social Responsibility Department, Universidad Privada del Norte, Lima 15314, Peru
4
Faculty of Business Sciences, Universidad Católica Santo Toribio de Mogrovejo, Chiclayo 14012, Peru
*
Author to whom correspondence should be addressed.
Sustainability 2023, 15(18), 13768; https://doi.org/10.3390/su151813768
Submission received: 30 July 2023 / Revised: 10 September 2023 / Accepted: 11 September 2023 / Published: 15 September 2023

Abstract

:
River floods are common natural phenomena that occur when the flow of water exceeds the capacity of a river due to excessive rainfall. In the Peruvian territory, the heavy rains of 2010 had consequences of great magnitude, leaving more than 5000 people affected and 25 dead in the Peruvian Andes. This research aimed to analyze and determine the level of risk due to river floods in communities of the Peruvian Andes in terms of hazard and vulnerability, using a semi-quantitative methodology and applying a multi-criteria analysis with vector information and raster from the national spatial data infrastructure that acted as triggering and conditioning factors, as well as conducting fieldwork with the application of targeted surveys. Then, the geoprocessing of thematic maps through GIS software was carried out. The research findings indicate that virtually the entire study area, approximately 99.26%, is at a high level of hazard, with only a small 0.74% classified as very high hazard. In other words, the entire studied territory is susceptible to floods. Furthermore, it is noteworthy that over 75% of the households in this area face vulnerability to floods, resulting in 99.15% of them being categorized at a high-risk level. It is concluded that river flooding represents a potential risk in large areas of the high Andean community due to the existence of various social, economic and environmental factors that make this phenomenon catastrophic.

1. Introduction

River floods are common natural phenomena that occur when the flow of water exceeds the capacity of a river’s cross-section due to excessive rainfall [1], as well as the collapse of infrastructure, seasonal snowmelt and floods associated with volcanic eruptions; but, there are also other social agents responsible for the generation of these phenomena, such as changes in soil cover caused by anthropic activities, dumping of waste, debris, inappropriate soil management, deforestation and urbanization, as well as inadequate channeling of rivers, which leads to a reduction in the infiltration capacity of the soil and evacuation of the rivers [2,3].
Sustainability and disaster risk management converge in their shared focus on mitigating vulnerabilities in communities and systems, with special emphasis on the context of disaster risks such as floods. Sustainability drives resilience and adaptation, crucial aspects for addressing both current and looming challenges, including the threat of flooding [4]. Risk management, on the other hand, is directly dedicated to strengthening community resilience to the possibility of floods and other disturbances, which aligns with the broader goal of ensuring sustainable development over time [5].
River floods have caused the greatest loss of human life in recent years [5] and are also one of the main causes of economic collapse in several countries worldwide [2,5]. The Center for Research on the Epidemiology of Disasters (CRED) reported that among the countries affected by floods in 2018 were China, India and the United States [6]. Among the most important events that have occurred in the world, it is worth mentioning the sequence of floods that hit southern Germany in the months of May and June 2016, which caused total losses of 3.2 billion dollars. In 2020, the flooding of the Yangtze River (China) caused the flooding of some cities, affecting 26 million people and causing significant economic losses [7,8,9,10]. Another relevant case occurred in Mexico, where, from 1971 to 2001, 27 floods were reported that became disasters, causing the death of 4941 people, affecting 1,906,148 people and causing millions of dollars in material damage [11]. Moreover, the number of incidents caused by floods has increased at an alarming rate in the world, especially in rural and urban areas, negatively affecting the normal functioning of the different economic sectors and making the populations with fewer resources more vulnerable [12].
In Peru, the intense rainfall in 2010 had major consequences in 11 of the country’s departments. The results of these rains resulted in landslides, significant increases in river flows, the devastation of homes and damage to communication routes. The hardest hit departments in the high Andean regions include Ancash, Junín, Ayacucho, Arequipa, Cusco, Huancavelica, Puno and Apurímac, where 25 people died, 385 houses collapsed and more than 5000 people were affected [13].
At the Third World Conference of the United Nations, the Sendai Framework (2015–2030) was adopted with the objective of mitigating disaster risks, prioritizing the integration of risk assessment, mapping and management in planning and development in areas prone to catastrophic events of natural or anthropogenic origin [14]. In the Andean communities of central Peru, where geological and geo-hydrological hazards are recurrent, it is imperative to implement preventive measures due to the interaction between geographical factors (geology, soil types, vegetation cover, slope) and triggering factors (rainfall) that culminate in natural phenomena and disasters, with direct impacts on the population, infrastructure and economy. In this region, mass movements and floods have been recorded, as in the case of the landslide on the Mantaro River in 2014, whose detrimental effects reached both the infrastructure and the local economy [15,16,17,18].
The problem at the local level is critical because, in the lower areas of the basins of the Andean Communities of Central Peru, there are various types of risks [19] that have not been considered by the competent authorities. Likewise, these localities share similar geographical features, such as rugged topography, steep slopes, vegetation cover, mountains and water bodies, as well as related natural elements, which generate more risks for socioeconomic infrastructures, agricultural fields and economic activities that need to be addressed through preventive and corrective management tools.
From all of the above, it is understood that these disasters and the possible manifestation of harmful situations resulting from the omission of various decisions or actions of social agents are based on and used in several theories [20], where it is argued that disasters are not the result of unexpected situations or random events but are related to risk conditions that have been socially created [19,20]. Therefore, these are deduced by assuming vulnerability to hazards, where the latter is the probability of a disaster occurring, and risk is assumed by the probability of damage from that disaster [20], while vulnerability to floods refers to the degree of susceptibility of an area to be affected by them, which is determined by the exposure and disturbance of the environment, as well as the capacity or inability of the area to cope with, recover from or adapt to the phenomenon [21,22].
The river flood risk assessment identifies the critical areas most vulnerable to this type of disaster and provides improved management support to decision makers to improve the resilience (the ability to adapt to return to its original form in the shortest possible time) of mitigation plans to reduce the risks generated by floods in the region, causing river overflows and bringing harmful effects [23]. These effects are the damage caused to infrastructure, crops, economy and the health of the different inhabitants of the Andean communities of Peru.
Other studies in Andean areas of interest have focused on agricultural production with different types of crops, such as native potatoes, quinoa, maize and some Andean crops [12,13], diagnoses of the natural landscape, tourism and social and cultural areas [24,25,26] and structural, geological and geomorphological assessments [27,28,29]. However, studies related to river flood risks in communities have not been developed as a fundamental part of previous research [30]; therefore, this research proposes to fill this knowledge gap.
This research seeks to address the risk of river flooding in high Andean communities in Peru. It uses climatic and geographic information to identify high-risk areas and contribute to the prevention of economic, social and environmental damage. The key question is: What are the levels of fluvial flood risk in the Andean communities settled near the Mantaro River? To this end, the study combines hazard and vulnerability assessments through surveys and an analysis of factors such as geomorphology, vegetation, geology and precipitation. A Saaty multi-criteria analysis is used to obtain results. The purpose of the study is to lay the foundation for risk management in these flood-prone areas [31,32,33,34].
The multi-criteria analysis process is an essential tool in the evaluation of relationships between hierarchical elements, proving very useful in decision making. Its approach is based on establishing the relative importance of criteria by comparing pairs, using a scale of values from one to nine, following Saaty’s methodology. These comparisons are organized in a matrix known as a pairwise comparison matrix, in which values are assigned to the elements based on the aforementioned scale. The matrix is then completed by columns, allowing each criterion to be compared in relation to the others. In this way, the priorities are synthesized and an evaluation of the coherence of the analysis is obtained, thus enriching the decision-making process [34,35,36].

2. Materials and Methods
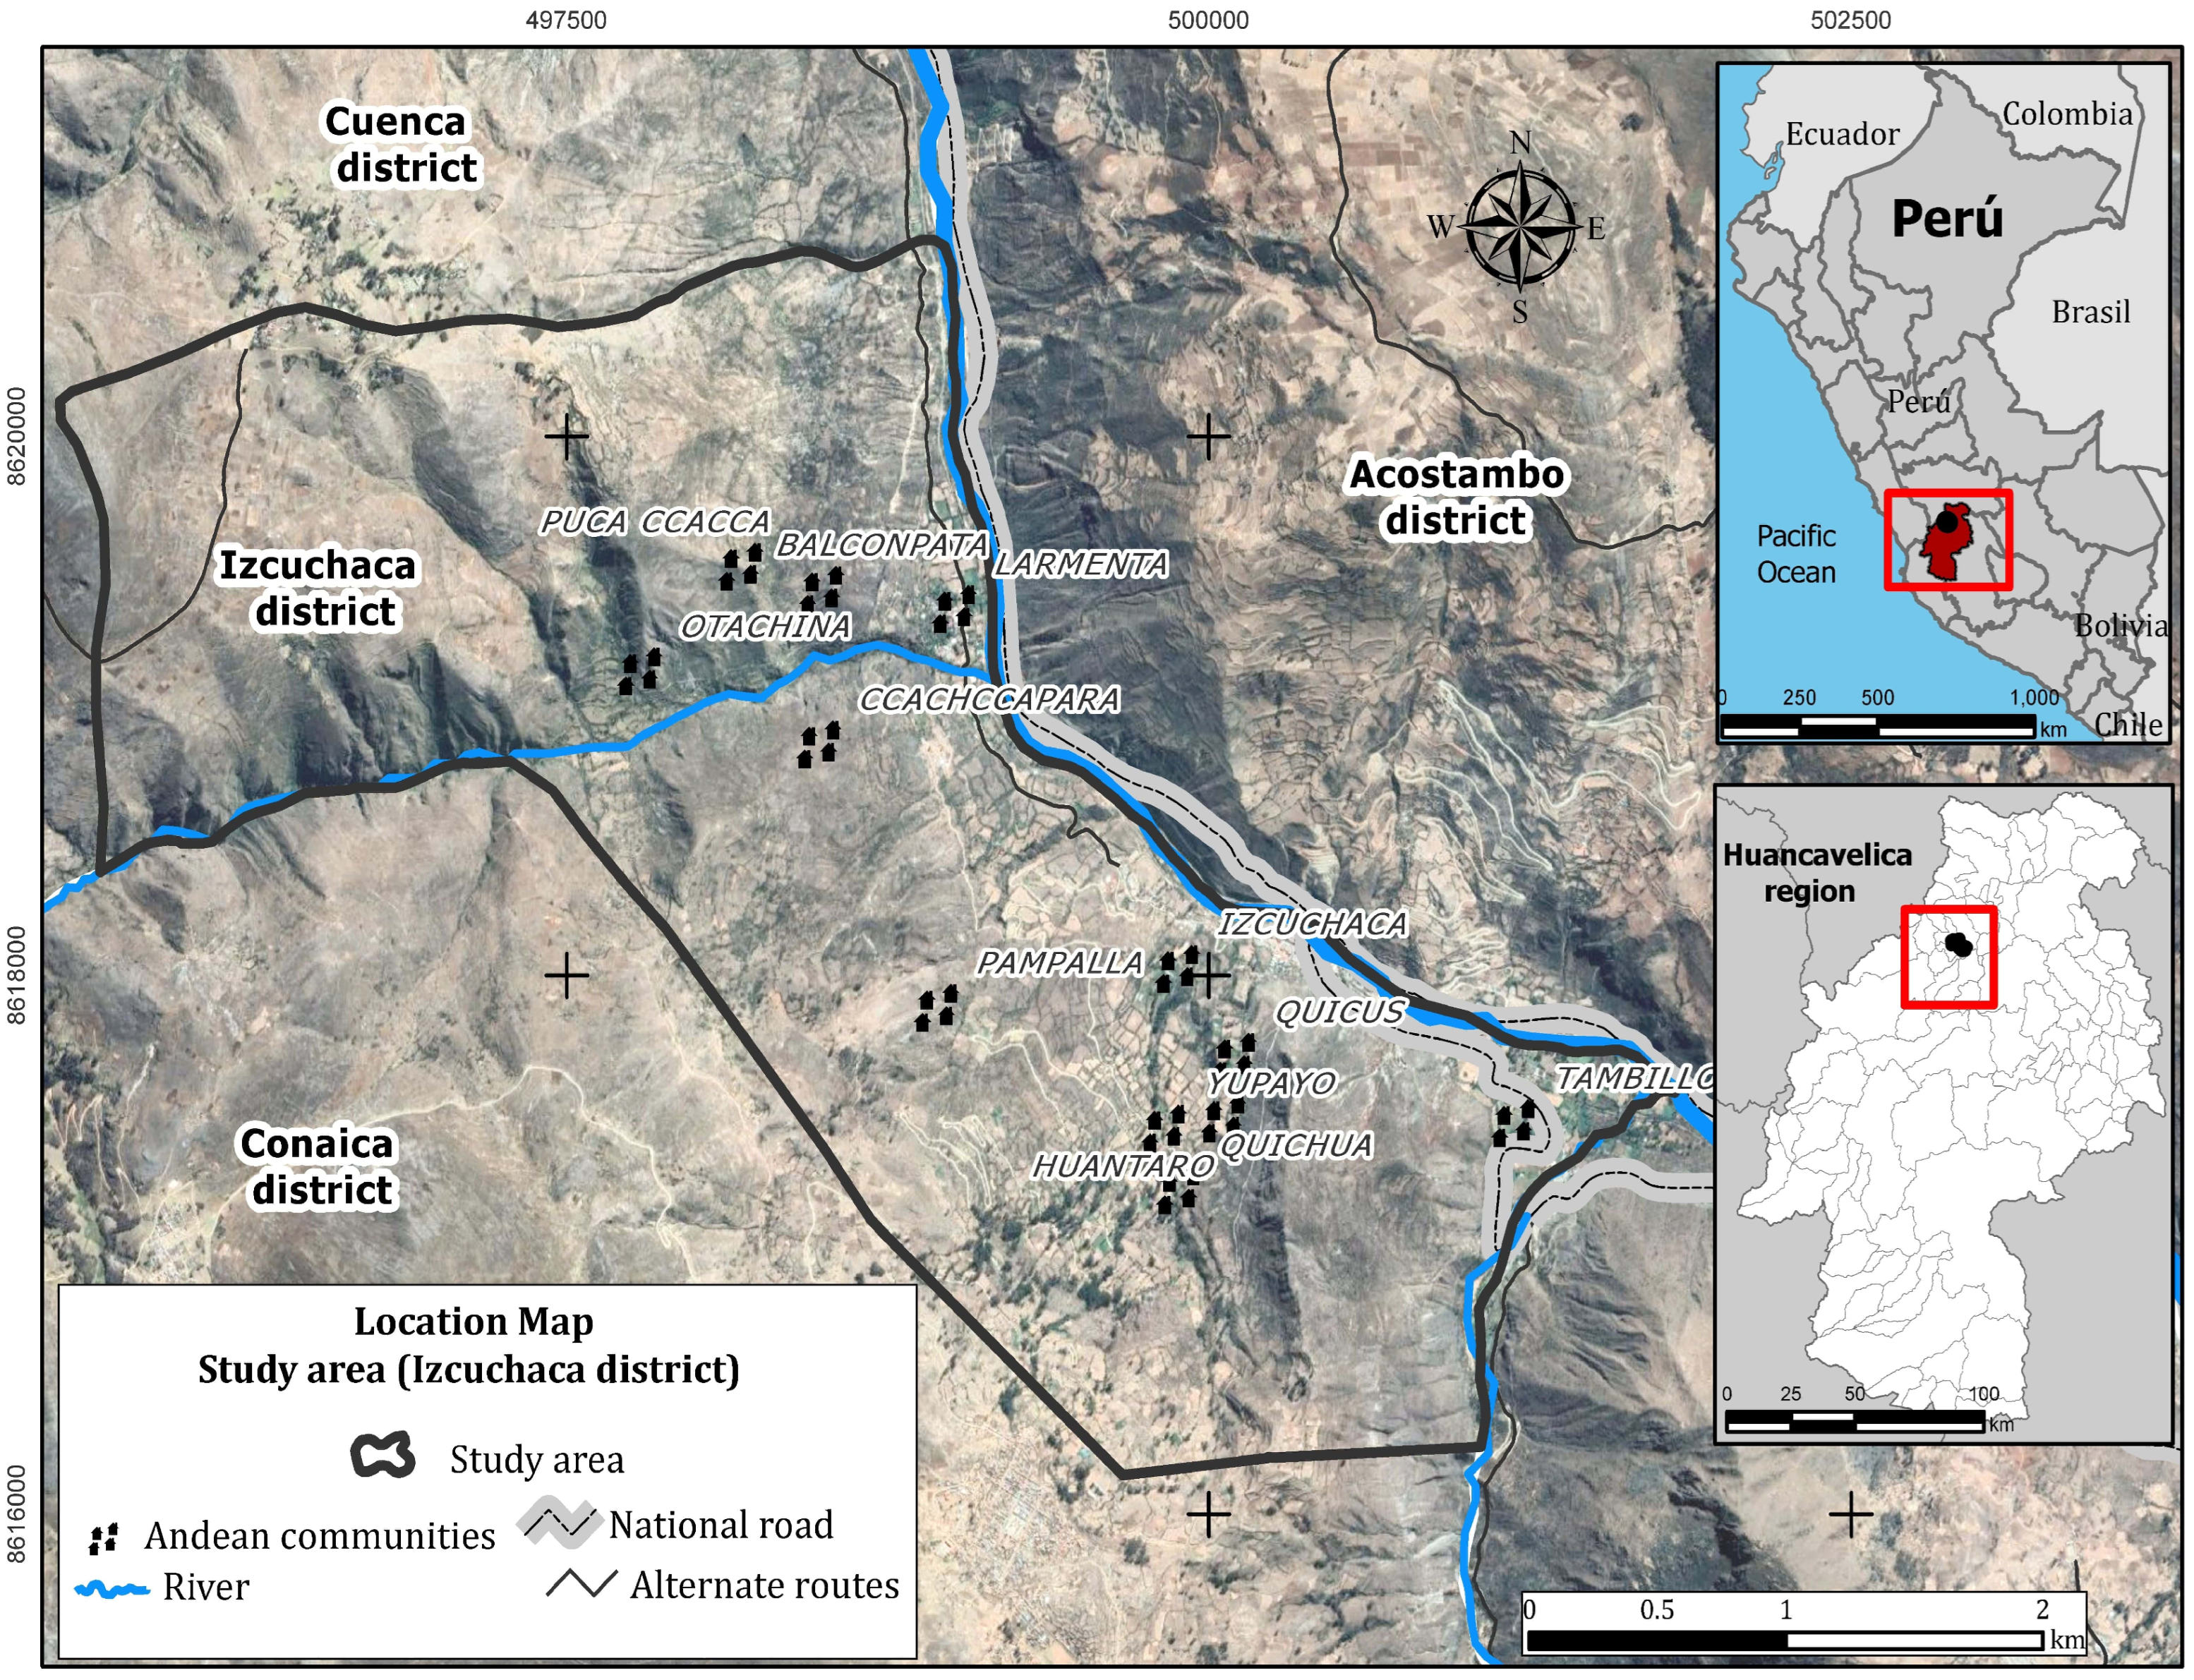
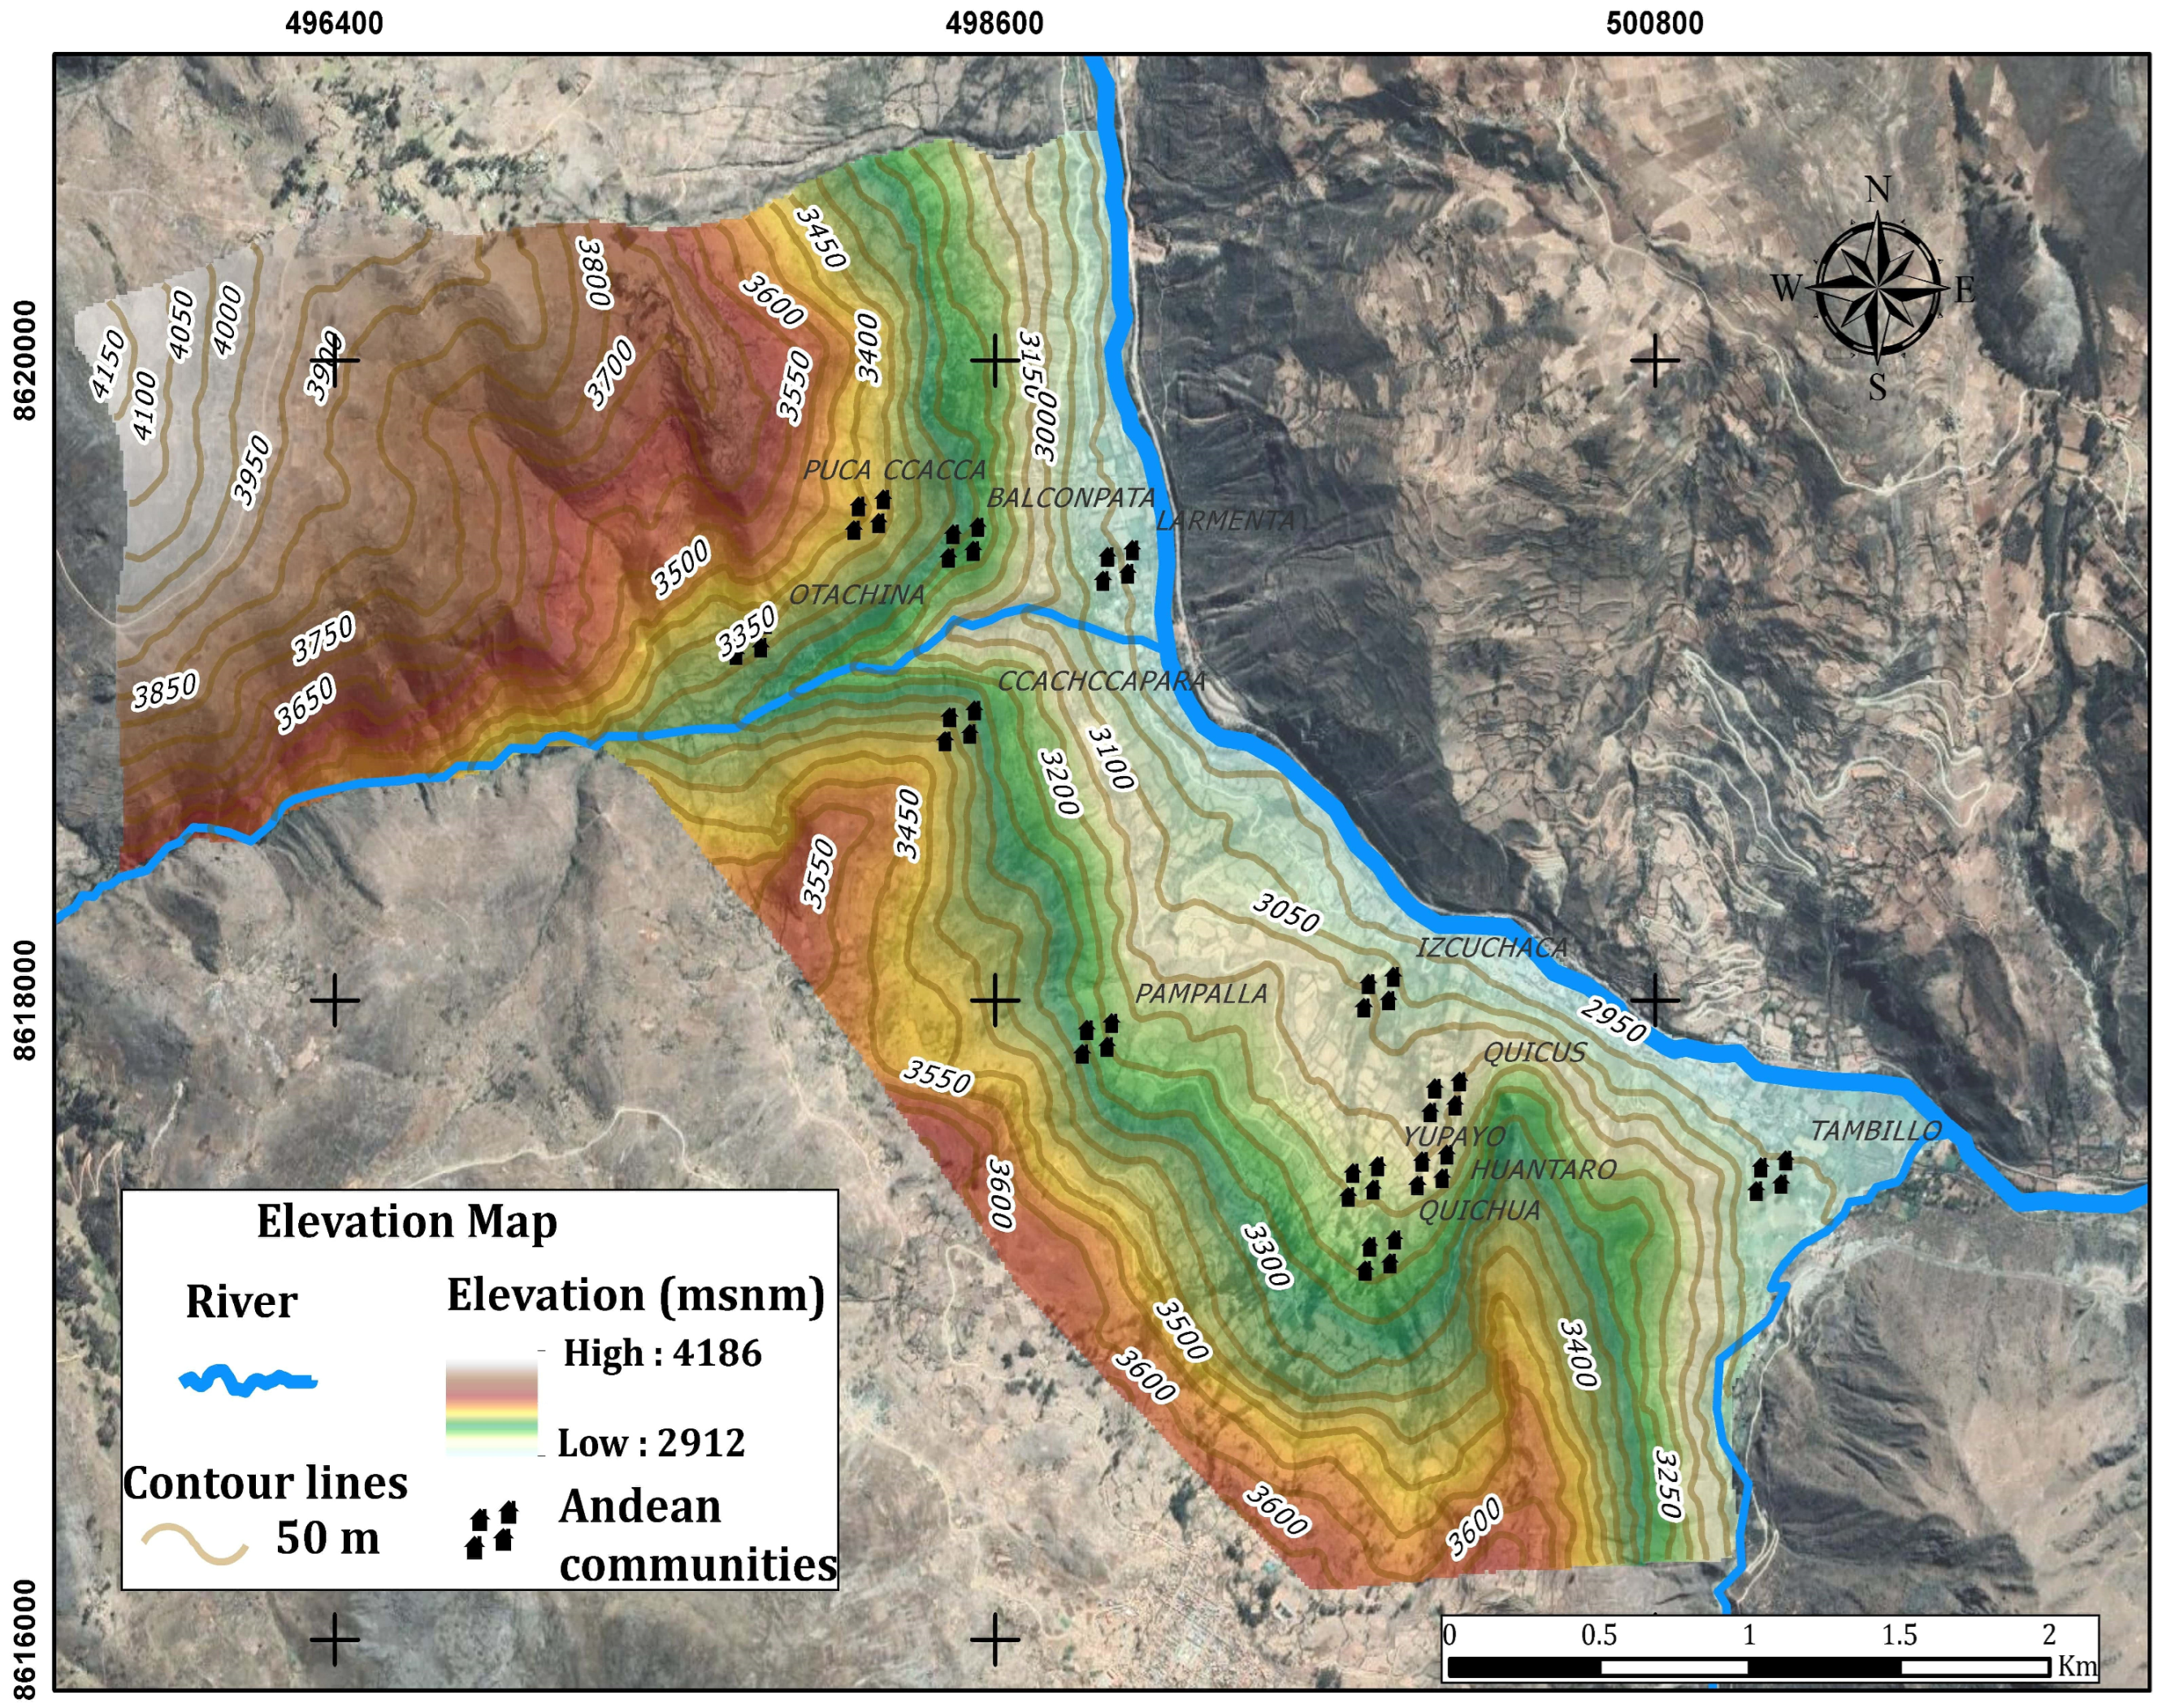
2.1. Study Area

The Andean Communities of Izcuchaca, called “Puerto del Mantaro”, is in the north of Huancavelica region and borders other nearby districts, bordering Cuenca to the north, Huando to the south, Acostambo to the east and Conayca to the west (Figure 1). It also has an average altitude of 2930 m above sea level and has three communities within its jurisdictional organization: Quichua, Tambillo and Larmenta, reaching around 12.19 km2 [37]. It has a population of 846 inhabitants, according to the last census of 2017. Izcuchaca has a warm and temperate climate, with an average annual rainfall of 693.6 mm [23].

2.2. Data Collection
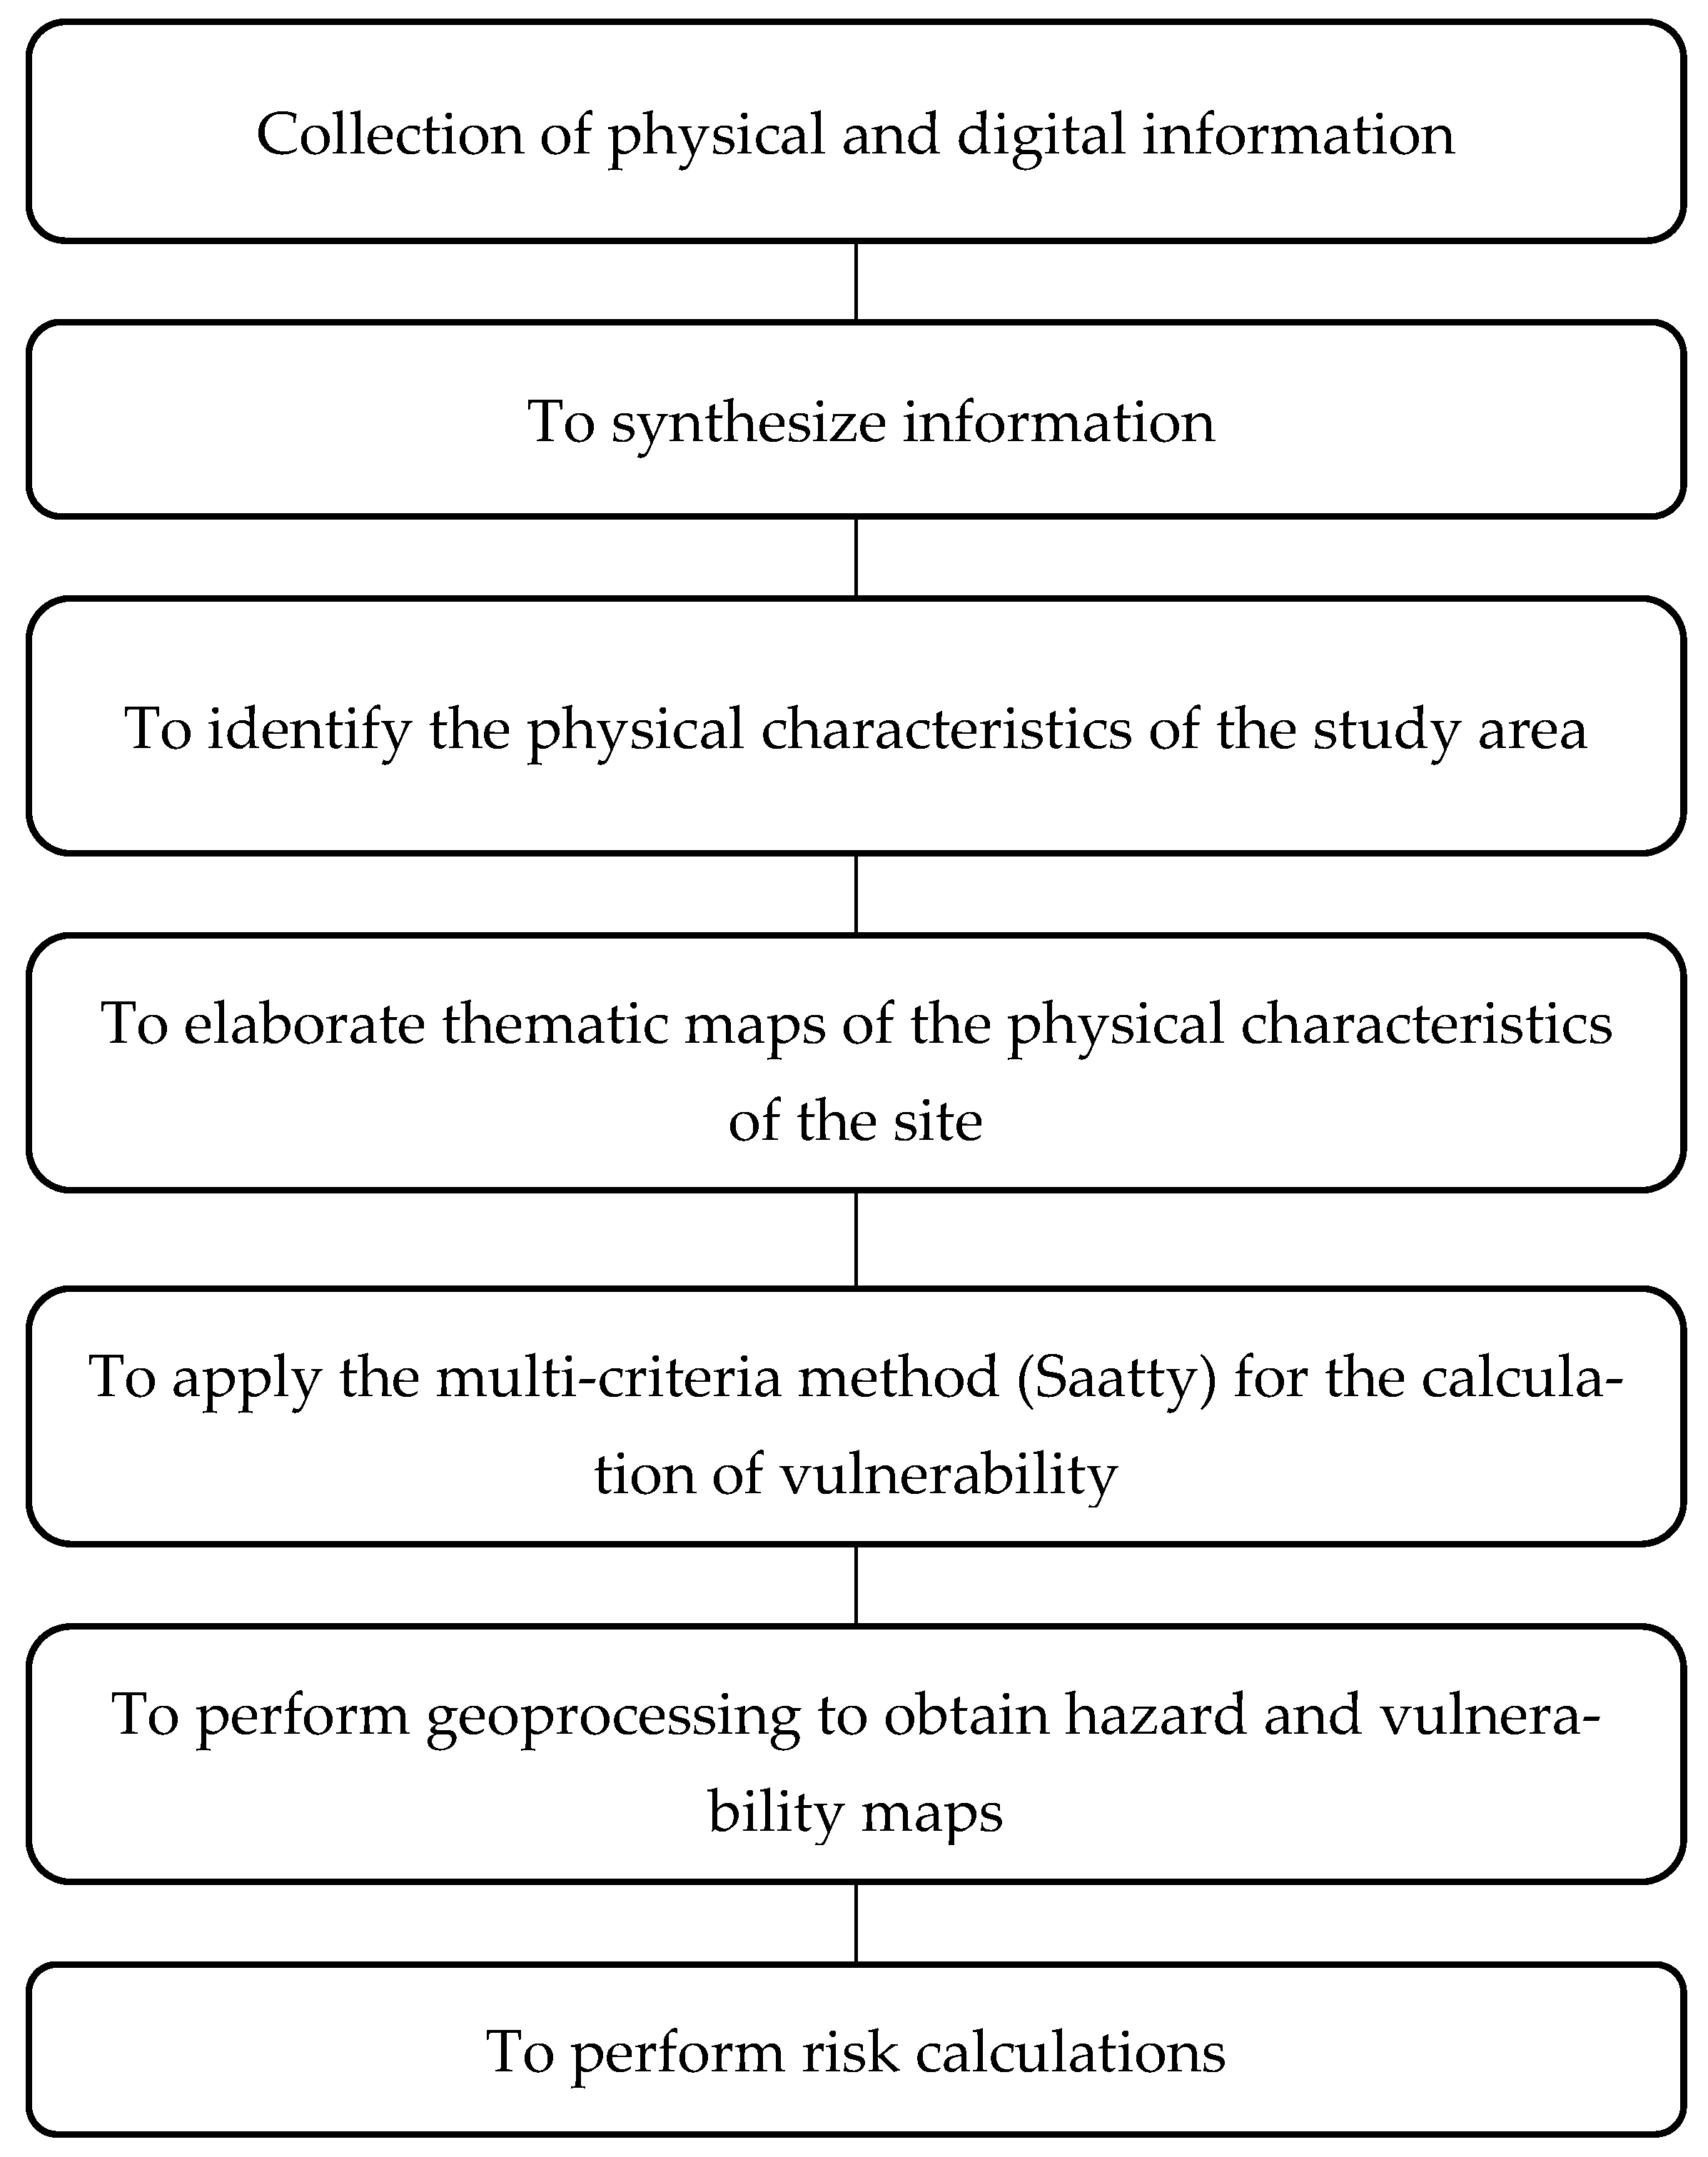
The methodological process required the use of vector and raster layers for processing by GIS software, which were extracted from the spatial data infrastructure portals of Peruvian public institutions: Geocatmin (https://geocatmin.ingemmet.gob.pe/geocatmin/, accessed on 4 April 2023), a portal of the Geological, Mining, and Metallurgical Institute, used for the extraction of vector layers of geology and geomorphology; for the extraction of precipitation data, the portal of the National Service of Meteorology and Hydrology of Peru (SENAHMI -IDESEP) was used to identify the months when there is more precipitation in Izcuchaca. Likewise, the portal of the Ministry of Environment was used (https://geoservidor.minam.gob.pe/recursos/intercambio-de-datos/, accessed on 4 April 2023), from which national base layers were extracted, such as rivers, streams, district and regional boundaries and road networks, among others. Therefore, it is necessary to know the slope and the terrain under study, this being a common parameter to consider for disaster risk management. Hence, this raster layer (DEM) was extracted through the EarthData portal, this being a product offered by the Alaska Satellite Facility. The DEM obtained has a pixel resolution of 12.5 m, and, from this raster, the contour lines and the slope map shown in Figure 2 were generated, this being the base material for further processing.

2.3. Methodology

The research method used in this study is descriptive because the research objective is to describe phenomena, situations, backgrounds and events related to the risk of flooding [38,39], and to describe the level of risk for the communities of Izcuchaca. Through the investigation, we seek to detail in depth the characteristics and profiles of risk in the face of natural and/or environmental phenomena known as floods.
The analytic hierarchy process (AHP), conceived by Saaty in 1977 and subsequently validated in 1996, represents a decision-making technique specifically designed to prioritize options in scenarios involving multiple criteria. This approach provides decision makers with the ability to structure the problem hierarchically or into a series of interconnected levels, encompassing the goal, criteria and alternatives. The primary advantage of AHP lies in its use of one-to-one comparisons, enabling the establishment of a ratio-based measurement scale. Ratio-based scales naturally emerge as a means to assess and compare the various available options [40,41].
Undoubtedly, Saaty’s multicriteria analysis represents a structured approach that facilitates the quantitative and data-based identification of areas with potential flood risk [42,43]. This method breaks down the process into several hierarchical levels [42,43] with the purpose of establishing a clear goal and breaking it down into specific criteria, to which numerical weights are assigned [44]. As illustrated in Table 1, these weights reflect the relative importance of each criterion in the evaluation. Furthermore, this method involves pairwise comparison of the criteria through a square matrix, where the rows and columns correspond to the number of criteria considered. The process is divided into three essential components: hazard (encompassing the probability or threat of floods), vulnerability (considering susceptibility to damage) and risk (combining hazard and vulnerability) [44,45,46].
In the study conducted in the Andean community of Izcuchaca, the Saaty multicriteria analysis methodology was applied to assess the risk of floods. Conditioning factors such as geomorphology, slope, vegetation cover and geology were taken into account [47]. During the process, numerical weights were determined for these conditioning factors through pairwise comparisons, reflecting their relative importance in relation to the risk of floods. A value of 3 was assigned to slope, and a value of 1 3 to geomorphology, indicating that slope has a moderate importance compared to geomorphology in flood risk. Similarly, a value of 5 was assigned to slope, and a value of 1 5 to vegetation cover, indicating a strong influence of slope on vegetation cover and its impact on flood risk. Finally, a value of 7 was assigned to slope, and a value of 1 7 to geology, highlighting the significant influence of slope on geology in the context of flood risk.
Once all the factors were evaluated, the weighting of each of them was established through a normalization matrix, resulting in slope having a weight of 0.558, geomorphology having a weight of 0.263, vegetation cover having a weight of 0.122 and geology having a weight of 0.057.
The normalized weights of the conditioning factors (geomorphology, slope, vegetation cover and geology) were combined with specific precipitation data, including intensity and frequency, in order to calculate weighted scores representing flood hazard. Vulnerability was assessed by considering economic, social and environmental dimensions, taking into account exposure, fragility and resilience in each of them. Like in the case of conditioning factors, numerical weights were obtained for the dimensions through pairwise comparisons, reflecting their relative importance in relation to flood risk.
Risk is the result of combining hazard and vulnerability and, as both increase, risk also increases. This measure of risk is obtained by multiplying hazard by vulnerability [48]. These evaluation variables are the result of many years of experience developed by CENEPRED (National Center for Estimation, Prevention and Reduction of Disaster Risk in Peru) and are shared as basic information and support (not required) for evaluators and researchers involved in disaster risk prevention projects, thus providing a guide for the adoption of these evaluation factors [49].
To determine the vulnerability of the inhabitants of the Andean Community to river floods, surveys with sixteen questions were used, considering social, economic and environmental aspects [48]. The probabilistic cluster sampling method was used, which allows for the random selection of grouped populations. This procedure is commonly used in surveys to obtain representative results of the population of a city by randomly selecting blocks, houses and people. Although there is no list of residents, there is a map of the area representing all the dwellings in the district [50]. According to the map, 31 blocks were identified, and one resident per dwelling in each block was randomly interviewed.
The methodological process shown in Figure 3 began with the collection of digital and physical data. The digital data were collected through institutional portals, while the physical data were obtained through the application of thirty-one surveys and field visits to the most vulnerable population in the district. Once obtained, a synthesis was made to identify the physical characteristics of the site and attribute the conditioning (vegetation cover, slope, geology and geomorphology) and triggering (precipitation) factors to the study. Thematic maps of each factor were developed to identify the corresponding descriptors. Saatty’s multicriteria analysis was then applied to perform pairwise comparisons and assign weighted weights to the descriptors of each conditioning and triggering factor [47,49]. Finally, GIS software was used to process the data and generate the corresponding hazard, vulnerability and risk thematic maps using a base map generated by a freely available orthophoto available in SAS Planet software with a resolution of 10 m per pixel.
The Saaty multi-criteria analysis is a fundamental tool for the evaluation of risks from natural phenomena in a country located on the eastern edge of the Pacific Ocean Ring of Fire. This methodology, used by CENEPRED (National Center for Estimation, Prevention and Reduction of Disaster Risk), makes it possible to weigh various factors, from the magnitude of natural events to the vulnerability of populations and structures, also considering the capacity to recover from impacts. By prioritizing these elements through multi-criteria analysis, CENEPRED achieves an integral perspective of risks, which enables a more precise and informed evaluation of the priorities and measures required for risk management. Given the constant exposure to earthquakes, floods, tsunamis, volcanic eruptions and other events, there is a pressing need for risk management. This management, led by CENEPRED, becomes an essential tool to reduce vulnerabilities, promote resilience and ensure sustainable development, safeguarding both lives and assets. The combination of multi-criteria analysis and risk management, driven by CENEPRED, stands as an informed, data-driven approach capable of fostering long-term security and prosperity [51,52,53].

3. Results

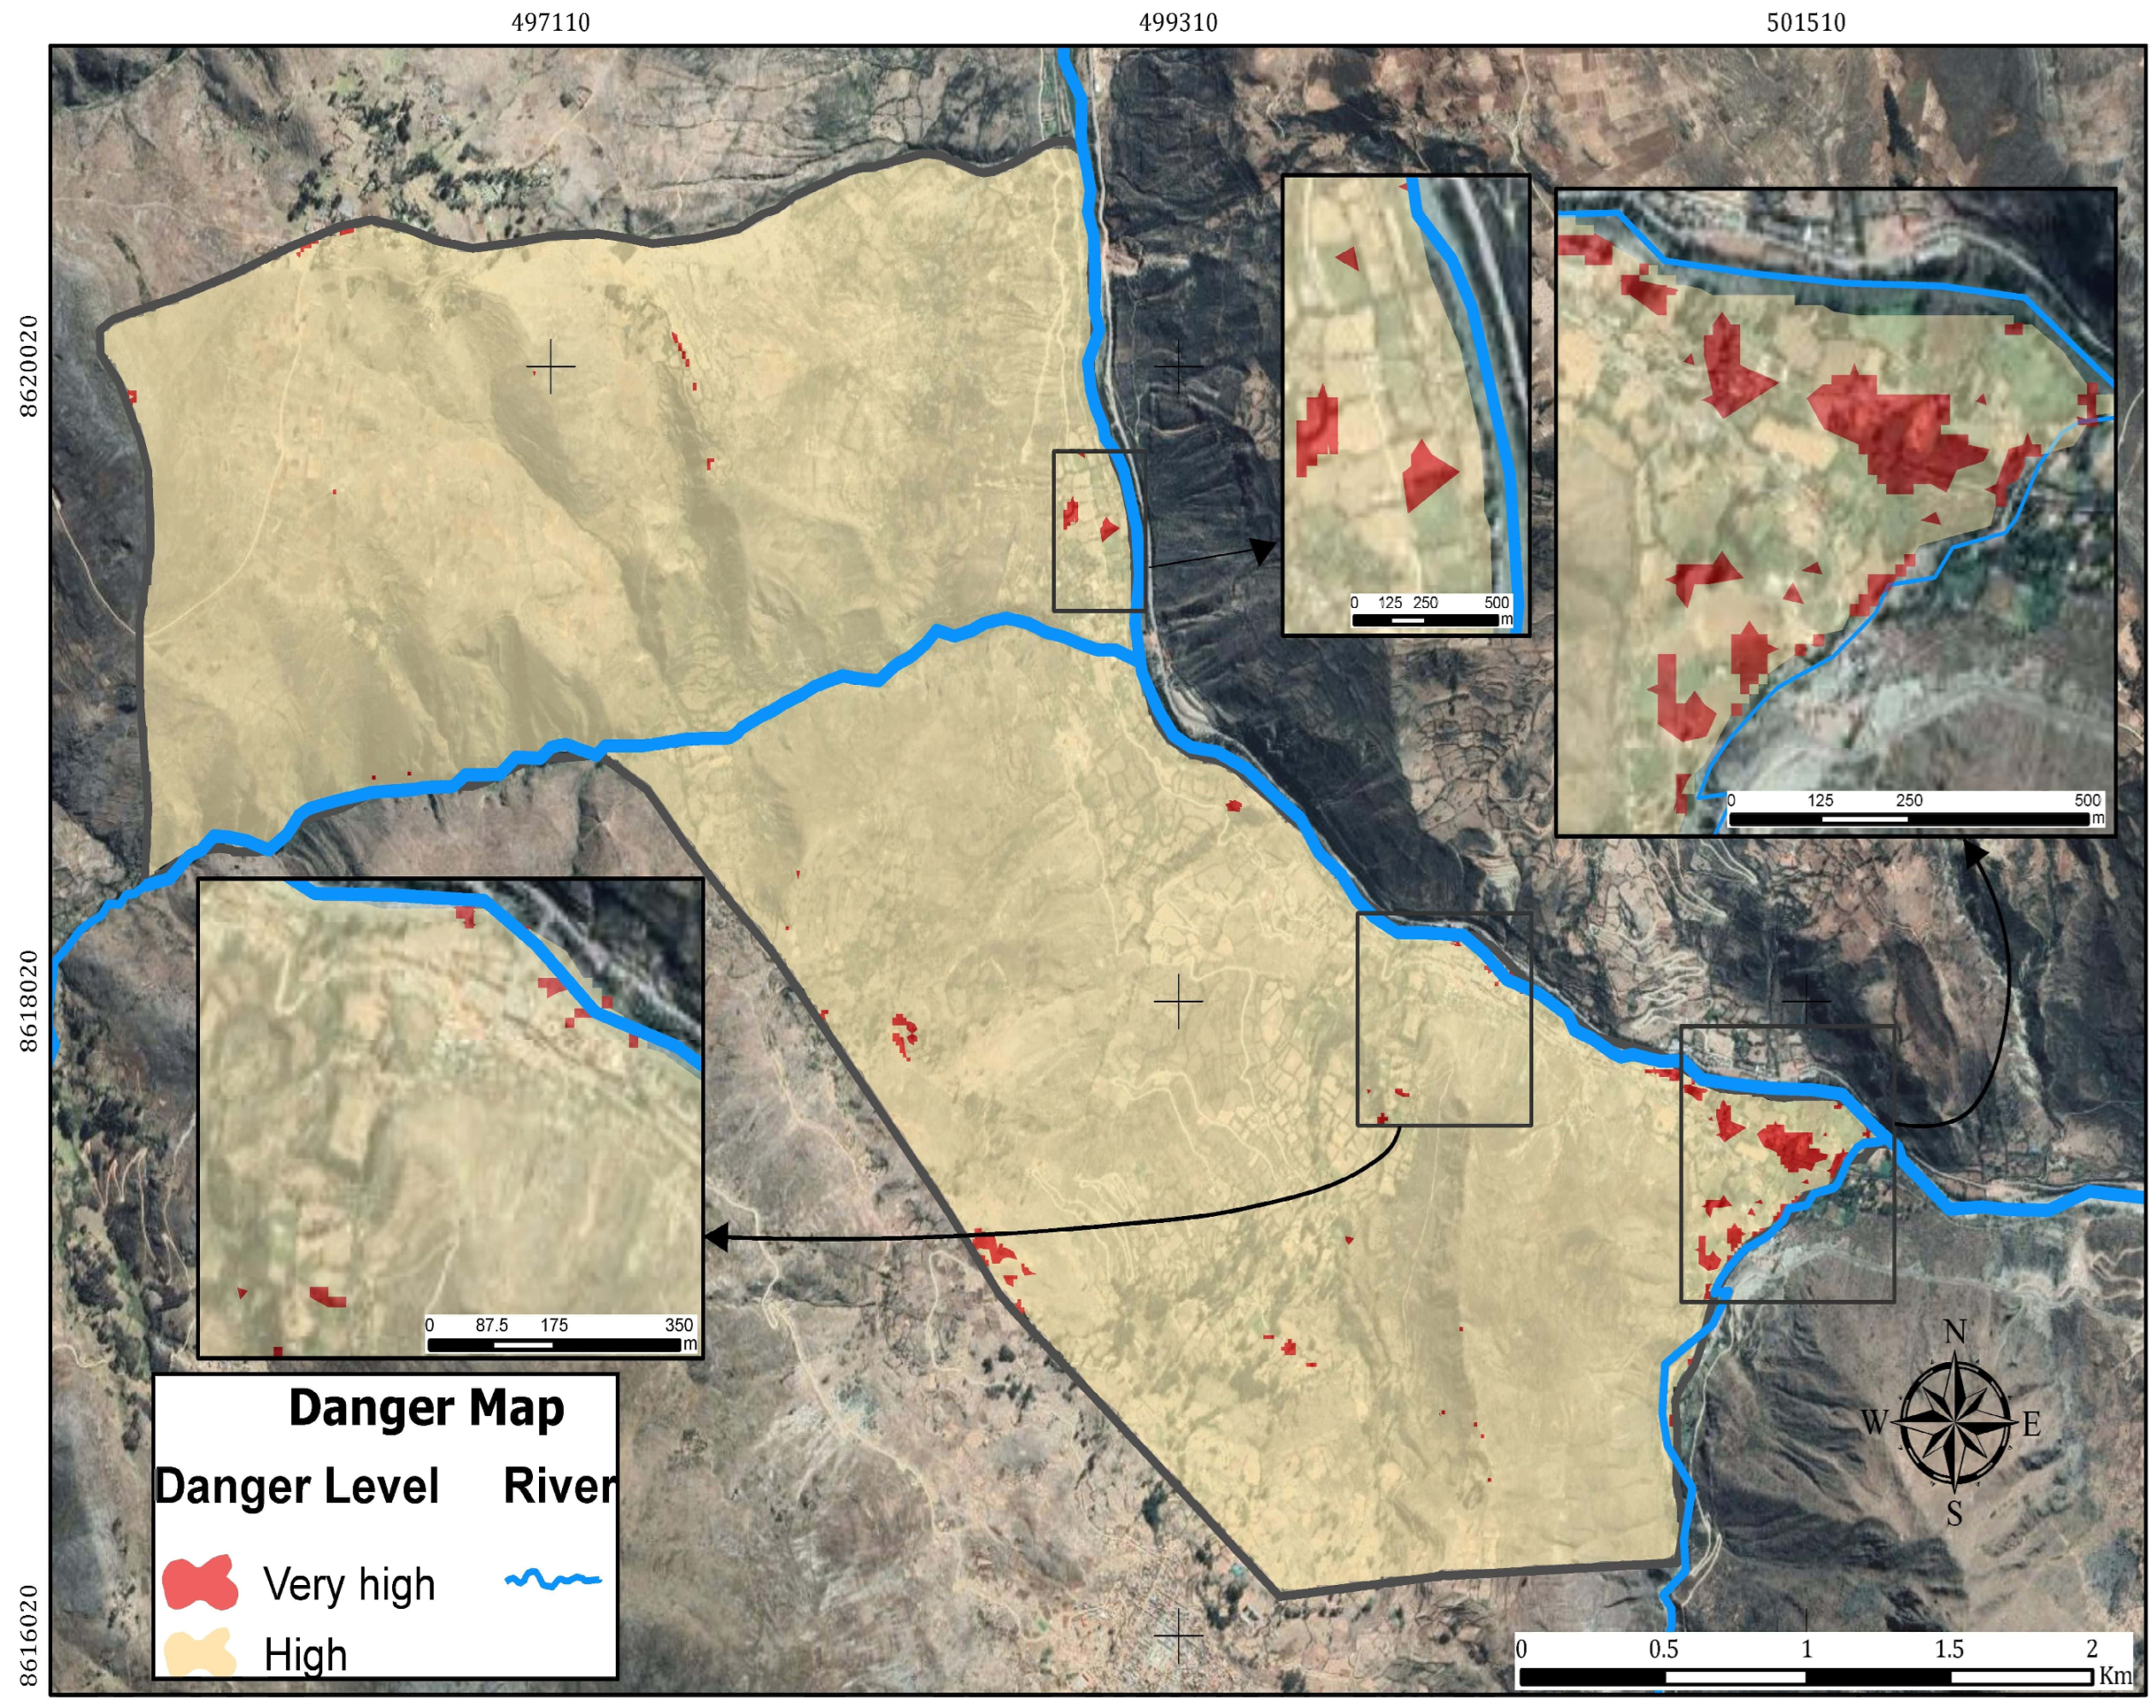
3.1. River Flood Hazard Levels

The hazard levels in the Andean Community of Central Peru were determined by the triggering factor (precipitation) and the conditioning factors (slope, geomorphology, vegetation cover and geology). The following is the result of the hazard assessment, presented in Table 2, which shows the levels and ranges obtained in the hierarchical analysis process.
In Table 2, we can observe the results of the river flood hazard assessment of the Andean Community, where 0.09 km2 represents 0.74% of the total area that is in the very high hazard level, while 11.95 km2 represents 99.26% of the study area that is in the high hazard level.
Based on the results of the hazard assessment, the river flood hazard map is presented (Figure 4), which shows that there is a probability of river floods of high- and very-high-severity levels due to the interaction of the study area, which has a rugged geography (slope, geomorphology, vegetation cover and geology), where the triggering factor (precipitation) increases the probability of developing scenarios in which river floods occur. As a result, the population, infrastructure and livelihoods suffer loss and damage. The map also shows areas shaded in red, which represent a very high level of vulnerability to river flooding, with an area of 8.90 ha. The area shaded in orange represents a high level of hazard and a greater intensity, covering 99.26% of the study area.

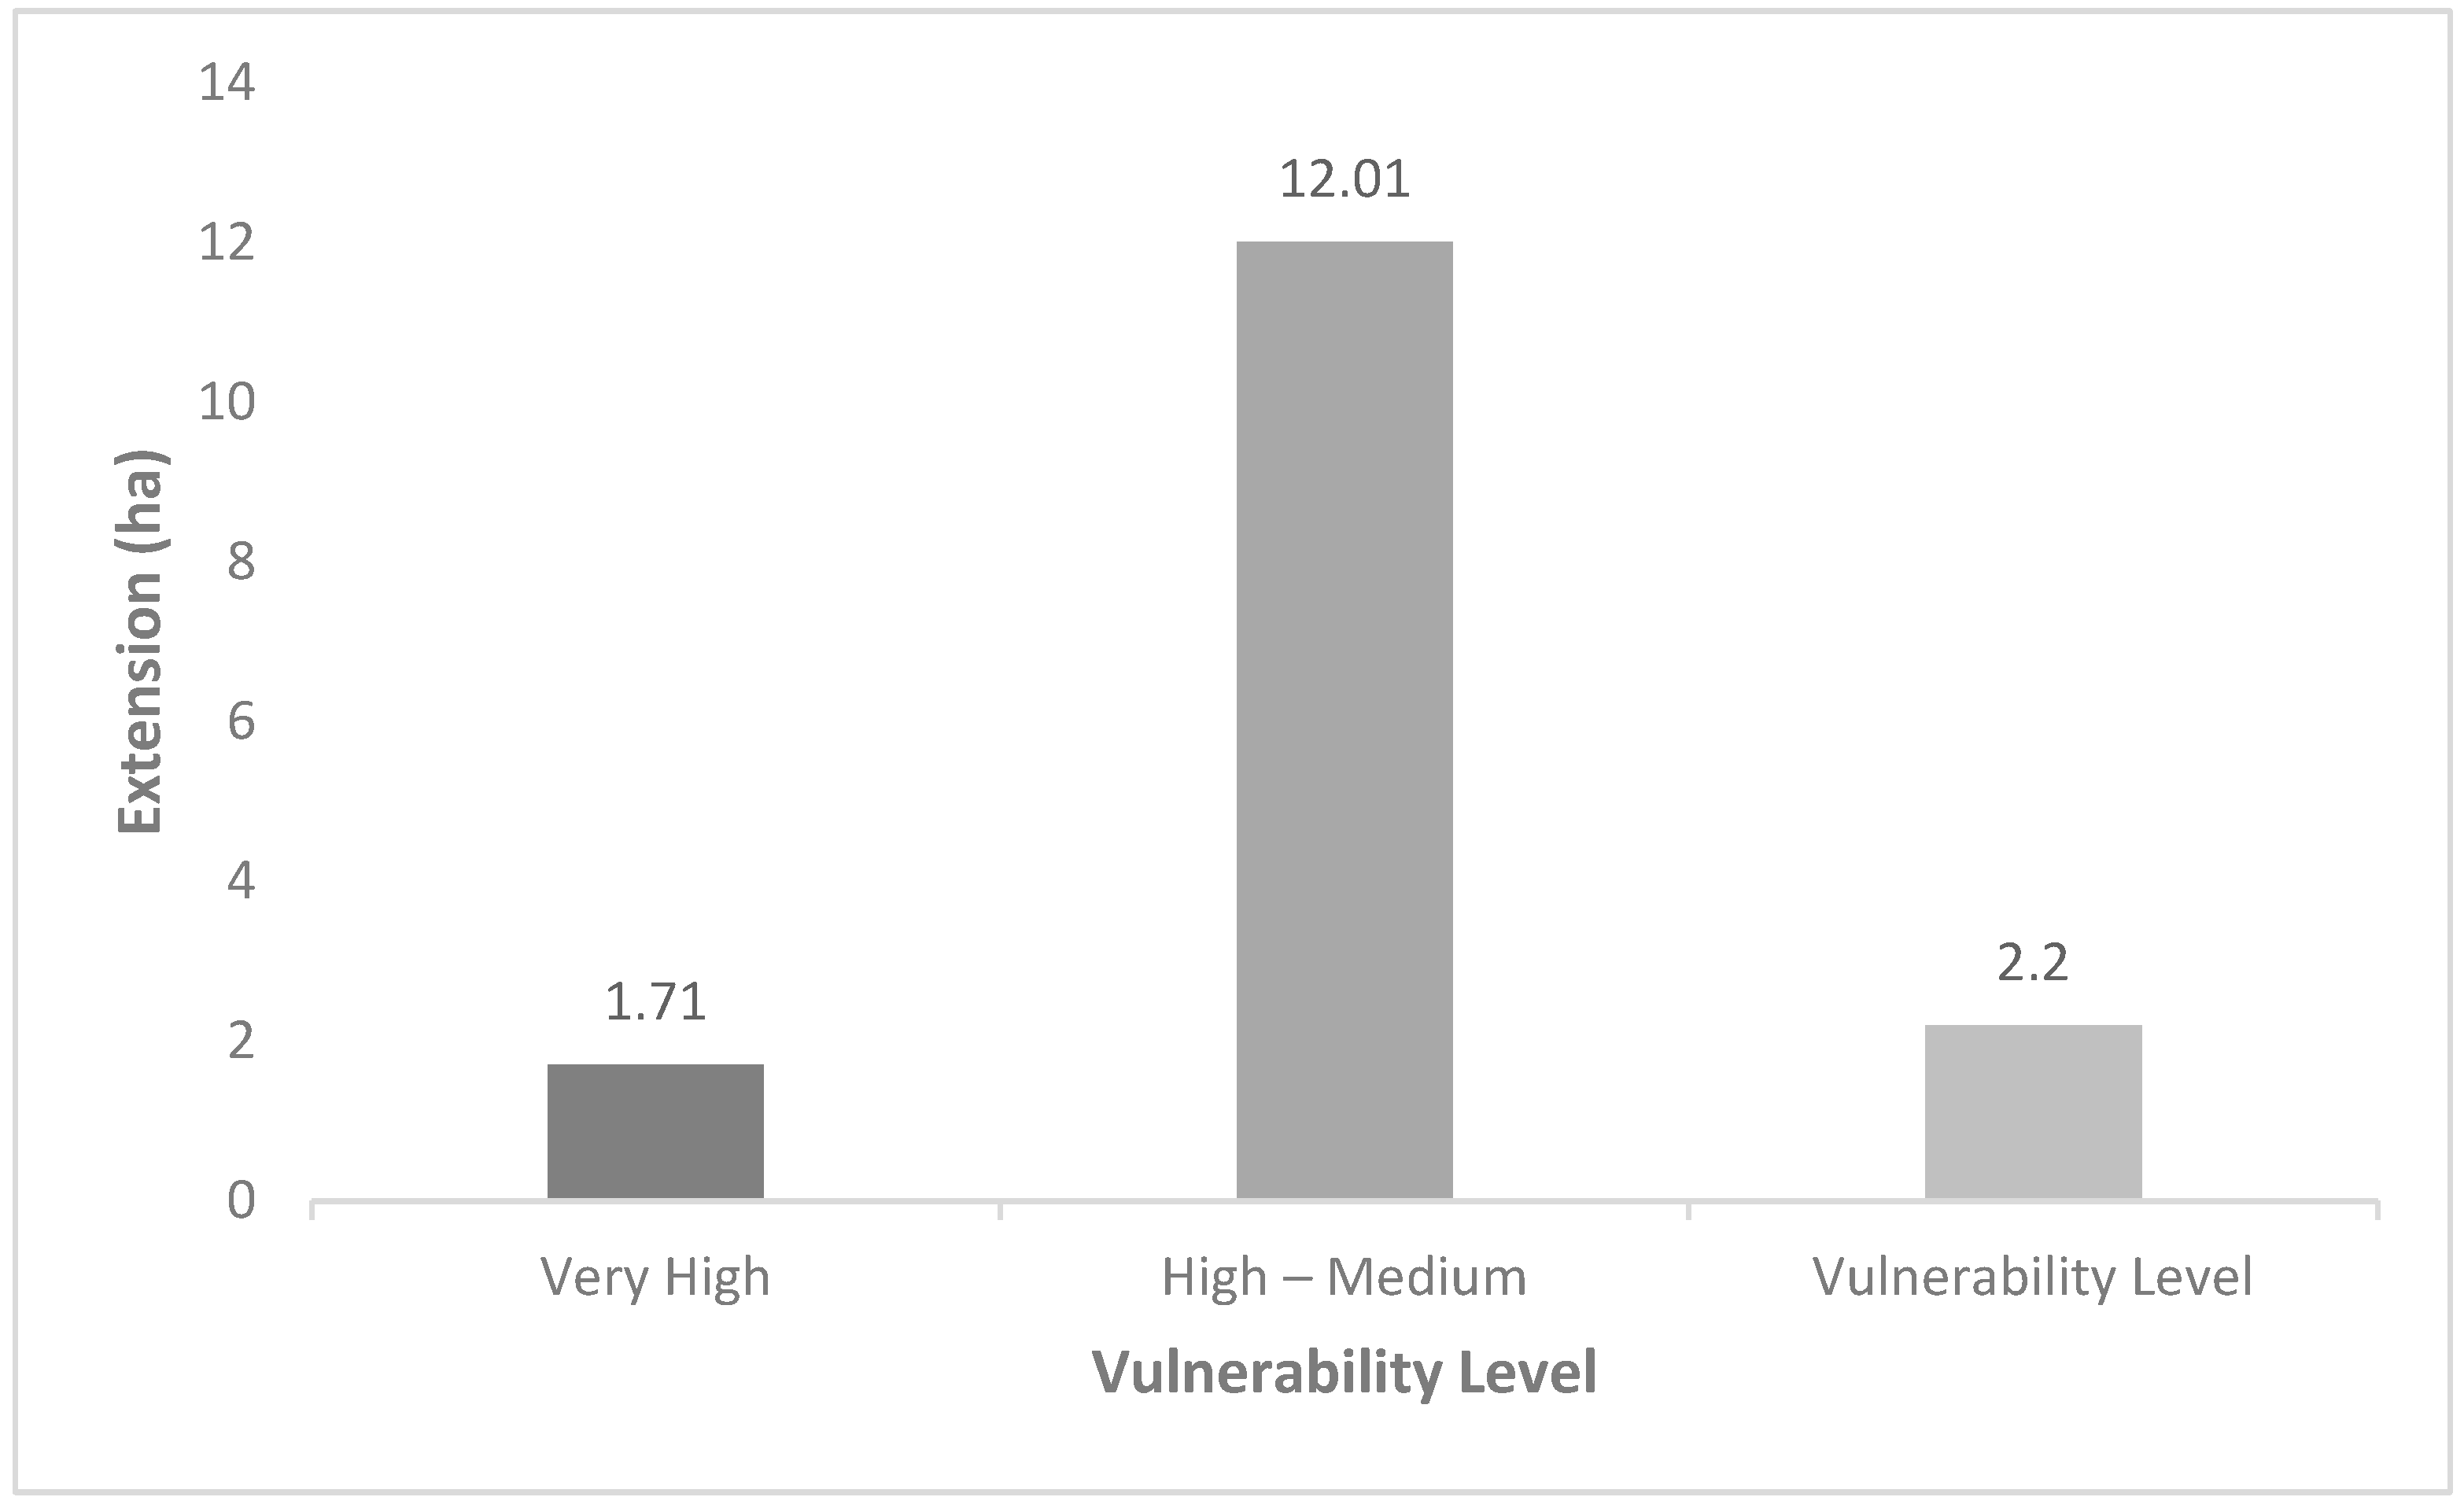
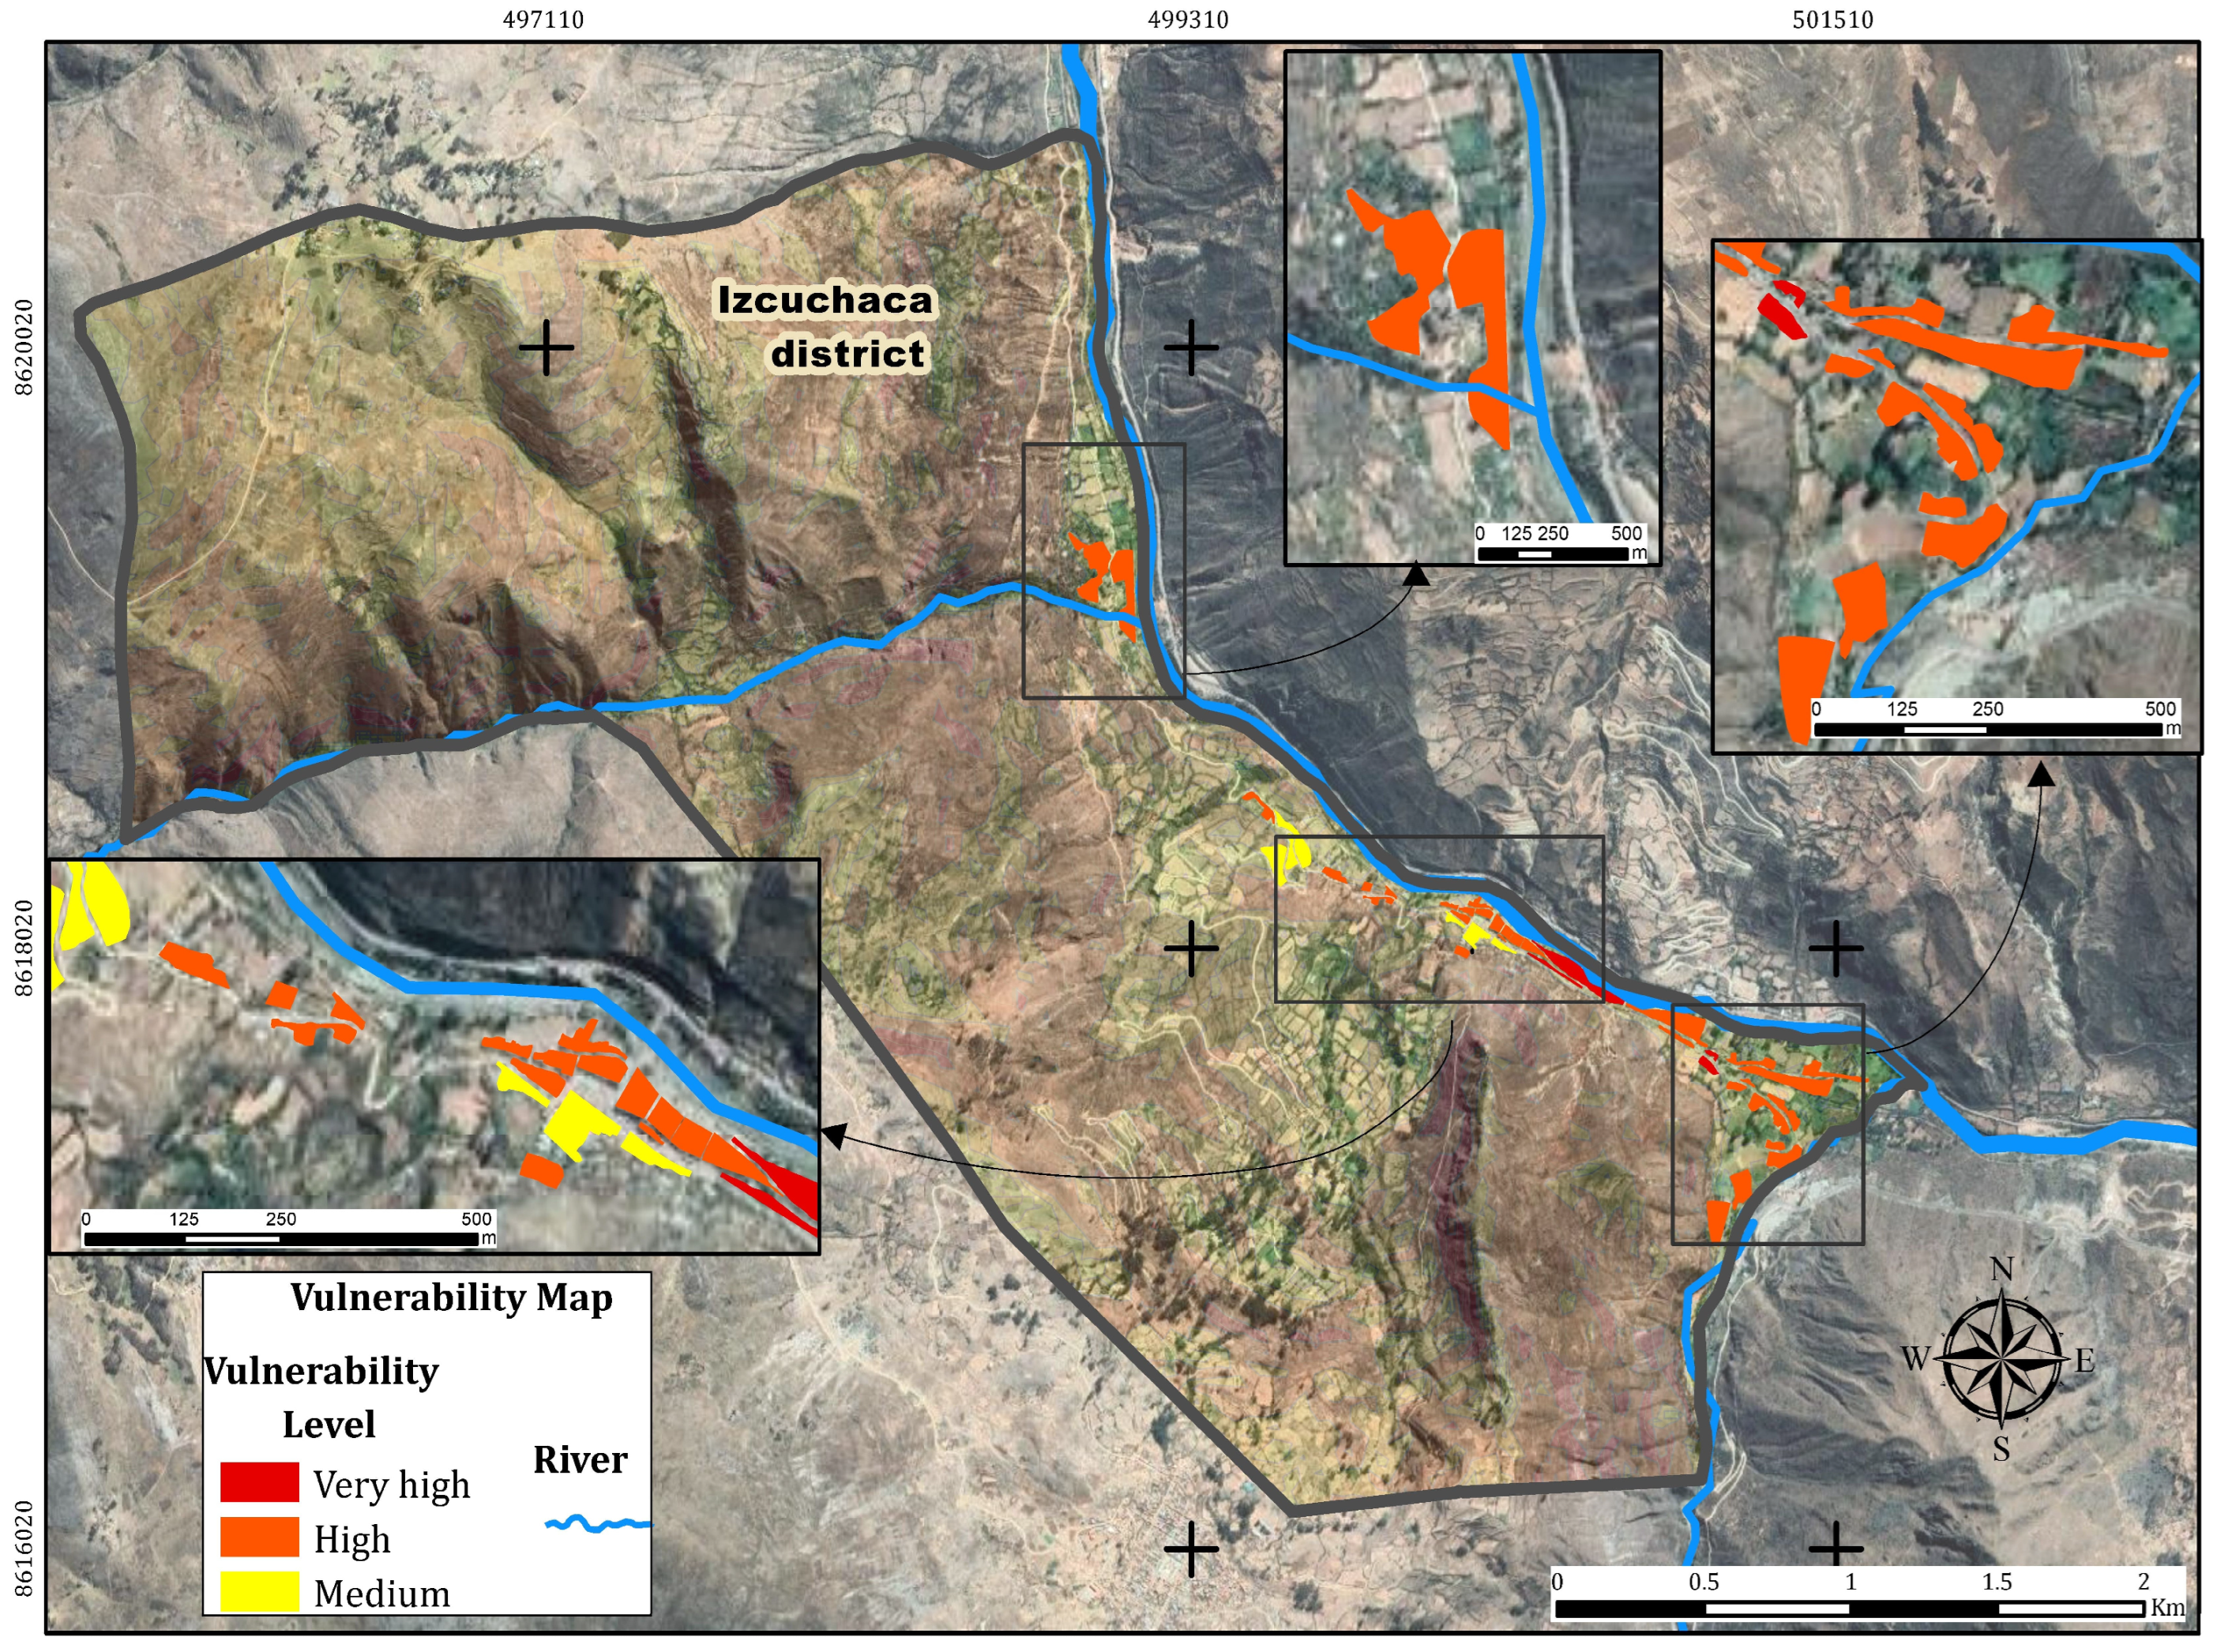
3.2. Levels of Vulnerability to River Floods

To quantify the level of vulnerability, three dimensions were considered (social, economic and environmental), analyzing each of the elements that make it up. Once the identification, analysis and evaluation of the different indicators for each type of vulnerability associated with the possible occurrence of river flooding hazards were completed, they were weighted and stratified, resulting in the vulnerability levels and their corresponding ranges shown in Table 3.
Table 3 shows the results of the vulnerability assessment of the Andean community of Central Peru, where 0.022 km2 represents 10.8% of the total study area, which is at a very high level due to the presence of areas with dwellings built with precarious materials and in a poor condition. In addition, the population has limited economic resources, a deficient culture of prevention, a lack of basic services and poor access to emergency services. On the other hand, 0.120 km2 represents 75.4% of the study area, which has a high level of vulnerability as there are areas where dwellings are predominantly built with precarious materials, in a poor or fair state of construction, with partial access to basic services and emergency response services. Finally, 0.022 km2 represents 13.8% of the medium vulnerability level since there are areas where most of the dwellings are built with high quality materials and are in fair and good condition, and the population has a medium economic income, as well as an adequate culture of prevention and partial access to basic services and facilities for emergency response.
From Figure 5, the largest area (ha) represents 75.4% of the study area, which is at a high vulnerability level, while only 1.71 ha and 2.20 ha of the study area have a very high and medium vulnerability level, respectively.
Figure 6 shows the vulnerability map of the Andean Community of Central Peru, which is characterized by three colors: the red areas indicate very high vulnerability, the orange color is more intense and represents areas of high vulnerability and, finally, the yellow areas represent medium vulnerability.

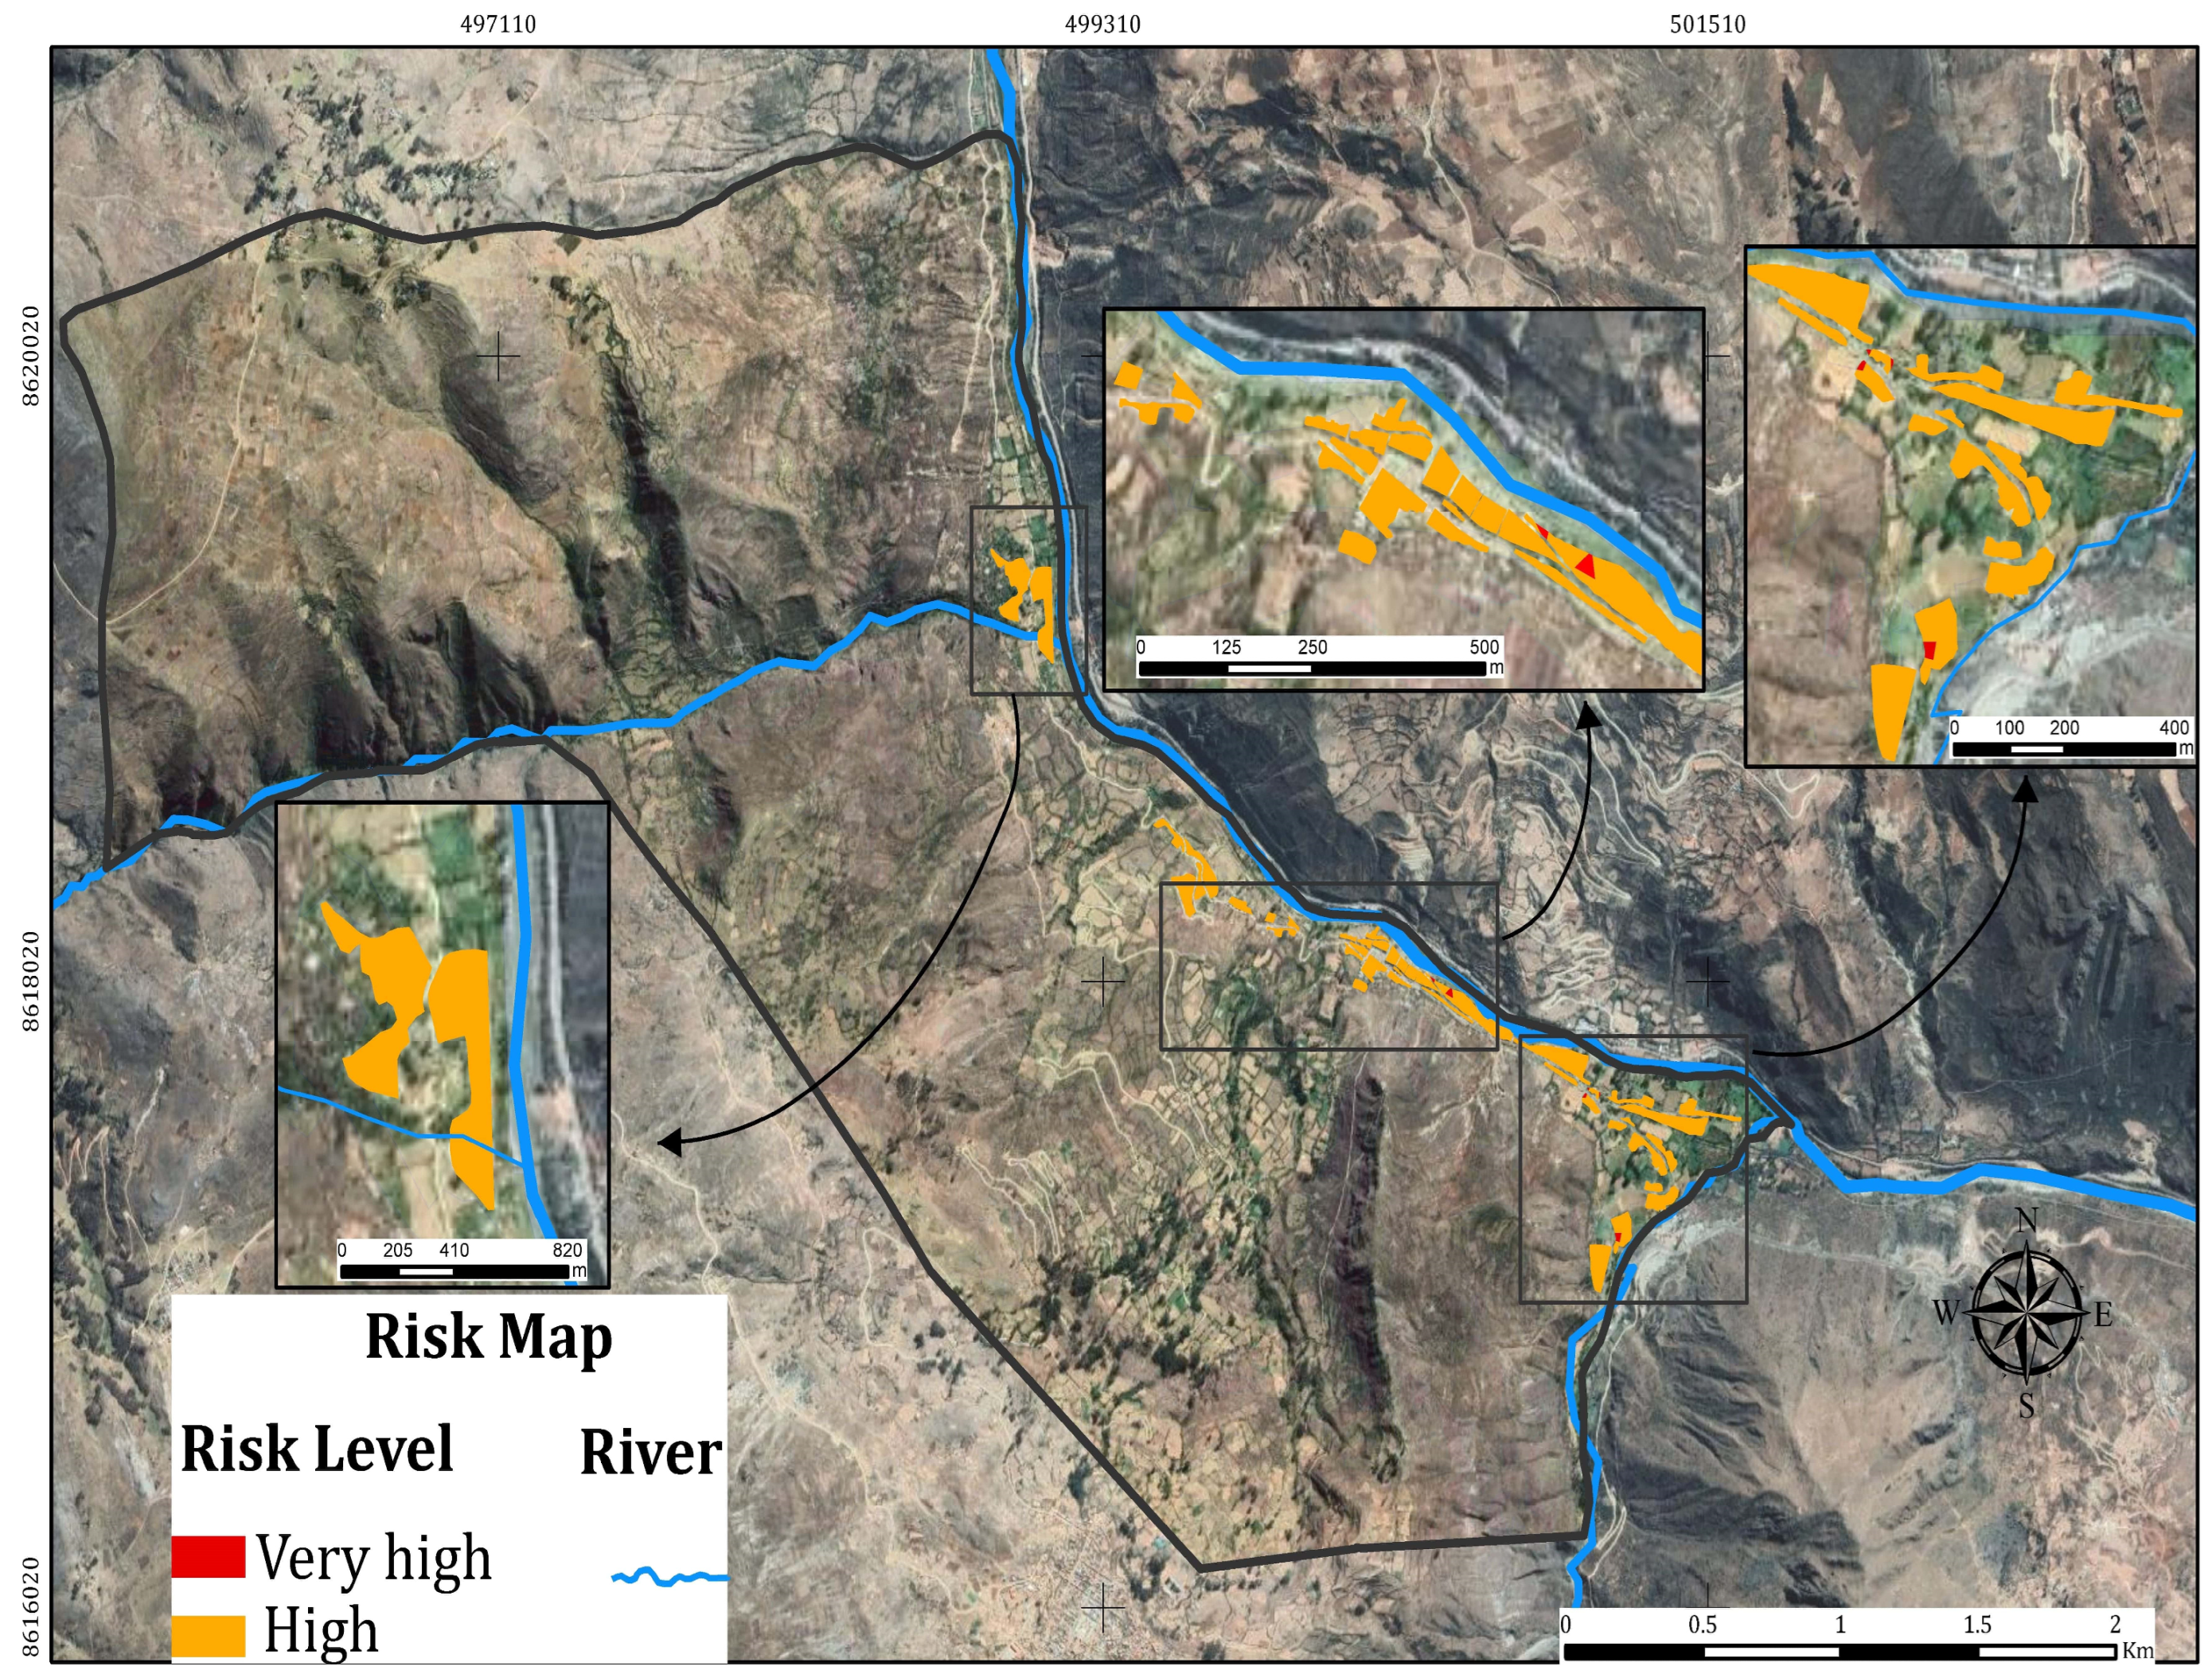
3.3. River Flood Risk Levels

Table 4 shows the results of the risk assessment of the Andean community.
It was determined that the study area has a high and very high exposure to river flooding because most of the dwellings are built with adobe and quincha materials—the roof is mostly made of tin and tiles—and they do not have an immediate emergency response capacity because they are in areas close to the banks of the Mantaro River and the marginal strip. On the other hand, the area considered to be at high risk of river flooding has concrete buildings, some of which are partially made of adobe, is located a little further away from the marginal strip and does not have very steep slopes.
Table 4 shows the following results of the risk assessment, where the very-high-risk level corresponds to 0.001 km2, which is 0.85% of the study area, due to the condition of the dwellings, as most of them are built with adobe materials and tile roofs. These dwellings are located within the marginal zone of the Mantaro River, and the population is very unaware of the emergency response to a possible river flood. Meanwhile, the high-risk level is 0.16 km2, which represents 99.15% of the area, because it shows the presence of houses with precarious materials and there is a lack of knowledge of contingency plans because the municipality or local government does not provide the population with information about flooding in the area.
With the risk results evaluated, the corresponding map was created using GIS software, as shown in Figure 7.
The occupation of the territory for housing purposes in the district has developed in an informal and unregulated way. This is related to some plots that are in precarious conditions due to the lack of economic resources of the inhabitants, besides the poverty that exists, especially in places that occupy marginal areas and with high slopes, suffering also from the lack of basic services such as drinking water and sewage.
It was possible to verify both directly and through interviews with the inhabitants that there is no organization for disaster risk management and that the authorities are not interested in conducting actions to face natural disasters.

4. Discussion

This study allows for an empirical approach to the case. It contributes to the generation of scientific evidence on the level of risk to the civilian population in vulnerable areas of the Izcuchaca district due to river flooding [54].
In the high Andean areas of Peru, the assessment of flood risk levels is divided into two main categories: triggering factors, such as precipitation, and conditioning factors, such as slope, geomorphology, vegetation cover and geology. Precipitation acts as the triggering event that can lead to flooding, while conditioning factors, such as slope, geomorphology, vegetation cover and geology, play a role in determining the susceptibility of an area to flooding. In this context, similar research by [54,55] provides a complementary perspective by highlighting the importance of the digital elevation model (DEM) and its topographic characteristics, such as slope, in modeling flooding vulnerability. These parameters are used because of the positive correlation between flooding and topography: areas with gentler slopes and higher values tend to be more prone to experiencing flooding. In addition, the normalized difference vegetation index (NDVI) is used to estimate the density of vegetation cover, indicating that areas with dense vegetation are less susceptible to flooding.
The flood risk assessment in the high Andean zones of Peru concluded that the area is at high and very high risk of river flooding due to several factors, such as the construction of dwellings with vulnerable materials, the proximity to the river and the lack of capacity to respond to emergencies. Most of the houses are made of adobe and quincha, with tin and tile roofs, which increases their vulnerability. The situation is aggravated by the lack of knowledge and contingency plans on the part of the population and local authorities. Likewise, several authors [56,57,58] have found that densely populated areas are the most affected by floods, while less populated and higher areas present are less at risk. Both studies mention that the direct relationship between population density, the quality of housing infrastructure, drainage infrastructure and vulnerability to flooding contributes to the generation of risks as observed in the results presented, which also emphasize that urban flooding can cause property damage, loss of life and the spread of waterborne diseases.
Regarding the hazard level assessment, the results coincide with various investigations conducted in the Santa Cecilia stream, in which related conditioning factors such as geology, geomorphology and slope were used as indicators for the analysis of the hazard level due to river floods. From this, evidence was obtained that the stream is unstable due to its difficult geographic conditions and is threatened by flooding in the event of rainfall, as evidenced by the disaster of the Piscotambo, Pueblo Libre and Rio Seco streams in 2009. In this research, conditioning factors such as slope, geomorphology, vegetation cover and geology were considered, the vegetation cover being the only difference, since, in the district of Izcuchaca, there are areas with crops, puna grass, grasslands and humid and subhumid scrubland, which is a necessary criterion to evaluate. In addition, a very high level of vulnerability was obtained from the processing, representing 99.26% of the study area, which is in a high hazard level of vulnerability, so the geographic conditions in rural Andean communities will present high percentages of vulnerability to disaster risk, where the geographic characteristics of a rugged area, climate and topography can play an important role in the susceptibility of certain geographic regions to certain types of natural disasters, including floods, which is demonstrated in this research and others with similar characteristics [59,60].
The research by [61] complements the results obtained because it indicates the potential for vulnerability due to the lack of infrastructure and services and a lack of knowledge about phenomena, such as river floods, making it difficult to deal with a contingency. These assertions are based on the facts verified in rural areas of the Andes. For this reason, local governments must implement programs to make the population aware of mobilization and first aid plans, as well as to carry out preventive actions for the most vulnerable people in the face of these disasters through the relocation and territorial reorganization of dwellings located along the marginal strip of the Mantaro River.
There are many challenges in the communities of Izcuchaca; therefore, based on the results of this research, discussions and recommendations, new questions arise, such as: Does the regional government have an emergency plan for natural phenomena? What is the behavior of the Mantaro River? Have water balance studies been conducted in the area? What are the recorded trends in the area regarding river floods? What is the influence of the current Andean cosmovision on the development and sociocultural structure? These and many other questions are raised by this study, which is intended to set a precedent for future research that can use it as a starting point.

5. Conclusions

River floods represent a potential hazard in a community in the Peruvian Andes because several socioeconomic and environmental factors determine the probability of occurrence of this phenomenon. Therefore, the analysis and mapping of hazard, vulnerability and risk levels is an important tool for implementing appropriate river flood response strategies, prioritizing the implementation of prevention and mitigation measures, understanding where and how to increase the response capacity to river floods and ultimately optimizing the allocation of social development resources.
The rural communities of Izcuchaca do not have an orderly strategy for urban expansion, which means that, in the event of a flooding event, the impact of this phenomenon increases significantly. The results of the hazard level for river floods in the urban areas of the Izcuchaca district highlight the deficiencies of the area, where 0.09 km2 represents 0.74% of the total area that is at a very high hazard level, while 11.95 km2 represents 99.26% of the study area that is at a high hazard level. This assessment allows for a quick detection of the areas that are more susceptible to a flood event not only in the study area but also in any other environment with similar characteristics.
Regarding the analysis of the levels of vulnerability to river floods, it was determined that the largest area (ha) represents 75.4% of the study area in the urban zones of the Izcuchaca district, which is at a high level of vulnerability, while only 1.71 ha and 2.20 ha of the urban zones of the Izcuchaca district have a very high vulnerability level and a medium vulnerability level, respectively, because most of the inhabitants of the study area are elderly people, the dwellings are located near the Mantaro River and, finally, the population is unaware of risk management issues.
The quantitative analysis of the disaster risk due to river flooding in the urban area of the Izcuchaca district concluded that it is exposed to a very high level of risk of river flooding since there are critical properties where work, actions and measures to mitigate river flooding should be prioritized and, if possible, the inhabitants should be relocated to safer areas of the district. The high-risk level is because there are critical areas where priority should be given to actions and measures to deal with river floods, such as training for the population and authorities on flooding. In addition, these areas have buildings in poor condition and constructions with inadequate materials to withstand the effects of natural phenomena.
The results of the assessment as well as the maps can be useful for policymakers and public decision makers, such as prioritizing the implementation of prevention and mitigation measures, understanding where and how to increase the capacity to respond to river flooding and, ultimately, optimizing the allocation of social development resources to district programs that contribute to strengthening the response to phenomena such as flooding.
The risk of flooding in Izcuchaca was assessed and a high risk was found in key areas that require urgent actions, such as relocation and mitigation measures. High-risk areas were also identified where training and preventive measures are needed.

Author Contributions

Conceptualization, D.C.-T., S.R.-S., K.O.-Q. and B.B.-R.; methodology, K.O.-Q., E.G.-C. and F.C.-B.; software, B.B.-R.; validation, F.C.-B.; writing—original draft preparation, D.C.-T. and D.C.-T.; writing—review and editing, B.B.-R.; visualization S.R.-S.; formal analysis, D.C.-T.; investigation, D.C.-T., E.G.-C., B.B.-R. and F.C.-B.; data curation, S.R.-S. and K.O.-Q.; funding acquisition, S.R.-S.; resources, K.O.-Q.; supervision, E.G.-C. and F.C.-B.; project administration, E.G.-C. All authors have read and agreed to the published version of the manuscript.

Funding

This research received no external funding.

Institutional Review Board Statement

Not applicable.

Informed Consent Statement

Informed consent was obtained from all subjects involved in the study.

Data Availability Statement

Questionnaires were conducted in Spanish. Responses were translated into English. Original responses are available from the authors.

Conflicts of Interest

The authors declare no conflict of interest.

References

  1. Ozturk, D.; Yilmaz, I.; Kirbas, U. Flood hazard assessment using AHP in Corum, Turkey. Tecnol. Cienc. Agua 2021, 12, 379–415. [Google Scholar] [CrossRef]
  2. Bucogen, G.; Piccolo, M.; Bohn, V. Estimación de la Susceptibilidad a inundaciones en la cuenca inferior de Río Negro, Argentina. Finisterra 2021, 56, 51–70. [Google Scholar] [CrossRef]
  3. Degeai, J.P.; Blanchemanche, P.; Tavenne, L.; Tillier, M.; Bohbot, H.; Devillers, B.; Dezileau, L. River flooding on the French Mediterranean coast and its relation to climate and land use change over the past two millennia. CATENA 2022, 219, 106623. [Google Scholar] [CrossRef]
  4. de Albuquerque, J.P.; Anderson, L.; Calvillo, N.; Cattino, M.; Clarke, A.; Cunha, M.A.; Degrossi, L.C.; Garde-Hansen, J.; Klonner, C.; Lima-Silva, F.; et al. Dialogic data innovations for sustainability transformations and flood resilience: The case for Waterproofing Data. SSRN Electron. J. 2022, 82, 102730. [Google Scholar] [CrossRef]
  5. Cajigal, E.; Maldonado, A. Metodología para el análisis de vulnerabilidad ante inundaciones. Un ejercicio emergente ante el cambio climático. Econ. Soc. Territ. 2019, 19, 543–574. [Google Scholar] [CrossRef]
  6. Yu, J.; Zou, L.; Xia, J.; Zhang, Y.; Zuo, L.; Li, X. Investigating the spatial-temporal changes of flood events across the Yangtze River Basin, China: Identification, spatial heterogeneity, and dominant impact factors. J. Hydrol. 2023, 621, 129503. [Google Scholar] [CrossRef]
  7. Zhang, C.; Sun, F.; Sharma, S.; Zeng, P.; Mejia, A.; Lyu, Y.; Gao, J.; Zhou, R.; Che, Y. Projecting multi-attribute flood regime changes for the Yangtze River basin. J. Hydrol. 2023, 617, 128846. [Google Scholar] [CrossRef]
  8. Guo, X.; Cheng, J.; Yin, C.; Li, Q.; Chen, R.; Fang, J. The extraordinary Zhengzhou flood of 7/20, 2021: How extreme weather and human response compounding to the disaster. Cities 2023, 134, 104168. [Google Scholar] [CrossRef]
  9. Loc, H.H.; Emadzadeh, A.; Park, E.; Nontikansak, P.; Deo, R.C. The Great 2011 Thailand flood disaster revisited: Could it have been mitigated by different dam operations based on better weather forecasts? Environ. Res. 2023, 216, 114493. [Google Scholar] [CrossRef] [PubMed]
  10. Cai, T.; Li, X.; Ding, X.; Wang, J.; Zhan, J. Flood risk assessment based on hydrodynamic model and fuzzy comprehensive evaluation with GIS technique. Int. J. Disaster Risk Reduct. 2019, 35, 101077. [Google Scholar] [CrossRef]
  11. Garnica, R.; Alcántara, I. Riesgos por inundación asociados a eventos de precipitación extraordinaria en el curso bajo del río Tecolutla, Veracruz. Investig. Geográficas 2004, 55, 23–45. [Google Scholar]
  12. Hernández, R.; Barrios, H.; Ramírez, A. Análisis de riesgo por inundación: Metodología y aplicación a la cuenca Atemajac. Tecnol. Cienc. Agua 2017, 8, 5–25. [Google Scholar] [CrossRef]
  13. Senamhi (Servicio Nacional de Meteorología e Hidrología del Perú). Inventario de datos de eventos de inundaciones del Perú. Estud. Final 2022, 6, 128. [Google Scholar]
  14. ONU. Marco de Sendai Para la Reducción del Riesgo de Desastres 2015–2030; Secretario General Para La Reducción Del Riesgo De Desastres SGRRD-ONU; UNISDR: Sendai, Japan, 2015. [Google Scholar]
  15. Vilchez, M.; Ochoa, M. Zonas Críticas Por Peligros Geológicos en la Región Huancavelica; Ingemment: Huancavelica, Peru, 2014. [Google Scholar]
  16. Beltramino, T. Los desastres y la visibilización de los riesgos. Las inundaciones en Santa Fe, Argentina. Bitácora Urbano Territ. 2019, 29, 165–173. [Google Scholar] [CrossRef]
  17. Nahin, K.T.K.; Islam, S.B.; Mahmud, S.; Hossain, I. Flood vulnerability assessment in the Jamuna river floodplain using multi-criteria decision analysis: A case study in Jamalpur district, Bangladesh. Heliyon 2023, 9, e14520. [Google Scholar] [CrossRef]
  18. Diario Oficial El Peruano. 564237 Normas Legales. El Peruano, 22 October 2015; 1–3. [Google Scholar]
  19. Oficina Para la Coordinación de Asuntos Humanitarios (OCHA). PERÚ: Inundaciones y Deslizamientos; OCHA: New York, NY, USA, 2023; pp. 1–7. [Google Scholar]
  20. Cano, T. Estimación del Riesgo de Desastres en la Subcuenca Baja del Río Shullcas Zona Urbana de la Ciudad de Huancayo; UNCP: Huancayo, Peru, 2019. [Google Scholar]
  21. Zapperi, P. Análisis de la incorporación del riesgo de inundación en la normativa de ordenamiento territorial de Argentina. Investig. Geogr. 2018, 70, 71–90. [Google Scholar] [CrossRef]
  22. Jia, H.; Chen, F.; Pan, D.; Du, E.; Wang, L.; Wang, N.; Yang, A. Flood risk management in the Yangtze River basin —Comparison of 1998 and 2020 events. Int. J. Disaster Risk Reduct. 2022, 68, 102724. [Google Scholar] [CrossRef]
  23. Wan, H.; Abdullah, J.; Abdul, K.; Muhammad, N. Urban flash flood index based on historical rainfall events. Sustain. Cities Soc. 2020, 56, 102088. [Google Scholar] [CrossRef]
  24. Valencia, N.; Pariona, A.; Huamán, M.; Miranda, F.; Quintanilla, S.; Gonzáles, A. Seroprevalencia de fasciolosis en escolares y en ganado vacuno en la provincia de Huancavelica, Perú. Rev. Peru Med. Exp. Salud Publica 2005, 22, 96–102. [Google Scholar]
  25. Silvera, F. Innovación Productiva-Comercial de Pequeños Productores(as) de Quinua en Comunidades del VRAEM- Huancavelica y Aledaños; Fondo Empleo: Huancavelica, Peru, 2018. [Google Scholar]
  26. Quispe, E. Aspectos Socio-Culturales del Proceso de Urbanización en el Poblado de Izcuchaca. Bachelor’s Thesis, Universidad Nacional de San Antonio de Abad del Cuzco, Cuzco, Peru, 2020. [Google Scholar]
  27. Cardenas, R.; Meza, N. Determinantes Sociales de la Salud y Anemia Ferropenica en Niños(as) Menores de 5 Años del Distrito de Izcuchaca, Huancavelica –2019. 2019. Available online: http://repositorio.unac.edu.pe/handle/20.500.12952/5378 (accessed on 10 April 2023).
  28. Aliaga, E. Factores que Influyen en Conflicto Social en Torno al Proyecto Mejoramiento de Los Servicios Básicos en el Distrito de Izcuchaca—Huancavelica 2017. Bachelor’s Thesis, Universidad Continental, Huancayo, Peru, 2018. [Google Scholar]
  29. Fernández, B. Informe Preliminar de la Inspección Técnica Geológica en el Cerro Hatun Rumi; Ingemment: Huancavelica, Peru, 2017. [Google Scholar]
  30. Mori, A. Influencia de las Tensiones Geostaticas en la Estabilidad de Talud Carreta Acostambo Izcuchaca. Bachelor’s Thesis, Universidad Peruana Los Andes, Huancayo, Peru, 2020. [Google Scholar]
  31. Rojas, A. Evaluación del Estado Situacional del Pavimento Flexible de la vía Principal Tramo Huancavelica—Izcuchaca, en la Provincia de Huancavelica, 2018. 2021. Available online: https://hdl.handle.net/20.500.12692/76522 (accessed on 11 April 2023).
  32. Moreno, J. El Proceso Análitico Jerárquico (AHP). Fundamentos, metodologías y aplicaciones. Recta Monográfico 2002, 1, 21–53. [Google Scholar]
  33. Sun, R.; Gong, Z.; Gao, G.; Shah, A.A. Comparative analysis of Multi-Criteria Decision-Making methods for flood disaster risk in the Yangtze River Delta. Int. J. Disaster Risk Reduct. 2020, 51, 101768. [Google Scholar] [CrossRef]
  34. De Brito, M.M.; Evers, M. Multi-criteria decision-making for flood risk management: A survey of the current state of the art. Nat. Hazards Earth Syst. Sci. 2016, 16, 1019–1033. [Google Scholar] [CrossRef]
  35. Hochrainer-Stigler, S.; Lorant, A. Evaluating Partnerships to Enhance Disaster Risk Management using Multi-Criteria Analysis: An Application at the Pan-European Level. In Environmental Management; Springer: New York, NY, USA, 2018; Volume 61, pp. 24–33. [Google Scholar] [CrossRef]
  36. Leyva, C.J.; Gatell, A.A.; Leyva, I.A. Proceso Analítico Jerárquico. Herramienta para la gestión del ordenamiento urbano-ambiental en el eje Luaces de Camagüey. Rev. Científica Arquit. Urban. 2019, 40, 43–57. Available online: https://rau.cujae.edu.cu/index.php/revistaau/article/view/530 (accessed on 13 April 2023).
  37. Panez, P. Evaluación del Potencial Ecoturistico del Distrito de Izcuchaca-Huancavelica. Bachelor’s Thesis, Universidad Nacional del Centro del Perú, Huancayo, Peru, 2019. [Google Scholar]
  38. Hernández, R. Metodologia de la Investigacion; Mc Graw-Hill: Mexico City, Mexico, 2014; Volume 4. [Google Scholar]
  39. Junior, R.R.; de Carvalho, M.M. Understanding the impact of project risk management on project performance: An empirical study. J. Technol. Manag. Innov. 2013, 8, 64–78. [Google Scholar] [CrossRef]
  40. Liberatore, M.J.; Nydick, R.L. The analytic hierarchy process in medical and health care decision making: A literature review. Eur. J. Oper. Res. 2008, 189, 194–207. [Google Scholar] [CrossRef]
  41. Vaidya, O.S.; Kumar, S. Analytic hierarchy process: An overview of applications. Eur. J. Oper. Res. 2006, 169, 1–29. [Google Scholar] [CrossRef]
  42. Marzo, E.; Serra, C.; Valerino, P.; Ramírez, W.; Wilson, D. Analysis of risks for sanitary endemic disasters in the english equines. REDVET Rev. Electrónica Vet. 2010, 11, 1695–7504. [Google Scholar]
  43. Falavigna, G.P.; Iescheck, A.L.; de Souza, S.F. Obstacles risk classification model in aerodromes protection zones using the multi-criteria decision analysis ahp. Bol. Ciencias Geod. 2021, 27, 4. [Google Scholar] [CrossRef]
  44. Contardo, J.I.; Curihuinca, M.C.; Vargas, G.E.; Tello, S.P. Revelando el riesgo sísmico en el piedemonte de Santiago, Chile. Análisis multicriterio para la determinación de vulnerabilidad en la Falla San Ramón (FSR). Rev. De Geogr. Norte Gd. 2022, 81, 331–359. [Google Scholar] [CrossRef]
  45. Ávila, J.R.; Romero, A.G.; García, J.L.; Delgado, M.L. Análisis multicriterio para la delimitación de una región árida del centro de México. Acta Univ. 2015, 25, 11–25. [Google Scholar] [CrossRef]
  46. Gómez, J.; Orejuela, O. El proceso de análisis jerárquico y la toma de decisiones multicriterio. Red Rev. Científicas América Lat. el Caribe, España y Port. 2008, 14, 247–252. Available online: https://www.redalyc.org/pdf/849/84920503044.pdf (accessed on 13 April 2023).
  47. Ramírez, M. El método de jerarquías analíticas de Saaty en la ponderación de variables. Comun. Cient. Y Tecnol. 2004, 4, 1–7. [Google Scholar]
  48. Flores, P.; Ayala, I.A. Susceptibility to shallow landslides of soil in the municipality of Temoaya, Mexico: Multicriteria analysis. Investig. Geogr. 2012, 77, 31–47. [Google Scholar] [CrossRef]
  49. CENEPRED. Manual Para la Evaluación de Riesgos Originados por Fenómenos Naturales. 2014. Available online: http://www.sigpad.gov.co/sigpad/paginas_detalle.aspx?idp=112 (accessed on 13 April 2023).
  50. Cáceres, G. La metodología de encuesta. Técnicas Investig. En Soc. Cult. Y Comun. 1998, 33–73. Available online: https://biblioteca.marco.edu.mx/files/metodologia_encuestas.pdf (accessed on 13 April 2023).
  51. SIGRID. Available online: https://cdn.www.gob.pe/uploads/document/file/3989288/PLAN%20DE%20PREVENCI%C3%93N%20Y%20REDUCCI%C3%93N%20DE%20RIESGO%20DE%20DESASTRES%202022-2026.pdf (accessed on 13 April 2023).
  52. SIGRID. Movimientos en Masa Ante Lluvias Asociadas; 2023; Available online: https://sigrid.cenepred.gob.pe/sigridv3/storage/biblioteca//16310_escenario-de-riesgo-por-inundaciones-y-movimientos-en-masa-ante-lluvias-asociadas-al-fenomeno-el-nino-actualizado-al-15-de-mayo-2023.pdf (accessed on 13 April 2023).
  53. SIGRID. 16334 Plan de Prevencion y Reduccion de Riesgo de Desastres ante Inundacion Pluvial y Movimientos en Masa del Distrito de Huasta 2023–2025. Available online: https://sigrid.cenepred.gob.pe/sigridv3/documento/16334 (accessed on 13 April 2023).
  54. Hernández, J.; Vieyra, A. Riesgo por inundaciones en asentamientos precarios del periurbano. Morelia, una ciudad media mexicana. ¿El desastre nace o se hace? Rev. De Geogr. Norte Gd. 2010, 47, 45–62. [Google Scholar] [CrossRef]
  55. Borzi, G.; Cellone, F.; Tanjal, C.; Melendi, E.; Carol, E. Methodological proposal for the study of floods in plains areas with a lack of information. DYNA 2020, 87, 221–228. [Google Scholar] [CrossRef]
  56. Sahraei, R.; Kanani-Sadat, Y.; Safari, A.; Homayouni, S. Flood Susceptibility Modelling Using Geospatial-Based Multicriteria Decision Making in Large Scale Areas. ISPRS Ann. Photogramm. Remote Sens. Spat. Inf. Sci. 2023, 10, 677–683. [Google Scholar] [CrossRef]
  57. Weday, M.A.; Tabor, K.W.; Gemeda, D.O. Flood hazards and risk mapping using geospatial technologies in Jimma City, southwestern Ethiopia. Heliyon 2023, 9, e14617. [Google Scholar] [CrossRef]
  58. Poma, M. Evaluación del Peligro por Inundación Pluvial de la Quebrada Santa Cecilia, Huamanga, Ayacucho, 2020; Universidad Cesar Vallejo: Lima, Peru, 2020. [Google Scholar]
  59. Li, Z.; Tang, X.; Li, L.; Chu, Y.; Wang, X.; Yang, D. GIS-based risk assessment of flood disaster in the Lijiang River Basin. Sci. Rep. 2023, 13, 6160. [Google Scholar] [CrossRef]
  60. Osman, S.A.; Das, J. GIS-based flood risk assessment using multi-criteria decision analysis of Shebelle River Basin in southern Somalia. SN Appl. Sci. 2023, 5, 134. [Google Scholar] [CrossRef]
  61. Ludwig, L.; Mattedi, M.A. The information and communication technologies in the risk management of social and environmental disasters. Ambiente Soc. 2018, 21. [Google Scholar] [CrossRef]
Figure 1. Map showing the location of the Andean communities of the Izcuchaca district.
Sustainability 15 13768 g001
Figure 2. Elevation map showing the altitude variations of the study area.
Sustainability 15 13768 g002
Figure 3. Methodological process.
Sustainability 15 13768 g003
Figure 4. Hazard map showing different levels of probability of potential damage from fluvial flooding.
Sustainability 15 13768 g004
Figure 5. Vulnerability level.
Sustainability 15 13768 g005
Figure 6. Vulnerability map showing the spatial distribution of the different levels of fragility to fluvial flood hazards.
Sustainability 15 13768 g006
Figure 7. Risk map showing the spatial distribution of the possibility of fluvial flooding.
Sustainability 15 13768 g007
Table 1. Values according to criterion importance.
CriteriaValues *
Equal importance1
Moderate importance of one variable over another3
Strong importance of one variable over another5
Very strong importance of one variable over another7
Extremely strong importance of one variable over another9
Intermediate comparison values2, 4, 6, 8
* Values expressed from 1 to 9.
Table 2. Hazard level stratification.
RangeArea km2Area ha%Level of Danger
0.268P1< 0.4800.098.900.74Very High
0.142P< 0.26811.951195.2699.26High
0.076P< 0.142000Medium
0.034P< 0.076000Low
Total12.041204.16100
P1 = Hazard.
Table 3. Vulnerability level stratification.
RangeArea haArea km2%PropertiesVulnerability Levels
0.279≤ V10.4561.710.01710.82Very High
0.144≤ V <0.27912.010.12075.424High
0.080≤ V <0.1442.200.02213.85Medium
0.039≤ V <0.0800000Low
Total 15.930.1610031
V1 = Vulnerability.
Table 4. Risk assessment results.
RangeArea haArea km2%Risk Level
0.075≤ R1 ≤0.2190.140.0010.85Very High
0.021≤ R <0.07515.730.1699.15High
0.006≤ R <0.021000Medium
0.001≤ R <0.006000Low
Total 15.870.16100
R1 = risk.
Disclaimer/Publisher’s Note: The statements, opinions and data contained in all publications are solely those of the individual author(s) and contributor(s) and not of MDPI and/or the editor(s). MDPI and/or the editor(s) disclaim responsibility for any injury to people or property resulting from any ideas, methods, instructions or products referred to in the content.

