Article

Spatiotemporal Patterns and Driving Factors of Non-Grain Cultivated Land in China’s Three Main Functional Grain Areas

School of Surveying and Land Information Engineering, Henan Polytechnic University, Jiaozuo 454001, China
*
Author to whom correspondence should be addressed.
Sustainability 2023, 15(18), 13720; https://doi.org/10.3390/su151813720
Submission received: 3 August 2023 / Revised: 10 September 2023 / Accepted: 12 September 2023 / Published: 14 September 2023

Abstract

:
Food security, fundamental to national security, is challenged by the non-grain conversion of cultivated land. Based on the social and economic statistical data in China, this paper explores the spatiotemporal patterns and driving factors of non-grain cultivated land nationwide and in China’s three main functional grain areas during 2000–2020 with the help of the GIS Spatial Analysis and Spatial Metrology Model. The results show, first, that non-grain conversion initially increased but later decreased, with the non-grain level increasing from 30.61% in 2000 to 34.78% in 2003 and then decreasing to 30.28% in 2020; vegetables, fruits, and medicinal herbs were the main non-grain crops in most areas. Second, the non-grain levels showed an obvious spatial agglomeration state; the regions with low non-grain levels were located in the main grain-producing areas, and although the non-grain conversion levels in the main grain-producing areas decreased, the non-grain levels in these areas were clearly lower in the north than in the south. Moreover, the non-grain conversion levels in the main grain-sales areas and the grain production and sales balance areas increased. Third, rural population size, per capita GDP, the proportion of primary industry, and the land transfer rate are important drivers of the non-grain conversion of cultivated land nationally, but there are also significant spatial differences in the influence of these driving factors in different functional grain areas. This paper provides a new research perspective for analyzing the influencing mechanisms of cultivated non-grain land from the three functional grain areas. At the same time, it reveals the roots of the government’s predicament in the governance of non-grain cultivated land. It provides a reference for the government to formulate new policies for managing non-grain cultivated land.

1. Introduction

Cultivated land is fundamental to food security and the most precious strategic resource in the world. With the continuous growth of the global population and rapid economic development, global food security faces various challenges, such as climate change, limited land resources, and water scarcity [1,2]. These factors have exacerbated the imbalance between demand for and supply of food, making food security a global issue [3,4,5,6,7]. Non-grain cultivated land is a typical agricultural phenomenon, with some common global characteristics. As the most populous country, China’s non-grain agriculture threatens global food supply stability and affects food production sustainability under the current complex situation of international food security [3]. Therefore, under the dual threat of decreasing cultivated land resources and the non-grain use of cultivated land, food security has become an urgent problem for all countries to solve.
Non-grain cultivated land refers to land operators’ use of cultivated land for non-grain crops, such as economic crops like vegetables, fruits, and flowers, or for high-efficiency agriculture such as livestock and poultry farming. Moderate development of non-grain cultivated land can fulfil agricultural planting structure adjustment requirements. Moreover, compared with traditional low-efficiency grain planting, non-grain production can effectively increase farmers’ income [8,9]. However, the transformation from grain planting to non-grain production may lead to a series of problems, such as soil erosion, aggravated soil pollution, and increased greenhouse gas emissions. At the same time, non-grain production methods such as digging ponds for fish farming can damage field water conservancy facilities and soil tillage layers, making it very difficult to restore grain planting in the future [10,11].
As a populous country with limited cultivated land, China needs to effectively protect cultivated land and guarantee food security to ensure stable economic and societal development and national security. Protecting cultivated land also has great strategic significance for ensuring global food security and stabilizing international food prices [8,12]. However, because of factors such as low comparative benefits from grain cultivation, the non-grain conversion of cultivated land in China is becoming increasingly prominent, directly leading to a shrinking area of grain cultivation and threatening national food security. Research has shown that about 27% of China’s cultivated land is now non-grain, although the regional percentages vary considerably, exceeding 40% in southwestern and southern China; there are also significant differences in the types of non-grain production between regions [10,13]. The large-scale cultivation of economic crops, fruit trees, and fish ponds on cultivated land not only reduces short-term grain production but also damages the soil cultivation layer, resulting in a long-term decline in grain production capacity.
Seeking to curb this problem, many scholars have extensively researched the spatial pattern evolution and driving factors of non-grain cultivated land and have produced rich research results [14,15,16]. Studies to date mainly cover three aspects. The first is the spatial pattern evolution of non-grain cultivated land. Scholars generally believe that non-grain conversion shows a gradually serious trend from the northeast to the southwest in China, with vegetables and oil crops being the main non-grain types [10,13,17,18]. The second main focus is the influencing factors of non-grain cultivated land. Most scholars believe that the low comparative benefits of grain cultivation are an important driver of non-grain conversion. Other identified drivers include the policy orientation of local governments toward efficient agriculture and industrial development, the entry of industrial and commercial capital into rural areas, and the transfer of cultivated land [19,20,21]. Third, research has concentrated on countermeasures for solving the problem of non-grain cultivated land. Scholars believe that addressing the low comparative benefits of grain cultivation is the key solution. In addition, interventions can be made to reduce the cost of cultivated land transfer, raise the minimum protection price for grain purchase, and improve regulation and policy on non-grain conversion [16,22,23].
The above literature summary reveals that although there are abundant research findings on the spatial patterns of non-grain cultivated land and the heterogeneity of its influencing factors in China, most studies have focused on comparisons between economic regions and traditional administrative regions. In particular, there is a lack of comparative research on China’s three functional grain areas. Therefore, this study investigates differences in non-grain land use in different functional grain areas. The specific research purposes are (1) to explore the spatiotemporal patterns and the driving factors of non-grain cultivated land in order to provide a reference for the protection of cultivated land and food security; (2) to provide a new perspective for the study of non-grain cultivated land; (3) to provide a decision-making reference for China’s non-grain land use strategy.

2. Materials and Methods
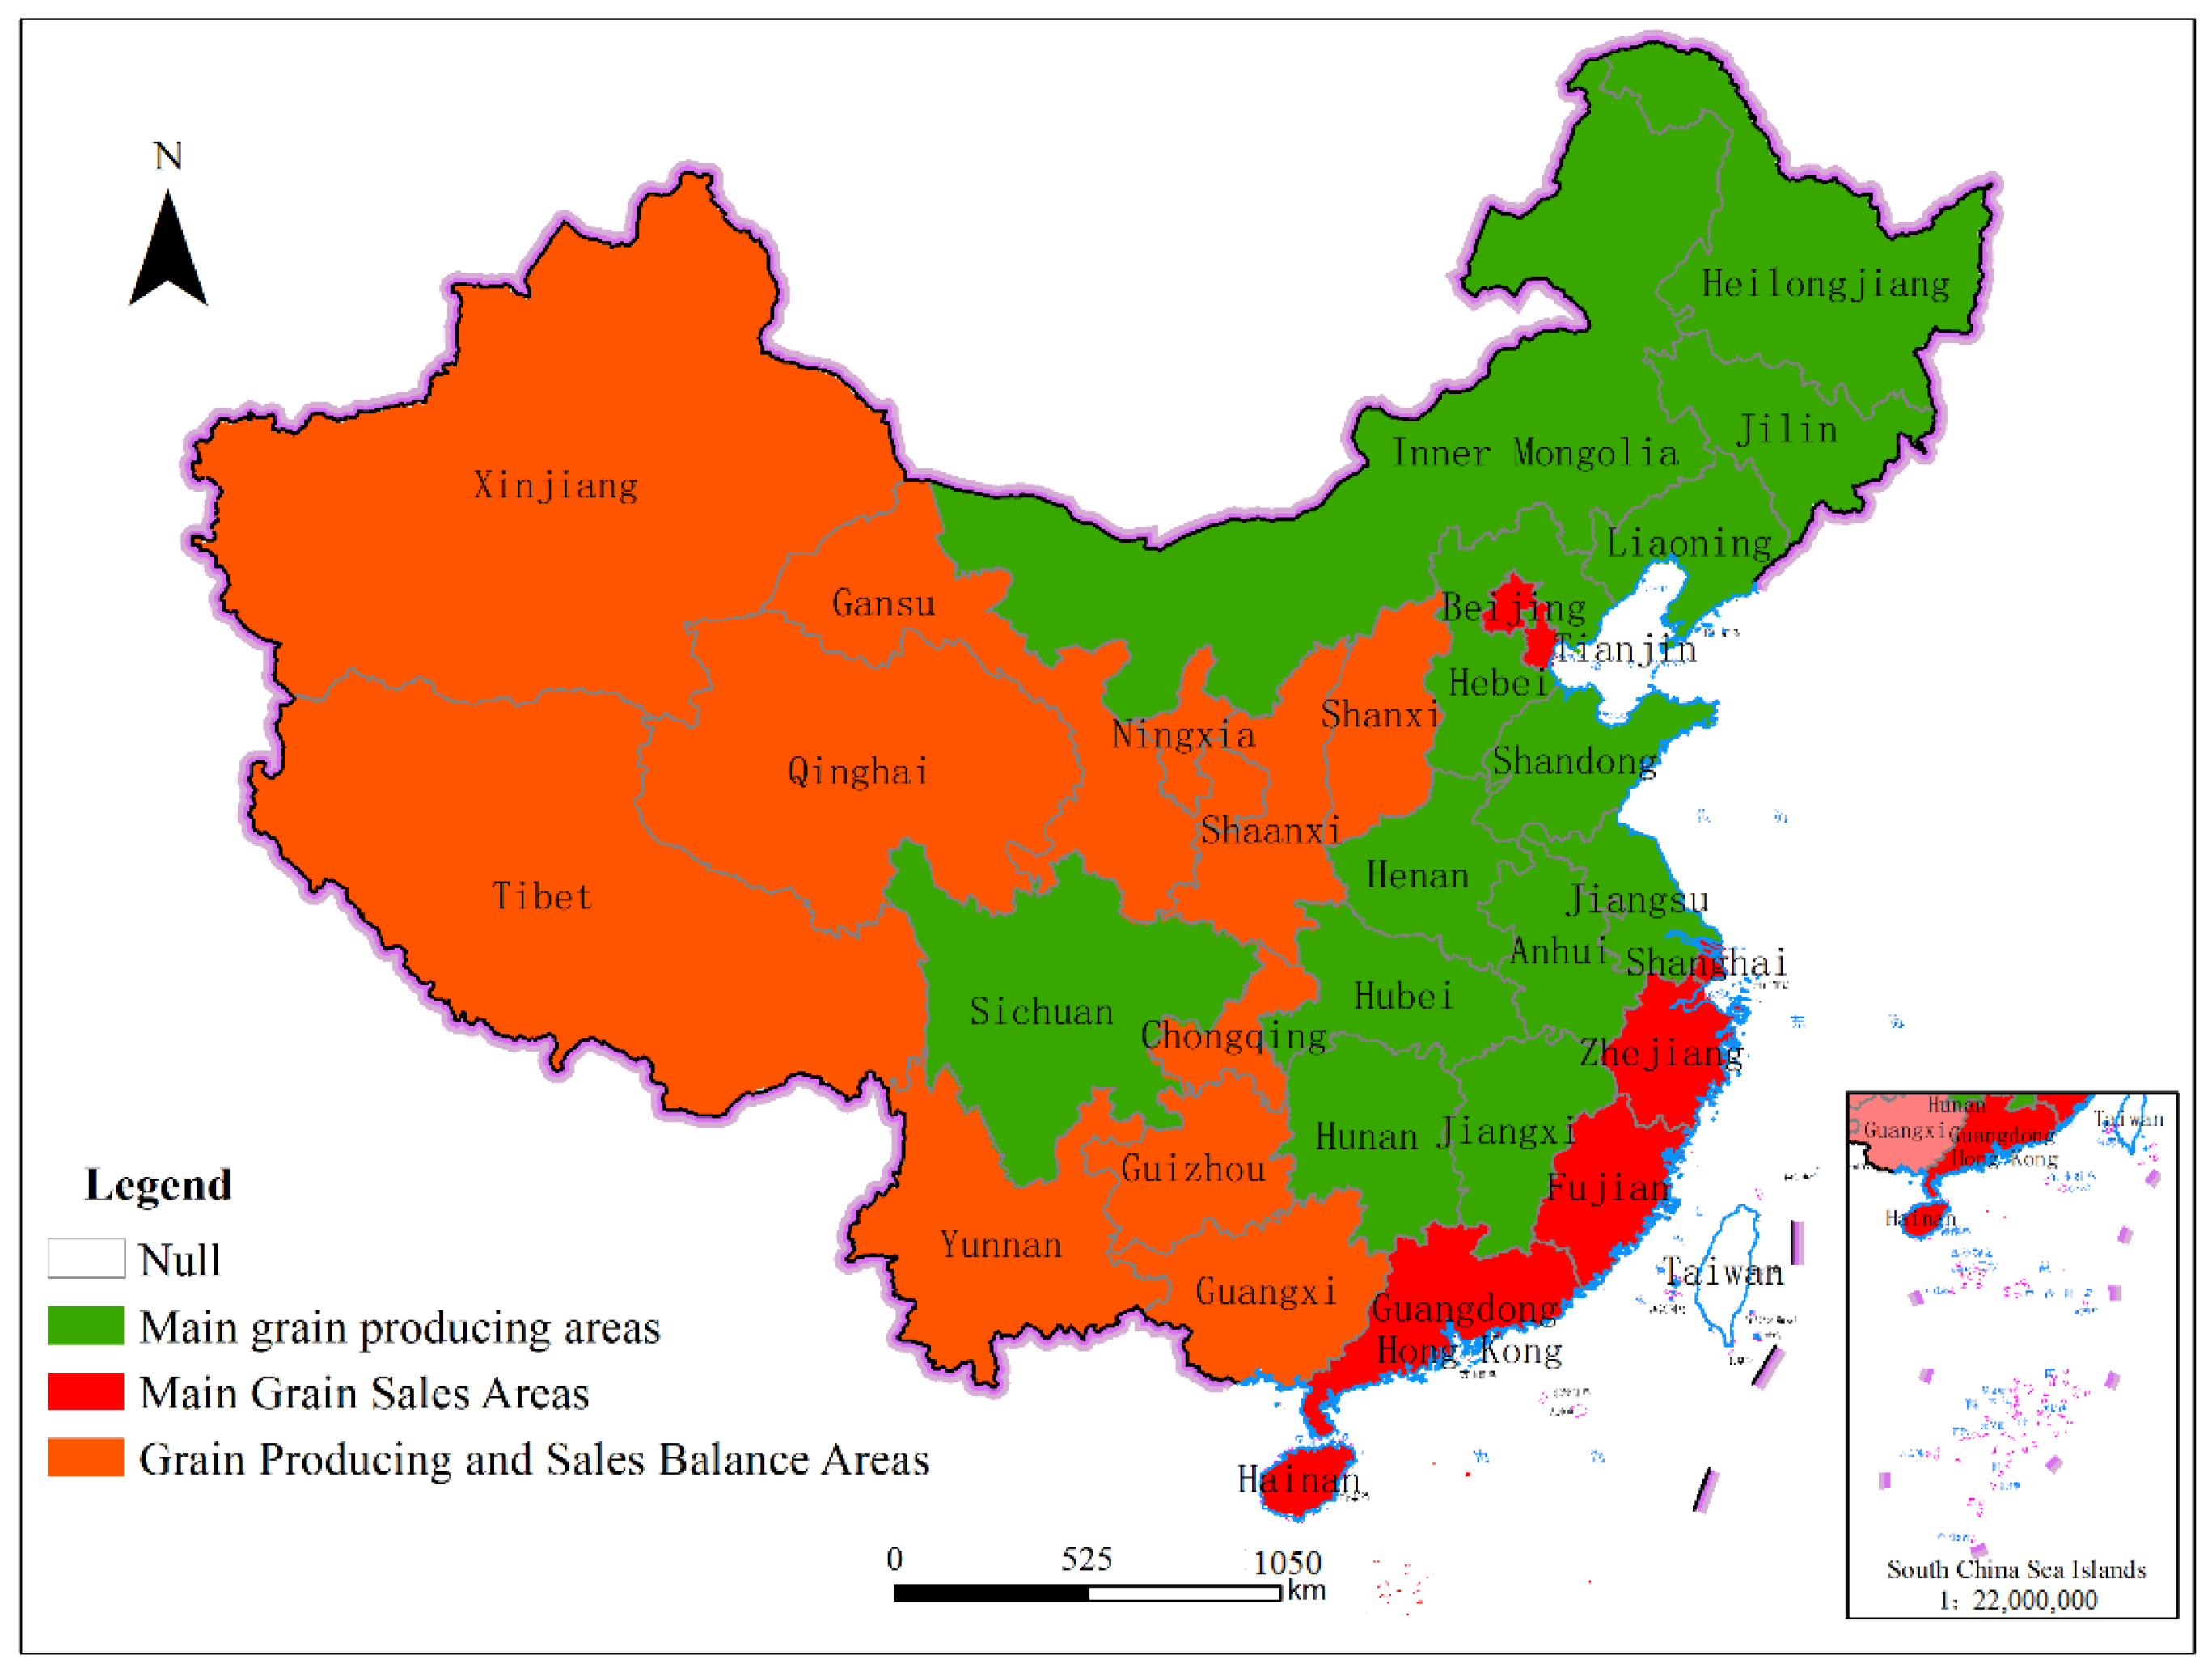
2.1. Study Area

This study takes provincial and municipal administrative regions in mainland China as the research units, selecting 31 provincial administrative units (excluding Taiwan, Hong Kong, and Macao) and 336 municipal units (excluding Sansha City, for which data are unavailable, and treating the four municipalities directly under the central government as one unit). The three functional grain areas are regionally divided into 13 main grain-producing areas, 11 grain production and sales balance areas, and 7 main grain-sales areas, as determined at the National Agricultural and Grain Work Conference in 2004 (Figure 1).

2.2. Data Collection

The non-grain level is measured by the ratio of the sown area of non-grain crops to the total sown area of crops [24]. The data for this study were sourced from the China Statistical Yearbook (http://www.stats.gov.cn/sj/ndsj/, accessed on 15 February 2022), China Rural Statistical Yearbook (http://www.stats.gov.cn/zs/tjwh/tjkw/tjzl/202302/t20230215_1907997.html, accessed on 15 February 2022), provincial statistical yearbooks, and rural statistical yearbooks for relevant years, supplemented where necessary by data from the statistical yearbooks of various cities. Data on the number of agricultural cooperatives and land transfer rates were sourced from the China Rural Management Statistics Yearbook, China Rural Policy and Reform Statistics Yearbook, China Rural Cooperative Economic Statistics Yearbook, the rural statistical yearbooks of some cities (https://data.cnki.net/yearBook?type=type&code=A, accessed on 15 February 2022), and the National Economic and Social Development Statistical Bulletin.

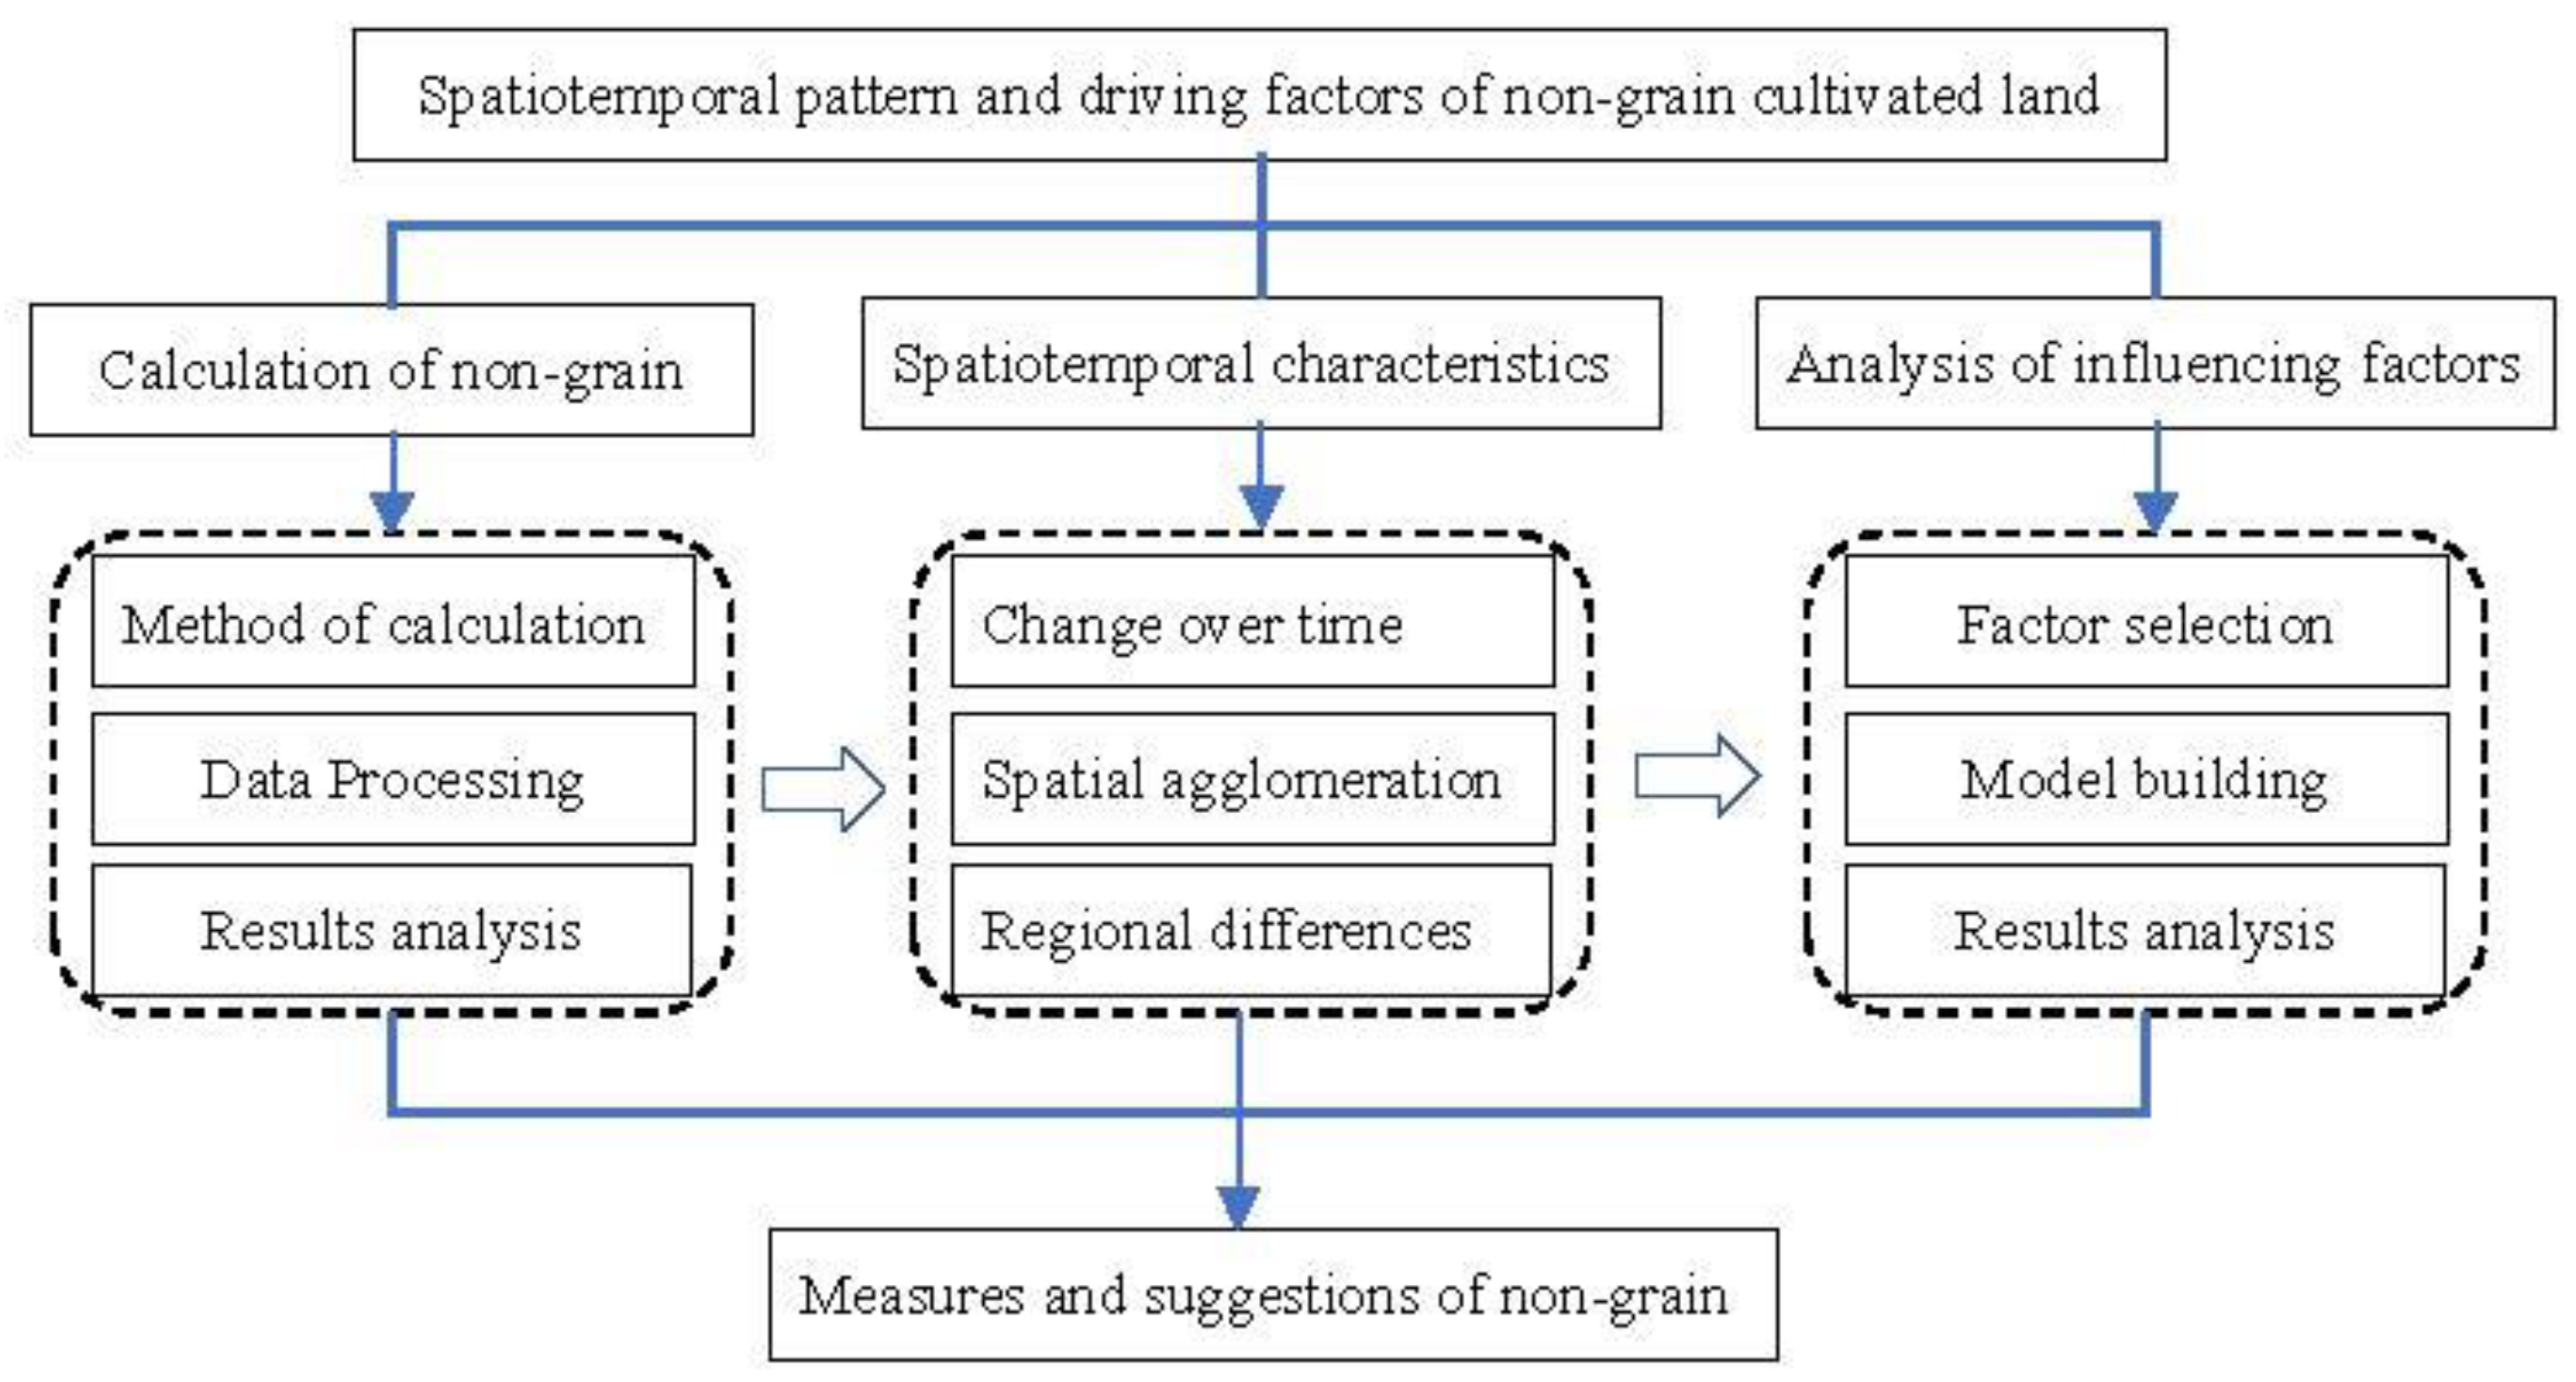
2.3. Research Framework

In order to reveal the characteristics of the spatiotemporal evolution of non-grain land and to explore its mechanisms and influencing factors, we constructed a framework as follows (Figure 2). Step 1: Build datasets of non-grain land and calculate the non-grain level of the whole country and various functional grain areas based on statistical data. Step 2: Analyze the spatiotemporal evolution characteristics of non-grain land with the spatial autocorrelation model. Step 3: Identify the main influencing factors with a regression analysis model. Step 4: Put forward policy suggestions for non-grain agriculture by sub-region.

2.4. Spatial Autocorrelation Analysis

To explore whether non-grain cultivated land in the study area has agglomeration characteristics and to depict the distribution pattern of this cultivated land in different spatial locations, this study uses global spatial autocorrelation and local spatial autocorrelation by GeoDa software (V1.14.0.0) (http://geodacenter.github.io/index-cn.html, accessed on 2 March 2022).

2.4.1. Global Spatial Autocorrelation

The global spatial autocorrelation index (Global Moran’s I) Ig is used to measure the spatial agglomeration structure of non-grain cultivated land in various provinces of China, reflecting the overall spatial agglomeration characteristics. The value of Ig falls in the range [−1, 1]: a value greater than 0 indicates positive spatial autocorrelation between provinces, showing a spatial agglomeration distribution; a value lower than 0 indicates negative spatial autocorrelation between provinces, showing a spatially dispersed distribution; and a value of 0 indicates that there is no spatial autocorrelation among provinces [25,26,27,28]. The formula is as follows:
I g = n i = 1 n j = 1 n W i j ( x i x ) ( x j x ) i = 1 n j = 1 n W i j i = 1 n ( x i x ¯ ) 2
where n represents the number of provinces; xi and xj represent the attribute values of province i and province j, respectively; x ¯ is the average value of each province unit; and Wij is the spatial weight matrix of the unit. When i is adjacent to j, the weight is 1; otherwise, it is 0.

2.4.2. Local Spatial Autocorrelation

Because global spatial autocorrelation describes the overall characteristics of spatial features, and so cannot identify local-level heterogeneity [29], we use local spatial autocorrelation (Local Moran’s I) to explore differences in the spatial distribution of features in local and neighboring areas. When the local spatial autocorrelation index Il is greater than 0, this indicates that the value of unit i is not significantly different from that of surrounding units, meaning a combination of either high–high value or low–low value; when Il is less than 0, this indicates that the feature value of unit i differs significantly from that of surrounding units, meaning a combination of either low–high value or high–low value [30,31,32]. The formula is as follows:
I l = ( x i x ¯ ) j = 1 n W i j ( x j x ¯ ) 1 n × i = 1 n ( x j x ¯ ) 2

2.5. Regression Analysis Model

First, variance inflation factors (VIFs) were used to detect multicollinearity. When VIF > 10, it indicates severe multicollinearity between factors. Therefore, variables with VIF > 10 were removed, and the detection process was repeated until all independent variables had VIF < 10 [2,14]. Next, a multiple linear regression model was constructed using SPSS to test potential driving factors of non-grain cultivated land. The formula is as follows:
y = β 0 + β 1 x 1 + β 2 x 2 + + β n x n + ε
where y represents the dependent variable, x denotes the independent variable, β0 is the regression constant, β1 to βn represent the regression coefficients, ε is the random error, and n represents the number of study units.

3. Results

3.1. Overall Characteristics of Non-Grain Cultivated Land

3.1.1. Change over Time

Affected by factors such as agricultural planting structure adjustment, the non-grain cultivated land in China between 2000 and 2020 showed an N-shaped trend of first rising, then falling, and then rising again (Figure 3). The trends of changes in the sown area of non-grain crops and the non-grain level were basically consistent. Overall, the non-grain level in 2020 was 30.28%, slightly lower than the 30.61% in 2000, whereas the sown area of non-grain crops in 2020 was 507,190 km2, representing an increase of 28,820 km2 from the 478,370 km2 in 2000. These results indicate that the situation of non-grain cultivated land in China is still severe.
Looking at different time periods, the level of non-grain cultivated land showed an upward trend from 2000 to 2003, with economic crops being more dominant. Starting from 2004, a series of favorable national policies, such as subsidies for high-quality crop varieties, direct subsidies for grain farmers, and comprehensive subsidies for agricultural materials, were introduced. Consequently, the area of grain planting in China began to recover, and grain production increased for 12 consecutive years from 2004 to 2015. However, from 2016 onward, the sown area of non-grain crops and the non-grain level significantly increased again. Specifically, from 2016 to 2020, the area of non-grain crops increased by 30,100 km2, and the non-grain level increased by 1.70%.

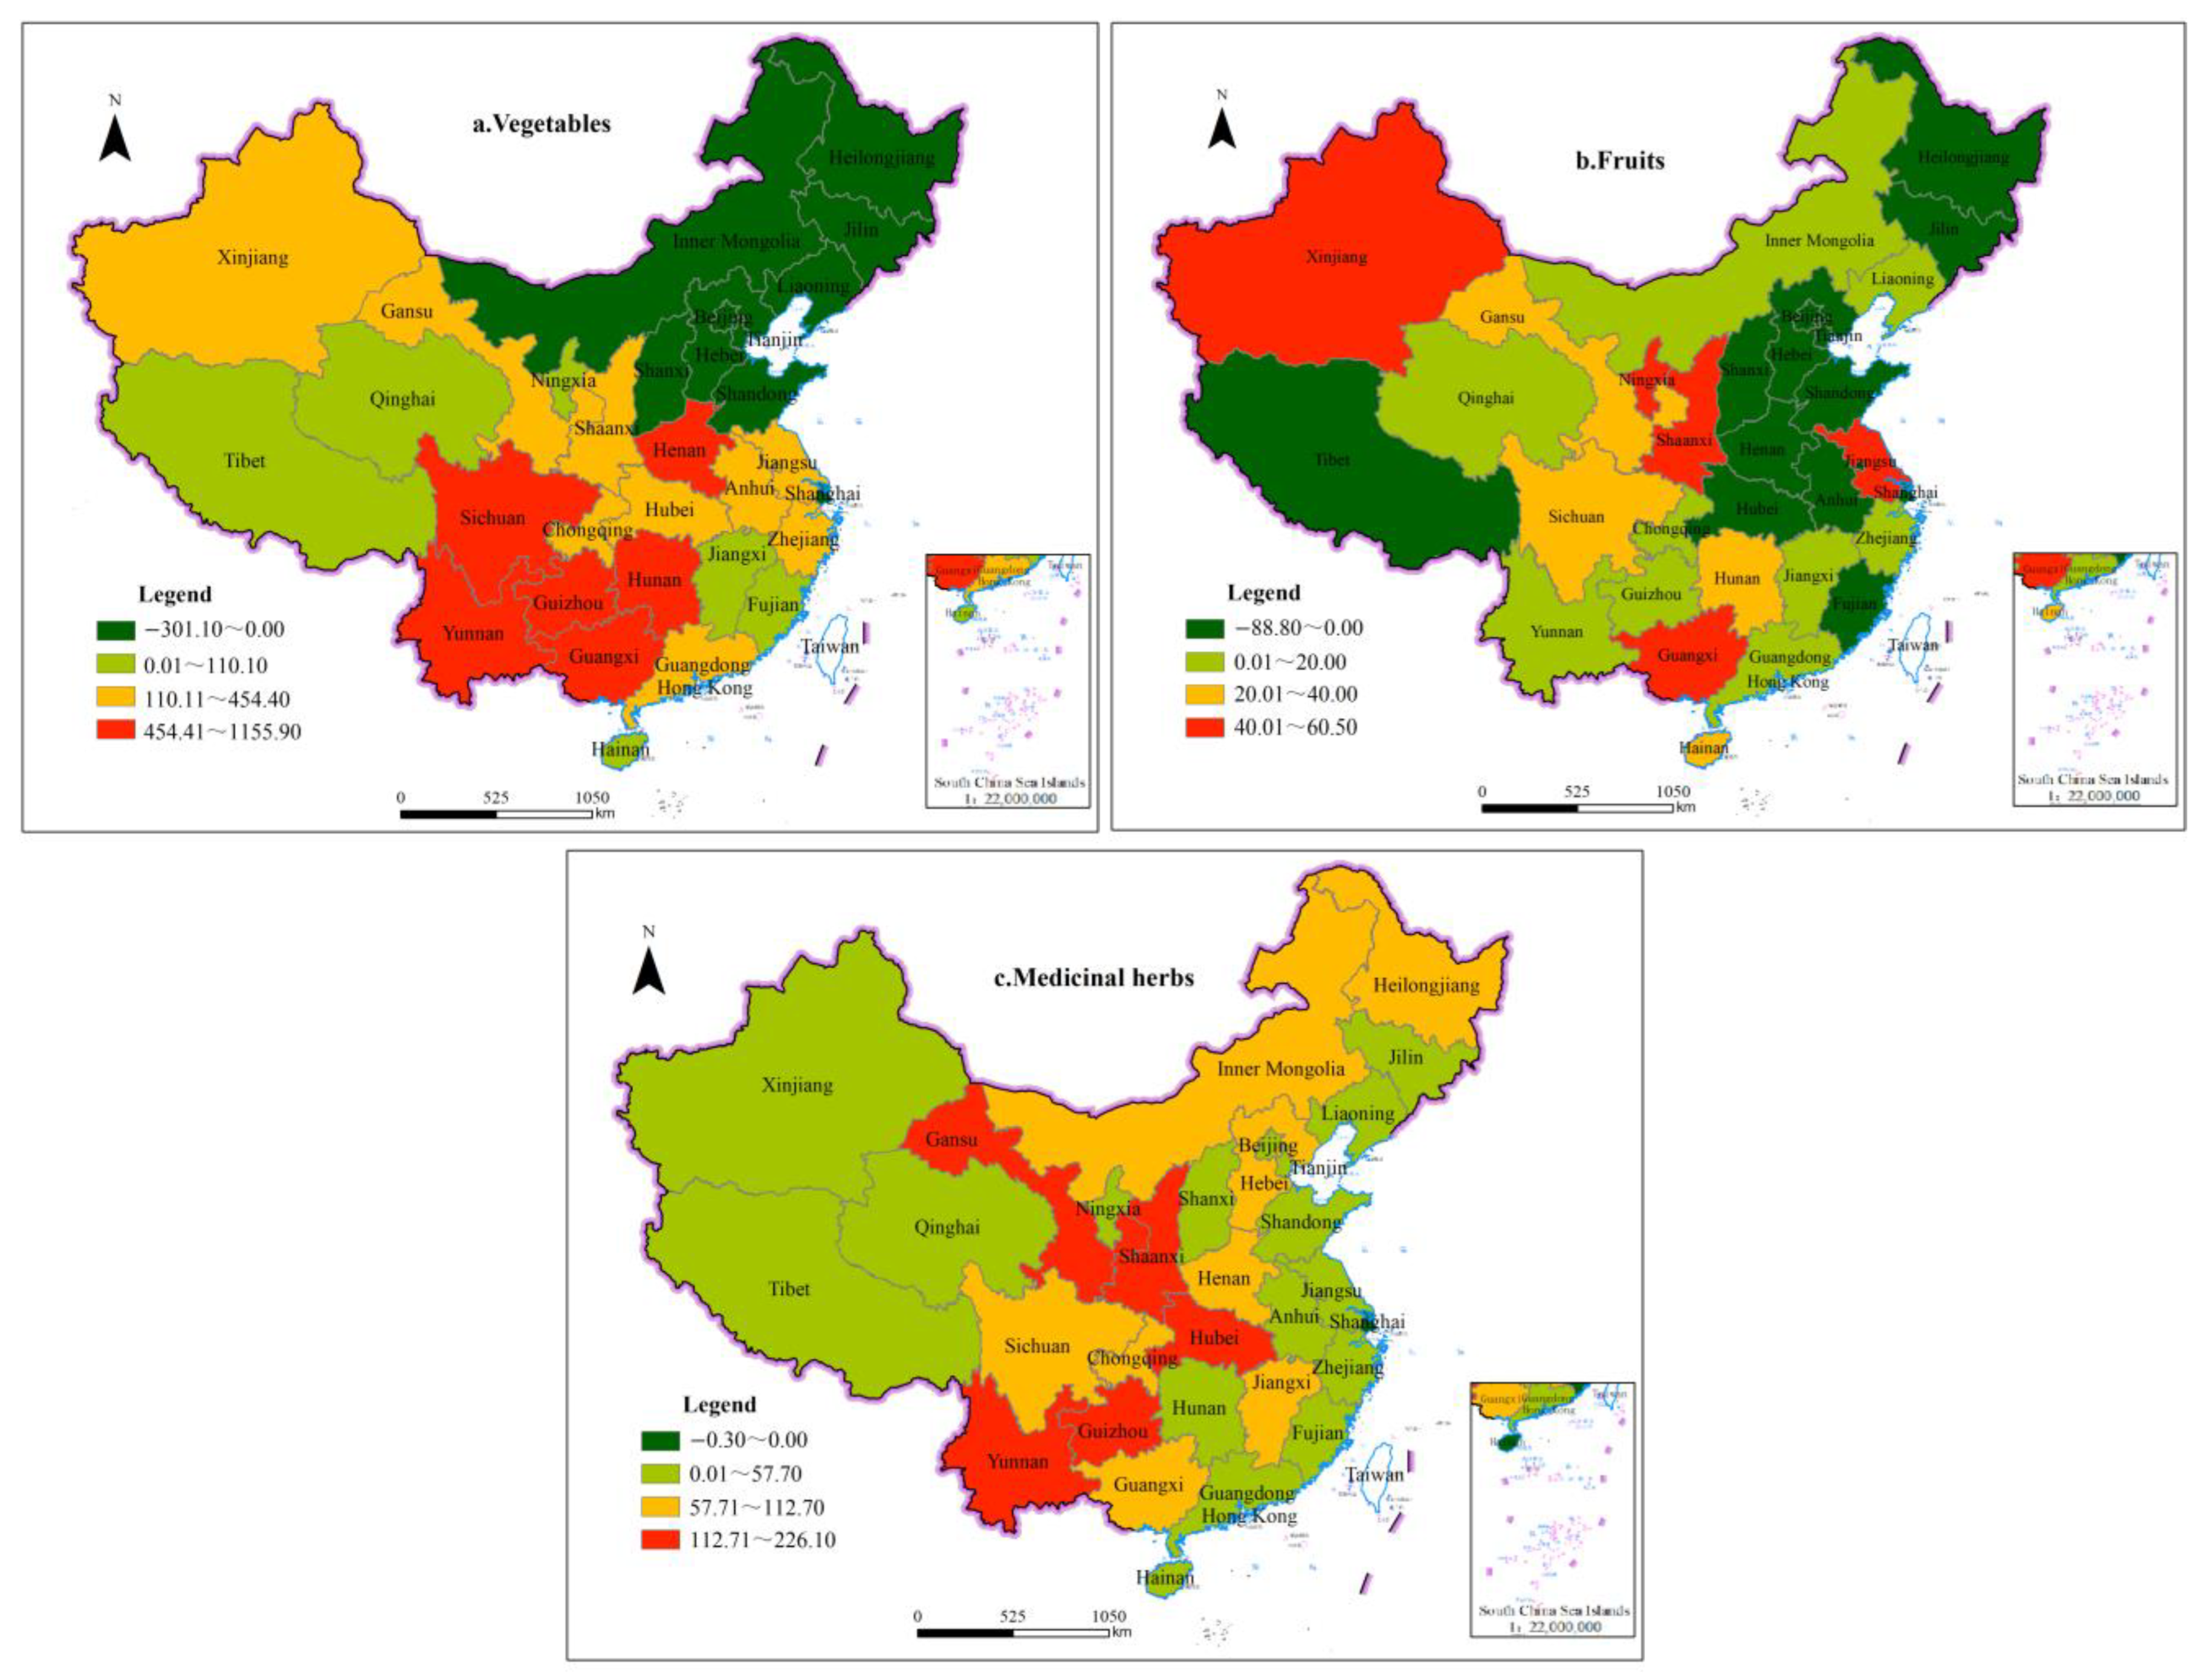
3.1.2. Diversity of Non-Grain Crops

Across the 31 studied provinces, we found considerable diversity in non-grain crop types, with rising trends in the planting areas of vegetables, medicinal herbs, fruits, green fodder, and sugar crops. Vegetables, fruits, and medicinal herbs were the three non-grain crop types with the largest increases in most provinces nationwide; fruits showed a growth trend in most regions of China, while sugar crops and green fodder had large increases in only a few areas. The largest increase in planting area was for vegetables, which rose from 152,373 km2 (9.75%) in 2000 to 214,855 km2 (12.83%) in 2020. Medicinal herbs increased from 6756 km2 (0.43%) in 2000 to 29,051 km2 (1.30%) in 2020 (Table 1). There were some spatial differences in non-grain types between Chinese provinces (Figure 4). The planting area of vegetables increased to varying degrees in all regions except northern and northeastern China, while the planting area of medicinal herbs increased in all regions except Shanghai.

3.2. Spatial Pattern and Differentiation Characteristics of Non-Grain Cultivated Land

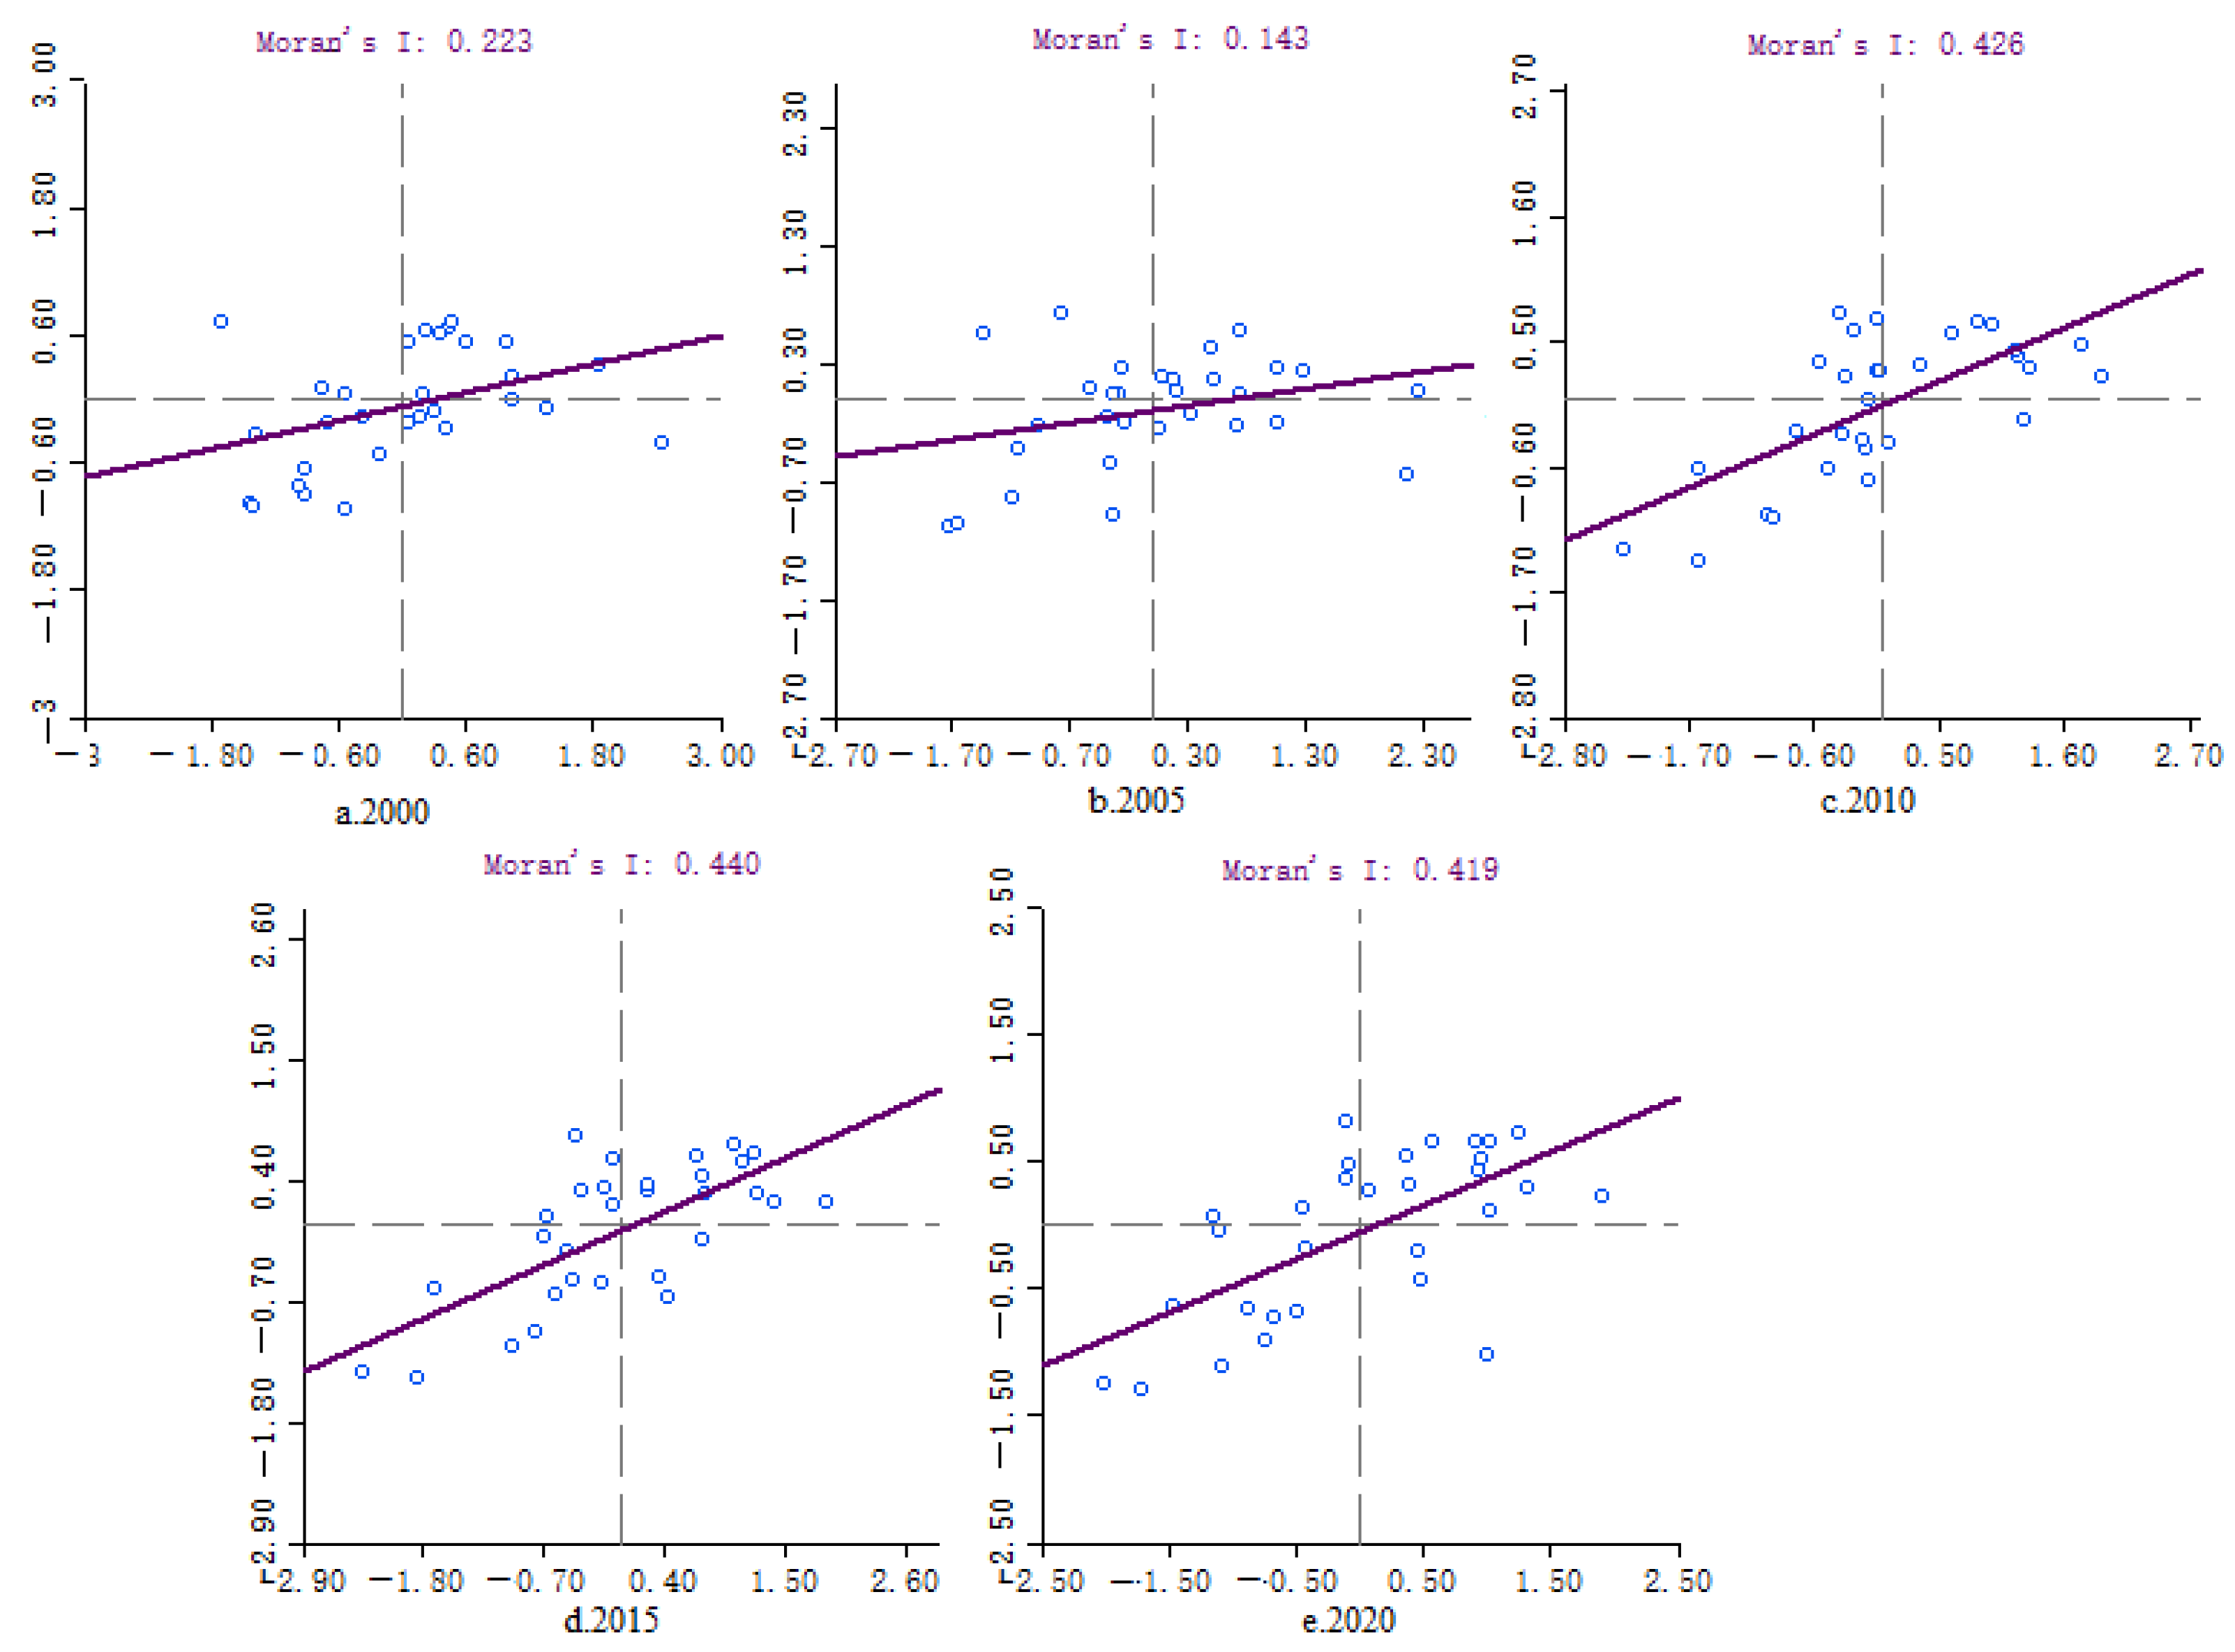
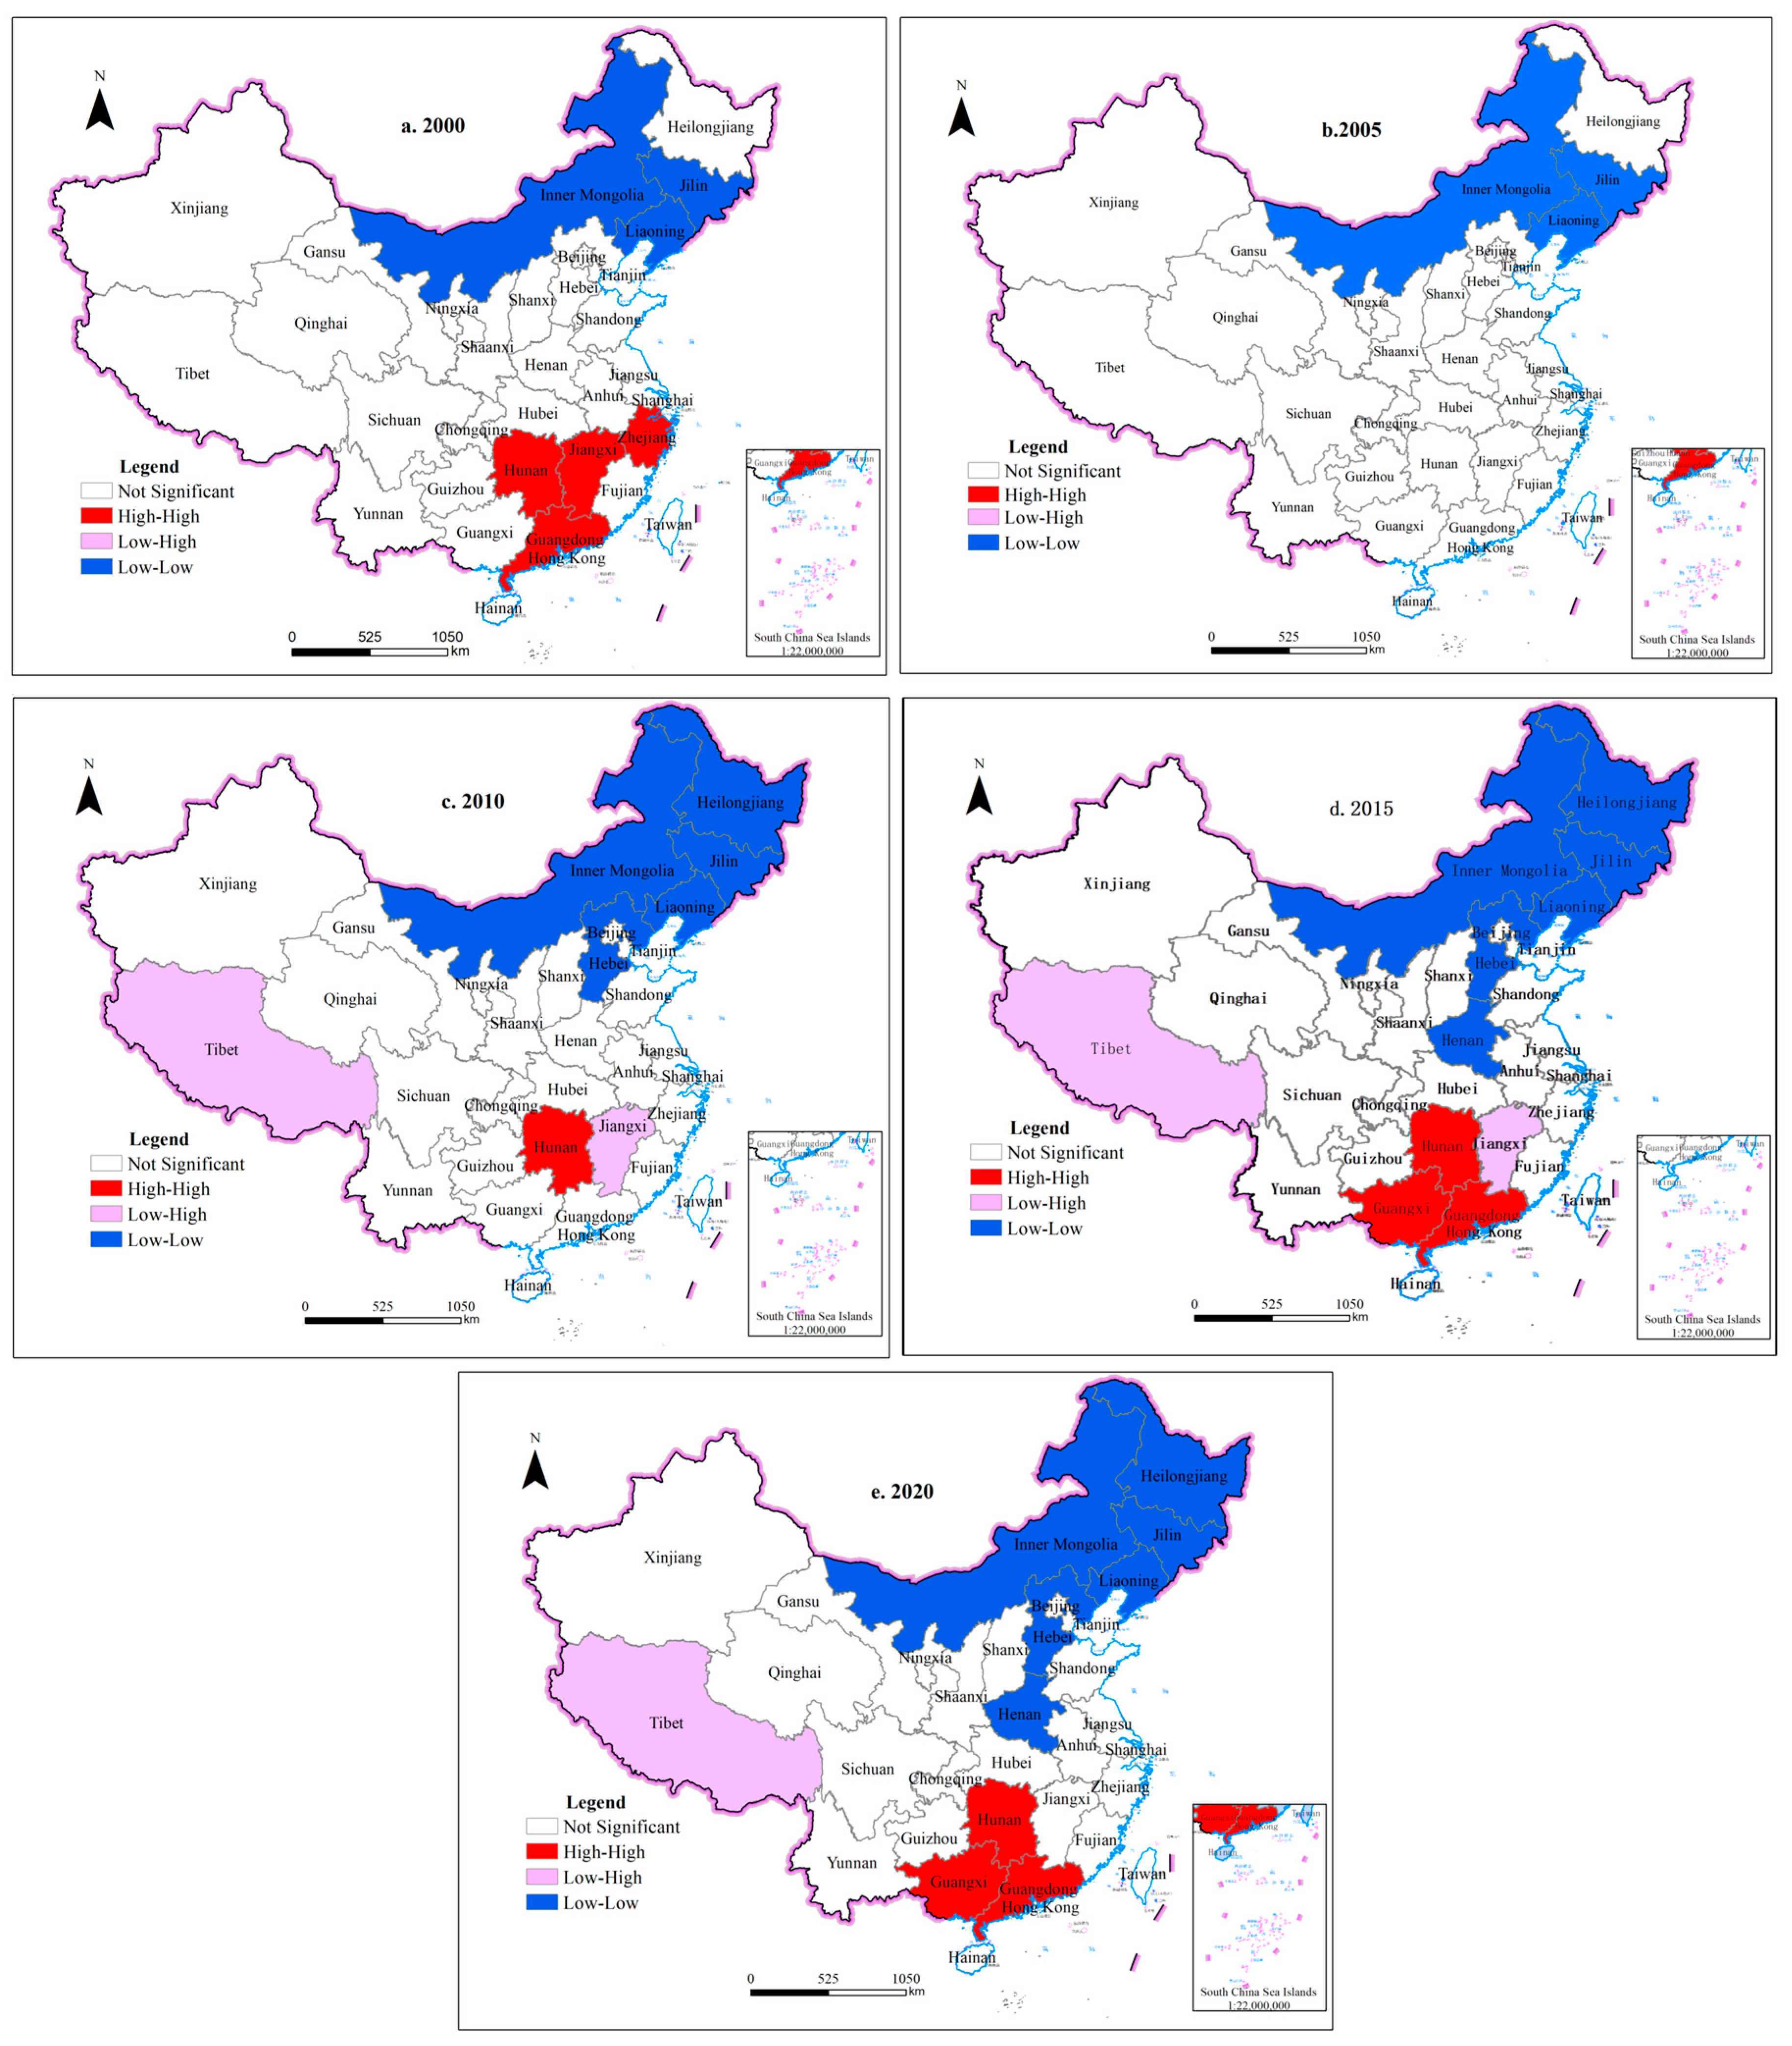
3.2.1. Spatial Agglomeration Characteristics

To further reveal the spatial agglomeration trend and evolution characteristics of non-grain development in China from 2000 to 2020, we conducted global Moran’s I and local Moran’s I analysis on the non-grain level of each province. The global spatial autocorrelation index increased from 0.223 in 2000 to 0.419 in 2020, and both passed the significance level of p < 0.001, indicating that non-grain conversion showed agglomeration distribution characteristics in Chinese provinces, which became more apparent over time (Figure 5).
To further reveal the spatial distribution pattern of non-grain cultivated land, we used GeoDa software to conduct local spatial autocorrelation analysis of the grain production of each province in different periods. Provinces that passed the 5% significance test are included in cluster maps (Figure 6).
Comparing the spatial clusters of non-grain cultivation across China in different periods yields three main findings. First, the spatial agglomeration characteristics of non-grain cultivated land have become stronger over time, with a significant increase in the number of low–low agglomeration areas. Three provinces had low–low agglomeration areas in 2000: Inner Mongolia, Jilin, and Liaoning; in 2020, the number had increased to six provinces with the addition of Heilongjiang, Hebei, and Henan. These provinces are all main grain-producing areas, with flat terrain and large amounts of cultivated land, which is very conducive to mechanized planting. Moreover, the climate in Henan and Hebei makes them important planting bases for dryland corn and wheat. Second, the number of high–high agglomeration areas decreased during the study period. They are mainly concentrated in Guangdong, Guangxi, and Hunan provinces, where the high level of non-grain cultivated land is mainly attributable to the unique natural environment being especially suitable for economic crops, such as fruits and vegetables. Third, the number of provinces with low–high and high–low agglomeration areas gradually decreased, in contrast to the continued strengthening of areas with the same type of agglomeration state, indicating obvious regional differences in non-grain cultivated land.

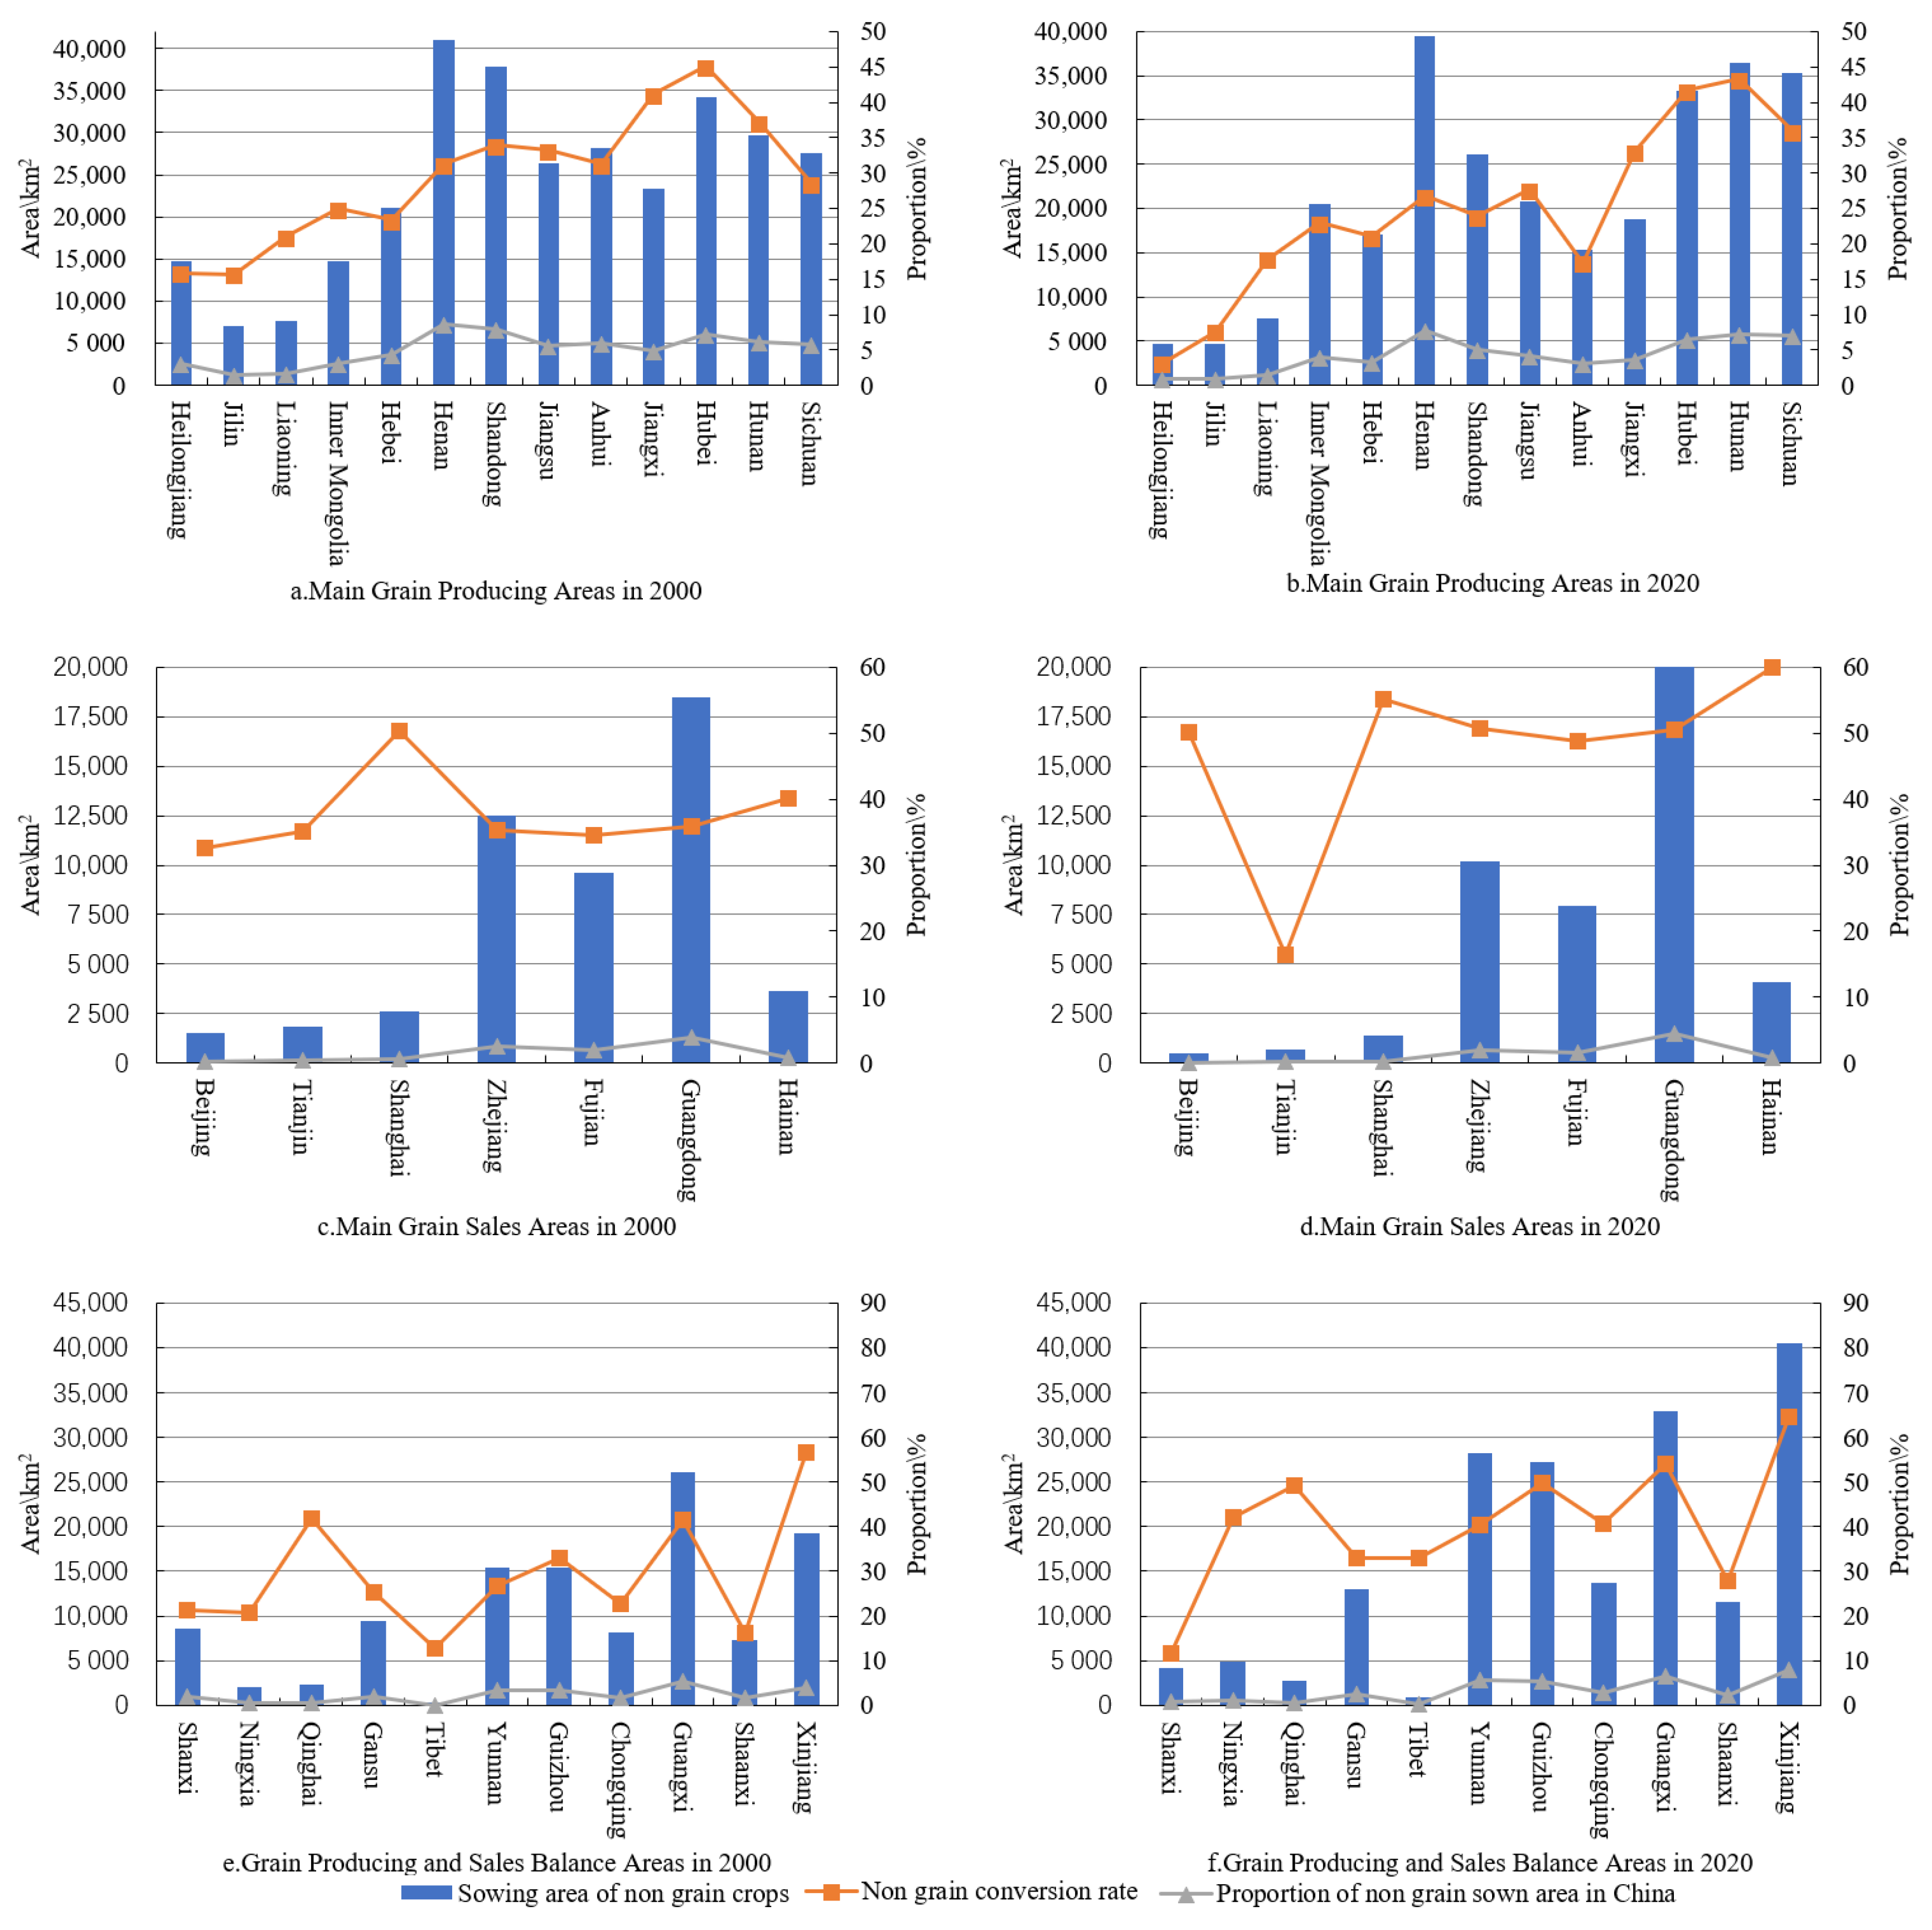
3.2.2. Spatial Differentiation Characteristics of Functional Grain Areas

During the study period, the overall non-grain level of cultivated land in the main grain-producing areas decreased but with uneven regional distribution.
In 2020, about 69.3% of the total sown area of crops, 75.4% of the sown area of grain crops, and 78.6% of the total grain output in China was contributed by the 13 main grain-producing areas, making a huge contribution to national food security. In 2020, the non-grain crop sown area in the main grain-producing areas was 279,935 km2, accounting for 55.19% of the total non-grain crop planting area in China; the non-grain level was 24.12%. Compared with 2000, the non-grain crop sown area and non-grain level in the main grain-producing areas both decreased, and they were also lower than the respective national average levels.
In 2020, among the 13 main grain-producing areas, the non-grain levels of cultivated land in Hunan, Hubei, Sichuan, and Jiangxi provinces were all above the national average level. Meanwhile, the two provinces with the highest contribution rates to grain production, Heilongjiang (11.26%) and Henan (10.20%), had significantly different non-grain levels of 3.16% and 26.89%, respectively. The non-grain crop-planting area as a proportion of the national total also varied greatly, with Heilongjiang province recording the lowest at 0.93% and Henan province the highest at 7.79%. Compared with 2000, except for Hunan and Sichuan provinces, the main grain-producing areas showed a downward trend in this proportion during the study period.
The high non-grain levels of cultivated land in Hunan (43.40%), Hubei (41.75%), and Sichuan (35.91%) provinces may be explained by the hilly terrain in these areas, where economic crops are easier to cultivate than food crops. In contrast, the four provinces with lower non-grain levels—Heilongjiang (3.16%), Jilin (7.63%), Anhui (17.33%), and Liaoning (17.74%)—have concentrated black soil in the northeast, which is not only suitable for large-scale mechanized production but also has good grain output benefits. Therefore, the non-grain levels of cultivated land in the northeastern three provinces were low. Similarly, Anhui province has an extremely advantageous geographical location, with hilly areas in the south suitable for rice and other food crops, and with plains in the north suitable for wheat and other crops. Therefore, the non-grain level of cultivated land in Anhui is also relatively low.
Our next main finding is the prominence of non-grain cultivated land in the main grain-sales areas and farmers’ low enthusiasm for growing grain.
In 2020, the planting area of non-grain crops in China’s seven main grain-sales areas was 47,305 km2, accounting for 9.33% of the total non-grain crop-planting area nationwide. Compared with 2000, both the planting area and proportion of non-grain crops in the main grain-sales areas showed downward trends. However, the non-grain level of cultivated land in these areas increased from 36.11% in 2000 to 49.55% in 2020, significantly exceeding the national average.
Among the seven main grain-sales areas, the non-grain level showed a linear upward trend from 2000 to 2020 and exceeded 50% in most areas during that period. Reasons include Beijing, Shanghai, and Tianjin being important centers of national political and economic development, with limited cultivated land and low profitability of grain cultivation, leading to low enthusiasm among farmers for growing grain. Moreover, the provinces of Zhejiang, Fujian, Guangdong, and Hainan are located in economically developed areas in East China, where more cultivated land resources are invested in high-value economic crops, resulting in a prominent non-grain phenomenon. For instance, the non-grain level in Hainan reached 60.0%. In these four provinces with high levels of economic development and more choices in industries, grain cultivation is squeezed, and improvement in both production capacity and efficiency is slow relative to the main grain-producing areas.
Our third main finding is that in grain production and sales balance areas, the non-grain level and non-grain planting area increased rapidly and synchronously during the study period.
In 2020, the planting area of non-grain crops in China’s 11 grain production and sales balance areas of China was 179,949 km2, accounting for 35.48% of the total non-grain crop-planting area in the country. Compared with 2000, the planting area and proportion of non-grain crops in the grain production and sales balance areas both showed an upward trend, and the non-grain level also increased from 30.21% in 2000 to 42.97% in 2020, which is much higher than the national average non-grain level (Figure 7).
Among the 11 grain production and sales balance areas, the non-grain level of cultivated land in 2020 was above the national average in 9 provinces and regions (the exceptions being Shaanxi (27.87%) and Shanxi (11.62%)). Among them, Xinjiang, Guangxi, Guizhou, and Qinghai had higher non-grain levels of cultivated land, at 64.49%, 54.05%, 49.70%, and 49.25%, respectively. Compared with 2000, the non-grain level of cultivated land showed an upward trend in every area except Shanxi, where it decreased by 9.56% from 2000 to 2020. Xinjiang having the highest non-grain level (64.49%) is mainly attributable to the province’s light and heat conditions being especially conducive to growing cotton (39.8%) and fruits and vegetables (23.5%). The high non-grain levels in Guangxi and Guizhou are mainly explained by the light and heat conditions and hilly and mountainous terrain being conducive to growing tropical crops. Meanwhile, the high non-grain level in Qinghai is predominantly attributable to the scarcity and dispersion of agricultural land; the poor quality of soil, with thin layers, coarse texture, and many stones; and poor heat conditions—conditions that limit the plant varieties that can be grown. By contrast, the low non-grain level in Shanxi (11.62%) is related to the climate of the Loess Plateau, which is especially suitable for one-year–one-crop cultivation of dryland crops such as corn, wheat, and sorghum.

3.3. Driving Factors of Chinese Non-Grain Cultivated Land

3.3.1. Variable Selection

Related research results [23,33,34] show that the factors influencing the non-grain conversion of cultivated land are relatively complex, comprising not only micro-level drivers such as agricultural and farmer planting behavior but also natural, socio-economic, and policy factors. To further explore the driving factors of non-grain cultivated land in China’s three functional grain areas and nationwide, this study preliminarily selected 14 candidate factors, reflecting five relevant aspects: resource endowment, factor input, social development, economic level, and policy regulation (Table 2).

3.3.2. Analysis of the Driving Factors

To clarify the main driving factors of non-grain cultivated land in China, regression models were fitted and analyzed separately at the provincial and municipal levels. The results of the regression models at different scales are shown in Table 3. At the provincial level, the total mechanical power per unit of cultivated land (x4) and rural population (x6) were significantly positively correlated with non-grain area at the 1% level, while the number of agricultural cooperatives (x13) was significantly negatively correlated with non-grain area at the 1% level. The income ratio of urban and rural residents (x10) was also significantly positively correlated with non-grain area at the 5% level. However, none of the other variables were significantly correlated with non-grain area. At the municipal level, cultivated area (x1) was significantly negatively correlated with non-grain area at the 5% level, indicating that the larger the regional cultivated land area, the more significant the agricultural scale benefits and the lower the proportion of non-grain planting. Rural population (x6) and the agricultural proportion of the labor force (x7) were significantly positively correlated with non-grain area at the 1% and 5% levels, respectively. These results indicate that the higher the rural population and surplus labor force, the more economic crops with high investment return rates will be planted, owing to comparative benefits over planting grain. Per capita GDP (x9) and agricultural output value (x11) were both positively correlated with non-grain area at the 1% level, indicating that the higher the regional economic level and the proportion of primary industry, the higher the non-grain planting area. The number of agricultural cooperatives (x13) and the land transfer rate (x14) were positively correlated with non-grain area at the 5% and 1% levels, respectively, indicating that the level of agricultural socialization services and the degree of land transfer are also important factors promoting non-grain cultivated land. Overall, the driving factors at the municipal level are completely different from those at the provincial level, indicating the complex spatial heterogeneity of non-grain cultivation land nationwide.
Next, to further clarify the spatial heterogeneity of the driving factors of non-grain cultivated land in different functional areas, regression models were fitted separately for the main grain-producing areas, main grain-sales areas, and grain production and sales balance areas at the municipal level (Table 3).
Considering first the main grain-producing areas, these are characterized by a good natural agricultural endowment, favorable infrastructure conditions, and a relatively high land output rate. Except for Hubei (41.7%), Hunan (43.4%), and Sichuan (35.9%) provinces, all the main grain-producing areas have a lower non-grain level than the national average (35.5%). Regression analysis found that the non-grain level is mainly driven by cultivated area (x1), rural population (x6), and per capita GDP (x9), while other factors are not significant. Cultivated area is significantly negatively correlated with the non-grain level. The main grain-producing areas have abundant cultivated land resources and good natural endowment conditions, and they are also concentrated and contiguous. In these areas, large-scale mechanized grain planting and intensive production is more conducive to increasing economic income, making non-grain planting less attractive. By contrast, the rural population is significantly positively correlated with the non-grain level. The main grain-producing areas are characterized by a large income gap between urban and rural areas, and have a relatively low economic development foundation. The higher the rural population, the more cultivated land will be used for growing economic crops with high investment return rates. Per capita GDP is also significantly positively correlated with the non-grain level in these areas. Heilongjiang, the main grain-producing area with the lowest per capita GDP (CNY 48,564), has a non-grain level of only 3.2%, whereas the non-grain level in Hubei and Hunan provinces, where per capita GDP is relatively high, exceeds the national average. These results indicate that economic driving is also a major driving factor of the non-grain level in China’s main grain-producing areas.
Turning next to the main grain-sales areas, these are characterized by generally fast urbanization, a small per capita cultivated land area, and a high cultivated land transfer rate. The transfer rate in these areas averages 50.3%, reaching 75.4% in Shanghai. Land turnover in these areas has also further expanded the scale of agricultural cooperatives. Before the introduction of cultivated land turnover, individual households mainly used cultivated land to grow grain to meet families’ basic survival needs. Subsequently, however, the basic guarantee function of cultivated land weakened, and growing grain ceased to be a rigid demand. Driven by economic interests, new agricultural management entities tend to grow non-grain crops, inducing a trend of non-grain cultivated land. The above considerations explain why the number of agricultural cooperatives (x13) and the land transfer rate (x14) were found to be the main driving factors of non-grain cultivated land in China’s main grain-sales areas.
In addition, grain yield per unit area (x3) directly reflects the quality of cultivated land and, in turn, the efficiency of grain production. The regression results show that grain yield per unit area is significantly negatively correlated with the non-grain level: the higher the yield per unit area, the lower the non-grain conversion of cultivated land. Conversely, the rural Engel coefficient (x12) is significantly positively correlated with the non-grain level, reflecting that economic crops generate a higher income for farmers than grain in the main grain-sales areas.
Finally, we consider the regression results for grain production and sales balance areas, which are located mostly in China’s northwestern and southwestern regions. These areas are characterized by a large gap between urban and rural areas and a fragile ecological environment with poor-quality cultivated land. Regression analysis shows that the cultivated land area per capita of both the agricultural population (x2) and rural population (x6) is significantly positively correlated with the non-grain area at the 1% level, while agricultural output value (x11) and the number of agricultural cooperatives (x13) are significantly positively correlated with the non-grain area at the 5% level. These results are consistent with previous findings [29].
Explanations for these findings are as follows. First, the grain production and sales balance areas are characterized by fewer people and more land. When the rural population is higher, farmers have more energy to turn to planting high-profit specialty crops such as fruits, vegetables, and cotton. Second, most of these areas have distinctive terrain, climate, and other conditions and a poor natural endowment of cultivated land, resulting in low yields of grain crops. With the optimization and development of the industry and the improvement of agricultural socialized services, such as the promotion and development of mechanization and informationization, the efficiency and benefits of non-grain crop planting in these areas have been greatly improved, promoting the development of non-grain cultivated land.

4. Discussion

According to the research results in this paper, the non-grain level in 2020 was 30.28%, slightly lower than the 30.61% in 2000. However, the study found significant differences in the non-grain levels among different functional grain areas. In 2020, the non-grain level in the main grain-sales areas (49.55%) and grain production and sales balance areas (42.97%) was significantly higher than the national average, which is consistent with existing research viewpoints [35,36]. This pattern also aligns with the northward shift of China’s grain production focus, resulting in further differentiation among different functional grain areas. Considering the positive externality of grain as a public good and the imperfections of compensation systems [37], this may further widen regional development gaps.
Many factors contribute to the non-grain use of cultivated land, and the levels vary greatly between different regions. Currently, many scholars believe that the land transfer rate is an important driving factor of non-grain cultivated land [38,39,40,41,42]. However, our regression results for China’s three functional grain areas reveal clear spatial heterogeneity in the impact of land transfer on the non-grain use of cultivated land. In China’s main grain-producing areas and grain production and sales balance areas, land transfer is negatively correlated with non-grain cultivated land, but not significantly. By contrast, in China’s main grain-sales areas, land transfer is significantly positively correlated with the non-grain use of cultivated land. The main grain-producing areas have a higher land transfer rate than the national average but a lower non-grain level than the national average, except in Hubei, Hunan, and Sichuan. Notably, Heilongjiang has a land transfer rate over 50% but a non-grain level of only 3.2%, indicating that large-scale mechanized grain planting after transfer is more conducive to increasing economic income. Generally in these areas, the higher the land transfer rate, the lower the non-grain level. By contrast, the grain production and sales balance areas are characterized by a low land transfer rate but a high non-grain level, indicating that land transfer is not the key factor driving non-grain cultivated land in these areas. In the main grain-sales areas, the per capita cultivated land area is small, land fragmentation is high, and the land transfer rate mostly exceeds 50%. Before land transfer, scattered cultivated land in these areas was used mainly for grain planting; after land transfer, the basic security function of cultivated land weakened, and non-grain economic crops have been increasingly planted. Therefore, in these areas, the land transfer rate is significantly positively correlated with the non-grain use of cultivated land.
Moreover, this study still has certain limitations due to the availability of data. The exploration of influencing factors relied solely on the analysis of statistical yearbook data, without fully considering the impact of farmers’ own behavioral factors. These deficiencies and shortcomings need to be improved in future research. Meanwhile, future research could narrow the scope of the study and conduct on-site investigations in villages to obtain accurate data on farmers. Remote sensing and multi-temporal field investigations could be used to capture different types and spatial patterns of non-food crops. This would enable a more comprehensive and in-depth exploration of the impact mechanism of non-grain cultivated land from a micro perspective.

5. Conclusions and Recommendations

5.1. Conclusions

This article investigated the non-grain use of cultivated land in China’s three functional grain areas from 2000 to 2020, analyzed the spatiotemporal evolution and regional differences of non-grain cultivation and, finally, identified the driving factors. The main conclusions of the study are as follows.
First, the non-grain use of cultivated land in China showed an upward trend followed by a downward trend during 2000–2020. The level in 2020 (30.28%) was slightly lower than in 2000 (30.61%). During the study period, the center of non-grain cultivated land gradually shifted to the southwest and showed clear spatial clustering. High-clustering areas were mainly concentrated in Guangdong, Guangxi, and Hunan provinces, while low-clustering areas were mainly concentrated in the six main grain-producing areas of Inner Mongolia, Jilin, Liaoning, Heilongjiang, Hebei, and Henan.
Second, regarding the three functional grain areas, the non-grain level in the main grain-producing areas was significantly lower than the national average. However, substantial differences between the 13 provinces were identified, with a lower non-grain level in northeastern China but a higher level in southern provinces such as Hunan, Hubei, and Sichuan. In the main grain-sales areas, the non-grain level showed an increasing trend, but the area of non-grain crops decreased. Meanwhile, both the non-grain cultivation level and area increased in the grain production and sales balance areas.
Finally, the driving factors of non-grain use of cultivated land have obvious spatial heterogeneity in China, with significant differences between different regions. In the main grain-producing areas, with better natural agricultural endowment conditions, the cultivated land area, rural population, and per capita GDP are the most important driving factors of non-grain cultivation. By contrast, the land transfer rate, number of agricultural cooperatives, grain yield per unit area, and rural Engel coefficient are the main driving factors in China’s main grain-sales areas. In the grain production and sales balance areas, the cultivated land area per capita of agricultural population and per rural population, the proportion of primary industry, and the number of agricultural cooperatives jointly drive the spatial pattern differentiation of non-grain cultivated land.

5.2. Recommendations

Based on the research results, we make the following suggestions to curb the non-grain use of cultivated land in China.
First, in the main grain-producing areas, continue to leverage resource advantages, encourage land transfer, increase agricultural scale, increase investment in grain seed industry research and development, and improve the efficiency of grain planting. At the same time, relevant preferential policies should be further tilted toward grain-planting households to increase confidence in grain-scale planting and prevent non-grain planting.
Second, in the main grain-sales areas, we recommend fully utilizing favorable climate conditions, such as sufficient light and precipitation in the subtropical region, as well as the advantages of developed economy, talent, technology, and funds. The construction of high-standard cultivated land should be vigorously promoted and, except in Beijing, Shanghai, and Tianjin, the expansion of non-grain cultivated land should be curbed by setting a self-sufficiency bottom line for grain.
Finally, in the grain production and sales balance areas, it is necessary to recognize the fragility of the ecological environment and poor agricultural production conditions. Measures therefore need to be adapted to local conditions and deployed in combination with the land use control system, implementing differentiated land use control measures. The planting purposes of general cultivated land, permanent basic cultivated land, and high-standard cultivated land should be clearly defined, and production activities and planting structures on cultivated land should be strictly regulated.

Author Contributions

Conceptualization, S.Z.; methodology, S.Z.; software, M.Y.; data curation, M.Y. and D.X.; writing—original draft preparation, S.Z., M.Y. and D.X.; writing—review and editing, S.Z.; funding acquisition, S.Z. and D.X. All authors have read and agreed to the published version of the manuscript.

Funding

This work is supported by the National Natural Science Foundation of China (Grant No. 42201297), Social Science Research Fund Project of Henan Polytechnic University (Nos. GSKY2022-01), and the Program for Innovative Research Team (in Philosophy and Social Science) at the University of Henan Province (Grant No. 2022-CXTD-02).

Institutional Review Board Statement

The study did not require ethical approval.

Informed Consent Statement

Informed consent was obtained from all subjects involved in the study.

Data Availability Statement

The data and models generated or used during the study appear in the submitted article.

Acknowledgments

The authors are very grateful to the Institute of Ecological Civilization and High-Quality Development of Yellow River for the support, and to the anonymous reviewers for their professional comments and revision advice, which was of great help in the improvement of this article.

Conflicts of Interest

The authors declare no conflict of interest.

References

  1. Hu, J.; Wang, H.; Song, Y. Spatio-temporal evolution and driving factors of “non-grain production” in Hubei province based on a non-grain index. Sustainability 2023, 15, 9042. [Google Scholar] [CrossRef]
  2. Chen, F.; Liu, J.; Chang, Y. Spatial pattern differentiation of non-grain cultivated land and its driving factors in China. China Land Sci. 2021, 35, 33–43. [Google Scholar]
  3. Liang, X.; Jin, X.; Liu, J.; Yin, Y.; Gu, Z.; Zhang, J.; Zhou, Y. Formation mechanism and sustainable productivity impacts of non-grain croplands: Evidence from Sichuan Province, China. Land Degrad. Dev. 2023, 34, 1120–1132. [Google Scholar] [CrossRef]
  4. Liu, G.; Zhao, L.; Chen, H. Does farmland transfer lead to non-grain production in agriculture?—An Empirical Analysis Based on the Differentiation of Farmland Renting-In Objects. Sustainability 2023, 15, 379. [Google Scholar] [CrossRef]
  5. Liu, Z.; Zhong, H.; Li, Y.; Wen, Q.; Liu, Z.; Liu, X.; Zhong, H.; Jian, Y.; Li, Y.; Wen, Q. Change in grain production in China and its impacts on spatial supply and demand distributions in recent two decades. J. Nat. Resour. 2021, 36, 1413–1425. [Google Scholar] [CrossRef]
  6. Sayer, J.; Ghazoul, J.; Nelson, P.; Klintuni Boedhihartono, A. Oil palm expansion transforms tropical landscapes and livelihoods. Glob. Food Secur. 2012, 1, 114–119. [Google Scholar] [CrossRef]
  7. Meyfroidt, P.; Carlson, K.M.; Fagan, M.E.; Gutiérrez-Vélez, V.H.; Macedo, M.N.; Curran, L.M.; DeFries, R.S.; Dyer, G.A.; Gibbs, H.K.; Lambin, E.F. Multiple pathways of commodity crop expansion in tropical forest landscapes. Environ. Res. Lett. 2014, 9, 074012. [Google Scholar] [CrossRef]
  8. Chen, M. Analysis on the phenomenon and countermeasures of “non-grain” of cultivated land. China Land. 2021, 4, 9–10. [Google Scholar]
  9. Li, Y.; Zhao, B.; Huang, A.; Xiong, B.; Song, C. Characteristics and driving forces of non-grain production of cultivated land from the perspective of food security. Sustainability 2022, 13, 14047. [Google Scholar] [CrossRef]
  10. Su, Y.; Qian, K.; Lin, L.; Wang, K.; Guan, T.; Gan, M. Identifying the driving forces of non-grain production expansion in rural China and its implications for policies on cultivated land protection. Land Use Policy 2020, 92, 104435. [Google Scholar] [CrossRef]
  11. Kong, X. Problems, causes and countermeasures of “non-grain” cultivated land. China Land 2020, 11, 17–19. [Google Scholar]
  12. Qiu, T.; Boris Choy, S.T.; Li, S.; He, Q.; Luo, B. Does land renting-in reduce grain production?—Evidence from rural China. Land Use Policy 2020, 90, 104311. [Google Scholar] [CrossRef]
  13. Zhu, D. Economic mechanism and governance path of “non-grain” of cultivated land. China Land 2021, 7, 9–11. [Google Scholar]
  14. Cao, Y.; Li, G.; Wang, J. Systematic review and research framework of “non-grain” utilization of cultivated land: From a perspective of food security to multidimensional security. China Land Sci. 2022, 36, 1–12. [Google Scholar]
  15. Zhang, D.; Yang, W.; Kang, D. Spatial-temporal characteristics and policy implication for non-grain production of cultivated land in Guan Zhong Region. Land Use Policy 2022, 12, 106466. [Google Scholar]
  16. Guan, X.; Wang, X.; Zhao, Y. Morphological characteristics identification and optimization of “non-grain” cultivated land along Yellow River Basin. Trans. Chin. Soc. Agric. Mach. 2021, 52, 233–242. [Google Scholar]
  17. Zhang, H.; Song, W.; Zhang, W. Analysis of spatial differentiation characteristics and influencing factors of non-grain cultivated land in Shandong Province. China Land Sci. 2021, 35, 94–103. [Google Scholar]
  18. Wang, P.; Zhang, L.; Lu, Y. Study on the spatial-temporal evolution an influencing factors of non-grain cultivated land in Guangxi. Chin. J. Agric. Resour. Reg. Plan. 2023, 44, 187–197. [Google Scholar]
  19. Wang, F.; Liu, Y.; Kong, X. Spatial and temporal variation of grain production and its influencing factors at the county level in China. Econ. Geogr. 2018, 38, 142–151. [Google Scholar]
  20. Wen, J.; Zhang, C.; Zhang, L. Spatiotemporal evolution and influencing factors of Chinese grain production under climate change. J. Henan Univ. (Nat. Sci.) 2020, 50, 652–665. [Google Scholar]
  21. Zhang, Y.; Feng, Y.; Wang, F. Spatiotemporal differentiation and driving mechanism of cultivated land non-grain conversion in Guangdong Province. Resour. Sci. 2022, 44, 480–493. [Google Scholar] [CrossRef]
  22. Cai, R.; Chen, W.; Zhu, X. Cost benefit: The internal cause and the key to break the non-grain transformation of cultivated land circulation. Rural Econ. 2015, 7, 44–49. [Google Scholar]
  23. Wu, Y.; Zhang, P.; Yu, Y. Progress review on and prospects for non-grain cultivated land in China from the perspective of food security. China Land Sci. 2021, 35, 116–124. [Google Scholar]
  24. Meng, F.; Tan, Y.; Chen, H. Spatial-temporal evolution patterns and influencing factors of “non-grain” utilization of cultivated land in China. China Land Sci. 2022, 36, 97–106. [Google Scholar]
  25. Zhang, J.; Li, X.; Xie, S.; Xia, X. Research on the influence mechanism of land tenure security on farmers’ cultivated Land Non-Grain behavior. Agriculture 2022, 12, 1645. [Google Scholar] [CrossRef]
  26. Zhou, D.; Wu, J.; Wen, W. Abandonment characteristics and influencing factors of cultivated land abandonment in major crop-producing areas. Trans. Chin. Soc. Agric. Mach. 2021, 52, 127–137. [Google Scholar]
  27. Gai, M.; Yang, Q.; He, Y. Spatiotemporal changes and influencing factors of agricultural green development level in main grain-producing areas in Northeast China. Resour. Sci. 2022, 44, 927–942. [Google Scholar] [CrossRef]
  28. Ma, L.; Zhang, R.; Pan, Z. Analysis of the evolution and influencing factors of temporal and spatial pattern of eco-efficiency of cultivated land use among provinces in China: Based on panel data from 2000 to 2019. China Land Sci. 2022, 36, 74–85. [Google Scholar]
  29. Chang, Y.; Liu, J.; Ma, J.; Yu, H.; Chen, F. Spatial pattern and driving factors of non-grain conversion on cultivated land in arid and semi-arid regions. J. Agri. Resour. 2023, 40, 333–344. [Google Scholar]
  30. Wang, D.; Lv, B.; Ding, W. Analysis on the evolution and influencing factors of spatial pattern of grain production in Yunnan Province. Inq. Econ. Issues 2021, 12, 136–148. [Google Scholar]
  31. Zhu, L.; Lu, Q. The use efficiency of cultivated land and irrigation water and the spatial correlation analysis of its coupling coordination in China. J. China Agric. Univ. 2022, 27, 297–308. [Google Scholar]
  32. Wei, X.; Lin, L.; Luo, P. Spatiotemporal pattern and driving force analysis of multi-functional coupling coordinated development of cultivated land. Trans. Chin. Soc. Agric. Eng. 2022, 38, 260–269. [Google Scholar]
  33. Zeng, Y.; Lv, Y.; Cai, J. Does the farmland and transfer lead to “non-grain production” in agriculture? J. Northwest A F Univ. (Soc. Sci. Ed.) 2018, 18, 123–130. [Google Scholar]
  34. Huang, T.; Lu, Z.; Zheng, H. The formation characteristics of non-grain cultivated land in the urban suburb under the peasant household scale- a case study of Guangfo area. Rural Econ. Sci. Technol. 2022, 33, 68–72. [Google Scholar]
  35. Zhao, X.; Zheng, Y.; Huang, X. The effect of urbanization and farmland transfer on the spatial patterns of non-grain farmland in China. Sustainability 2017, 9, 1438. [Google Scholar] [CrossRef]
  36. Chen, Y.; Li, X.; Zhu, H.; Zhao, Y. Comparison of the agricultural land use changes at different economic level. J. China Agric. Univ. 2011, 16, 124–131. [Google Scholar]
  37. Chen, L.; Hu, Y.; Han, X.; Guo, X. The quantitative comparative analysis of food production and contributions of major grain production areas in national food security. China Land Sci. 2017, 31, 34–42. [Google Scholar]
  38. Liu, H.; Zhang, L. Will the transfer of agricultural land lead to the “non-grain” growing? Rural Econ. 2020, 11, 45–53. [Google Scholar]
  39. Gao, Y.; Zhang, Z.; Wang, Z. Land transfer, appetite for risk and crop pattern—Empirical analysis based on micro data of CHFS. J. Agrotech. Econ. 2021, 8, 66–80. [Google Scholar]
  40. Xie, H.; Ouyang, Z.; Chen, Q. Does cultivated land fragmentation promote “Non-grain” utilization of cultivated land: Based on a micro survey of farmers in the Hilly and Mountainous Areas of Fujian. China Land Sci. 2022, 36, 47–56. [Google Scholar]
  41. Song, G.; Zhang, W. Spatiotemporal differentiation characteristics of cultivated land use from perspective of growing food crops in major grain production areas in northeast China. Trans. Chin. Soc. Agric. Eng. 2020, 36, 1–8. [Google Scholar]
  42. Su, Y.; Li, C.; Wang, K.; Deng, J.; Shahtahmassebi, A.R.; Zhang, L.; Ao, W.; Guan, T.; Pan, Y.; Gan, M. Quantifying the spatiotemporal dynamics and multi-aspect performance of non-grain production during 2000–2015 at a fine scale. Ecol. Indic. 2019, 101, 410–419. [Google Scholar] [CrossRef]
Figure 1. Distribution map of functional grain areas in China. Note: All administrative boundary data come from the Resource and Environment Science and Data Center (https://www.resdc.cn/, accessed on 2 February 2022).
Sustainability 15 13720 g001
Figure 2. Research framework.
Sustainability 15 13720 g002
Figure 3. Change trends of non-grain cultivated land in China from 2000 to 2020.
Sustainability 15 13720 g003
Figure 4. Distribution map of the growth rate of non-grain sown area in China from 2000 to 2020.
Sustainability 15 13720 g004
Figure 5. Moran’s I scatter diagram of the non-grain conversion level of cultivated land in China from 2000 to 2020.
Sustainability 15 13720 g005
Figure 6. Maps of spatial agglomeration patterns of non-food crops in China from 2000 to 2020.
Sustainability 15 13720 g006
Figure 7. Distribution map of the sown area of non-grain crops in China from 2000 to 2020.
Sustainability 15 13720 g007
Table 1. Planting area of non-grain crops in China from 2000 to 2020.
YearNon-Grain Crops (km2)
Oil CropsCottonFiber CropsVegetablesFruitsMedicinal HerbsSugar CropsTobaccoGreen Fodder
2000154,00340,4122617152,37320,437675615,14214,37221,418
2020131,29131,689686214,85521,61929,05115,68510,13921,992
Variation−22,712−8723−193162,482118222,295543−4233574
Proportion (%)−14.75−21.59−73.7941.015.78330.003.59−29.452.68
Table 2. Potential driving factors of non-grain cultivated land in China.
CategoryDriving FactorDefinitions
Resource endowmentCultivated area (x1)Total area of cultivated land in the region, reflecting the abundance or shortage of cultivated land resources.
Cultivated land area per capita of agricultural population (x2)Total area of cultivated land divided by the agricultural population, reflecting the abundance or scarcity of cultivated land resources per capita.
Grain yield per unit area (x3)Grain yield divided by the grain sowing area, reflecting the production capacity of cultivated land.
Factor inputTotal mechanical power per unit of cultivated land area (x4)Total power of agricultural machinery divided by cultivated land area, reflecting the intensity of scientific and technological investment.
Proportion of effective irrigation area (x5)The proportion of cultivated land area that can be irrigated normally to the total cultivated land area, reflecting the drought resistance of cultivated land and revealing the guaranteed conditions of cultivated land water sources.
Social developmentRural population (x6)Number of rural permanent residents in the region, reflecting the situation of rural surplus labor force.
Agricultural proportion of labor force (x7)Agricultural employees as a proportion of total employees in the region, reflecting the structure of the agricultural labor force.
Urbanization rate (x8)Ratio of urban population to total population, reflecting the level of urbanization in the region.
Economic levelPer capita GDP (x9)Regional GDP divided by regional population, reflecting the regional economic level.
Income ratio of urban and rural residents (x10)The ratio of per capita disposable income of urban residents to per capita disposable income of rural residents, reflecting the urban–rural income gap.
Agricultural output value (x11)Total agricultural output value as a proportion of gross regional product, reflecting the regional industrial structure.
Rural Engel coefficient (x12)Food expenditure as a proportion of total consumption expenditure in rural households, reflecting the living standards of rural residents.
Policy regulationNumber of agricultural cooperatives (x13)Number of farmer cooperatives in the region, reflecting the regional level of agricultural socialization services.
Land transfer rate (x14)Transferred cultivated land area as a proportion of the total cultivated land area, reflecting the degree of large-scale management of cultivated land.
Table 3. Regression model fitting results for driving factors of non-grain cultivation in different Chinese regions.
RegionOLS Regression Model Fitting ResultsR2Sig. F
National (provincial level)Y = −85.768 + 0.004x3 + 1.273x4 ** + 16.478x5 + 0.009x6 ** + 0.469x8 + 0.043x9 + 25.930x10 * + 118.196x11 0.281x12 0.001x13 ** − 0.337x140.480<0.001
National (city level)Y = − 75.377 − 0.658x1 * + 0.004x2 + 0.005x3 − 1.172x4 + 0.013x5 + 0.866x6 ** + 1.394x7 * + 0.318x8 + 8.558x9 ** − 12.345x10 + 3.207x11 ** − 0.007x12 + 0.005x13 * + 1.813x14 **0.533<0.001
Main grain-producing areasY = 43.882 − 0.599x1 * 1.238x2 − 0.003x3 − 0.494x4 + 0.824x6 ** + 1.690x7 − 0.137x8 + 10.643x9 ** − 18.187x10 + 2.824x11 − 0.195x12 − 1.876x140.613<0.001
Main grain-sales areasY = 94.760 6.680x2 − 0.049x3 ** − 1.271x4 − 0.008x5 − 1.170x8 + 6.396x9 − 42.690x10 + 6.832x12 * + 0.014x13 ** + 2.551x14 *0.547<0.001
Grain production and sales balance areasY = − 198.535 + 15.163x2 ** + 0.004x3 − 0.289x4 − 0.169x5 + 1.675x6 ** + 0.835x7 + 0.551x8 + 9.472x9 − 10.737x10 + 3.506x11 * − 0.008x12 + 0.009 x13 * − 0.709x140.751<0.001
Note: * and ** represent significant differences at the 5% and 1% levels, respectively.
Disclaimer/Publisher’s Note: The statements, opinions and data contained in all publications are solely those of the individual author(s) and contributor(s) and not of MDPI and/or the editor(s). MDPI and/or the editor(s) disclaim responsibility for any injury to people or property resulting from any ideas, methods, instructions or products referred to in the content.

