
The Influence of Residential Behavior on Dwelling Energy Consumption and Comfort in Hot-Summer and Cold-Winter Zone of China—Taking Shanghai as an Example

Abstract
:1. Introduction
2. Literature Review
3. Materials and Methods
3.1. Study Areas
3.2. Sequence of the Conducted Research
- (1)
- Firstly, a large-scale questionnaire survey was conducted on the residents of Jiangsu–Zhejiang–Shanghai Area in the form of “online-oriented and offline-supplemented”. The survey aimed to analyze the energy use behaviors, residential energy consumption, and energy use mentality of the respondents from different family backgrounds.
- (2)
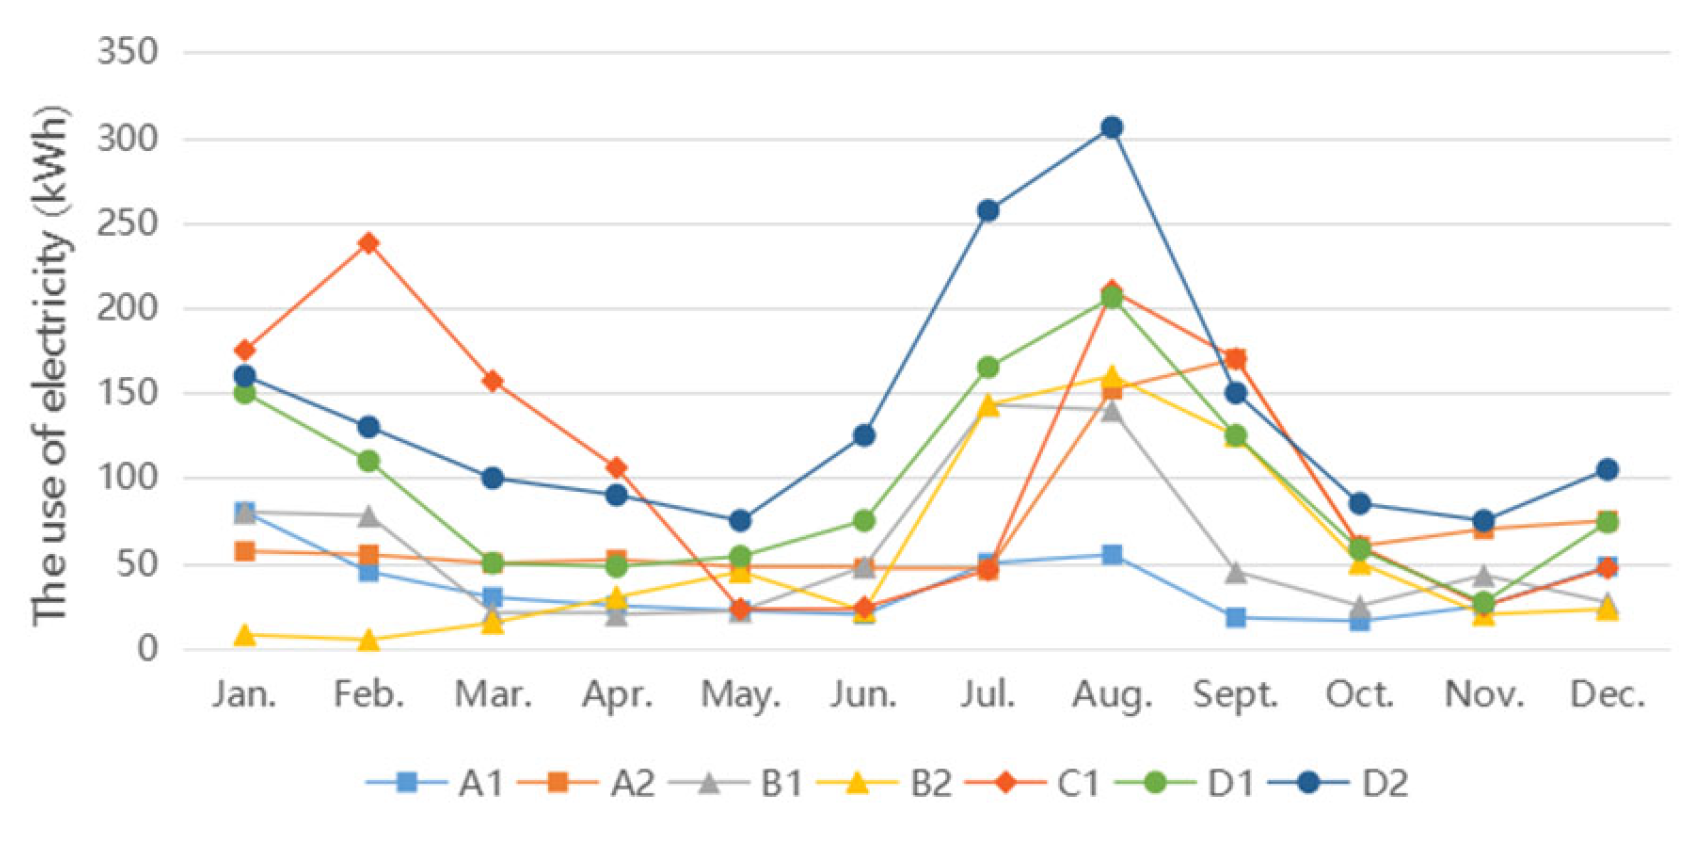
- Then, based on the current situation of Shanghai’s household structure, 10 households were selected to carry out data monitoring for 8 months. The data monitoring included people’s presence in the room, window-opening behavior, air-conditioning behavior, and air-conditioning energy consumption. The energy use patterns (air-conditioning period, room presence, energy use behavior, tolerance temperature, and set temperature) of the energy-using population in the winter and summer were analyzed, and the reliability of the data was verified with the results of the questionnaire survey.
- (3)
- Lastly, the standard sample and its energy use pattern are summarized in the data monitoring samples. Using the software DeST, the effects of each energy use factor on energy consumption and comfort are calculated and compared, and for the first time, a dual-indicator evaluation of energy consumption and comfort is proposed. Recommended energy use patterns are given at the end.
3.3. Questionnaire Survey
3.4. Household Data Monitoring Surveys
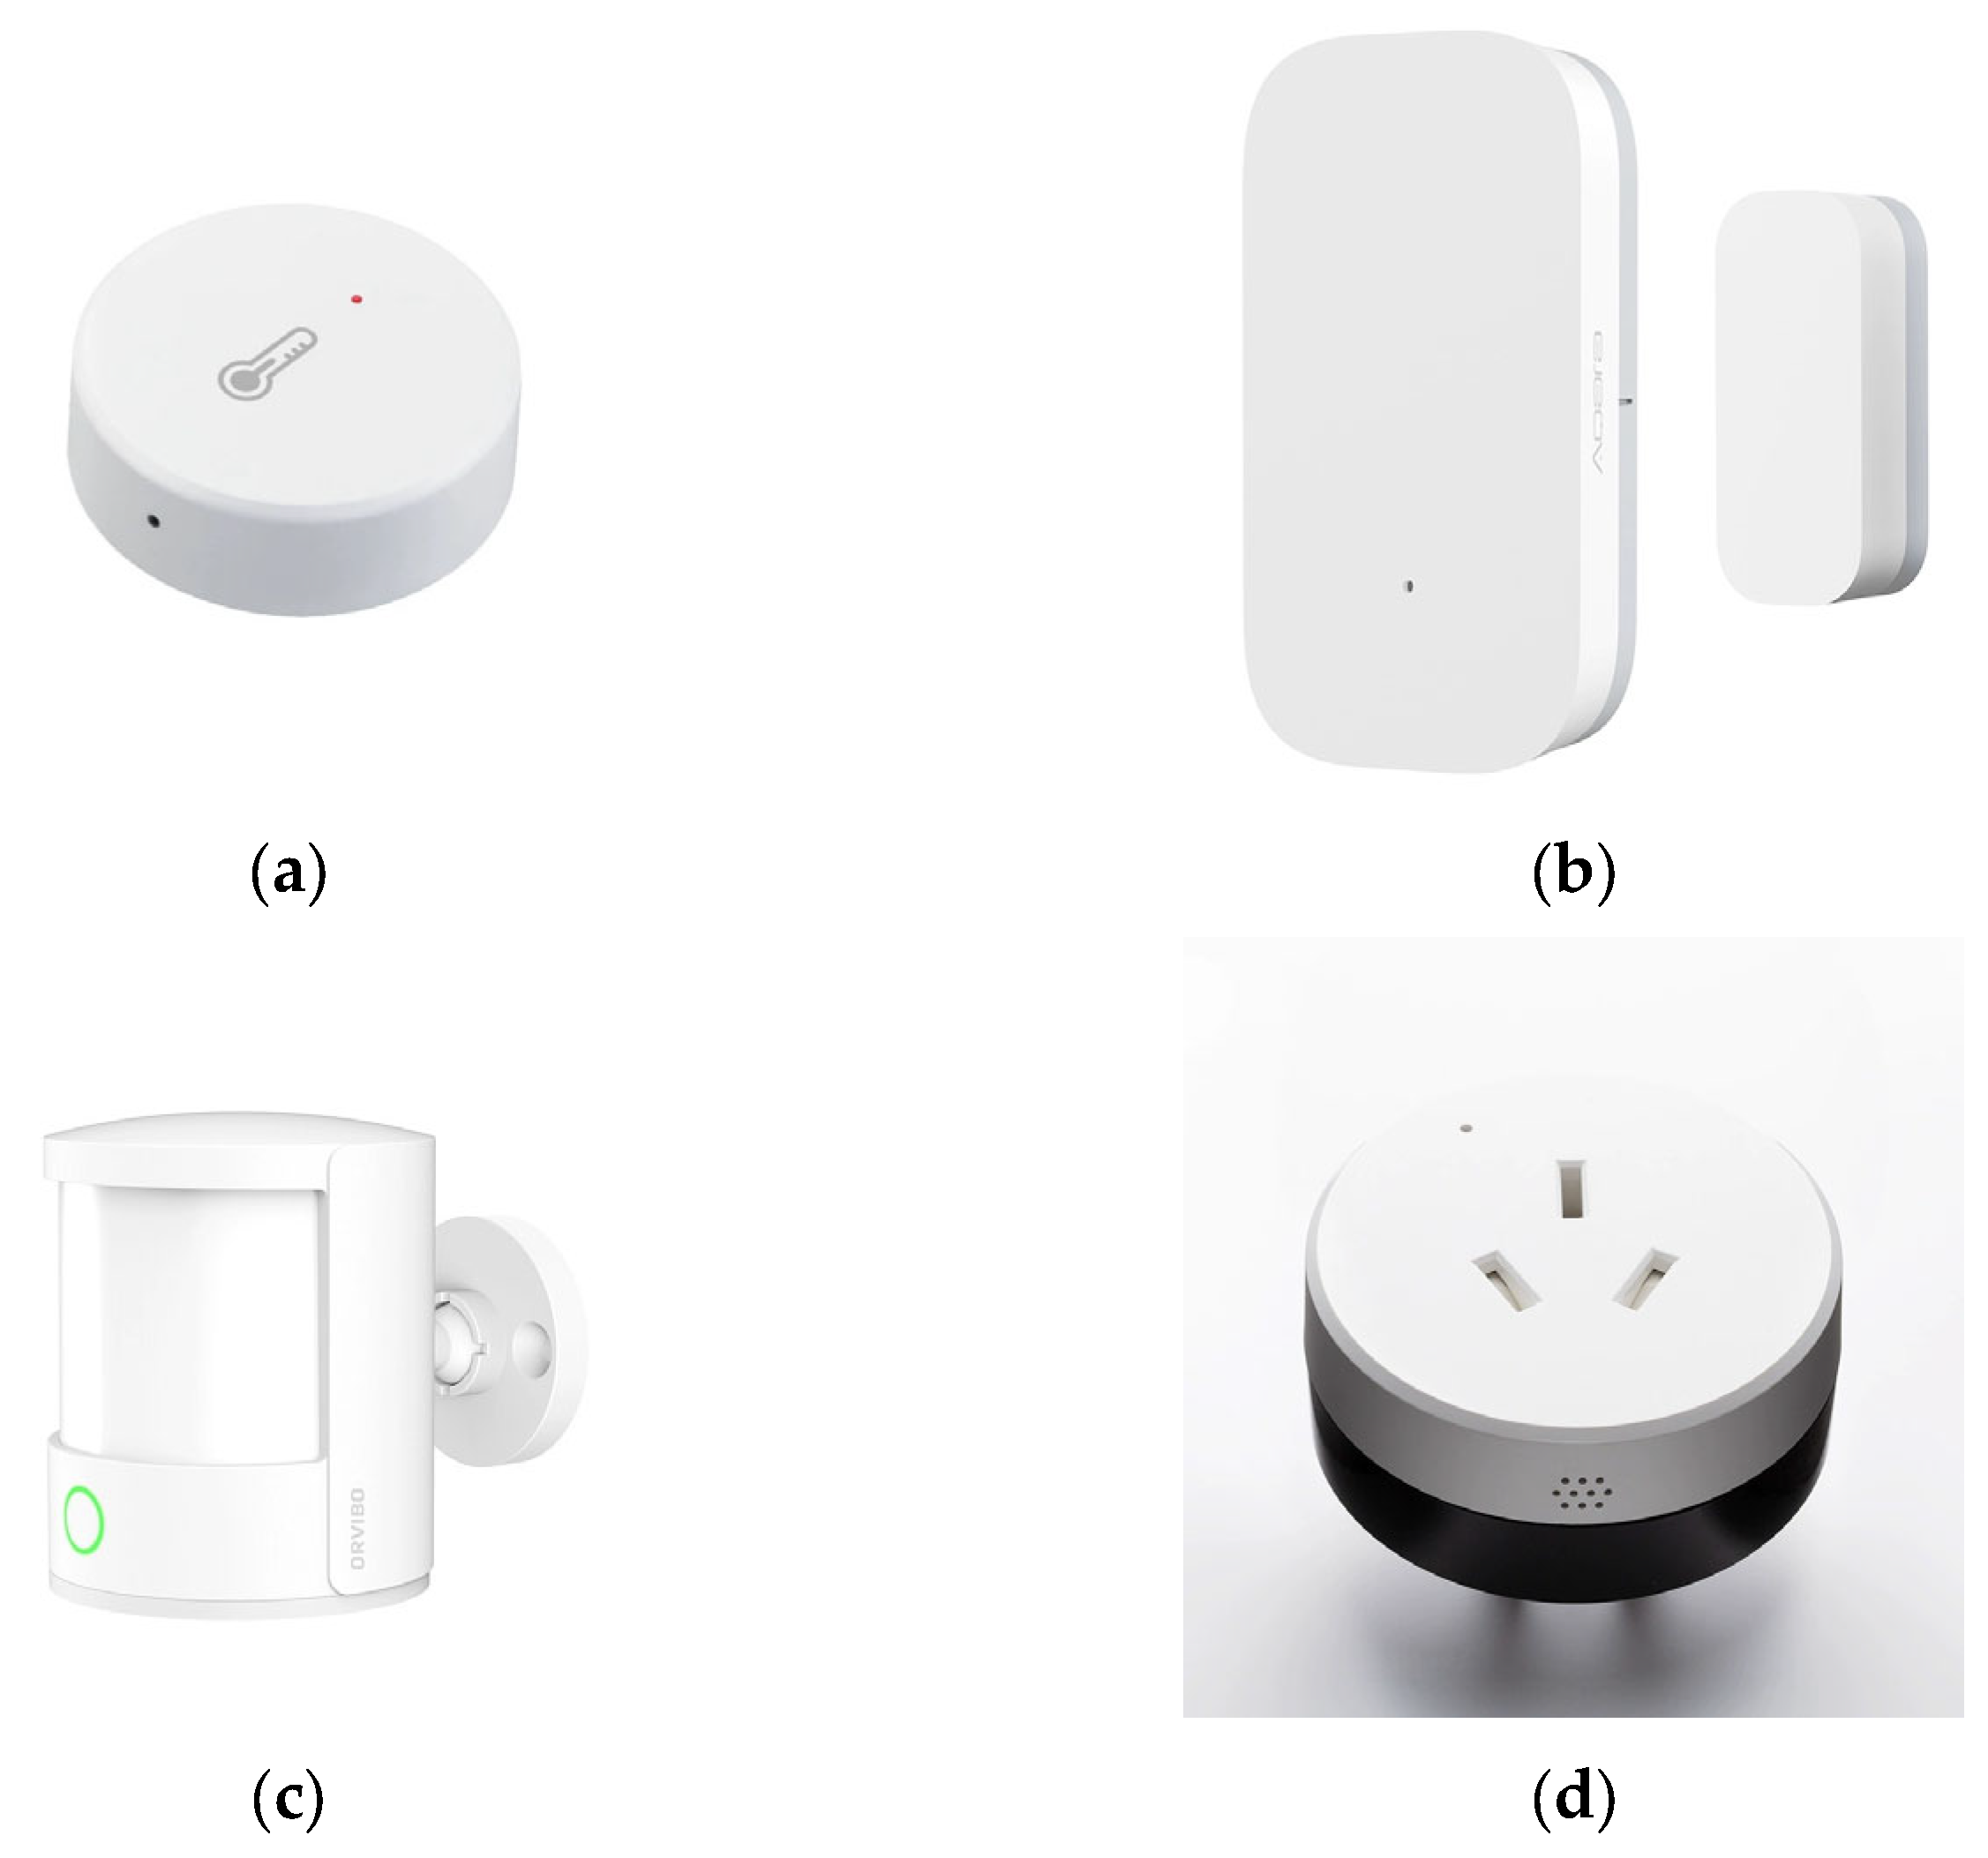
3.4.1. Survey Tools
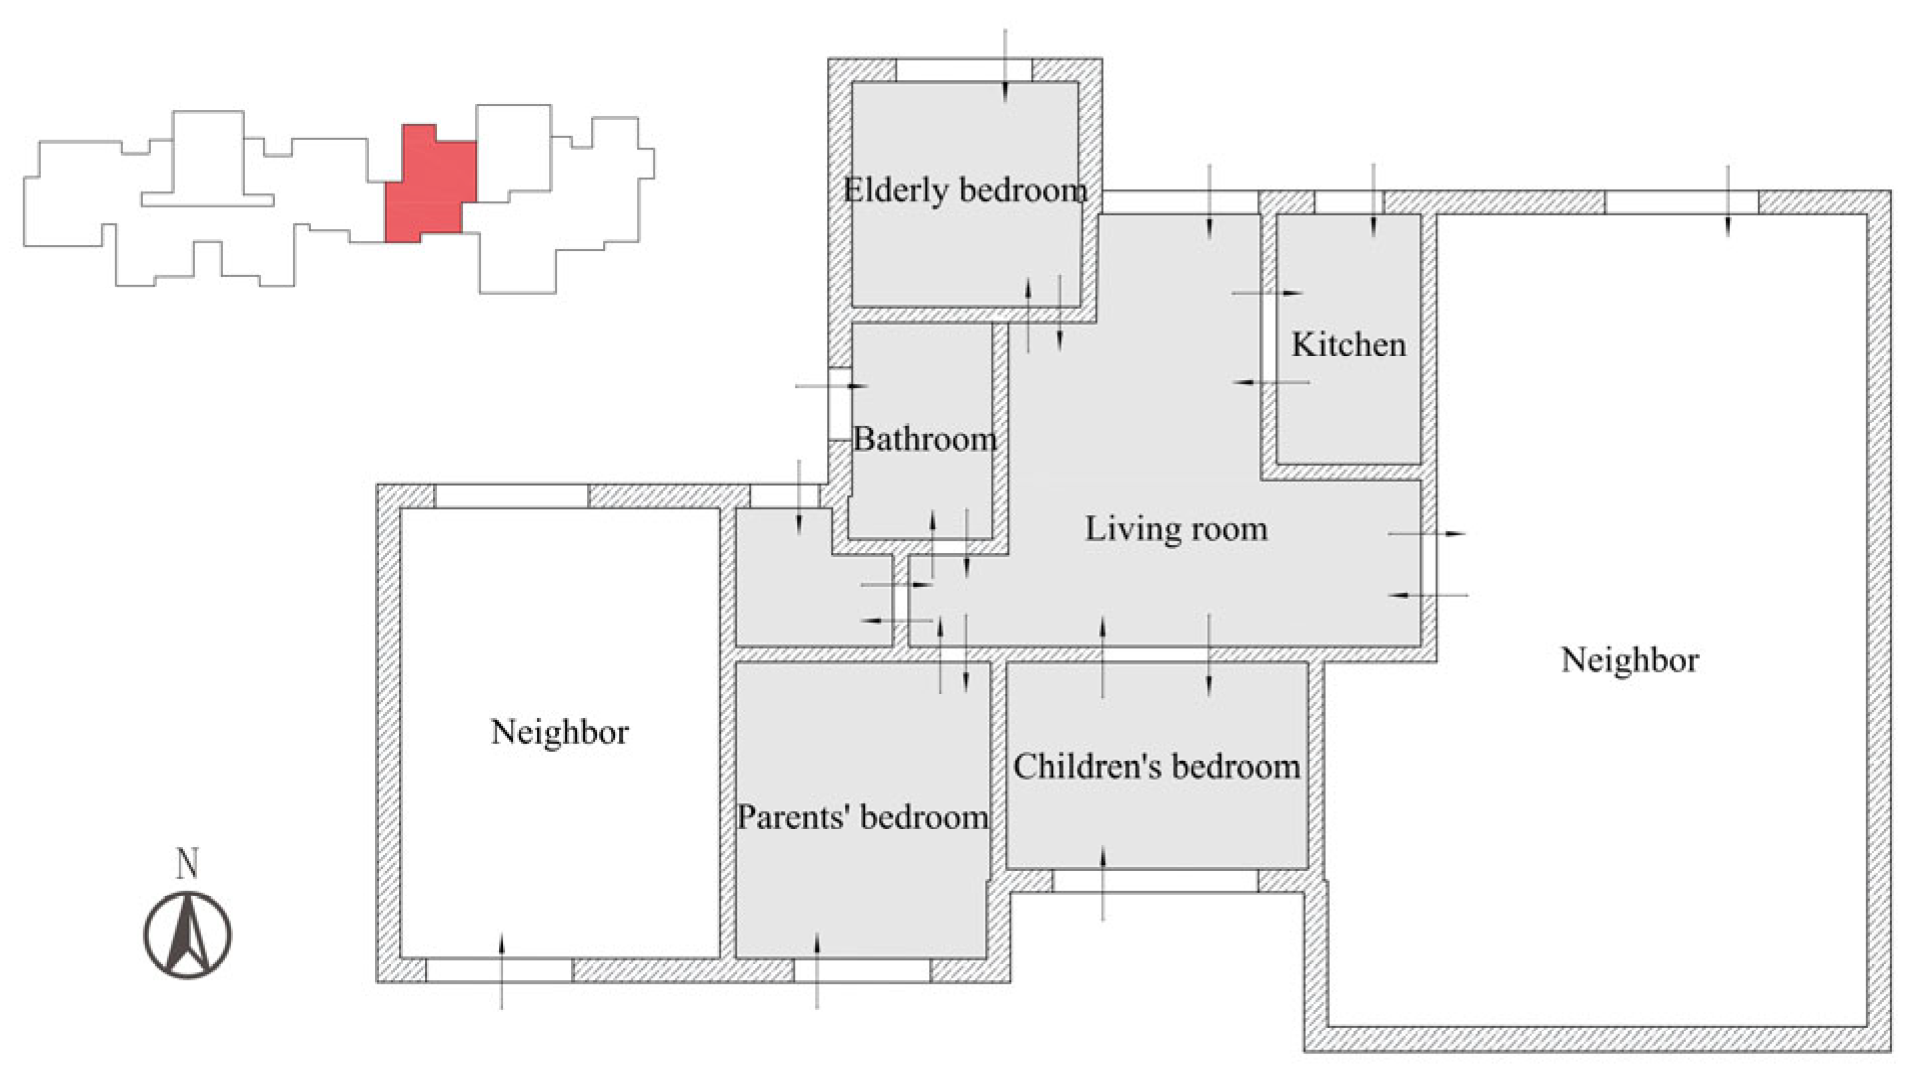
3.4.2. Situation of the Sample Families
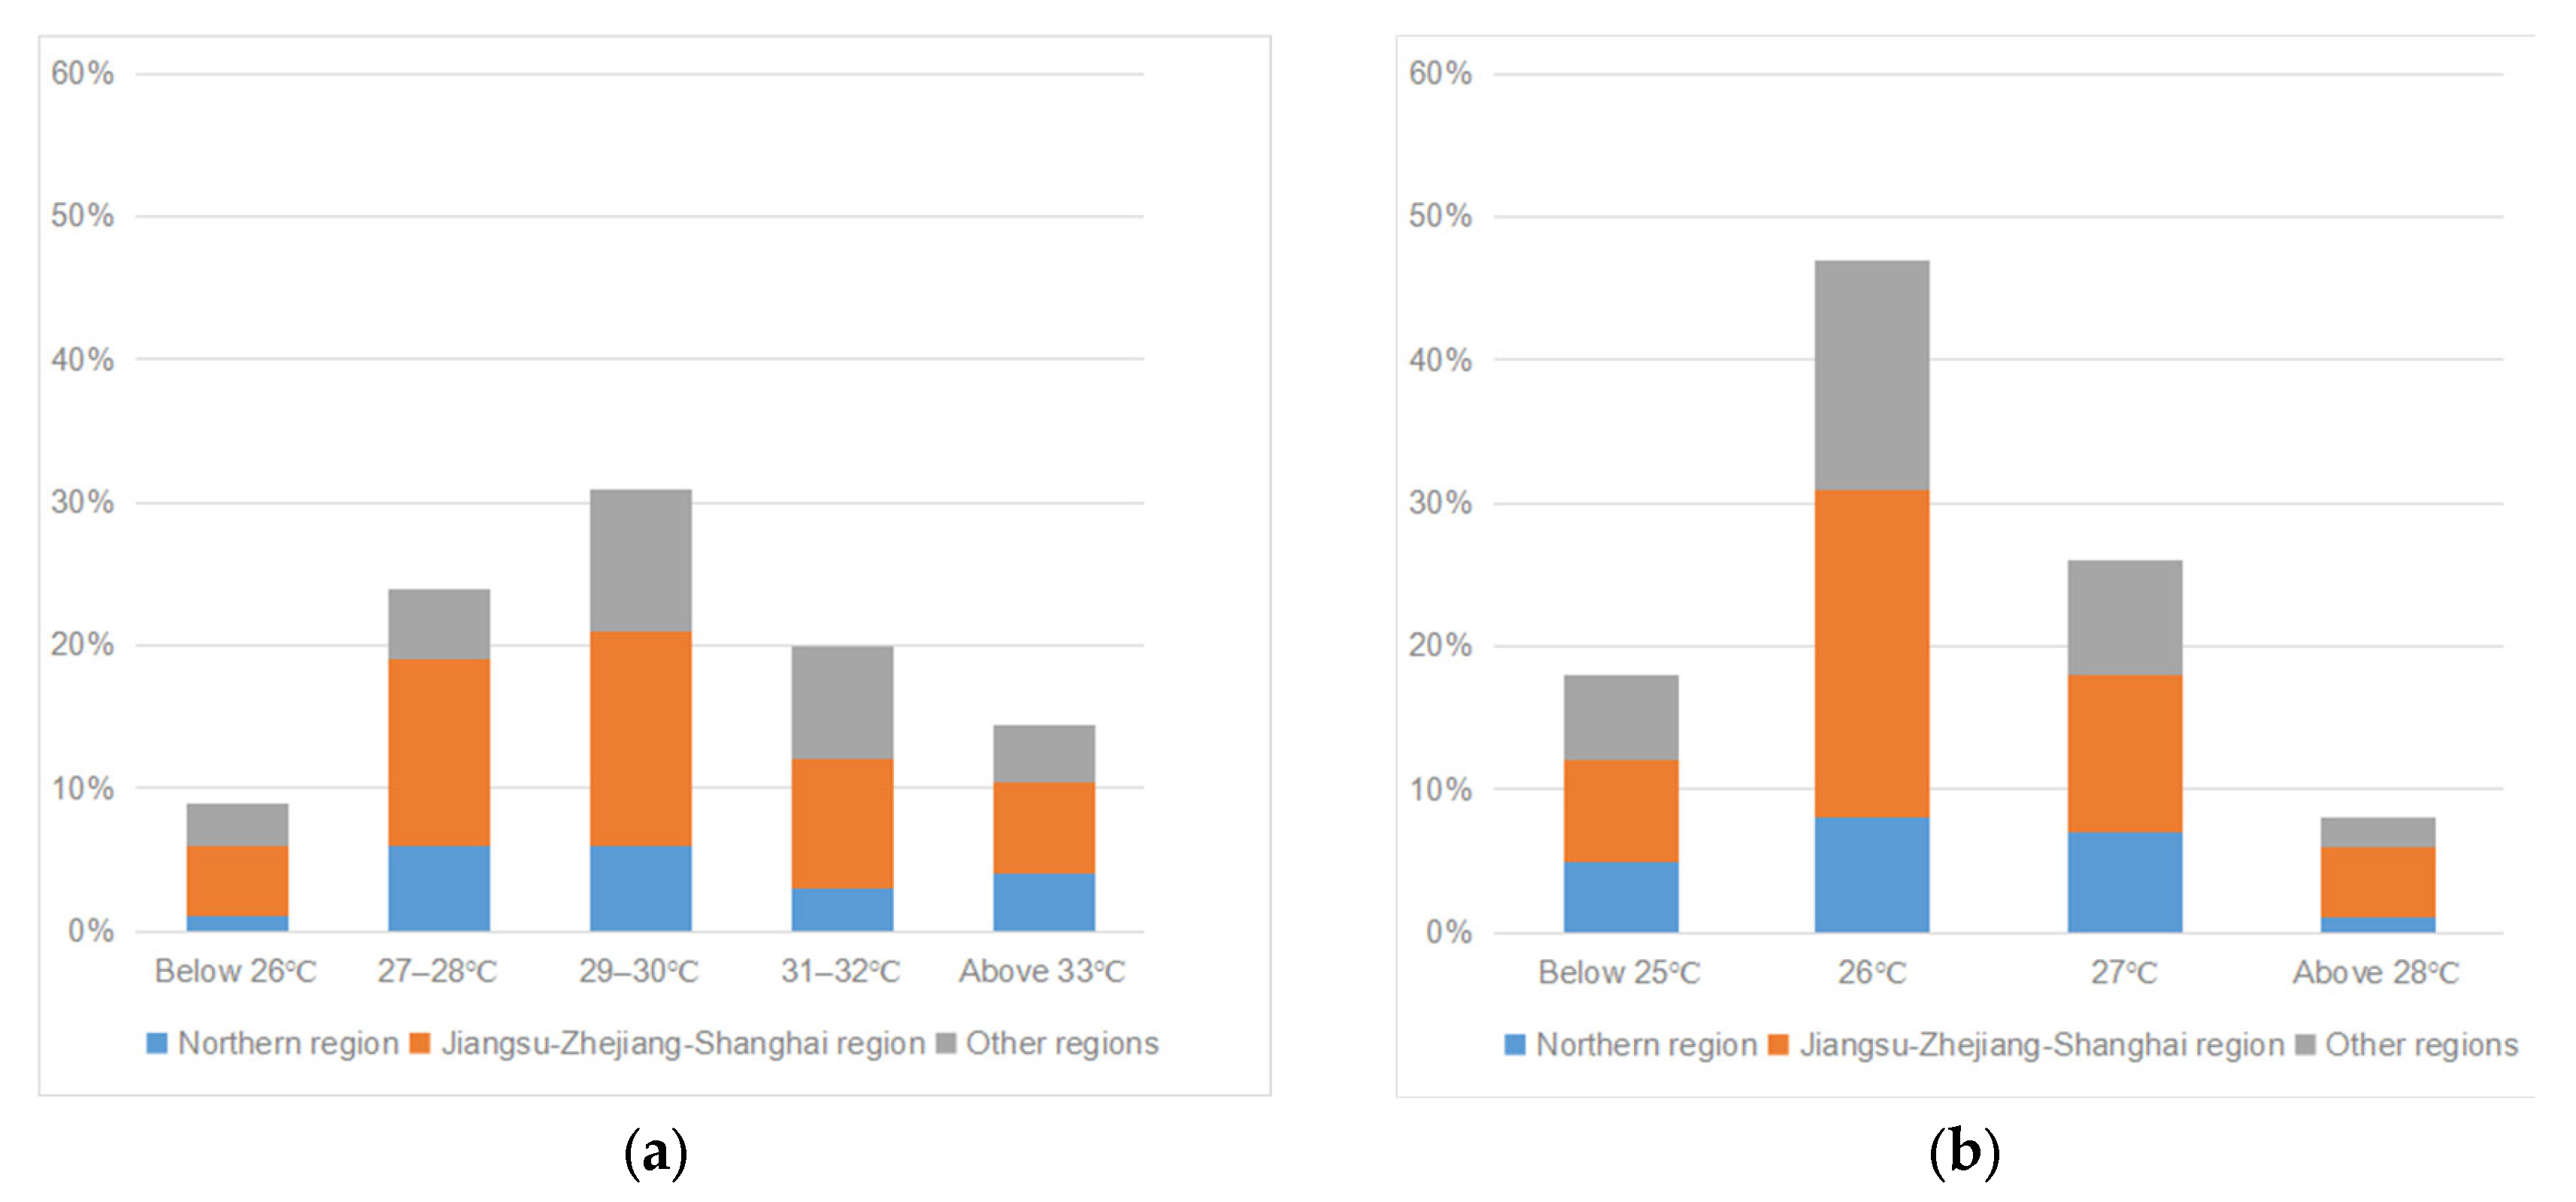
3.4.3. Climatic Conditions
3.5. Residential Energy Simulation and Analysis
4. Results and Discussion
4.1. Questionnaire Results
4.1.1. Basic Information on Respondents
4.1.2. Analysis of Energy Use
4.1.3. Analysis of Energy Consumption and Energy Use Mentality
4.2. Analysis of Personnel Behavior in Sample Households
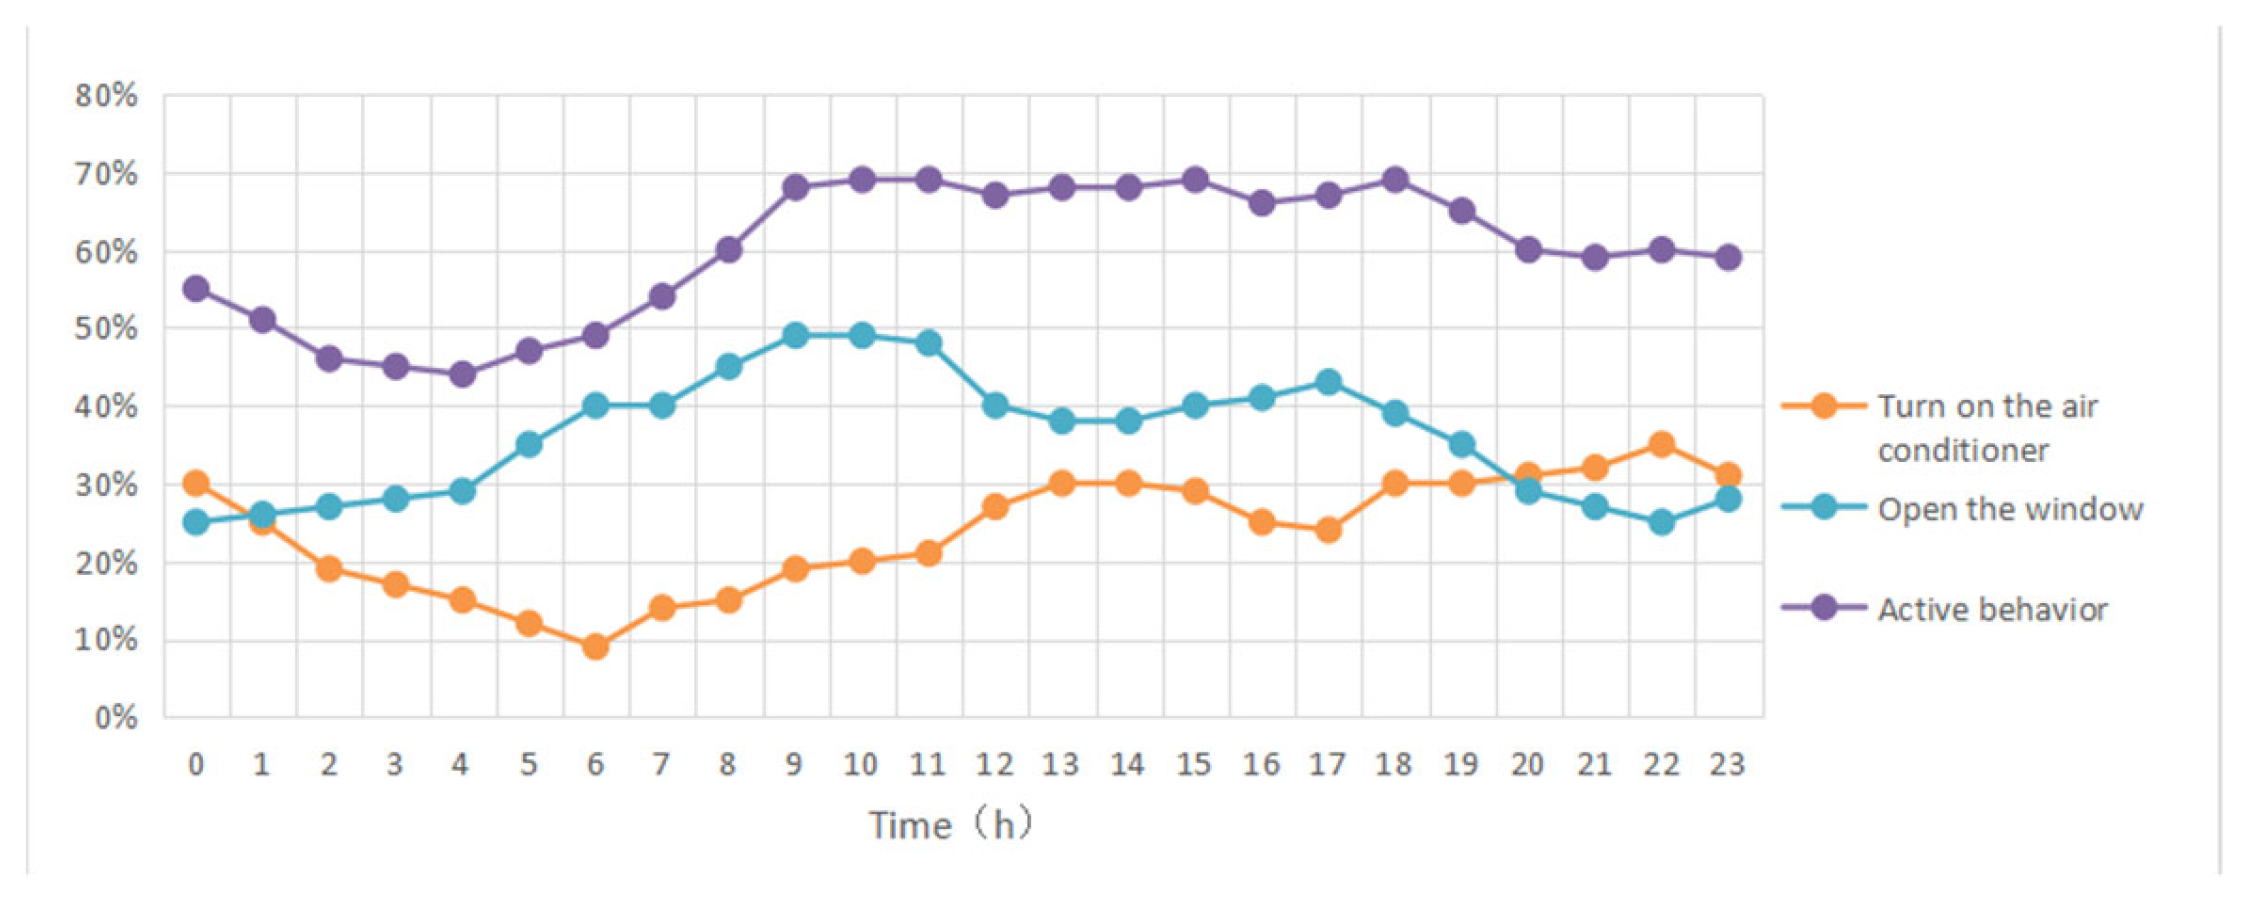
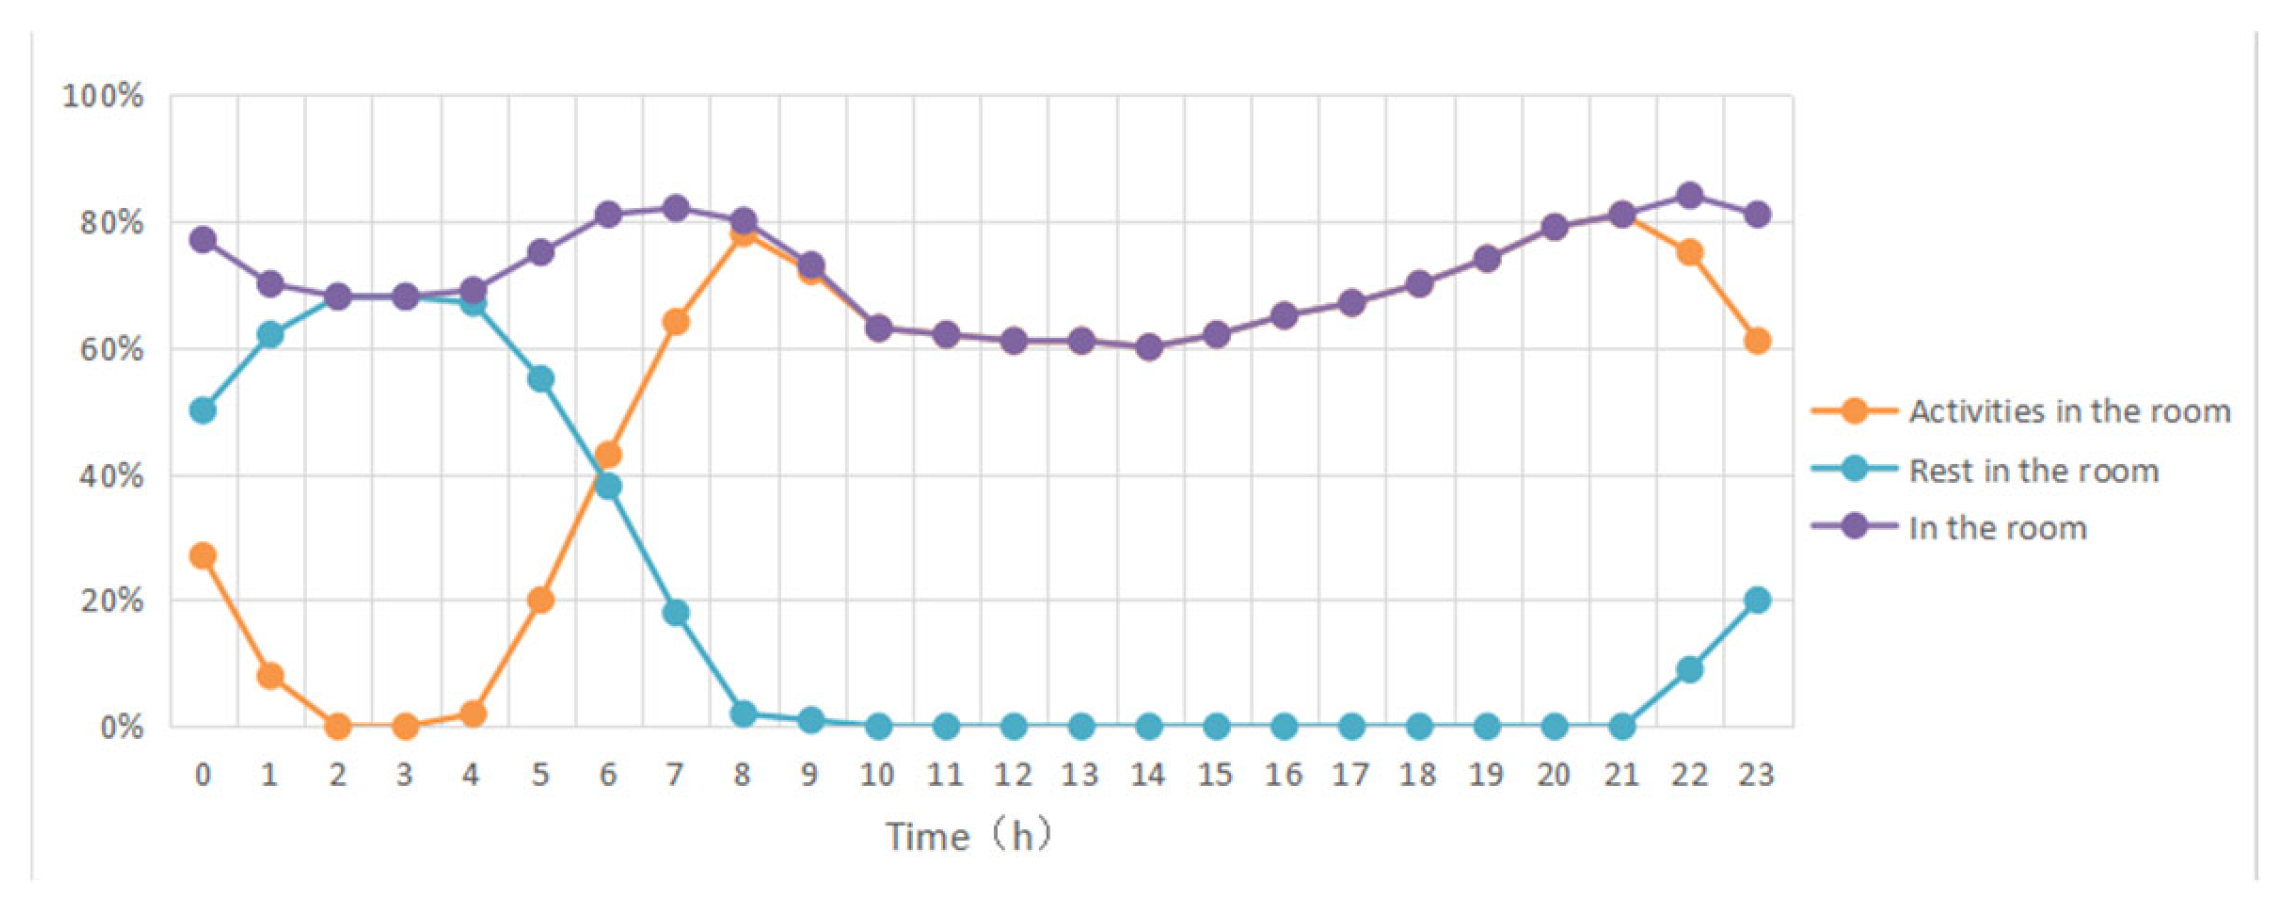
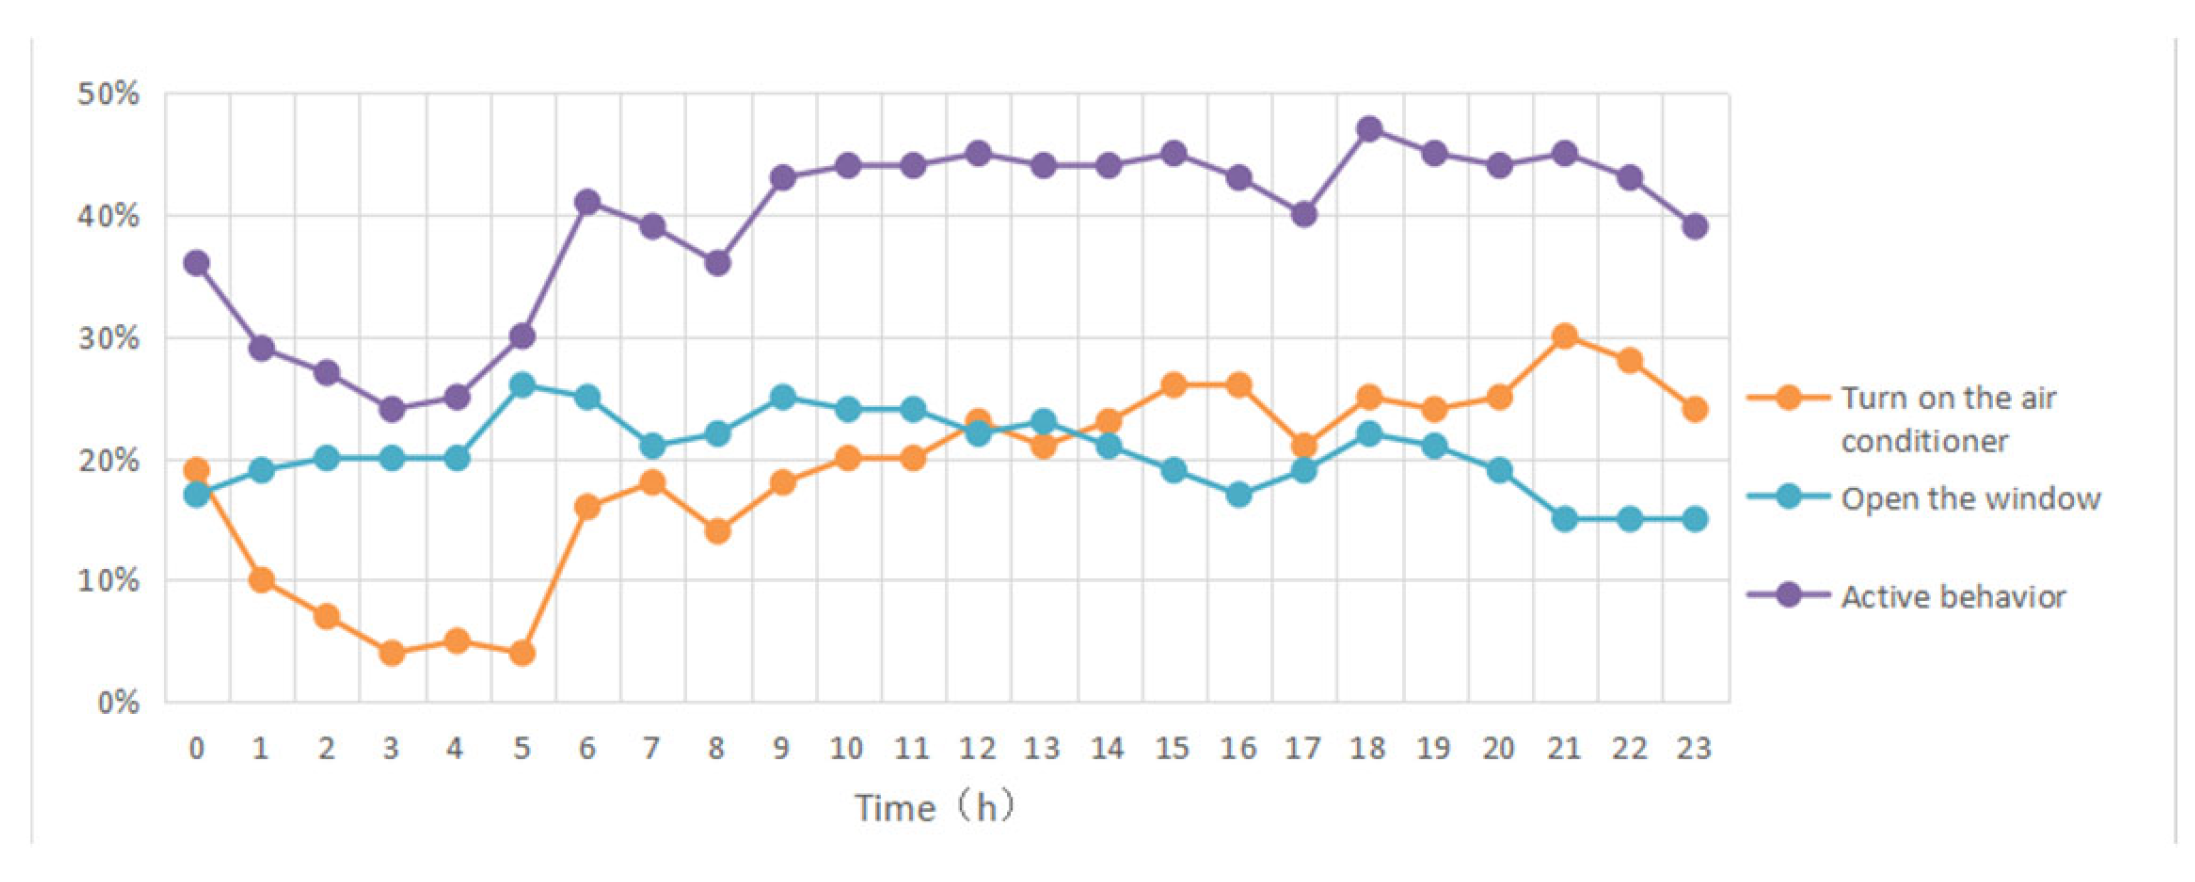
4.2.1. Analysis of Personnel Behavior in the Summer
4.2.2. Analysis of Personnel Behavior in the Winter
4.3. Simulation and Analysis of Residential Energy Consumption
4.3.1. Simulation Experiment 1: Impact of Room Presence on Energy Consumption and Comfort Levels
4.3.2. Simulation Experiment 2: Influence of Ventilation Mode on Energy Consumption and Comfort Levels
4.3.3. Simulation Experiment 3: Impact of the Air-Conditioning (Heating) Calculation Period on Energy Consumption and Comfort Levels
4.3.4. Simulation Experiment 4: Impact of Air-Conditioning Tolerance Temperature on Energy Consumption and Comfort Levels
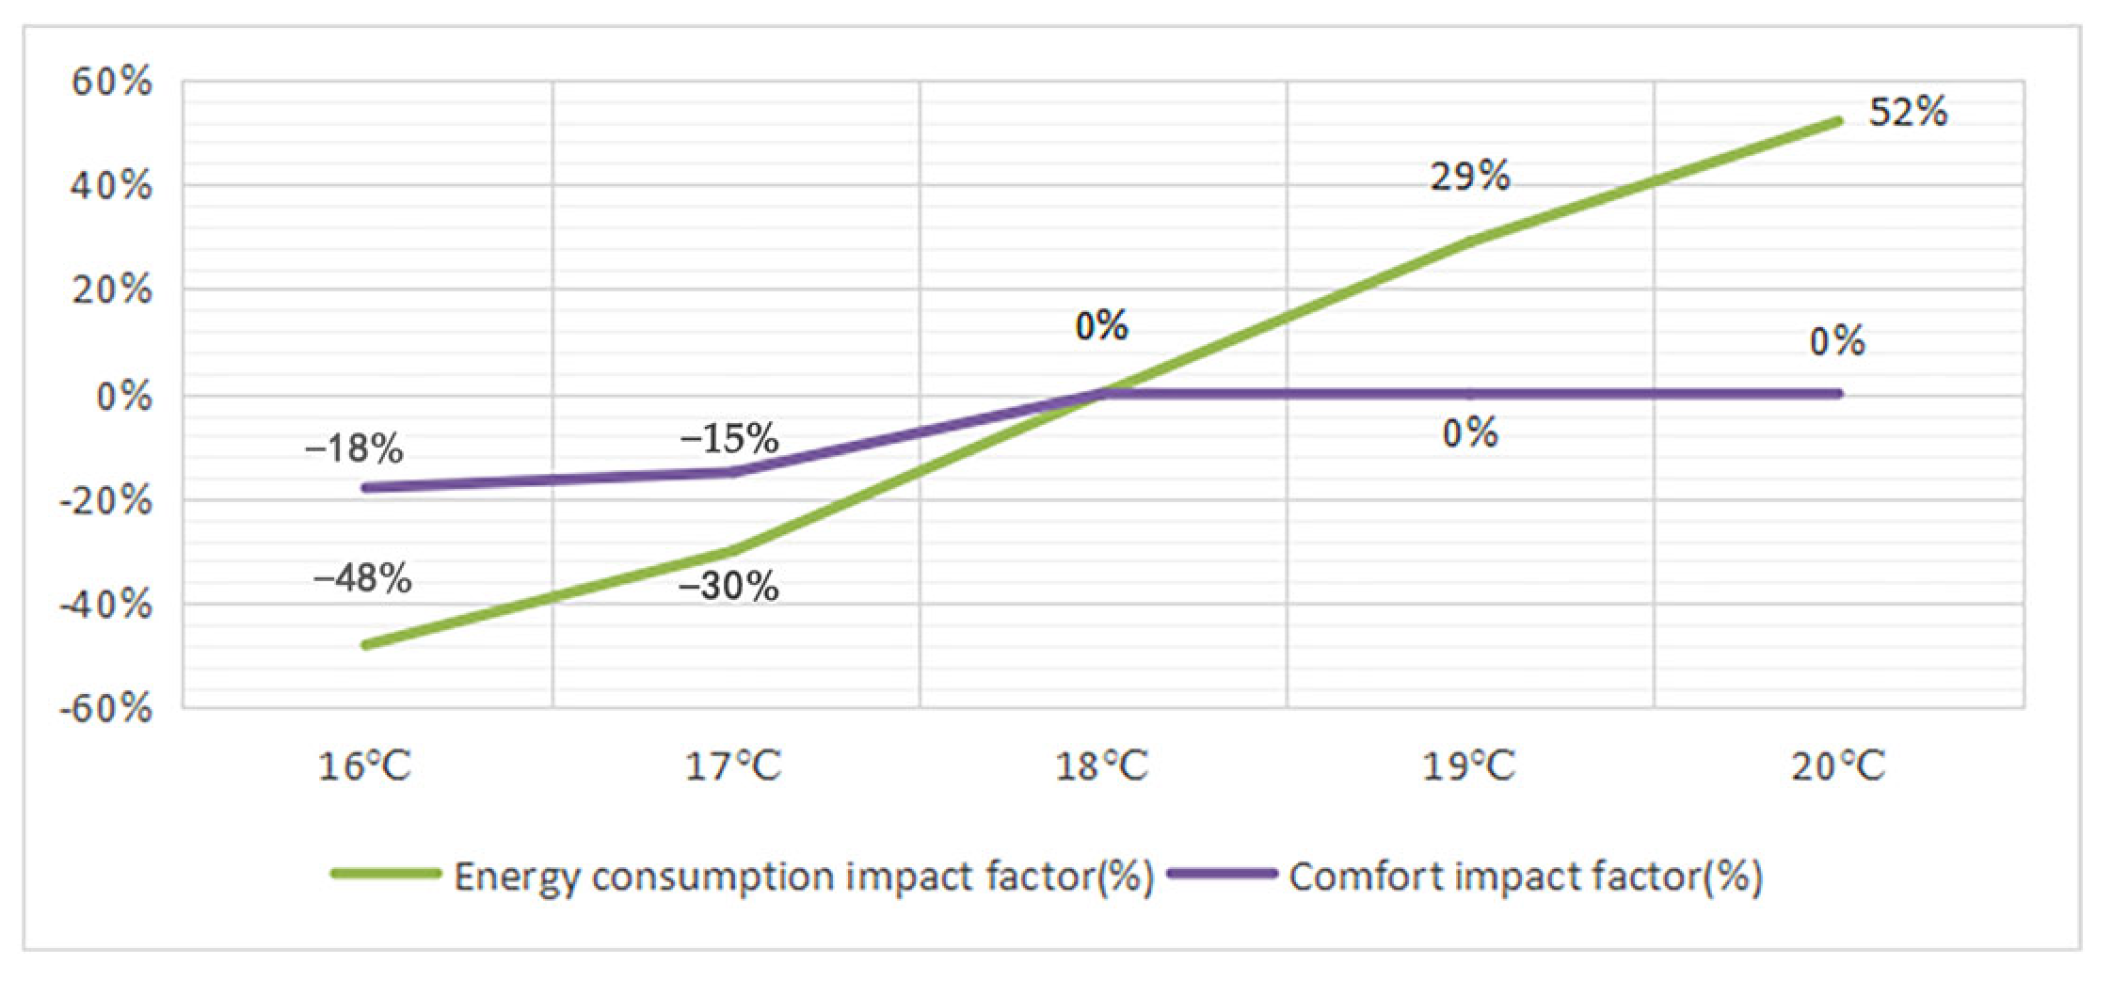
4.3.5. Simulation Experiment 5: Impact of Air-Conditioning Setting Temperature on Energy Consumption and Comfort Levels
4.3.6. Simulation Experiment 6: Impact of Air-Conditioning Operation Modes on Energy Consumption and Comfort Levels
4.4. Comprehensive Evaluation System for Energy Consumption and Comfort
5. Conclusions and Prospects for Further Research
Author Contributions
Funding
Institutional Review Board Statement
Informed Consent Statement
Data Availability Statement
Conflicts of Interest
References
- BP p.l.c. BP Statistical Review of World Energy. 2022. Available online: https://www.bp.com/en/global/corporate/energy-economics/statistical-review-of-world-energy.html (accessed on 6 November 2022).
- Amirreza, H.; François, M.; Dolaana, K. An occupant-centric control framework for balancing comfort, energy use and hygiene in hot water systems: A model-free reinforcement learning approach. Appl. Energy 2022, 312, 118833. [Google Scholar]
- Zhang, S.; Yang, X.; Jiang, Y. Current situation of building energy consumption in China and its comparison. China Energy 2008, 7, 37–42. [Google Scholar]
- GB 50176-2016; Thermal Design Code for Civil Buildings. Ministry of Housing and Urban-Rural Development of the People’s Republic of China: Beijing, China, 2016.
- Mo, D.; Huang, L.; Zeng, L. Green Development Level Evaluation of Urban Engineering Construction in the Mid-Low Reaches of Yangtze River, China. Sustainability 2023, 15, 11550. [Google Scholar] [CrossRef]
- Duan, J.; Xian, X.; Wang, C. Construction and application of AHP-based evaluation system for air-conditioning energy consumption of residential buildings in hot summer and cold winter areas. J. Hunan City Coll. 2022, 31, 62–66. [Google Scholar]
- Warren, P.; Parkins, L. Window-opening behavior in office buildings. Build. Serv. Eng. Res. Technol. 1984, 23, 89–101. [Google Scholar] [CrossRef]
- Kempton, W.; Feuermann, D.; Mcgarity, A.E. “I always turn it on super”: User decisions about when and how to operate room air conditioners. Energy Build. 1992, 18, 177–191. [Google Scholar] [CrossRef]
- Lutzenhiser, L. A cultural model of household energy consumption. Energy 1992, 17, 47–60. [Google Scholar] [CrossRef]
- Hitchcock, G. An integrated framework for energy use and behaviour in the domestic sector. Energy Build. 1993, 20, 151–157. [Google Scholar] [CrossRef]
- Committee for Research and Survey on Energy Consumption in Residential Buildings. Available online: http://tkkankyo.eng.niigata-u.ac.jp/HP/HP/index.htm (accessed on 2 June 2005).
- Santin, O.G.; Itard, L.; Visscher, H. The effect of occupancy and building characteristics on energy use for space and water heating in Dutch residential stock. Energy Build. 2009, 41, 1223–1232. [Google Scholar] [CrossRef]
- Daniel, L.; Soebarto, V.; Williamson, T. House energy rating schemes and low energy dwellings: The impact of occupant behaviours in Australia. Energy Build. 2015, 88, 34–44. [Google Scholar] [CrossRef]
- Yu, Z.J.; Haghighat, F.; Fung, B.C.M. A methodology for identifying and improving occupant behavior in residential buildings. Energy 2011, 36, 6596–6608. [Google Scholar] [CrossRef]
- Virote, J.; Neves-Silva, R. Stochastic models for building energy prediction based on occupant behavior assessment. Energy Build. 2012, 53, 183–193. [Google Scholar] [CrossRef]
- Salvo, A. Electrical appliances moderate households’ water demand response to heat. Nat. Commun. 2018, 9, 5408. [Google Scholar] [CrossRef]
- Chen, S. Characterization of energy consumption and energy saving evaluation of urban residential buildings based on statistical theory. Ph.D. Thesis, Hunan University, Changsha, China, 2009. [Google Scholar]
- Chen, W.; Li, S. Thermal comfort survey and window opening behavior modeling of summer residents in hot summer and cold winter areas. Refrigeration 2011, 30, 76–81. [Google Scholar]
- Zhang, X.; Zhu, G.; Jiang, Y. Building Environment Design Simulation and Analysis Software DeST Lecture 13 Residential Simulation and Optimization Example. HVAC 2005, 8, 65–72. [Google Scholar]
- Yang, S. Research on energy-saving behavior of Chinese urban residents and the impact of energy-saving consumption incentive policies. Ph.D. Thesis, University of Science and Technology of China, Hefei, China, 2015. [Google Scholar]
- Cheng, X.; Zheng, Z.; Bu, Z. A case study on the impact of personnel behavioral patterns on air conditioning behavior and energy consumption in residential buildings. Build. Sci. 2015, 31, 94–98. [Google Scholar]
- Sun, H.; Hong, T.; Wang, G. Research on XML description method for building energy user behavior model. Build. Sci. 2015, 31, 71–78. [Google Scholar]
- Yao, R.; Chen, Q.; Li, B. Simulation of indoor thermal environment and thermal comfort in ventilated and cooled buildings. HVAC 1997, 6, 7–11. [Google Scholar]
- Ji, X.; Wang, B.; Liu, S. Thermal comfort study of non-air-conditioned environments in Jiangsu and Zhejiang. J. Beijing Inst. Technol. 2004, 12, 1100–1103. [Google Scholar]
- ANSI/ASHRAE Standard 55-1992; Thermal Environmental Conditions for Human Occupancy. ASHRAE: Atlanta, GA, USA, 1992.
- International Standard 7730-1994; Moderate Thermal Environments Determination of the PMV and PPD Indices and Specification of Conditions for Thermal Comfort. ISO: Geneva, Switzerland, 1994.
- GB/T 50785-2012; Standard for Evaluation of Indoor Thermal and Humid Environment of Civil Buildings. Ministry of Housing and Urban-Rural Development of the People’s Republic of China: Beijing, China, 2012.
- Zhu, C. Comfort evaluation of indoor environment with gray theory analysis. Ph.D. Thesis, Hunan University, Changsha, China, 2012. [Google Scholar]
- Cao, X.; Yu, W.; Xiong, J. Energy saving technical program for residential buildings in hot summer and cold winter areas based on energy consumption limit. HVAC 2022, 52, 41–52. [Google Scholar]
- Yang, Z.; Zhao, Y.; Xu, X.; Zhai, B. Analysis and comparison of building energy saving reconstruction in hot summer and warm winter regions of South China and cold regions of North China. Energy Build. 2012, 54, 192–195. [Google Scholar] [CrossRef]
- Du, H.; Lian, Z.; Lai, D.; Duanmu, L.; Zhai, Y.; Cao, B.; Zhang, Y.; Zhou, X.; Wang, Z.; Zhang, X.; et al. Evaluation of the accuracy of PMV and its several revised models using the Chinese thermal comfort Database. Energy Build. 2022, 271, 112334. [Google Scholar] [CrossRef]
- GB/T 18049-2000; Determination of PMV and PPD Indices in Moderate Thermal Environments and Provisions for Thermal Comfort Conditions. State Bureau of Quality and Technical Supervision: Beijing, China, 2010.
- Yang, Z. Research on Energy Consumption of Buildings Based on Human Comfort. J. Hunan City Coll. 2017, 26, 19–24. [Google Scholar]
- Ono, T.; Hagishima, A.; Tanimoto, J. Non-Intrusive Detection of Occupants’ On/Off Behaviours of Residential Air Conditioning. Sustainability 2022, 14, 14863. [Google Scholar] [CrossRef]
- Li, Z. Investigation and Research on the Relationship between Human Energy Use Behavior and Energy Consumption in Chinese Residences. Master’s Thesis, Tsinghua University, Beijing, China, 2012. [Google Scholar]
- Zhou, X.; Mou, D.; Zheng, S. A simulation study on the use behavior and energy consumption of air conditioners by residents in Shanghai area in summer. Build. Technol. Dev. 2016, 43, 81–84. [Google Scholar]


| Investigative Projects | Essential Element |
|---|---|
| Basic information about the family | Origin, age, family structure, rooming-in status |
| Basic building information | Number of floors, floor area, building orientation |
| Household energy usage | Air-conditioning (heating) calculation period, tolerance temperature range, set temperature range, window-opening habits |
| Household energy consumption | High, medium, and low energy consumption groups |
| Energy consumption mentality | Weighting of emphasis on residential comfort and energy efficiency, emphasis on comfort in different rooms |
| No. | Family Structure | Composition | Energy Consumption Level | Cooling and Heating Equipment | Floor Area | Monitoring Equipment Installation 1,2,3 | |||
|---|---|---|---|---|---|---|---|---|---|
| Living Room | Master Bedroom | Children’s Room | Elderly Room | ||||||
| A1 | Three-generation lineal household | Couple + elderly + child | Low | Split air conditioner | 90 | ★☆▲△ | ★☆▲△ | ★☆▲△ | ★☆▲△ |
| A2 | Three-generation lineal household | Couple + elderly + child | Medium | Central air conditioning | 150 | ★☆▲ | ★☆▲ | ★☆▲ | |
| B1 | Standard nuclear household | Couple + child | Medium | Split air conditioner | 120 | ★☆▲△ | ★☆▲△ | ★☆▲△ | |
| B2 | Standard nuclear household | Couple + child | Medium | Split air conditioner | 150 | ★☆▲△ | ★☆▲△ | ★☆▲△ | |
| C1 | Couple household | Young couple | High | Split air conditioner | 90 | ★☆▲△ | ★☆▲△ | ||
| C2 | Couple household | Young couple | Medium | Split air conditioner | 60 | ★☆▲△ | |||
| C3 | Couple household | Middle-aged couple | Medium | Split air conditioner | 90 | ★☆▲△ | ★☆▲△ | ||
| C4 | Couple household | Young couple | High | Central air conditioning | 120 | ★☆▲ | ★☆▲ | ||
| D1 | One-person household | Youth | Medium | Split air conditioner | 30 | ★☆▲△ | |||
| D2 | One-person household | Youth | High | Split air conditioner | 30 | ★☆▲△ | |||
| Temperature | Percentage of Summer | |
|---|---|---|
| Typical Meteorological Year | Measurement Year | |
| >34 °C | 0.54% | 3.03% |
| >32 °C | 3.13% | 12.86% |
| >30 °C | 11.14% | 27.99% |
| >28 °C | 28.31% | 53.71% |
| >26 °C | 54.39% | 82.52% |
| Temperature | Percentage of Winter | |
|---|---|---|
| Typical Meteorological Year | Measurement Year | |
| <0 °C | 8.53% | 0.81% |
| <2 °C | 18.41% | 5.85% |
| <4 °C | 33.53% | 16.53% |
| <6 °C | 50.87% | 33.67% |
| <8 °C | 64.85% | 56.52% |
| Grading | Grading Criteria | Characteristics |
|---|---|---|
| Excellent | |PMV| ≤ 0.5 | 90% of the population is satisfied and suitable for human life. |
| Good | 0.5 ≤ |PMV| ≤ 1 | 75% of the population is satisfied with the environment, except for sensitive people. |
| Average | 1 ≤ |PMV| ≤ 1.5 | The environment is not harmful to health, but it affects comfort and has a high dissatisfaction rate. |
| Not good | 1.5 ≤ |PMV| ≤ 2 | Prolonged stays are harmful to health and seriously affect comfort, leading to a very high rate of dissatisfaction. |
| Bad | |PMV| > 2 | Harmful to human health, extremely poor comfort, and a very high rate of dissatisfaction. |
| Grading | Comfort | Energy Consumption |
|---|---|---|
| ★★★★★ | More than 50% of “excellent, good” | Less than 6 kWh/m2 throughout the year |
| ★★★★ | 50% of “excellent, good” | 6.0–6.2 kWh/m2 throughout the year |
| ★★★ | 49% of “excellent, good” | 6.3 kWh/m2 throughout the year |
| ★★ | 48% of “excellent, good” | 6.4–7.2 kWh/m2 throughout the year |
| ★ | Less than 48% of “excellent, good” | Greater than 7.2 kWh/m2 throughout the year |
| Project | Calculation Mode A | Calculation Mode B | |
|---|---|---|---|
| Meteorological parameters | Typical meteorological year | ||
| Indoor calorific value | Indoor lighting: 0.0141 kWh/m2·d Indoor personnel and equipment: Personnel thermal resistance mode 1 | Indoor lighting: 0.0141 kWh/m2·d Indoor personnel and equipment: Personnel thermal resistance mode 2 | |
| Indoor and outdoor ventilation mode | Ventilation mode 1 | ||
| Air-conditioning equipment use mode | Air-conditioning and heating calculation period | Air-conditioning period: 3 July to 15 September Heating period: 1 December to 28 February of the following year | |
| Air-conditioning tolerance temperature | Tolerance temperature mode 1 | ||
| Air-conditioning setting temperature | Set temperature mode 1 | ||
| Air-conditioning operation mode | Air-conditioning operation mode 1 | ||
| Air-conditioning and heating energy efficiency ratio | Air-conditioning energy efficiency ratio: 3.1 Heating energy efficiency ratio: 2.5 | ||
| Others | Kitchen and bathroom without temperature control | ||
| Mode | Cooling Energy Consumption (kWh/m2) | Heating Energy Consumption (kWh/m2) | Annual Energy Consumption (kWh/m2) | Comfort Compliance Rate (%) | Comfort Evaluation | Energy Saving Evaluation |
|---|---|---|---|---|---|---|
| Calculation mode A | 4.8 | 1.5 | 6.3 | 50% | ★★★★ | ★★★ |
| Calculation mode B | 4.0 | 2.4 | 6.4 | 49% | ★★★ | ★★ |
| Project | Calculation Mode A | Calculation Mode C1 | Calculation Mode C2 | |
|---|---|---|---|---|
| Meteorological parameters | Typical meteorological year | |||
| Indoor calorific value | Indoor lighting: 0.0141 kWh/m2·d Indoor personnel and equipment: Personnel thermal resistance mode 1 | |||
| Indoor and outdoor ventilation mode | Ventilation mode 1 | Ventilation mode 2 | Ventilation mode 3 | |
| Air-conditioning equipment use mode | Air-conditioning and heating calculation period | Air-conditioning period: 3 July to 15 September Heating period: 1 December to 28 February of the following year | ||
| Air-conditioning tolerance temperature | Tolerance temperature mode 1 | |||
| Air-conditioning setting Temperature | Set temperature mode 1 | |||
| Air-conditioning operation mode | Air-conditioning operation mode 1 | |||
| Air-conditioning and heating energy efficiency ratio | Air-conditioning energy efficiency ratio: 3.1 Heating energy efficiency ratio: 2.5 | |||
| Others | Kitchen and bathroom without temperature control | |||
| Mode | Cooling Energy Consumption (kWh/m2) | Heating Energy Consumption (kWh/m2) | Annual Energy Consumption (kWh/m2) | Comfort Compliance Rate (%) | Comfort Evaluation | Energy Saving Evaluation |
|---|---|---|---|---|---|---|
| Calculation mode A | 4.8 | 1.5 | 6.3 | 50% | ★★★★ | ★★★ |
| Calculation mode C1 | 4.0 | 1.8 | 5.8 | 50% | ★★★★ | ★★★★★ |
| Calculation mode C2 | 6.1 | 1.8 | 7.9 | 50% | ★★★★ | ★ |
| Project | Calculation Mode A | Calculation Mode D1 | Calculation Mode D2 | |
|---|---|---|---|---|
| Meteorological parameters | Typical meteorological year | |||
| Indoor calorific value | Indoor lighting: 0.0141 kWh/m2·d Indoor personnel and equipment: Personnel thermal resistance mode 1 | |||
| Indoor and outdoor ventilation mode | Ventilation mode 1 | |||
| Air-conditioning equipment use mode | Air-conditioning and heating calculation period | Air-conditioning period: 3 July to 15 September Heating period: 1 December to 28 February of the following year | Air-conditioning period: 15 July to 31 August Heating period: 15 December to 15 February of the following year | Air-conditioning period: 15 June to 30 September Heating period: 15 November to 15 March of the following year |
| Air-conditioning tolerance temperature | Tolerance temperature mode 1 | |||
| Air-conditioning setting temperature | Set temperature mode 1 | |||
| Air-conditioning operation mode | Air-conditioning operation mode 1 | |||
| Air-conditioning and heating energy efficiency ratio | Air-conditioning energy efficiency ratio: 3.1 Heating energy efficiency ratio: 2.5 | |||
| Others | Kitchen and bathroom without temperature control | |||
| Mode | Cooling Energy Consumption (kWh/m2) | Heating Energy Consumption (kWh/m2) | Annual Energy Consumption (kWh/m2) | Comfort Compliance Rate (%) | Comfort Evaluation | Energy Saving Evaluation |
|---|---|---|---|---|---|---|
| Calculation mode A | 4.8 | 1.5 | 6.3 | 50% | ★★★★ | ★★★ |
| Calculation mode D1 | 4.0 | 1.6 | 5.6 | 46% | ★ | ★★★★★ |
| Calculation mode D2 | 5.7 | 2.1 | 7.8 | 51% | ★★★★★ | ★ |
| Project | Calculation Mode A | Calculation Mode E1 | Calculation Mode E2 | Calculation Mode E3 | Calculation Mode E4 | |
|---|---|---|---|---|---|---|
| Meteorological parameters | Typical meteorological year | |||||
| Indoor calorific value | Indoor lighting: 0.0141 kWh/m2·d Indoor personnel and equipment: Personnel thermal resistance mode 1 | |||||
| Indoor and outdoor ventilation mode | Ventilation mode 1 | |||||
| Air-conditioning equipment use mode | Air-conditioning and heating calculation period | Air-conditioning period: 3 July to 15 September Heating period: 1 December to 28 February of the following year | ||||
| Air-conditioning tolerance temperature | Tolerance temperature mode 1 | Air-conditioning period: 27 °C Heating period: 19 °C | Air-conditioning period: 28 °C Heating period: 18 °C | Air-conditioning period: 30 °C Heating period: 16 °C | Air-conditioning period: 31 °C Heating period: 15 °C | |
| Air-conditioning setting temperature | Set temperature mode 1 | |||||
| Air-conditioning operation mode | Air-conditioning operation mode 1 | |||||
| Air-conditioning and heating energy efficiency ratio | Air-conditioning energy efficiency ratio: 3.1 Heating energy efficiency ratio: 2.5 | |||||
| Others | Kitchen and bathroom without temperature control | |||||
| Mode | Cooling Energy Consumption (kWh/m2) | Heating Energy Consumption (kWh/m2) | Annual Energy Consumption (kWh/m2) | Comfort Compliance Rate (%) | Comfort Evaluation | Energy Saving Evaluation |
|---|---|---|---|---|---|---|
| Calculation mode A | 4.8 | 1.5 | 6.3 | 50% | ★★★★ | ★★★ |
| Calculation mode E1 | 6.6 | 2.2 | 8.9 | 56% | ★★★★★ | ★ |
| Calculation mode E2 | 6.3 | 2.1 | 8.4 | 56% | ★★★★★ | ★ |
| Calculation mode E3 | 4.7 | 1.2 | 6.0 | 48% | ★★ | ★★★★ |
| Calculation mode E4 | 2.7 | 0.9 | 3.6 | 43% | ★ | ★★★★★ |
| Project | Calculation Mode A | Calculation Mode F1 | Calculation Mode F2 | Calculation Mode F3 | Calculation Mode F4 | |
|---|---|---|---|---|---|---|
| Meteorological parameters | Typical meteorological year | |||||
| Indoor calorific value | Indoor lighting: 0.0141 kWh/m2·d Indoor personnel and equipment: Personnel thermal resistance mode 1 | |||||
| Indoor and outdoor ventilation mode | Ventilation mode 1 | |||||
| Air-conditioning equipment use mode | Air-conditioning and heating calculation period | Air-conditioning period: 3 July to 15 September Heating period: 1 December to 28 February of the following year | ||||
| Air-conditioning tolerance temperature | Tolerance temperature mode 1 | |||||
| Air-conditioning setting temperature | Set temperature mode 1 | Air-conditioning period: 25 °C Heating period: 20 °C | Air-conditioning period: 26 °C Heating period: 19 °C | Air-conditioning period: 28 °C Heating period: 17 °C | Air-conditioning period: 29 °C Heating period: 16 °C | |
| Air-conditioning operation mode | Air-conditioning operation mode 1 | |||||
| Air-conditioning and heating energy efficiency ratio | Air-conditioning energy efficiency ratio: 3.1 Heating energy efficiency ratio: 2.5 | |||||
| Others | Kitchen and bathroom without temperature control | |||||
| Mode | Cooling Energy Consumption (kWh/m2) | Heating Energy Consumption (kWh/m2) | Annual Energy Consumption (kWh/m2) | Comfort Compliance Rate (%) | Comfort Evaluation | Energy Saving Evaluation |
|---|---|---|---|---|---|---|
| Calculation mode A | 4.8 | 1.5 | 6.3 | 50% | ★★★★ | ★★★ |
| Calculation mode F1 | 5.8 | 2.3 | 8.1 | 45% | ★ | ★ |
| Calculation mode F2 | 5.3 | 1.9 | 7.2 | 46% | ★ | ★★ |
| Calculation mode F3 | 3.5 | 1.1 | 4.5 | 46% | ★ | ★★★★★ |
| Calculation mode F4 | 2.1 | 0.8 | 2.9 | 46% | ★ | ★★★★★ |
| Project | Calculation Mode A | Calculation Mode G1 | Calculation Mode G2 | |
|---|---|---|---|---|
| Meteorological parameters | Typical meteorological year | |||
| Indoor calorific value | Indoor lighting: 0.0141 kWh/m2·d Indoor personnel and equipment: Personnel thermal resistance mode 1 | |||
| Indoor and outdoor ventilation mode | Ventilation mode 1 | |||
| Air-conditioning equipment use mode | Air-conditioning and heating calculation period | Air-conditioning period: 3 July to 15 September Heating period: 1 December to 28 February of the following year | ||
| Air-conditioning tolerance temperature | Tolerance temperature mode 1 | |||
| Air-conditioning setting temperature | Set temperature mode 1 | |||
| Air-conditioning operation mode | Air-conditioning operation mode 1 | Air-conditioning operation mode 2 | Air-conditioning operation mode 3 | |
| Air-conditioning and heating energy efficiency ratio | Air-conditioning energy efficiency ratio: 3.1 Heating energy efficiency ratio: 2.5 | |||
| Others | Kitchen and bathroom without temperature control | |||
| Mode | Cooling Energy Consumption (kWh/m2) | Heating Energy Consumption (kWh/m2) | Annual Energy Consumption (kWh/m2) | Comfort Compliance Rate (%) | Comfort Evaluation | Energy Saving Evaluation |
|---|---|---|---|---|---|---|
| Calculation mode A | 4.8 | 1.5 | 6.3 | 50% | ★★★★ | ★★★ |
| Calculation mode G1 | 4.6 | 1.8 | 6.4 | 48% | ★★ | ★★ |
| Calculation mode G2 | 9.0 | 4.3 | 13.3 | 78% | ★★★★★ | ★ |
| Factors | Calculation Mode | Comfort Evaluation | Energy Saving Evaluation | Comprehensive Evaluation | |
|---|---|---|---|---|---|
| The standard group | A | ★★★★ | ★★★ | ★★★★ | |
| Room presence | B | ★★★ | ★★ | ★★★ | |
| Ventilation mode | C | C1 | ★★★★ | ★★★★★ | ★★★★ |
| C2 | ★★★★ | ★ | ★★★ | ||
| Air-conditioning (heating) calculation period | D | D1 | ★ | ★★★★★ | ★★★ |
| D2 | ★★★★★ | ★ | ★★★ | ||
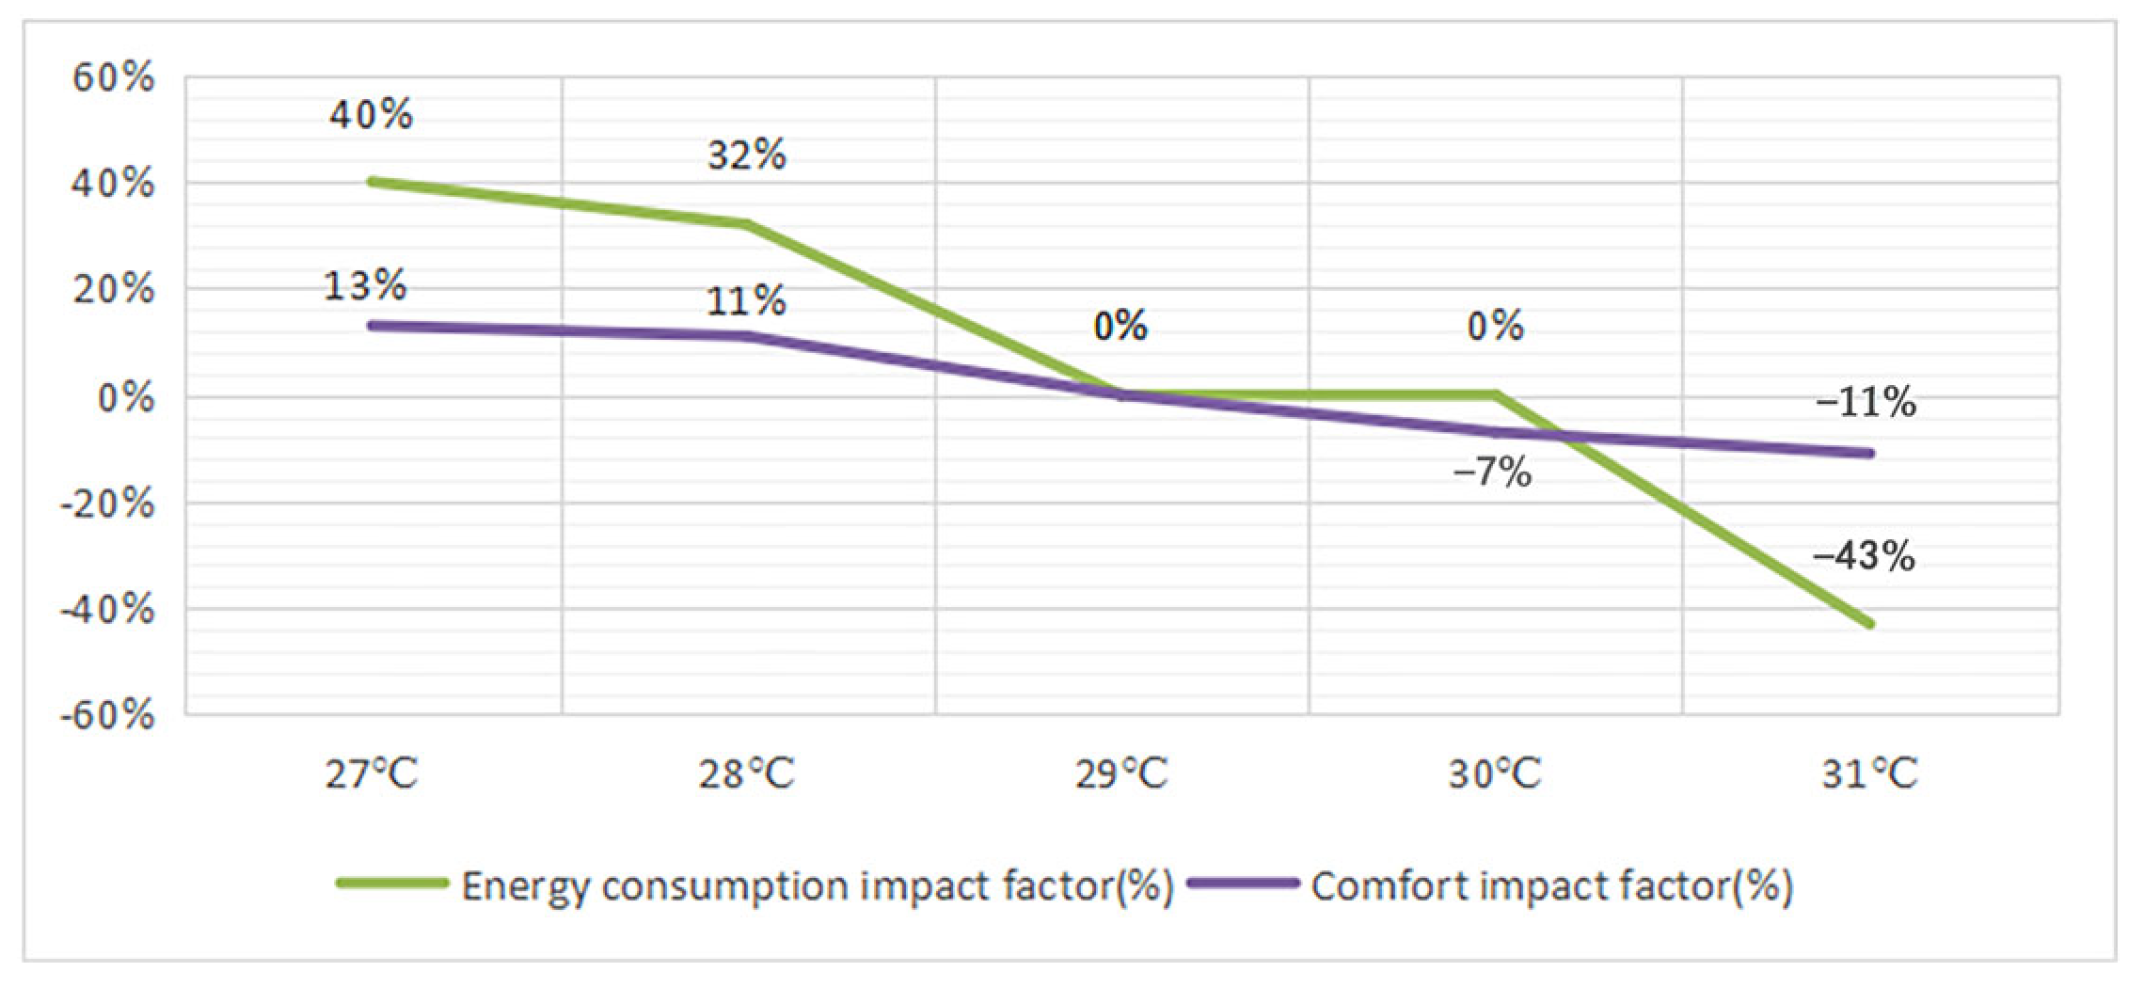
| Air-conditioning tolerance temperature | E | E1 | ★★★★★ | ★ | ★★★ |
| E2 | ★★★★★ | ★ | ★★★ | ||
| E3 | ★★ | ★★★★ | ★★★ | ||
| E4 | ★ | ★★★★★ | ★★★ | ||
| Air-conditioning set temperature | F | F1 | ★ | ★ | ★ |
| F2 | ★ | ★★ | ★ | ||
| F3 | ★ | ★★★★★ | ★★★ | ||
| F4 | ★ | ★★★★★ | ★★★ | ||
| Air-conditioning operation modes | G | G1 | ★★ | ★★ | ★★ |
| G2 | ★★★★★ | ★ | ★★★ | ||
Disclaimer/Publisher’s Note: The statements, opinions and data contained in all publications are solely those of the individual author(s) and contributor(s) and not of MDPI and/or the editor(s). MDPI and/or the editor(s) disclaim responsibility for any injury to people or property resulting from any ideas, methods, instructions or products referred to in the content. |
© 2023 by the authors. Licensee MDPI, Basel, Switzerland. This article is an open access article distributed under the terms and conditions of the Creative Commons Attribution (CC BY) license (https://creativecommons.org/licenses/by/4.0/).
Share and Cite
Chen, X.; Hu, Y. The Influence of Residential Behavior on Dwelling Energy Consumption and Comfort in Hot-Summer and Cold-Winter Zone of China—Taking Shanghai as an Example. Sustainability 2023, 15, 13686. https://doi.org/10.3390/su151813686
Chen X, Hu Y. The Influence of Residential Behavior on Dwelling Energy Consumption and Comfort in Hot-Summer and Cold-Winter Zone of China—Taking Shanghai as an Example. Sustainability. 2023; 15(18):13686. https://doi.org/10.3390/su151813686
Chicago/Turabian StyleChen, Xiaoyan, and Yanzhe Hu. 2023. "The Influence of Residential Behavior on Dwelling Energy Consumption and Comfort in Hot-Summer and Cold-Winter Zone of China—Taking Shanghai as an Example" Sustainability 15, no. 18: 13686. https://doi.org/10.3390/su151813686
APA StyleChen, X., & Hu, Y. (2023). The Influence of Residential Behavior on Dwelling Energy Consumption and Comfort in Hot-Summer and Cold-Winter Zone of China—Taking Shanghai as an Example. Sustainability, 15(18), 13686. https://doi.org/10.3390/su151813686