Article

Do Green Energy and Information Technology Influence Greenhouse Gas Emitting Countries to Attain Sustainable Development?

1
School of Business Administration, Faculty of Business Administration, Southwestern University of Finance and Economics, Chengdu 610074, China
2
School of Economics and Management, Nanjing University of Science & Technology, Nanjing 210094, China
3
School of Finance and Trade, Wenzhou Business College, Wenzhou 325035, China
*
Author to whom correspondence should be addressed.
Sustainability 2023, 15(18), 13685; https://doi.org/10.3390/su151813685
Submission received: 21 July 2023 / Revised: 31 August 2023 / Accepted: 5 September 2023 / Published: 13 September 2023

Abstract

:
Transitioning from traditional energy sources to green and sustainable energy sources can potentially reduce environmental problems. Many countries are gradually recording increasing greenhouse gas (GHG) emissions as they develop their economies. As a result, this study aims to use top GHG-emitting countries in its analysis to establish the role green energy and information technology play in reducing their pollution levels. Data from 11 GHG-emitting countries from 1990–2020 were utilized. The Fully Modified Ordinary Least squares (FMOLS), Dynamic ordinary least squares (DOLS), and Granger causality are used for the analysis. The empirical results revealed that an increase in non-renewable energy usage of 1% increases GHG gas emissions by 0.6960% (FMOLS) and 0.6119% (DOLS). On the impact of renewable energy, a 1% increase reduces GHG emissions by 0.1145% (FMOLS) and 0.1957% (DOLS). Also, a 1% increase in information technology increases GHG emissions by 0.0459% (FMOLS) and 0.0429% (DOLS) under the specifications of FMOLS and DOLS. The directional causalities are established in the study as well. In light of this, using “abundant” renewable energy sources is the gateway to reducing GHG emissions alongside their tremendous economic growth and I.T. development. Other policy implications are outlined for future research and policymakers.

1. Introduction

Greenhouse gas emissions (GHG) have risen in the last two decades due to several reasons. Its constituents include carbon dioxide, methane, and nitrous oxide emissions from all sources, including agriculture and land use change. The most significant greenhouse gas is carbon dioxide. Researchers measure greenhouse gas emissions in “carbon dioxide-equivalents” (CO2eq) to account for all emissions. This accounts for all greenhouse gases, not just CO2. Various studies have used CO2 to measure environmental pollution. However, this study uses GHG because it intends to measure the impact of the chosen variables on the overall ecological pollutants, not just CO2, as seen in many studies. In the climate change space, significant policies that have been encouraged and advised in recent years to reduce greenhouse gas (GHG) emissions have focused on enhancing clean energy [1,2]. The primary drivers of these policies are the extreme levels of CO2 emissions triggered by intensive non-renewable energy (NRE) in the overall energy mix [3,4]. Over 80% of the energy consumed worldwide comes from non-renewable sources [5]. This larger share has continued to worsen the dire issues associated with environmental pollution [6,7].
The problem is worse for developing countries like Africa, which rely on fossil fuel consumption and have relatively lower technological advancement [8]. For the green energy transition, mitigating climate change and its effects is desirable [9,10]. In this quest, scholars and decision-makers have recently debated the subject. Two crucial initiatives have been mentioned throughout the conversation as having a greater chance of reducing the rise in CO2 emissions. Green energy promotion comes first, followed by the growth of information and communication technology (ICT) [1]. In addition to benefitting the environment, renewable energy (RE) sources have become a viable alternative to conventional energy sources. These benefits also have a positive effect on the economy [11]. At least 0.4 billion tonnes of CO2 emissions can be reduced by transitioning to cleaner or green energies [5]. Moreover, technological advancement is essential for GHG emissions to be lowered in a sustainable manner [12]. Economies can realize the twin goals of developing their economy and environmental sustainability through technological improvement [9]. Globally, information and communications technology (ICT) contributes 1.5 gigatons, which represents approximately 2% of the world’s (GHG) emissions annually [13]. The industry has also contributed enormously towards environmental sustainability. Technologies aimed at improving ecological sustainability have significantly reduced GHGs in various sectors. In this regard, the ICT industry plays a more critical role in the fight against climate change. The industry is already working to reduce various types of emissions through technological innovation. As a result, its significant role in the GHG space within the African context should be analysed corresponding to its efficient energy use.
Fossil fuel energy (mostly coal) has contributed to significant GHG emissions over the ensuing years to meet the energy needs of developing nations like those in Africa [14]. As one of the developing regions, Africa contributed 3.9% of CO2 emissions worldwide from industry and fossil fuels in 2021 [15]. The continent added the smallest amount of GHG gases to the total emissions globally over the past two decades, varying between 3.4% and 3.9% [15]. Until recently, studies examining the causes of CO2 emissions and energy consumption have not focused on Africa due to its comparatively modest contribution to global carbon emissions [9,16]. However, it is worth noting that CO2 emissions in the area have significantly increased recently, with an average rise of 15.48% between 1995 and 2017 [9]. On the other hand, African economies have been growing tremendously in the last decade compared to the previous due to trade openness, foreign direct investment, technological advancement, and population growth. For example, Ghana was the fastest-growing economy in the world in 2019 [17]. With this rapid growth, it is evident that if measures are not put in place, Africa’s growth will lead to increased pollution, as seen in advanced countries like China and the United States, because economic growth has been associated with pollution problems [
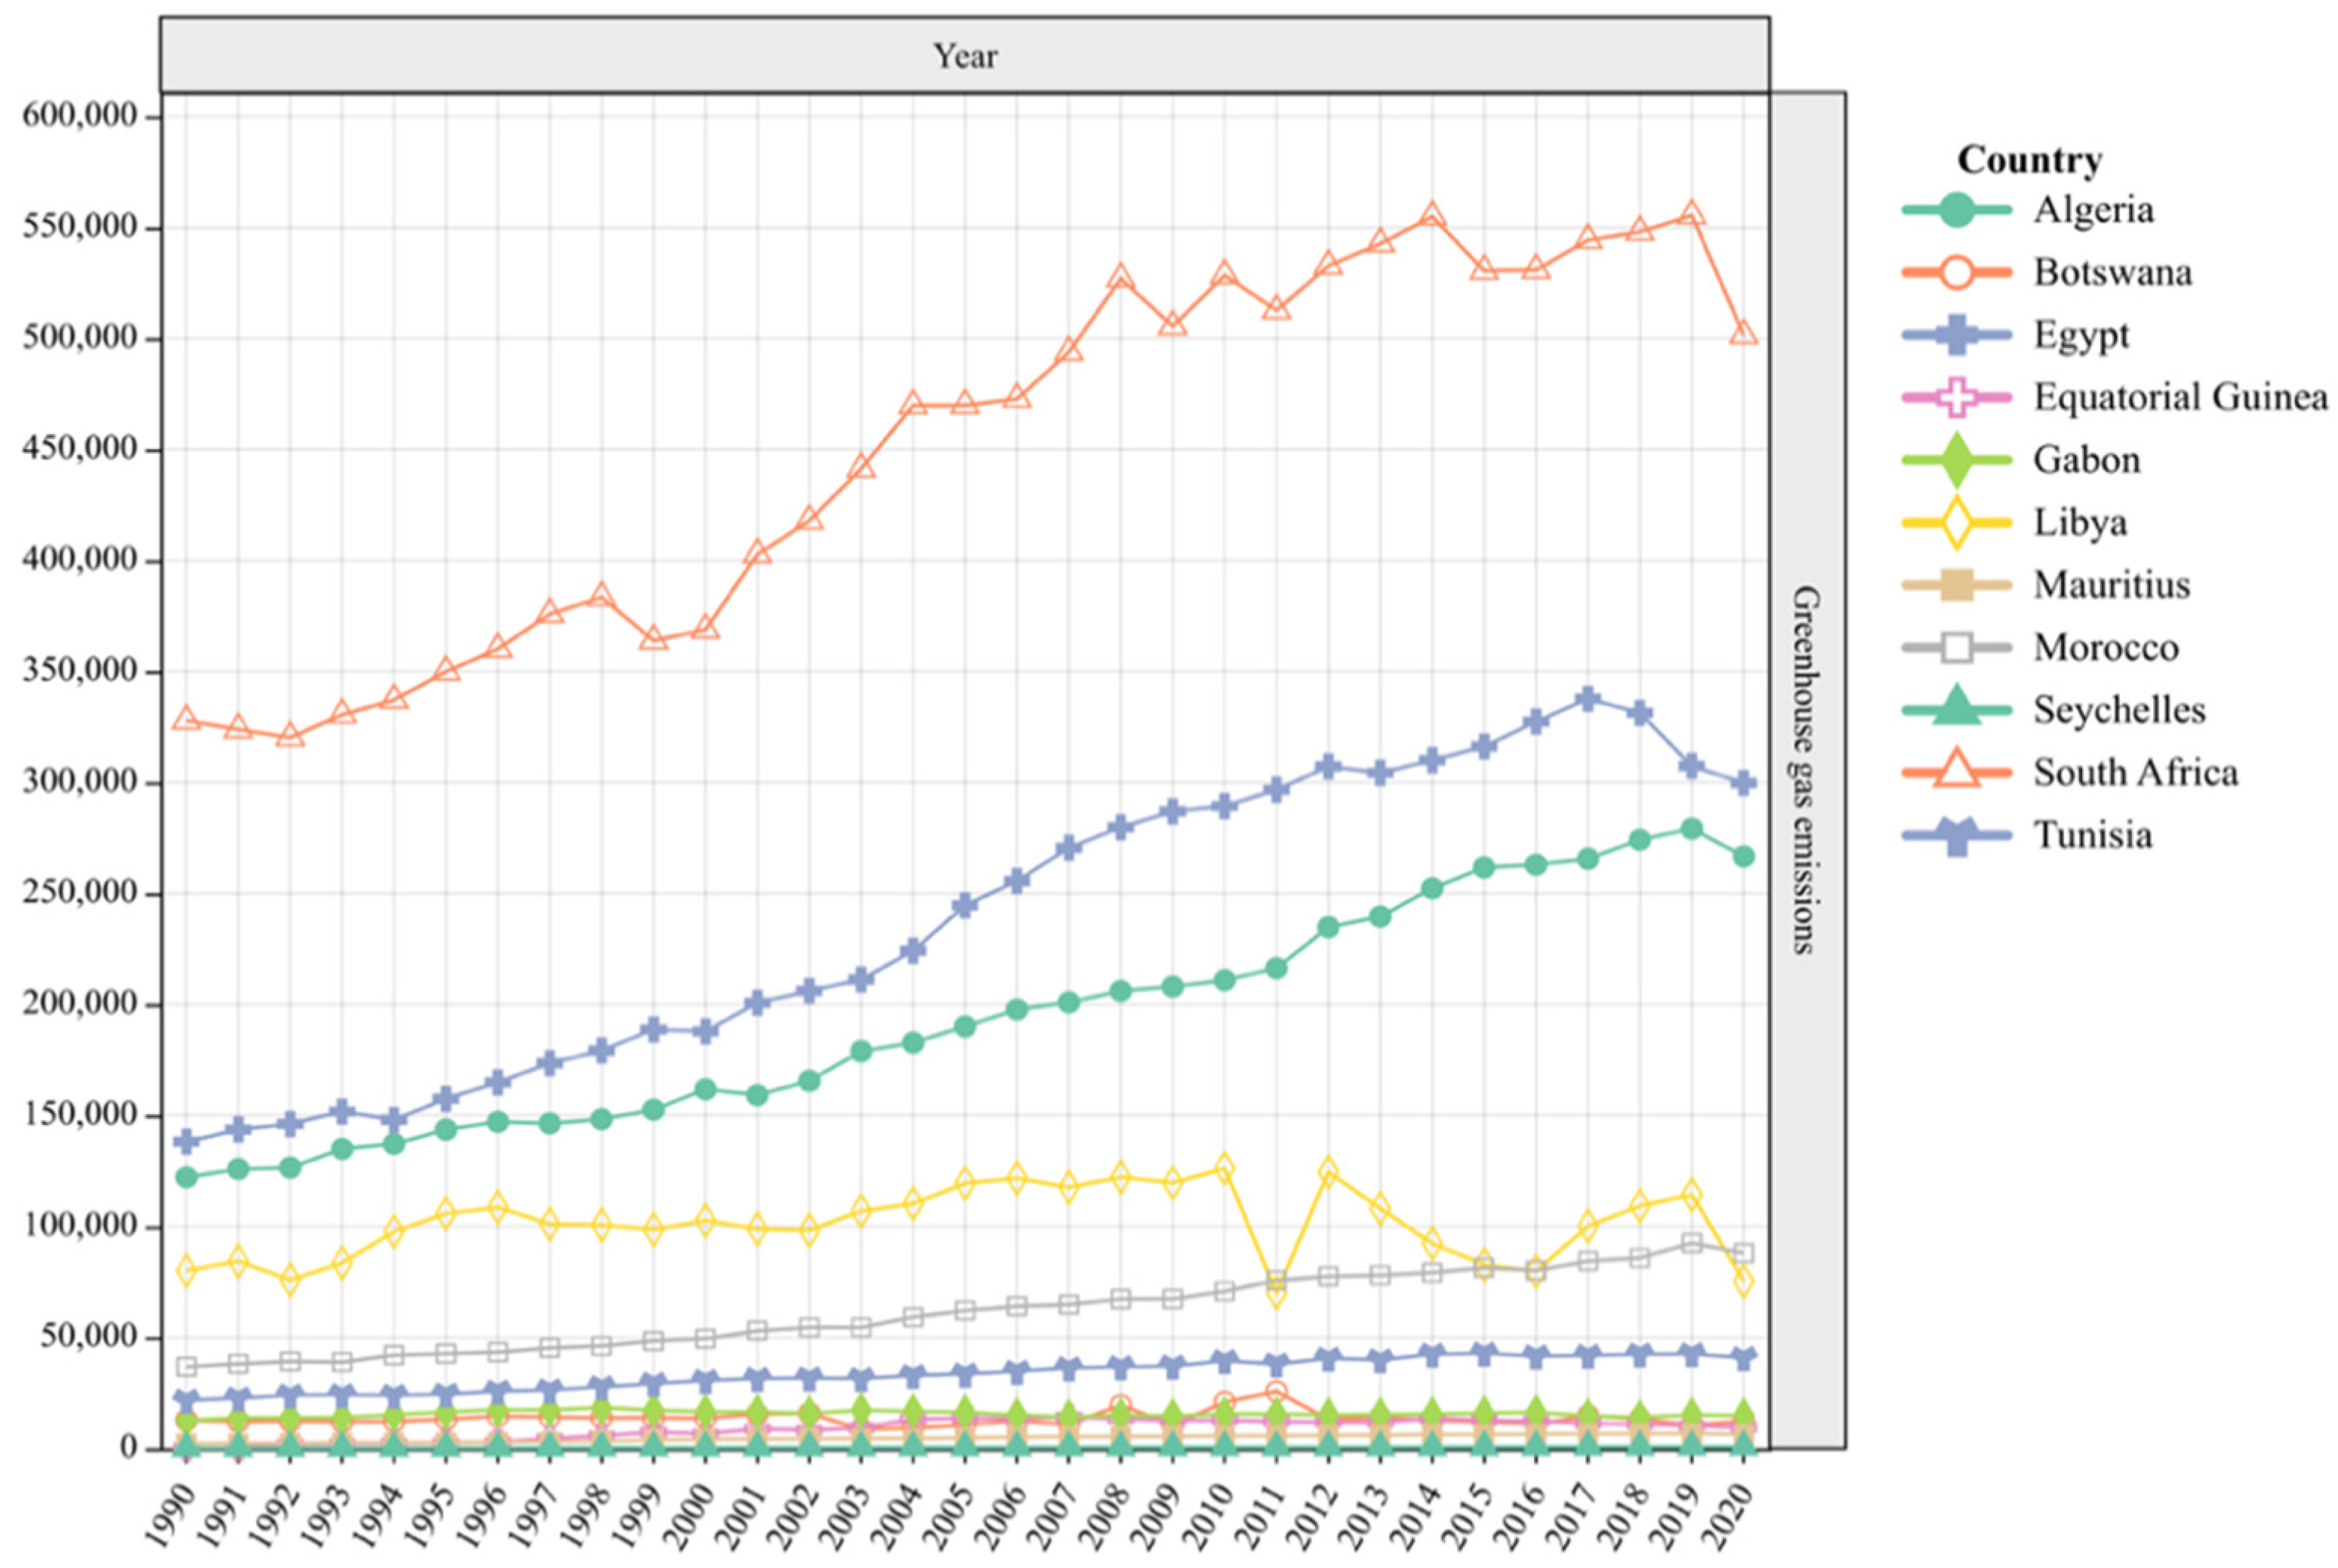
8]. According to the World Bank, Libya and Botswana are among the top GHG emitters in Africa, but have the fastest and highest rates of economic growth in Africa of 31.37% and 11.36%, respectively [18]. Unfortunately, although some countries produce more CO2 emissions than others, the consequences affect almost every region and the world. For instance, coal, which includes up to 45% ash and 1.2% sulphur, produces more than 90% of the energy in South Africa [19]. Also, the population has been argued as one of the significant influencers of GHG emissions. Countries with a higher population or urban population density will likely contribute to environmental pollution. These assertions and evidence led to the selection of variables to aid the study. The top polluting countries have been investigated in this study because it is necessary to identify mitigating factors to curb emissions, which will benefit the polluters and the innocent countries that emit insignificant amounts of GHG. Without proper climate change policy in place, Ref. [20] predicted that by 2100, Africa might contribute 5–20% of the world’s CO2 emissions. Without effective mitigation measures, the anticipated trends in CO2 emissions will cause a catastrophic situation for African countries, where most of them are destitute. This problem is emerging and spreading throughout Africa and other parts of the world.
Considering the above problem, it is imperative to conduct research that assesses the specific impact of energy consumption, I.T., economic growth, and population using Top GHG-emitting countries of the continent. In addition, Africa must immediately consider strategies to reduce or stop any potential increases in atmospheric GHG emissions [21]. This article addresses this critical question using top GHG-emitting countries in the region. Green energy sources like wind, solar, and hydropower can help Africa thrive in an environmentally friendly way. Africa has access to various renewable energy sources [22]. Despite being unlimited and freely available in the area, these renewable energies are mostly underdeveloped compared to non-renewable energy, emphasizing the important role of technological implementation in the region’s transition to a greener economy. Thus, the main focus of this study is to highlight the role green energy and I.T. can play in developing Africa’s sustainability. Specifically, the objectives of this research are to: (1) Determine the role of renewable energy on GHG emissions, (2) Determine the influence of non-renewable energy on GHG emissions in top GHG-emitting countries in Africa, (3) Determine the role played by economic growth in top GHG-emitting countries in Africa, (4) Establish the impact of urban population on top GHG-emitting African countries. Compared with earlier studies, this work’s novelty is threefold, and will make the following contributions to the literature and policymakers. First, this study is one of the first to examine how using green energy affects GHG emissions in the top African emitters of GHG gases, according to the latest data from [15]. Most nations have high-energy needs and significant possibilities for generating RE; analysing these top GHG-producing regions as a research case is particularly fascinating. Second, most of the studies conducted in Africa considered all countries, sub-Saharan Africa (SSA) or randomly selected countries, which may have generalizability issues. Some countries produce more GHG emissions than others, and thus placing them within the same category may create an unreliable result. This study considers the top 11 (T-11) GHG emitters in Africa to measure the real impact of these variables on others. This will provide more robust results. Lastly, this study adds to the environmental literature by investigating the influence of information technology on the GHG emissions of top GHG-emitting countries in Africa. By filling these gaps, the study will significantly contribute to the body of literature and suggest meaningful and practical policy implications that will help top GHG-emitting countries reduce pollution and assist low GHG-emitting countries in guiding their way through environmental sustainability as their economy grows. It will provide a strong foundation for future studies that intend to investigate the relationship between energy structures and environmental pollution in Africa and around the globe. The policy implications suggested in this study will equip policymakers with the information necessary to provide great policies to enhance green energy usage. Policymakers will identify the areas that need support and channel resources to promote environmental sustainability and meet energy needs.

2. Literature Review

2.1. Green Energy and GHG Emissions Nexus

When discussing the energy consumption literature, few studies have focused on African countries. These studies chose variables believed to influence GHG emissions and made valuable conclusions for future studies. Many important factors affecting energy consumption and, consequently, CO2 and GHG emissions include real GDP per capita, energy losses, innovation, trade openness, total investment, population growth, political stability, corruption, financial development, and renewable energy production [23,24]. Doskas [23] hypothesized a set of macro-financial, macro-environmental, and institutional variables that causally affect energy and electricity consumption in a holistic model using 109 countries in a multivariate panel framework and found these factors to influence energy consumption. Aside from these variables, monetary and fiscal variables have been identified to influence GHG emissions. Similarly, this study has selected renewable energy, non-renewable energy, information technology, GDP, and urban population to aid its objectives and fill gaps.
The last several decades have seen the emergence of renewable energy as a new energy source supporting a sustainable environment [25]. According to numerous studies conducted at various locations, it has the potential to lower CO2 emissions. Additionally, promoting and funding green energy has been linked to benefitting energy security and environmental quality worldwide [12,26]. Promoting and financing renewable energy sources helps countries with high GHG emissions reduce their reliance on fossil fuels in their energy mix portfolio and increase economic diversity [27]. The role of corporations also comes into play in building sustainable economies [28]. Several empirical studies have examined how green promotion [29] or renewable energy might help increase environmental sustainability [30]. There is strong evidence from multiple studies that suggest that renewable energy benefits the environment by lowering CO2 levels [31]. For instance, 85 nations were chosen by [32] for their study on green energy and environmental pollution. According to the study’s findings, using green or renewable energy lowers CO2 emissions, which helps to enhance the environment.
Inglesi-Lotz and Dogan [33] set out on a journey to determine the distinct impact of non-renewable and renewable energy use on the decrease of CO2 emissions. They found that whereas non-renewable energy increases emissions, renewable energy decreases emissions. This is an assertion that traditional energy sources can be substituted with modern green ones. Using data from 25 developing countries [34] studied the effect RE has on CO2 emissions and concluded that using RE lowers CO2 emissions and promotes “green” growth in developing nations. Thus, green energies should be prioritized if green economic development is to be achieved. According to [35], renewable energy consumption is the primary reason for the drop in CO2 emissions in OECD nations. A study by [36] that used a broader sample of 128 countries to determine the influence of RE on CO2 found that using RE can lower CO2 emissions. For the G20, Ref. [37] found that RE usage reduces CO2 emissions. Ref. [38] discovered the opposite when they examined five North African countries. The usage of RE reduced CO2 emissions for 16 E.U. countries, according to [39]. They believe using sustainable energy technologies will contribute to attaining the Sustainable Development Goals. The exact converse, however, was found for low-income nations [40], where RE use was found to boost emissions.
Irandoust [41] found that RE use enhances environmental well-being by lowering CO2 emissions in the study, which focused on four Nordic countries. Ref. [42] confirmed that Pakistan’s CO2 emissions have decreased dramatically due to RE use. Ref. [43] study supported this finding when they investigated the same relationship in Pakistan. China produces the highest GHG emission in the world, and a study by [44] indicated that consumption of RE lessens China’s exposure to the adverse impacts of CO2 emissions. Similarly, Algeria makes the top five GHG emitters in Africa, and a study by [45] in the region found RE to decrease their CO2 emissions. In Africa, research by [31] that investigated the impact of RE on CO2 emission in more than 20 African nations revealed that RE is an excellent substitute for NRE sources. In the same African space, Ref. [46] investigated the connection between RE and CO2 emissions in SSA and established that using RE reduces CO2 emissions. An earlier investigation into the relationship between the two in 24 SSA countries by [47] found no evidence of a direct causal relationship between CO2 emissions and RE consumption. Based on these significant findings, it can be seen that green energy is potentially the lifesaver of energy crises and environmental pollution.

2.2. Information Technology and GHG Emissions Nexus

The advancement of today’s world can be credited to the development of Information Technology (I.T.). Recent studies on I.T.’s impact on the modern world have stressed ICT’s contribution to enhancing environmental sustainability through efficient energy and conservatism promotion [1]. ICT will likely lower CO2 emissions via efficient energy production and conservation [48]. The link between ICT and CO2 emissions is intricate and multidimensional. On the one hand, numerous studies have shown the benefits of I.T. on environmental quality [49,50]. The negative impact of I.T. on the environment has also been established in the literature. For instance, Ref. [51] disclosed that I.T. drove environmental pollution when studying ASEAN countries. Furthermore, multiple studies of empirical investigations have shown that ICT, through the development and usage of equipment, raises the amount of air pollution and GHG emissions [52]. Some have also established no relationship between the two. For example, Refs. [53,54] concluded an unnoticeable connection between CO2 emissions and ICT. Specifically, studies on I.T. and CO2 emission nexus are discussed below.
According to [55] regarding the effect of ICT on the global GHG footprint, smartphones will make up about 11% of the entire ICT footprint by 2020 and double GHG emissions from 2007 to 2020. Ref. [56] concluded that ICT use in sub-Saharan Africa is linked to environmental pollution. According to Ref. [57], ICT has a more significant impact on reducing CO2 emissions in the central part of China than in the east, but it has no discernible effect on the West. ICT can help solve environmental problems, but can also make them worse [58]. Also, an inverted U-shaped relationship between ICT and CO2 emissions was confirmed in a study by [59]. Moreover, Ref. [60] discovered that ICT lowers CO2 emissions in the long term but has no immediate connection. Ref. [50] looked into how ICT affected CO2 emissions in the OECD and discovered that long-term Internet use significantly reduced CO2 emissions, concluding that ICT does not pose an environmental threat to the OECD region. When [61] examined how Internet use affects CO2 emissions, they found evidence that it does so in some European Union countries. Ref. [62] demonstrated that subscriptions of mobile phones and the Internet pose a hazard to the environment in growing nations.
In a different study, Ref. [53] looked at the ICT and pollution nexus using 44 SSA nations and discovered that, albeit having an insignificant effect, increasing ICT use reduced CO2 emissions triggered by the consumption of liquefied fuel. Finally, Ref. [63] found an adverse link connecting CO2 emissions and ICT and admonished developing countries to embrace ICT.

3. Materials and Methods

3.1. Sources of Data and Processing

Data were gathered to aid the analysis relating to the top GHG-emitters in Africa (Algeria, Botswana, Egypt, Equatorial Guinea, Gabon, Libya, Mauritius, Morocco, Seychelles, South Africa, and Tunisia) from 1990 to 2020, and it is comprised of six variables that have been taken into consideration. The sample size was selected based on the availability of data. The variables in this study were selected based on their alignment with United Nations Sustainable Development Goals (SDGs), particularly Goal 7 (Clean and affordable energy), Goal 8 (Decent work and economic growth), and Goal 13 (Climate action). The variables, abbreviations, measurement units, and data sources have been presented in Table 1. Likewise, the trend graph for T-11 greenhouse gas emissions in Africa is given in Figure 1.

3.2. Descriptive Statistics

To prepare for the analysis using econometric models, it is crucial to first estimate the properties of the sample data. This study focuses on Africa’s T-11 GHG-emitting countries as a benchmark for sustainable development worldwide. Table 2 presents the descriptive statistics of the variables. Based on these values, it is observed that information technology has a mean of 0.4991 and a standard deviation of 1.2422, GDP has a mean of 10.2980 and a standard deviation of 0.7962, and greenhouse gas emissions have a mean of 4.4536 and a standard deviation of 0.8606. Non-renewable energy has a mean of 1.8747 and a standard deviation of 0.1977, renewable energy has a mean of 0.9244 and a standard deviation of 0.6898, and urban population has a mean of 1.7636 and a standard deviation of 0.0965. Additionally, the lack of significant difference between the mean and standard deviation indicates the absence of outliers in the data provided.
The methodological structure for this research is shown in Figure 2. The first step involved performing a panel unit root test to assess the stationary nature of the data. Subsequently, the Pedroni and Kao co-integration tests were conducted to explore the long-run interrelationship of the variables. In the third step, two estimation techniques, FMOLS and DOLS, were used to examine the effect of various determinants on GHG emissions. Finally, the study used the Dumitrescu–Hurlin panel causality test to identify the causal relationships between different variables, a robust testing method.

3.3. Model Specification

The proposed econometric model in this research is based on the studies conducted by [65,66]. This study extends their model by including information technology, non-renewable energy, renewable energy, and urban population in Africa’s T-11 greenhouse gas emission. Equation (1) depicts the econometric approach of the research.
G H G = G D P ,   I T ,   N R E ,   R E ,   U P
where GHG represents GHG emissions, while GDP, IT, NRE, RE, and UP denote gross domestic products, information technology, non-renewable energy, renewable energy, and urban population, respectively. The study logarithmizes Equation (1) for time series analysis as Equation (2) follows.
L N G H G i t = β 0 + β 1 L N G D P i t + β 2 L N I T i t + β 3 L N N R E i t + β 4 L N R E i t + β 5 β L N U P i t + ε i t
where L.N. denotes the natural log, β1–β5 signifies the parameters to be estimated. β0 denotes the intercept. i and t are equal to 1 and depict the countries and the period covering 30 years, t = 1990 to 2020, respectively. The εit is the stochastic error term and is considered to be serially not correlated.

3.4. Unit Root Test

To test the stationarity of the data, panel unit root tests were performed in this study. The simultaneous processing of time series and cross-sections requires good data. Therefore, we used various panel unit root tests, including the Fisher augmented Dickey–Fuller test [67] and the IPS unit root test developed by [68]. That is, the ADF regression is estimated, and the residuals in the cross-section of each panel are computed as defined by Equation (3):
Δ y = a i + p i y i , t j + γ 1 y ¯ t 1 + j k γ i j Δ   y ¯ i , t j + j = 0 k Δ   y ¯ i , t j + ε i t
where y ¯ t 1 = 1 N i = 1 N y i , t 1 , Δ y ¯ t = 1 N i = 1 N y i t and ti (N, T) is the t-statistics of the estimates, and P’ is the individual ADF statistics.

3.5. Co-Integration Test

The next step is to investigate the long-run co-integration among selected variables using the integrated data. Given that each variable is integrated at the difference, the co-integration tests by Padroni and Kao [69] are more appropriate. Moreover, Pedroni’s co-integration analysis allows more than one explanatory variable, so it is an appropriate technique for the present study. The general form of the specified test is given as Equation (4),
L N G H G i t = α i t + δ i t + β 1 L N G D P i t + β 2 L N I T i t + β 3 L N N R E i t + β 4 L N R E i t + β 5 β L N U P i t + μ i t
μ i t = p i μ i t μ i t
whereas, i = 1, …, N present the panel number, t = 1, …, T refers to time period. Similarly, α i t and δ i t allow the presence of country-specific and deterministic effects, respectively. μ i t represents the error term. Therefore, to test the hypothesis for no eco-integration, Pedroni has proposed panel and group tests. Within the dimension consists of four statistics, and between the dimensions includes three statistics [69].

3.6. Long-Run Estimates

With solid evidence of long-run co-integration, the next step is to test the long-run connection between the variables. Therefore, this study employed two estimation techniques: the Fully Modified Ordinary Least Squares (FMOLS) and Dynamic Ordinary Least Squares (DOLS). The FMOLS technique, initially developed by Pedroni [70], is residual-based and is more robust in cointegrated constructs. It is deemed reliable in estimation, especially in a relatively smaller sample size, and handles endogeneity and serial correlation issues in the variables very well [71]. On the other hand, DOLS, developed by [72], is argued to provide more reliable results than FMOLS and eliminate associated regressors’ correlations [73]. These econometric techniques are helpful when the panel data have endogeneity problems and autocorrelation between the variable and the error term. Therefore, the present research has employed the panel FMOLS & DOLS tests, and their general forms are shown in Equations (5) and (6) as follows
β F M O L S = 1 N i = 1 N t = 1 T A i t b a r   A i 2 1 × t 1 T A i t b a r   A i 2 b a r Y i t T b a r Δ e μ
β D O L S = 1 N i = 1 N t = 1 T A i t A i t 2 1 i = 1 N t 1 T A i t Y i t
where Y is the dependent variable, and A represents the independent variables in the proposed model.

3.7. Dumitrescu–Hurlin (D-H) Panel Causality Test

The basic requirement for performing the causality test is that all variables must be stationary, as discussed in reference [74,75]. Dumitrescu and Hurlin [76] extend the existing Granger causality test to estimate causality in panel data. This specific test is referred to as the D-H panel causality test. It is applicable when the number of time periods (T) is greater than the number of cross-sectional units (N), and when integrated variables are measured at the first difference [75]. The Dumitrescu–Hurlin test calculates two distinct statistics: W-bar and Z-bar. The W-bar statistic determines the mean test, whereas the Z-bar statistic represents a standardized normal distribution. The generic form of causality can be described as Equation (7)
y i t = α i + K = 1 K θ i k   y i , t k = K = 1 K φ i k   X i , t k + ε i t
The null hypothesis that there is no causal relationship between the variables can be formulated as follows:
H 0 : ψ i 1 = = ψ i k = 0 i = 1 ,   N
The null hypothesis of uniform non-causality can be represented as
H 1 : ψ i 1 = = ψ i k = 0 i = 1 ,   N 1
ψ i 1 0   o r o r ψ i k 0 i = N 1 + 1 ,   N
This is related to the causality at the individual countries level and is shown in Equation (8):
W N , T H n c = N 1 i = t N W I , T
On the other hand, Z = harmonized statistics includes N = infinity and T = infinity and adheres to the standard normal distribution as in Equation (9):
Z = N 2 K .   W N , T H n c M N 0 , 1

4. Results and Discussion

4.1. Panel Unit Root Test

This study conducted panel unit root tests before proceeding with further analysis. Two different unit root tests, IPS and ADF-Fisher, were conducted. The variables were tested in their level and first differences to establish their stationarity. Al level, the null hypothesis could not be rejected for most variables. However, when they were tested in their first difference, they all satisfied the requirements of the study and can be considered stationary with a 95% confidence interval. This gives the green light to conduct the regression analysis for the study further. Variables that are not integrated can result in unreliable regression analyses [77]. The results are presented in Table 3.
The study moved ahead to assess the long-run co-integration connection within the variables. To accomplish this, the Pedroni co-integration test by [78], is employed in this study. This test utilizes eleven different statistics and operates within parametric and non-parametric frameworks. The analysis conducted within and between dimensions has supported 6 out of the 11 tests. It can be concluded that all selected T-11 GHG African countries exhibit long-term co-integration for the variables under investigation. Therefore, it can be concluded that the selected T-11 GHG African countries demonstrate long-run co-integration among all the variables. Additionally, to validate the results obtained through the Pedroni test, the study employs the Kao panel co-integration technique developed by Kao [79]. The outcome further confirms the Pedroni test. The results of the Pedroni and Kao tests are displayed in Table 4.

4.2. The Outcomes of DOLS and FMOLS Estimators

The subsequent stage involves calculating the long-term co-integration vector between GHG emissions and their determining factors. This study’s FMOLS and DOLS estimations used a pooled weighted estimating method that considered deterministic trends and constants. The findings of the panel FMOLS and DOLS estimators for the chosen T-11 GHG African countries are presented in Table 5 to see the effects of economic growth (GDP), information technology (I.T.), non-renewable energy (NRE), renewable energy (RE), and urban population (UP) on GHG emissions. All the variables are in their natural log form L.N.
Based on the statistical analysis, a positive correlation between the coefficient values of NRE and GHG emissions was recorded. This means that if the non-renewable energy factor increases by 1%, there will be a corresponding increase in GHG emissions by 0.6960% (FMOLS) and 0.6119% (DOLS). The evidence suggests a strong relationship between NRE and GHG emissions in selected T-11 GHG African countries. It strongly indicates that these countries’ dependence on NRE has been detrimental to their sustainability levels. NRE sources such as coal, oil, and natural gas contribute to the emission of GHG in several ways. Firstly, the extraction, refining, and transportation of these fuels require heavy machinery and vehicles emitting CO2 emissions and other greenhouse gases. Secondly, when these fuels are burned to generate electricity or for transport, they release CO2, methane, and other poisonous gases into the atmosphere. Finally, producing and disposing of products made from non-renewable sources also contributes to greenhouse gas emissions. Overall, the continued use of NRE sources is a significant contributor to GHG emissions and the associated consequences on the environment. This evidence is in line with a study by [33,39,80,81], in contrast with [71,82], who found that NRE reduces GHG emissions.
The study found an adverse correlation linking the coefficient of urban population and GHG emissions. This means that if the urban population factor increases by 1%, there will be a corresponding reduction in GHG emissions by FMOLS (0.6562%) and DOLS (0.7462%). A strong link between the urban population and GHG emissions was revealed. The density of these countries has contributed to reducing their GHG emissions. An urban population can significantly impact greenhouse gas emissions, which is not always positive. Consequently, in the case of T-11 emissions countries, urban areas tend to have higher energy consumption per capita than rural areas. This is due to factors such as increased use of air conditioning and heating, more travel by car, and higher demand for goods and services that require energy to produce and transport. In addition, urbanization can lead to deforestation and loss of natural habitats, contributing to climate change. When forests are destroyed to pave the way for the development of cities, the carbon stored in the trees is released into the atmosphere. Furthermore, urbanization can disrupt the water cycle and lead to soil erosion, further exacerbating climate change’s effects. This trend in T-11 emissions urban areas will often result in higher levels of air pollution than rural areas, which can contribute to respiratory and other health problems. This can lead to increased healthcare costs, lost productivity, and increased greenhouse gas emissions from healthcare facilities and transportation. This evidence is consistent with research by [83,84], but contrary to [16,85], who demonstrated that urban population positively influences CO2 emissions.
Considering the impact of RE, the coefficient is adversely correlated with GHG emissions at a 5% significant level. Inferences can be drawn that a 1% increase in RE triggers a decline in GHG emissions by 0.1145% (FMOLS) and 0.1957% (DOLS). Consequently, RE sources can have a significant positive impact on reducing greenhouse gas emissions. This indicates that these countries are greatly reducing their pollution levels. By replacing fossil fuels with renewable energy, we can reduce the amount of carbon dioxide and other harmful gases released into the atmosphere. However, there are some negative impacts to consider. One potential downside is that renewable energy technologies require significant energy and resources to manufacture, transport, and install. In addition, some renewable energy projects can negatively impact local ecosystems and wildlife. Despite these challenges, renewable energy remains a critical tool in the fight against climate change. The results are consistent with those of [1,9,85], who revealed that using RE causes a significant reduction in CO2 emissions. A related finding is identified by [86], who found that RE benefits the environment by reducing CO2 emissions. Furthermore, the findings corroborate with those of [11,87], who showed that the utilization of RE lowers CO2 emissions. Nevertheless, these results contradict those of [3,88], who demonstrated that RE does not contribute to reducing CO2 emissions.
Furthermore, information technology positively influences GHG emissions. This means that a 1% rise in information technology raises GHG emissions by 0.0459% (FMOLS) and 0.0429% (DOLS). Therefore, the energy required to power data centres and other I.T. infrastructure can be quite substantial, and if that energy comes from fossil fuels, it will contribute to GHG emissions. A shift to producing green technologies is a necessity for these countries to combat environmental pollution. Moreover, the production and disposal of electronic devices can also impact the environment. Finally, increased remote work and digital communication can reduce transportation and emissions from commuting and business travel. This result is consistent with [1,62,89], who found that I.T. positively influences CO2 emissions. Ref. [61] revealed that using the Internet reduces environmental quality. Moreover, this finding corresponds to that of [90], who confirmed ICT to be detrimental to the environment in a study conducted in South and Southeast Asian countries. However, these findings contradict the study of [53], who revealed that ICT helps to reduce the probable harmful effects on the environment.
Lastly, according to the results, GDP (economic growth) positively influences GHG emissions. The implication is that whenever GDP rises by 1%, there will be an upsurge in GHG emissions by 0.1708% (FMOLS) and 0.1294% (DOLS). Studies including [16,84,85,91,92] have also found a positive link between GDP and GHG emissions. The impact of economic growth on GHG emissions can be explained in three ways. Firstly, the effect of GDP on GHG emissions is through increased consumption. As GDP increases, people tend to consume more goods and services, leading to more greenhouse gas emissions from the production, transportation, and disposal of these goods and services. Furthermore, the correlation between GDP and greenhouse gas emissions arises due to the rise in industrialization and urbanization. As countries become more industrialized and urbanized, they tend to emit more greenhouse gases due to increased energy use, transportation, and waste generation. Finally, one important factor contributing to greenhouse gas emissions is using energy-intensive technologies, which a nation’s GDP can influence. As nations become more developed, they tend to rely on energy-intensive technologies such as fossil fuels, which contribute significantly to greenhouse gas emissions. In summary, the essential results discussed and signs (+/−) are highlighted in Figure 3.
The study presented the results of the Variance Inflation Factor (VIF) analysis in Table 6. O’Brien [93] indicated that the model is free from multicollinearity if the average VIF value is less than 10. Based on the analysis, the study found that the average VIF value in our model is less than three, which further solidifies the absence of multicollinearity. Therefore, based on these findings, we can confidently conclude that our model does not suffer from the problem of multicollinearity.

4.3. Dumitrescu–Hurlin Panel Causality Results

The essential requirement for performing the causality test is that all variables must be stationary, as discussed in references [74,75]. In this study, the selected determinants were stationary after applying the first difference. An extended version of the Granger co-integration test described in Dumitrescu–Hurlin [76] is used to estimate the causal link among the selected variables. The Dumitrescu–Hurlin test calculates two distinct statistics: W-bar and Z-bar. The W-bar statistic determines the mean test, whereas the Z-bar statistic represents a standardized normal distribution. Establishing the direction of causality is beneficial for policymaking, as it will allow them to suggest appropriate sustainable policies and environmental strategies for the selected T-11 GHG African countries.
Table 7 shows the causal relationships between GHG emissions and their determinants. All determinants are in their natural logarithmic form. It shows a bi-directional causality between GDP and GHG emissions in T-11 GHG African countries. This implies that any variation in GDP would lead to a variation in GHG emissions and reciprocally. Put simply, environmental development policies and GDP work together. This result supports the findings of [1,94,95,96], where the authors found a bidirectional relationship between urban population and GDP. However, this result corresponds with [84]. They also found bidirectional causality between I.T. and GHG emissions, with corresponding feedback from GHG emissions to I.T. There is also bidirectional causality between I.T. and GDP. This relationship between the variables suggests that I.T. and GDP are Granger causes of each other. This result is consistent with [84,97,98]. A bidirectional causal link between RE and GHG emissions was recorded, with corresponding feedback from GHG emissions to RE. This result is consistent with [99]. In addition, there is a bi-directional causality between RE and GDP. This relationship between the variables in question shows that RE and GDP Granger cause each other. This result is consistent with [47,100].
The study finds a bidirectional causality between NRE and GHG emissions, with corresponding feedback from GHG emissions to NRE. There is also a bidirectional causality between RE and GDP. This relationship between the variables suggests that RE and GDP Granger cause each other. This result is consistent with [44]. Also, bidirectional causal links between RE and GHG emissions were observed, with corresponding feedback from GHG emissions to NRE. This finding is in tandem with [44,99]. In addition, there is a bidirectional causality between UP and NRE. This relationship between the variables suggests that UP and NRE Granger cause each other. There is bidirectional causality between UP and RE. This relationship between the variables indicates that UP and RE Granger cause each other. This evidence corroborates with [85]. A unidirectional link is recorded from RE to I.T., which signifies that RE Granger causes I.T. while I.T. does not Granger cause it. Similarly, GDP does not Granger cause UP, but UP causes GDP. This describes that UP supports GDP, but GDP does not support UP. This result is in tandem with [84]. The one-way causal link from RE to I.T. is also examined. Lastly, RE Granger causes NRE.

5. Conclusions and Policy Implications

5.1. Conclusions

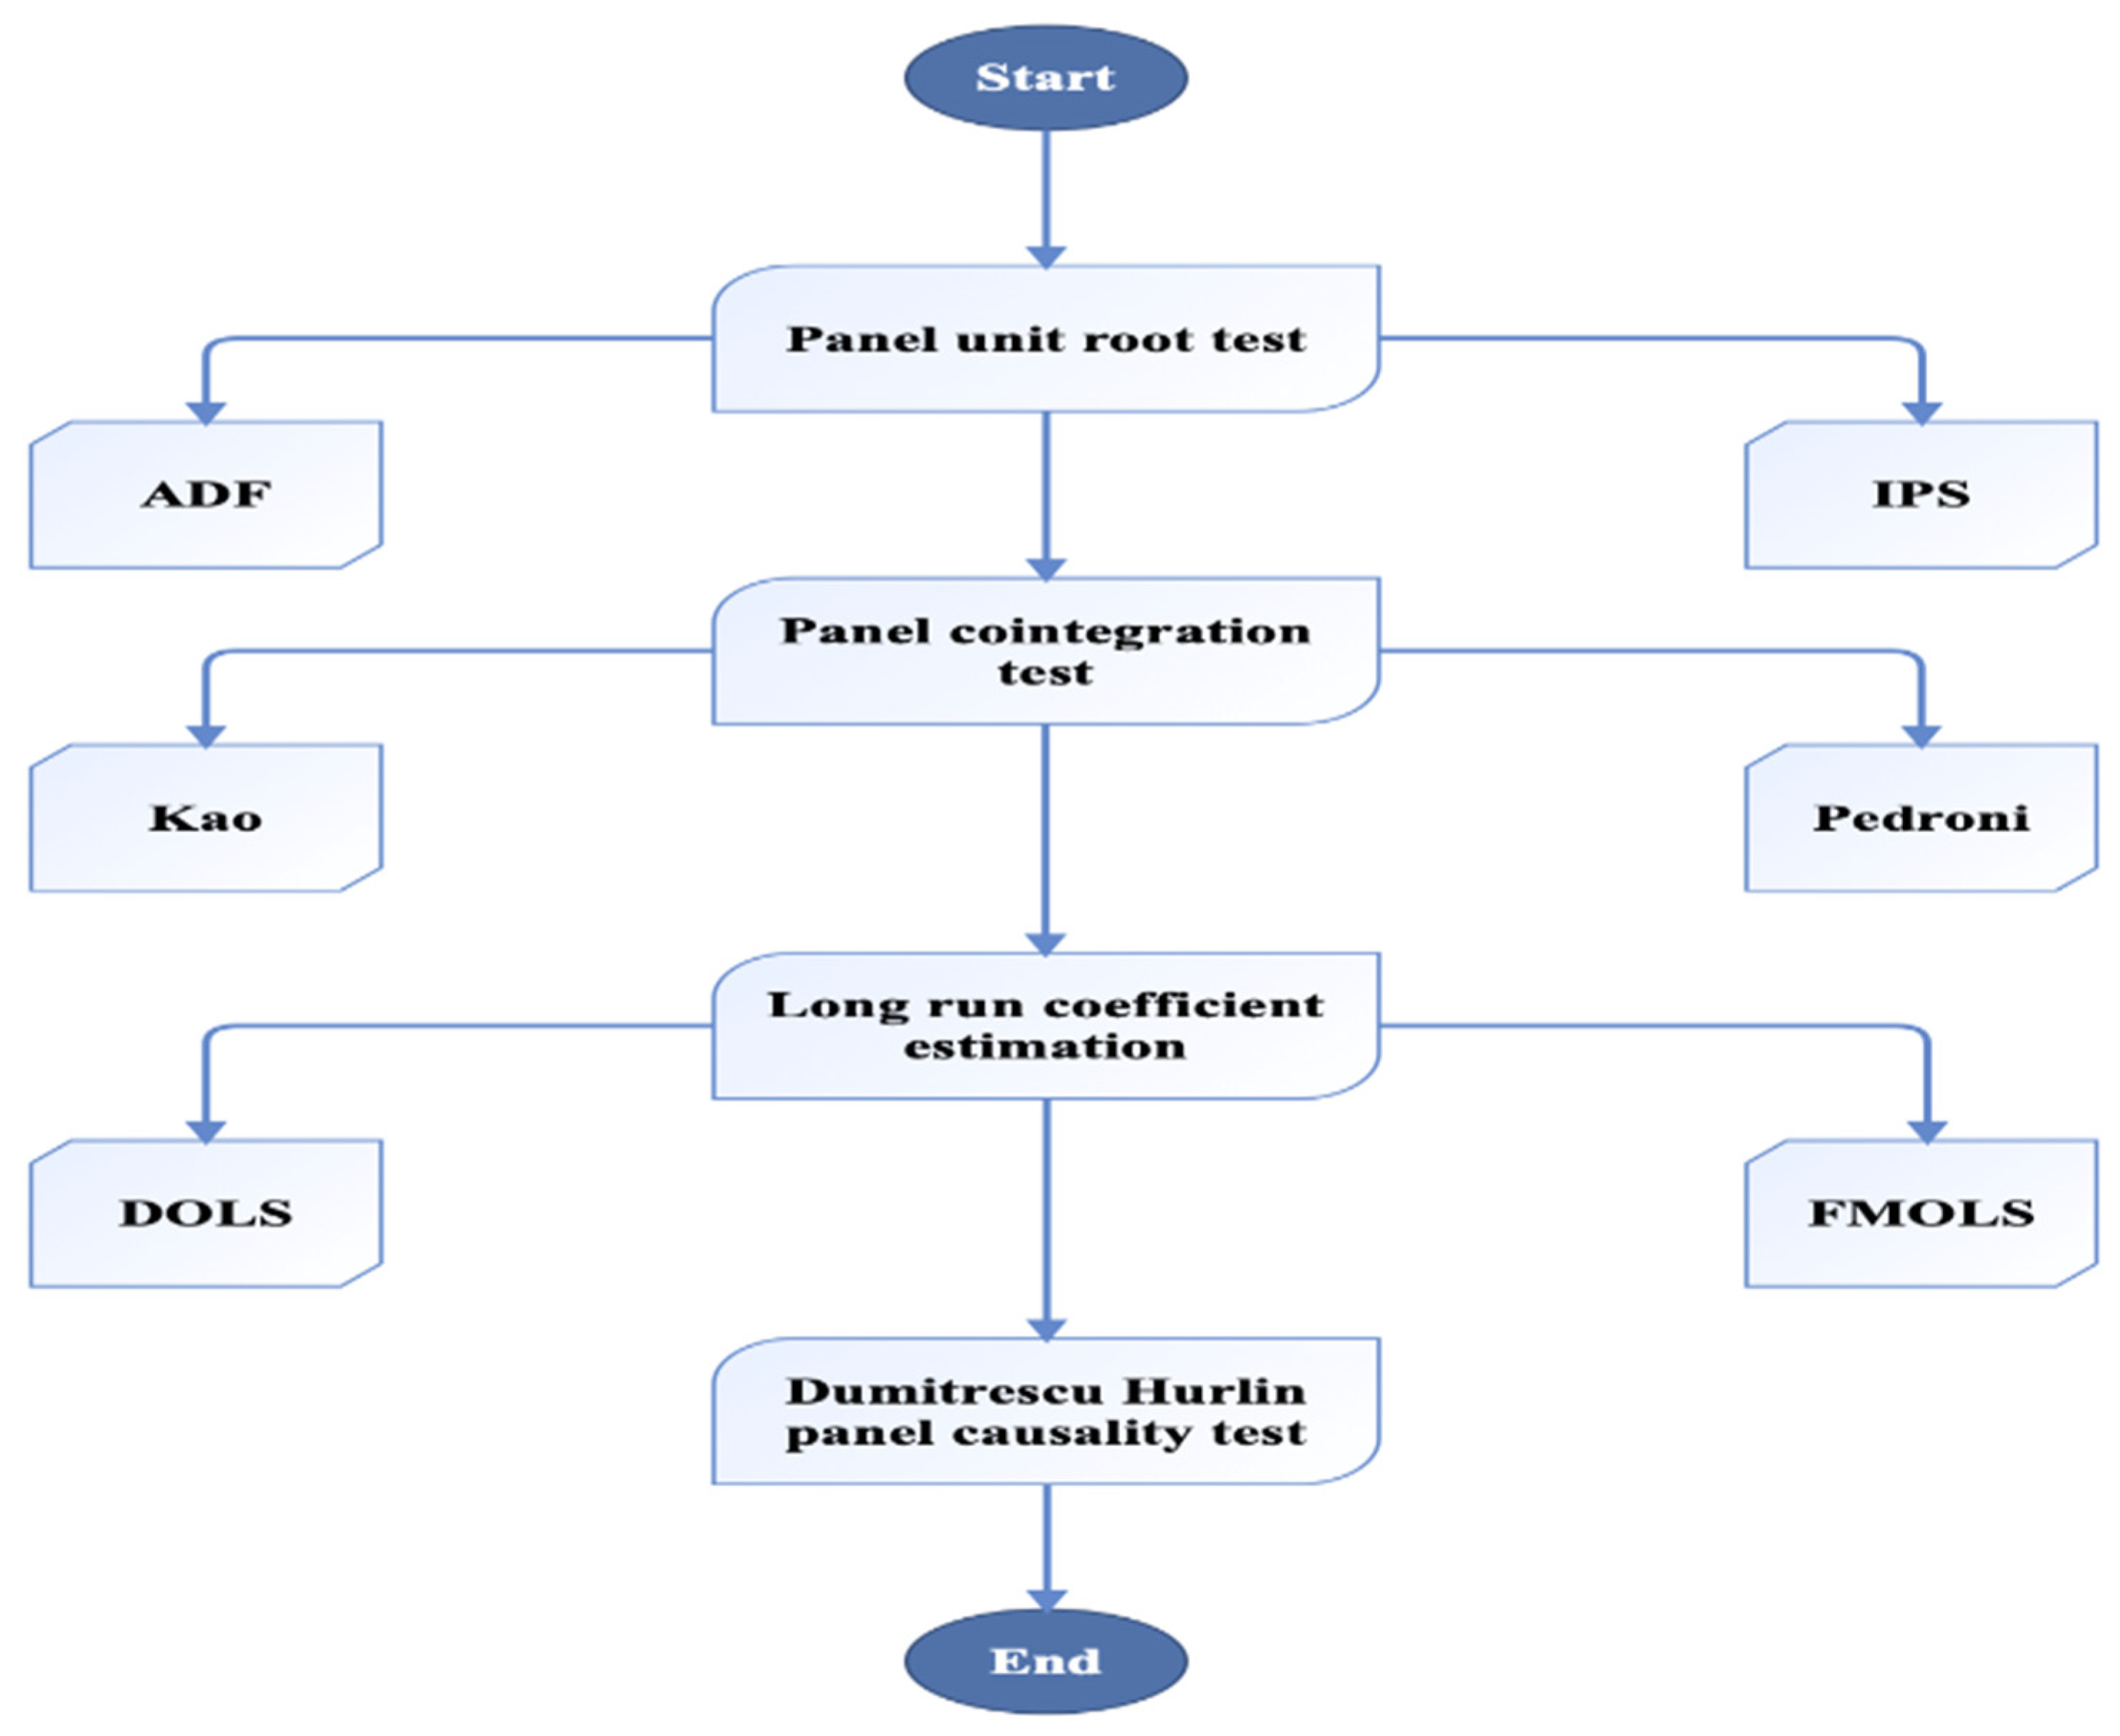
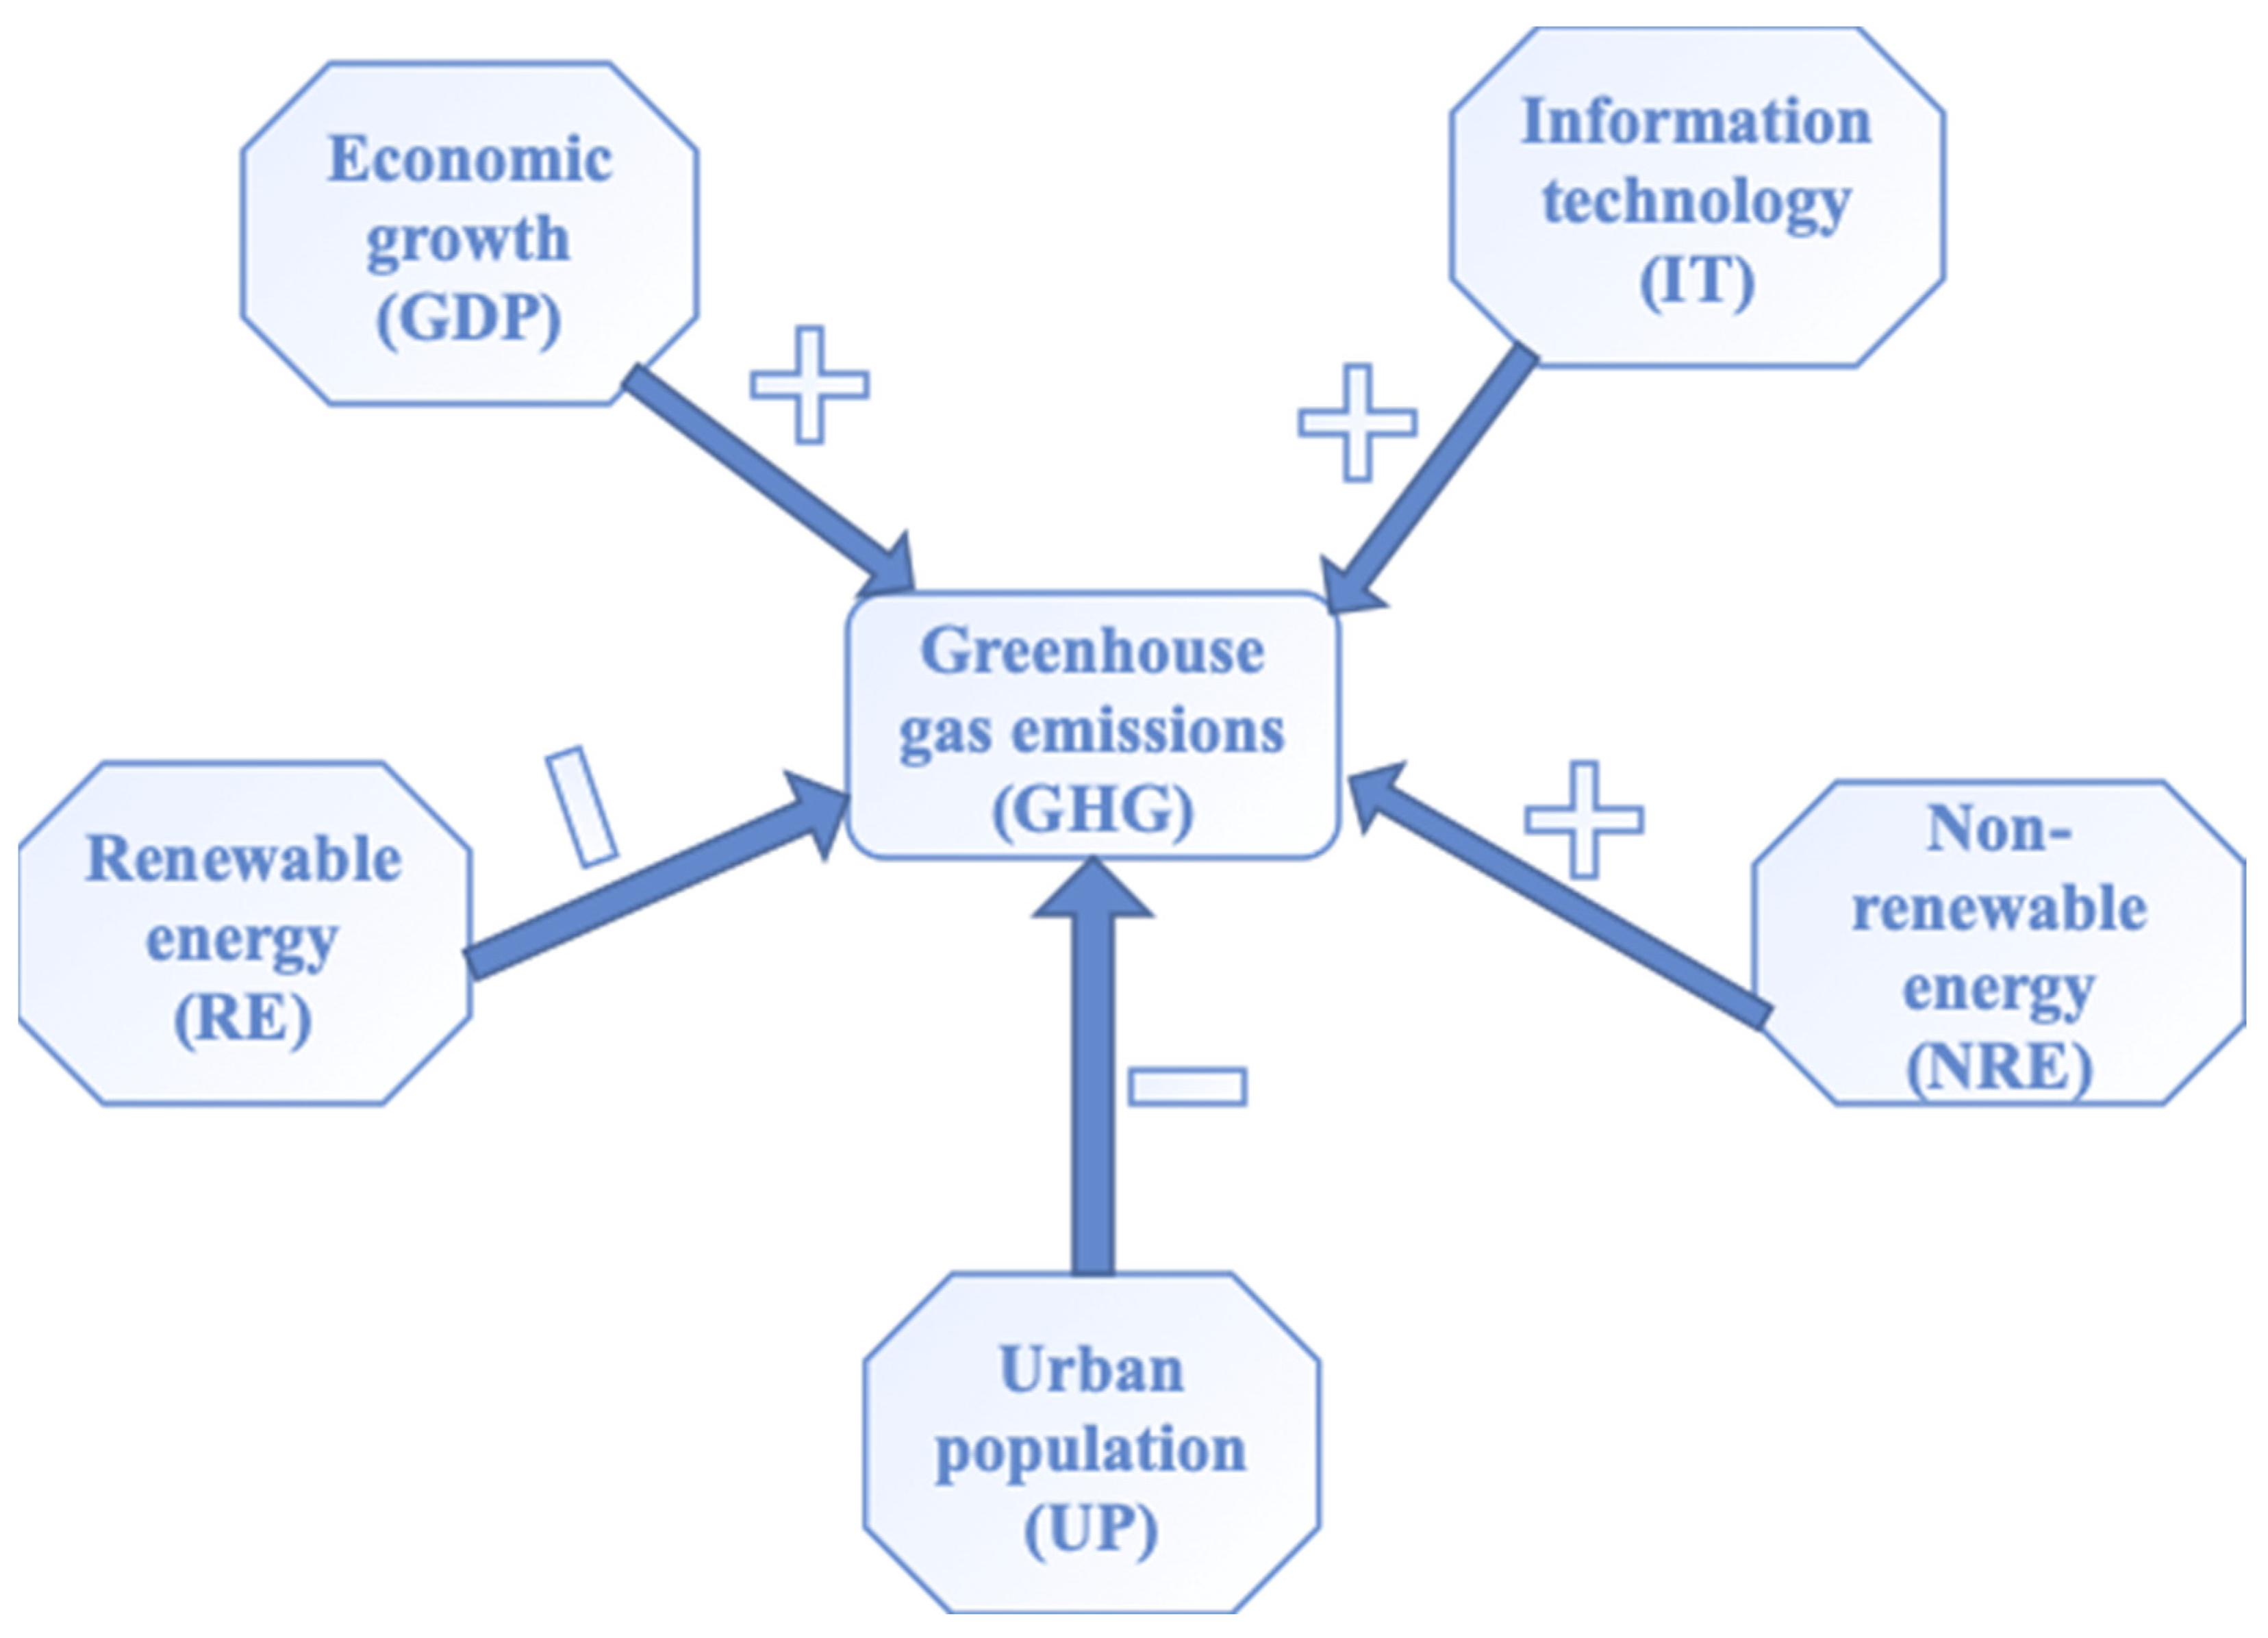
This study provides an in-depth examination into the role of energy structures on environmental pollution in Africa. Specifically, the study examines the impact of RE, NRE, and I.T. on GHG emissions using T-11 GHG-emitting countries in Africa from 1990–2020. This study further investigates the effects of economic growth and urban population on greenhouse gas emissions. To examine the impact of selected factors on GHG emissions for the T-11 GHG countries in Africa, this paper applies panel co-integration, i.e., Pedroni and Kao. Similarly, DOLS and FMOLS estimation are used to examine the long-run associations of the explanatory variables. In addition, this study adopts the D-H panel causality test to test the causal association between variables. The empirical results indicate that non-renewable energy boosts greenhouse gas emissions in T-11 GHG African countries. The finding indicates that the urban population decreases the degree of GHG emissions in the long run. Therefore, in the case of T-11 emissions countries, their urban areas tend to have higher energy consumption per capita than rural areas. The finding reveals that RE reduces the degree of GHG emissions in the long run. Again, the study found that information technology causes GHG emissions to rise in T-11 GHG-emitting African countries. Lastly, the finding shows that GDP increases GHG emissions. Based on the D-H panel causality test, the study shows bi-directional causality between GDP and GHG emissions in T-11 GHG African countries. The finding also indicates bidirectional causality between I.T. and GHG emissions, with corresponding feedback from GHG emissions to I.T. Again, a bidirectional causal link was identified between GHG emissions and RE, with related feedback from GHG emissions to RE. Finally, the study discovers a bidirectional causality between NRE and GHG emissions, with corresponding feedback from GHG emissions to NRE. Based on these findings, this study proposes the following policy implications.

5.2. Managerial Policy Implications/Recommendations

To begin with, the results indicated that non-renewable energy performs well in boosting greenhouse gas emissions in T-11 GHG African countries. The study recommends that policymakers in these countries focus on achieving a diversified energy mix and transitioning to cleaner and renewable energy sources. This may include promoting research and development of renewable energy technologies, encouraging investment in renewable energy infrastructure, and setting targets for renewable energy consumption. Governments in these countries should implement stricter regulations and enforce emission reduction targets for industries that rely heavily on non-renewable energy sources. This could include setting limits on GHG emissions and imposing penalties for non-compliance.
Again, it is recommended that policymakers in these nations seek to facilitate the transition from NRE to RE sources in a way that considers the economic impact. This may include creating job training programs for workers in non-renewable energy industries to transition to clean energy sectors and providing financial support to communities that rely heavily on non-renewable energy.
Moreover, the finding reveals that renewable energy decreases the degree of GHG emissions in the long run. Policymakers in these countries should prioritize the development of renewable energy sources by establishing supportive policies and programs. These may include incentives for investment in renewable technologies, the establishment of funds to support research and development, and the provision of financial incentives for adopting RE sources.
In addition, the study recommends that policymakers in these countries must develop and/or strengthen regulatory frameworks to support the transition to renewable energy. Governments must establish policies that incentivize a shift toward renewable energy and discourage conventional power generation. This may include setting emission limits, ensuring compliance, and rigorously enforcing renewable energy targets. Policymakers in these countries should prioritize educating the public about the benefits of renewable energy and reducing greenhouse gas emissions. Public awareness campaigns, energy-efficiency programs, and school education to promote sustainable and clean energy sources are great avenues. The need to encourage and support innovation in renewable energy technologies must be prioritized in these countries. R&D efforts should focus on improving the efficiency and effectiveness of RE sources, as highlighted in the studies of [101,102,103,104]. Green innovation can eradicate the energy crisis, which eventually affects GHG. This may include researching and promoting fuel cells, solar power generation, wind, and wave power.
Lastly, the study found that information technology increases GHG emissions in T-11 GHG-emitting African countries. Governments of these countries should foster the use of sustainable practices and policies among information technology companies by implementing programs such as recycling, refurbishing, and disposing of electronic equipment. In this quest, funding for research and development to enhance the use of green technology must be provided. This may include research into new technological solutions to reduce GHG emissions associated with information technology, such as IoT technologies that help monitor and conserve energy. This study recommends that policymakers promote international cooperation and collaboration to develop standards and policies that reduce technology-related GHG emissions.

Author Contributions

Conceptualization, X.M. and N.C.; resources, E.N.; writing—original draft preparation, N.C., E.N. and X.M.; writing—review and editing, E.N.; supervision, X.M. All authors have read and agreed to the published version of the manuscript.

Funding

This research received no external funding.

Institutional Review Board Statement

Not applicable.

Informed Consent Statement

Not applicable.

Data Availability Statement

Data will be made available upon request.

Conflicts of Interest

The authors declare no conflict of interest.

References

  1. Charfeddine, L.; Kahia, M. Do information and communication technology and renewable energy use matter for carbon dioxide emissions reduction? Evidence from the Middle East and North Africa region. J. Clean. Prod. 2021, 327, 129410. [Google Scholar] [CrossRef]
  2. Skowron, Ł.; Chygryn, O.; Gąsior, M.; Koibichuk, V.; Lyeonov, S.; Drozd, S.; Dluhopolskyi, O. Interconnection between the Dynamic of Growing Renewable Energy Production and the Level of CO2 Emissions: A Multistage Approach for Modeling. Sustainability 2023, 15, 9473. [Google Scholar] [CrossRef]
  3. Adams, S.; Nsiah, C. Reducing carbon dioxide emissions; Does renewable energy matter? Sci. Total Environ. 2019, 693, 133288. [Google Scholar] [CrossRef]
  4. Faraji Abdolmaleki, S.; Esfandiary Abdolmaleki, D.; Bello Bugallo, P.M. Finding Sustainable Countries in Renewable Energy Sector: A Case Study for an EU Energy System. Sustainability 2023, 15, 10084. [Google Scholar] [CrossRef]
  5. Nathaniel, S.P.; Iheonu, C.O. Carbon dioxide abatement in Africa: The role of renewable and nonrenewable energy consumption. Sci. Total Environ. 2019, 679, 337–345. [Google Scholar] [CrossRef]
  6. Samour, A.; Moyo, D.; Tursoy, T. Renewable energy, banking sector development, and carbon dioxide emissions nexus: A path toward sustainable development in South Africa. Renew. Energy 2022, 193, 1032–1040. [Google Scholar] [CrossRef]
  7. Wang, Y.; Zhou, F.; Wen, H. Does Environmental Decentralization Promote Renewable Energy Development? A Local Government Competition Perspective. Sustainability 2023, 15, 10829. [Google Scholar] [CrossRef]
  8. Obuobi, B.; Zhang, Y.; Nketiah, E.; Adu-Gyamfi, G.; Cudjoe, D. Renewable energy demand, financial reforms, and environmental quality in West Africa. Environ. Sci. Pollut. Res. 2022, 29, 69540–69554. [Google Scholar] [CrossRef] [PubMed]
  9. Edziah, B.K.; Sun, H.; Adom, P.K.; Wang, F.; Agyemang, A.O. The role of exogenous technological factors and renewable energy in carbon dioxide emission reduction in Sub-Saharan Africa. Renew. Energy 2022, 196, 1418–1428. [Google Scholar] [CrossRef]
  10. Kadirgama, K.; Awad, O.I.; Mohammed, M.N.; Tao, H.; Bash, A.A.H.K. Sustainable Green Energy Management: Optimizing Scheduling of Multi-Energy Systems Considered Energy Cost and Emission Using Attractive Repulsive Shuffled Frog-Leaping. Sustainability 2023, 15, 10775. [Google Scholar] [CrossRef]
  11. Charfeddine, L.; Kahia, M. Impact of renewable energy consumption and financial development on CO2 emissions and economic growth in the MENA region: A panel vector autoregressive (PVAR) analysis. Renew. Energy 2019, 139, 198–213. [Google Scholar] [CrossRef]
  12. Sun, H.; Edziah, B.K.; Sun, C.; Kporsu, A.K. Institutional quality, green innovation and energy efficiency. Energy Policy 2019, 135, 111002. [Google Scholar] [CrossRef]
  13. BCG. How Tech and Telecom Can Create a Triple Win in Green 2023. Available online: https://www.bcg.com/publications/2023/role-of-ict-in-sustainable-development-triple-green-win (accessed on 19 August 2023).
  14. Steckel, J.C.; Hilaire, J.; Jakob, M.; Edenhofer, O. Coal and carbonization in sub-Saharan Africa. Nat. Clim. Chang. 2020, 10, 83–88. [Google Scholar] [CrossRef]
  15. Statista. Africa’s Share in Global Carbon Dioxide (CO2) Emissions from 2000 to 2021. 2023. Available online: https://www.statista.com/statistics/1287508/africa-share-in-global-co2-emissions/ (accessed on 3 June 2023).
  16. Nathaniel, S.P.; Adeleye, N. Environmental preservation amidst carbon emissions, energy consumption, and urbanization in selected african countries: Implication for sustainability. J. Clean. Prod. 2021, 285, 125409. [Google Scholar] [CrossRef]
  17. Fröhlich, S. IMF World Economic Outlook Puts Ghana in the Lead 2019. Available online: https://www.dw.com/en/imf-world-economic-outlook-puts-ghana-in-the-lead/a-48356052 (accessed on 3 June 2023).
  18. Africa Briefing. 12 Fastest Growing Economies in Africa 2023. Available online: https://africabriefing.com/the-12-fastest-growing-economies-in-africa/ (accessed on 3 June 2023).
  19. Corrosive Doctors. Air Pollution in South Africa 2023. Available online: https://corrosion-doctors.org/AtmCorros/mapSA.htm (accessed on 3 June 2023).
  20. Calvin, K.; Pachauri, S.; De Cian, E.; Mouratiadou, I. The effect of African growth on future global energy, emissions, and regional development. Clim. Chang. 2016, 136, 109–125. [Google Scholar] [CrossRef]
  21. Maarof, M.A.; Ahmed, D.H.; Samour, A. Fiscal Policy, Oil Price, Foreign Direct Investment, and Renewable Energy—A Path to Sustainable Development in South Africa. Sustainability 2023, 15, 9500. [Google Scholar] [CrossRef]
  22. International Renewable Energy Agency. Africa’s Renewable Future: The Path to Sustainable Growth; International Renewable Energy Agency: Masdar City, United Arab Emirates, 2013. [Google Scholar]
  23. Dokas, I.; Panagiotidis, M.; Papadamou, S.; Spyromitros, E. The Determinants of Energy and Electricity Consumption in Developed and Developing Countries: International Evidence. Energies 2022, 15, 2558. [Google Scholar] [CrossRef]
  24. Jabarin, M.; Nour, A.; Atout, S. Impact of macroeconomic factors and political events on the market index returns at Palestine and Amman Stock Markets (2011–2017). Investig. Manag. Financ. Innov. 2019, 16, 156–167. [Google Scholar] [CrossRef]
  25. Altinoz, B.; Dogan, E. How renewable energy consumption and natural resource abundance impact environmental degradation? New findings and policy implications from quantile approach. Energy Sources Part B Econ. Plan. Policy 2021, 16, 345–356. [Google Scholar] [CrossRef]
  26. Asa’d, I.A.A.; Nour, A.; Atout, S. The Impact of Financial Performance on Firm’s Value During COVID-19 Pandemic for Companies Listed in the Palestine Exchange (2019–2020). In From the Internet of Things to the Internet of Ideas: The Role of Artificial Intelligence, Proceedings of the European, Asian, Middle Eastern, North African Conference on Management & Information Systems, Coventry, UK, 13–14 May 2022; Springer: Berlin/Heidelberg, Germany, 2023; pp. 529–551. [Google Scholar] [CrossRef]
  27. Al-Maamary, H.M.S.; Kazem, H.A.; Chaichan, M.T. The impact of oil price fluctuations on common renewable energies in GCC countries. Renew. Sustain. Energy Rev. 2017, 75, 989–1007. [Google Scholar] [CrossRef]
  28. Nour, A.; Alia, M.A.; Balout, M. The Impact of Corporate Social Responsibility Disclosure on the Financial Performance of Banks Listed on the PEX and the ASE. In Artificial Intelligence for Sustainable Finance and Sustainable Technology, Proceedings of the International Conference on Global Economic Revolutions, Manama, Bahrain, 15–16 September 2021; Springer: Berlin/Heidelberg, Germany, 2022; pp. 42–54. [Google Scholar] [CrossRef]
  29. Momani, K.M.K.; Nour, A.-N.I.; Jamaludin, N. Sustainable Universities and Green Campuses. In Global Approaches to Sustainability through Learning and Education; IGI Global: Pennsylvania, PA, USA, 2020; pp. 17–27. [Google Scholar] [CrossRef]
  30. Ren, X.; Cheng, C.; Wang, Z.; Yan, C. Spillover and dynamic effects of energy transition and economic growth on carbon dioxide emissions for the European Union: A dynamic spatial panel model. Sustain. Dev. 2021, 29, 228–242. [Google Scholar] [CrossRef]
  31. Zoundi, Z. CO2 emissions, renewable energy and the Environmental Kuznets Curve, a panel co-integration approach. Renew. Sustain. Energy Rev. 2017, 72, 1067–1075. [Google Scholar] [CrossRef]
  32. Bhattacharya, M.; Awaworyi Churchill, S.; Paramati, S.R. The dynamic impact of renewable energy and institutions on economic output and CO 2 emissions across regions. Renew. Energy 2017, 111, 157–167. [Google Scholar] [CrossRef]
  33. Inglesi-Lotz, R.; Dogan, E. The role of renewable versus nonrenewable energy to the level of CO2 emissions a panel analysis of sub- Saharan Africa’s Βig 10 electricity generators. Renew. Energy 2018, 123, 36–43. [Google Scholar] [CrossRef]
  34. Hu, H.; Xie, N.; Fang, D.; Zhang, X. The role of renewable energy consumption and commercial services trade in carbon dioxide reduction: Evidence from 25 developing countries. Appl. Energy 2018, 211, 1229–1244. [Google Scholar] [CrossRef]
  35. Bilgili, F.; Koçak, E.; Bulut, Ü. The dynamic impact of renewable energy consumption on CO2 emissions: A revisited Environmental Kuznets Curve approach. Renew. Sustain. Energy Rev. 2016, 54, 838–845. [Google Scholar] [CrossRef]
  36. Dong, K.; Hochman, G.; Zhang, Y.; Sun, R.; Li, H.; Liao, H. CO2 emissions, economic and population growth, and renewable energy: Empirical evidence across regions. Energy Econ. 2018, 75, 180–192. [Google Scholar] [CrossRef]
  37. Paramati, S.R.; Mo, D.; Gupta, R. The effects of stock market growth and renewable energy use on CO2 emissions: Evidence from G20 countries. Energy Econ. 2017, 66, 360–371. [Google Scholar] [CrossRef]
  38. Ben Jebli, M.; Ben Youssef, S. Renewable energy consumption and agriculture: Evidence for co-integration and Granger causality for Tunisian economy. Int. J. Sustain. Dev. World Ecol. 2017, 24, 149–158. [Google Scholar] [CrossRef]
  39. Bekun, F.V.; Alola, A.A.; Sarkodie, S.A. Toward a sustainable environment: Nexus between CO2 emissions, resource rent, renewable and nonrenewable energy in 16-EU countries. Sci. Total Environ. 2019, 657, 1023–1029. [Google Scholar] [CrossRef]
  40. Nguyen, K.H.; Kakinaka, M. Renewable energy consumption, carbon emissions, and development stages: Some evidence from panel co-integration analysis. Renew. Energy 2019, 132, 1049–1057. [Google Scholar] [CrossRef]
  41. Irandoust, M. The renewable energy-growth nexus with carbon emissions and technological innovation: Evidence from the Nordic countries. Ecol. Indic. 2016, 69, 118–125. [Google Scholar] [CrossRef]
  42. Zhang, B.; Wang, B.; Wang, Z. Role of renewable energy and nonrenewable energy consumption on EKC: Evidence from Pakistan. J. Clean. Prod. 2017, 156, 855–864. [Google Scholar] [CrossRef]
  43. Waheed, R.; Chang, D.; Sarwar, S.; Chen, W. Forest, agriculture, renewable energy, and CO2 emission. J. Clean. Prod. 2018, 172, 4231–4238. [Google Scholar] [CrossRef]
  44. Chen, Y.; Wang, Z.; Zhong, Z. CO2 emissions, economic growth, renewable and nonrenewable energy production and foreign trade in China. Renew. Energy 2019, 131, 208–216. [Google Scholar] [CrossRef]
  45. Bélaïd, F.; Youssef, M. Environmental degradation, renewable and nonrenewable electricity consumption, and economic growth: Assessing the evidence from Algeria. Energy Policy 2017, 102, 277–287. [Google Scholar] [CrossRef]
  46. Apergis, N.; Ben Jebli, M.; Ben Youssef, S. Does renewable energy consumption and health expenditures decrease carbon dioxide emissions? Evidence for sub-Saharan Africa countries. Renew. Energy 2018, 127, 1011–1016. [Google Scholar] [CrossRef]
  47. Ben Jebli, M.; Ben Youssef, S. The environmental Kuznets curve, economic growth, renewable and nonrenewable energy, and trade in Tunisia. Renew. Sustain. Energy Rev. 2015, 47, 173–185. [Google Scholar] [CrossRef]
  48. Ozcan, B.; Apergis, N. The impact of internet use on air pollution: Evidence from emerging countries. Environ. Sci. Pollut. Res. 2018, 25, 4174–4189. [Google Scholar] [CrossRef]
  49. Ollo-López, A.; Aramendía-Muneta, M.E. ICT impact on competitiveness, innovation and environment. Telemat. Inform. 2012, 29, 204–210. [Google Scholar] [CrossRef]
  50. Salahuddin, M.; Alam, K.; Ozturk, I. The effects of Internet usage and economic growth on CO2 emissions in OECD countries: A panel investigation. Renew. Sustain. Energy Rev. 2016, 62, 1226–1235. [Google Scholar] [CrossRef]
  51. Lee, J.W.; Brahmasrene, T. ICT, CO2 Emissions and Economic Growth: Evidence from a Panel of ASEAN. Glob. Econ. Rev. 2014, 43, 93–109. [Google Scholar] [CrossRef]
  52. Røpke, I.; Haunstrup Christensen, T.; Ole Jensen, J. Information and communication technologies—A new round of household electrification. Energy Policy 2010, 38, 1764–1773. [Google Scholar] [CrossRef]
  53. Asongu, S.A.; Le Roux, S.; Biekpe, N. Enhancing ICT for environmental sustainability in sub-Saharan Africa. Technol. Forecast. Soc. Chang. 2018, 127, 209–216. [Google Scholar] [CrossRef]
  54. Amri, F. Carbon dioxide emissions, total factor productivity, ICT, trade, financial development, and energy consumption: Testing environmental Kuznets curve hypothesis for Tunisia. Environ. Sci. Pollut. Res. 2018, 25, 33691–33701. [Google Scholar] [CrossRef]
  55. Belkhir, L.; Elmeligi, A. Assessing ICT global emissions footprint: Trends to 2040 & recommendations. J. Clean. Prod. 2018, 177, 448–463. [Google Scholar] [CrossRef]
  56. Avom, D.; Nkengfack, H.; Fotio, H.K.; Totouom, A. ICT and environmental quality in Sub-Saharan Africa: Effects and transmission channels. Technol. Forecast. Soc. Chang. 2020, 155, 120028. [Google Scholar] [CrossRef]
  57. Zhang, C.; Liu, C. The impact of ICT industry on CO2 emissions: A regional analysis in China. Renew. Sustain. Energy Rev. 2015, 44, 12–19. [Google Scholar] [CrossRef]
  58. Shahnazi, R.; Dehghan Shabani, Z. The effects of renewable energy, spatial spillover of CO2 emissions and economic freedom on CO2 emissions in the EU. Renew. Energy 2021, 169, 293–307. [Google Scholar] [CrossRef]
  59. Barış-Tüzemen, Ö.; Tüzemen, S.; Çelik, A.K. Does an N-shaped association exist between pollution and ICT in Turkey? ARDL and quantile regression approaches. Environ. Sci. Pollut. Res. 2020, 27, 20786–20799. [Google Scholar] [CrossRef]
  60. Moyer, J.D.; Hughes, B.B. ICTs: Do they contribute to increased carbon emissions? Technol. Forecast. Soc. Chang. 2012, 79, 919–931. [Google Scholar] [CrossRef]
  61. Park, Y.; Meng, F.; Baloch, M.A. The effect of ICT, financial development, growth, and trade openness on CO2 emissions: An empirical analysis. Environ. Sci. Pollut. Res. 2018, 25, 30708–30719. [Google Scholar] [CrossRef] [PubMed]
  62. Danish; Khan, N.; Baloch, M.A.; Saud, S.; Fatima, T. The effect of ICT on CO2 emissions in emerging economies: Does the level of income matters? Environ. Sci. Pollut. Res. 2018, 25, 22850–22860. [Google Scholar] [CrossRef]
  63. Añón Higón, D.; Gholami, R.; Shirazi, F. ICT and environmental sustainability: A global perspective. Telemat. Inform. 2017, 34, 85–95. [Google Scholar] [CrossRef]
  64. WDI. Word Development Indicators. 2023. Available online: https://data.worldbank.org/indicator?tab=all (accessed on 30 June 2023).
  65. Tang, C.F.; Tan, E.C. Exploring the nexus of electricity consumption, economic growth, energy prices and technology innovation in Malaysia. Appl. Energy 2013, 104, 297–305. [Google Scholar] [CrossRef]
  66. Merlin, M.L.; Chen, Y. Analysis of the factors affecting electricity consumption in DR Congo using fully modified ordinary least square (FMOLS), dynamic ordinary least square (DOLS) and canonical cointegrating regression (CCR) estimation approach. Energy 2021, 232, 121025. [Google Scholar] [CrossRef]
  67. Maddala, G.S.; Wu, S. A Comparative Study of Unit Root Tests with Panel Data and a New Simple Test. Oxf. Bull. Econ. Stat. 1999, 61, 631–652. [Google Scholar] [CrossRef]
  68. Im, K.S.; Pesaran, M.H.; Shin, Y. Testing for unit roots in heterogeneous panels. J. Econom. 2003, 115, 53–74. [Google Scholar] [CrossRef]
  69. Pedroni, P. Critical Values for Co-integration Tests in Heterogeneous Panels with Multiple Regressors. Oxf. Bull. Econ. Stat. 1999, 61, 653–670. [Google Scholar] [CrossRef]
  70. Pedroni, P. Fully Modified OLS for Heterogeneous Cointegrated Panels; Emerald Group Publishing Limited: Bingley, UK, 2000; Volume 15. [Google Scholar] [CrossRef]
  71. Hamit-Haggar, M. Greenhouse gas emissions, energy consumption and economic growth: A panel co-integration analysis from Canadian industrial sector perspective. Energy Econ. 2012, 34, 358–364. [Google Scholar] [CrossRef]
  72. Stock, J.H.; Watson, M.W. A Simple Estimator of Cointegrating Vectors in Higher Order Integrated Systems. Econometrica 1993, 61, 783. [Google Scholar] [CrossRef]
  73. Kao, C.; Chiang, M.H. On the estimation and inference of a cointegrated regression in panel data. Adv. Econom. 2000, 15, 179–222. [Google Scholar] [CrossRef]
  74. Akram, R.; Chen, F.; Khalid, F.; Ye, Z.; Majeed, M.T. Heterogeneous effects of energy efficiency and renewable energy on carbon emissions: Evidence from developing countries. J. Clean. Prod. 2020, 247, 119122. [Google Scholar] [CrossRef]
  75. Zhang, Q.; Shah, S.A.R.; Yang, L. An Appreciated Response of Disaggregated Energies Consumption towards the Sustainable Growth: A debate on G-10 Economies. Energy 2022, 254, 124377. [Google Scholar] [CrossRef]
  76. Dumitrescu, E.-I.; Hurlin, C. Testing for Granger non-causality in heterogeneous panels. Econ. Model. 2012, 29, 1450–1460. [Google Scholar] [CrossRef]
  77. Roquez-Diaz, A.; Escot, L. Relationship between trade openness and economic growth in Latin America: A causality analysis with heterogeneous panel data. Rev. Dev. Econ. 2017, 22, 658–684. [Google Scholar] [CrossRef]
  78. Pedroni, P. Panel co-integration: Asymptotic and finite sample properties of pooled time series tests with an application to the PPP hypothesis. Econom. Theory 2004, 20, 597–625. [Google Scholar] [CrossRef]
  79. Kao, C.; Chiang, M.H.; Chen, B. International R&D spillovers: An application of estimation and inference in panel co-integration. Oxf. Bull. Econ. Stat. 1999, 61, 691–709. [Google Scholar] [CrossRef]
  80. AlNemer, H.A.; Hkiri, B.; Tissaoui, K. Dynamic impact of renewable and nonrenewable energy consumption on CO2 emission and economic growth in Saudi Arabia: Fresh evidence from wavelet coherence analysis. Renew. Energy 2023, 209, 340–356. [Google Scholar] [CrossRef]
  81. Karaaslan, A.; Çamkaya, S. The relationship between CO2 emissions, economic growth, health expenditure, and renewable and nonrenewable energy consumption: Empirical evidence from Turkey. Renew. Energy 2022, 190, 457–466. [Google Scholar] [CrossRef]
  82. Vo, D.H.; Vo, L.H. International volatility transmission among income, CO2 emission, nonrenewable and renewable energy consumption: Which causes which and when? Energy Rep. 2022, 8, 10061–10071. [Google Scholar] [CrossRef]
  83. Adjei, M.; Song, H.; Cai, X.; Nketiah, E.; Obuobi, B.; Adu-Gyamfi, G. Globalization and economic complexity in the implementation of carbon neutrality in Africa’s largest economies. Sustain. Energy Technol. Assess. 2022, 52, 102347. [Google Scholar] [CrossRef]
  84. Sikder, M.; Wang, C.; Yao, X.; Huai, X.; Wu, L.; KwameYeboah, F.; Wood, J.; Zhao, Y.; Dou, X. The integrated impact of GDP growth, industrialization, energy use, and urbanization on CO2 emissions in developing countries: Evidence from the panel ARDL approach. Sci. Total Environ. 2022, 837, 155795. [Google Scholar] [CrossRef]
  85. Khan, A.; Chenggang, Y.; Xue Yi, W.; Hussain, J.; Sicen, L.; Bano, S. Examining the pollution haven, and environmental kuznets hypothesis for ecological footprints: An econometric analysis of China, India, and Pakistan. J. Asia Pac. Econ. 2020, 26, 462–482. [Google Scholar] [CrossRef]
  86. Acheampong, A.O.; Adams, S.; Boateng, E. Do globalization and renewable energy contribute to carbon emissions mitigation in Sub-Saharan Africa? Sci. Total Environ. 2019, 677, 436–446. [Google Scholar] [CrossRef]
  87. Namahoro, J.P.; Wu, Q.; Zhou, N.; Xue, S. Impact of energy intensity, renewable energy, and economic growth on CO2 emissions: Evidence from Africa across regions and income levels. Renew. Sustain. Energy Rev. 2021, 147, 111233. [Google Scholar] [CrossRef]
  88. de Souza Mendonça, A.K.; de Andrade Conradi Barni, G.; Moro, M.F.; Bornia, A.C.; Kupek, E.; Fernandes, L. Hierarchical modeling of the 50 largest economies to verify the impact of GDP, population and renewable energy generation in CO2 emissions. Sustain. Prod. Consum. 2020, 22, 58–67. [Google Scholar] [CrossRef]
  89. Lee, C.C.; Chen, M.P.; Wu, W. The role of GICT and environmental regulation in affecting ecological footprint. Environ. Sci. Pollut. Res. 2023, 30, 54770–54799. [Google Scholar] [CrossRef]
  90. Arshad, Z.; Robaina, M.; Botelho, A. The role of ICT in energy consumption and environment: An empirical investigation of Asian economies with cluster analysis. Environ. Sci. Pollut. Res. 2020, 27, 32913–32932. [Google Scholar] [CrossRef]
  91. Zubair, A.O.; Abdul Samad, A.-R.; Dankumo, A.M. Does gross domestic income, trade integration, FDI inflows, GDP, and capital reduces CO2 emissions? An empirical evidence from Nigeria. Curr. Res. Environ. Sustain. 2020, 2, 100009. [Google Scholar] [CrossRef]
  92. Mohsin, M.; Naseem, S.; Sarfraz, M.; Azam, T. Assessing the effects of fuel energy consumption, foreign direct investment and GDP on CO2 emission: New data science evidence from Europe & Central Asia. Fuel 2022, 314, 123098. [Google Scholar] [CrossRef]
  93. O’brien, R.M. A Caution Regarding Rules of Thumb for Variance Inflation Factors. Qual. Quant. 2007, 41, 673–690. [Google Scholar] [CrossRef]
  94. De Vita, G.; Trachanas, E.; Luo, Y. Revisiting the bi-directional causality between debt and growth: Evidence from linear and nonlinear tests. J. Int. Money Financ. 2018, 83, 55–74. [Google Scholar] [CrossRef]
  95. Onofrei, M.; Vatamanu, A.F.; Cigu, E. The Relationship Between Economic Growth and CO2 Emissions in E.U. Countries: A Co-integration Analysis. Front. Environ. Sci. 2022, 10, 934885. [Google Scholar] [CrossRef]
  96. Boţa-Avram, C.; Groşanu, A.; Răchişan, P.-R.; Gavriletea, M. The Bidirectional Causality between Country-Level Governance, Economic Growth and Sustainable Development: A Cross-Country Data Analysis. Sustainability 2018, 10, 502. [Google Scholar] [CrossRef]
  97. Bildirici, M.E.; Castanho, R.A.; Kayıkçı, F.; Genç, S.Y. ICT, Energy Intensity, and CO2 Emission Nexus. Energies 2022, 15, 4567. [Google Scholar] [CrossRef]
  98. Sawng, Y.W.; Kim, P.R.; Park, J.Y. ICT investment and GDP growth: Causality analysis for the case of Korea. Telecommun. Policy 2021, 45, 102157. [Google Scholar] [CrossRef]
  99. Szetela, B.; Majewska, A.; Jamroz, P.; Djalilov, B.; Salahodjaev, R. Renewable Energy and CO2 Emissions in Top Natural Resource Rents Depending Countries: The Role of Governance. Front. Energy Res. 2022, 10, 872941. [Google Scholar] [CrossRef]
  100. Jebli, M.B.; Youssef, S.B.; Ozturk, I. Testing environmental Kuznets curve hypothesis: The role of renewable and nonrenewable energy consumption and trade in OECD countries. Ecol. Indic. 2016, 60, 824–831. [Google Scholar] [CrossRef]
  101. Wen, J.; Li, L.; Zhao, X.; Jiao, C.; Li, W. How Government Size Expansion Can Affect Green Innovation—An Empirical Analysis of Data on Cross-Country Green Patent Filings. Int. J. Environ. Res. Public Health 2022, 19, 7328. [Google Scholar] [CrossRef]
  102. Ibrahim, R.L.; Ajide, K.B. Disaggregated environmental impacts of nonrenewable energy and trade openness in selected G-20 countries: The conditioning role of technological innovation. Environ. Sci. Pollut. Res. 2021, 28, 67496–67510. [Google Scholar] [CrossRef] [PubMed]
  103. Spyromitros, E. Determinants of Green Innovation: The Role of Monetary Policy and Central Bank Characteristics. Sustainability 2023, 15, 7907. [Google Scholar] [CrossRef]
  104. Wang, Q.-J.; Wang, H.-J.; Chang, C.-P. Environmental performance, green finance and green innovation: What’s the long-run relationships among variables? Energy Econ. 2022, 110, 106004. [Google Scholar] [CrossRef]
Figure 1. Trend Graph of T-11 GHG countries in Africa.
Sustainability 15 13685 g001
Figure 2. Structure of methodology.
Sustainability 15 13685 g002
Figure 3. The relationship of long-run analysis.
Sustainability 15 13685 g003
Table 1. The data source and measurement units.
VariableAbbreviationUnit of MeasurementSource
Greenhouse gas emissionsGHGkt of CO2 equivalentWDI [64]
Renewable energyRE(% of total final energy consumption)WDI [64]
Non-renewable energyNREFossil fuel energy consumption (% of total)WDI [64]
Information TechnologyITIndividuals using the Internet (% of the population)WDI [64]
Economic GrowthGDPCurrent (USD)WDI [64]
Urban populationUPUrban population (% of the total population)WDI [64]
Table 2. Descriptive statistics.
GHGGDPITNREREUP
Mean4.453610.29800.49911.87470.92441.7636
Median4.526010.40730.86781.94291.04691.7658
Maximum5.744611.61951.92491.99991.95481.9547
Minimum2.25378.0035−3.44291.1730−1.22181.5409
Std. Dev.0.86060.79621.24220.19770.68980.0965
Skewness−0.5982−0.6315−1.0389−2.2269−0.7493−0.0635
Kurtosis2.74422.99193.26516.97753.24462.0437
Jarque–Bera21.264322.666662.3374506.611232.757713.2225
Observations341341341341341341
Table 3. Panel unit root test.
IPS- W-StatADF-Fisher
Level1st DifferenceLevel1st Difference
ItemsStatisticProb. **StatisticProb. **StatisticProb.StatisticProb.
GDP0.19360.5767−6.93150.0000 ***16.27480.802089.83020.0000 ***
GHG−3.00460.0013 ***−9.41000.0000 ***50.33410.0005125.82380.0000 ***
IT−0.58890.2780−7.91660.0000 ***32.06490.0763 *105.68730.0000 ***
NRE−1.06120.1443−9.77600.0000 ***29.96760.1193133.39910.0000 ***
RE0.32460.6272−6.89750.0000 ***14.65420.876691.46630.0000 ***
UP−2.99230.0014 ***−4.64240.0000 ***64.33280.0000 ***70.26250.0000 ***
H0: series contains the unit root, and data is not stationary. Rejection of null Hypothesis at *** 1%, ** 5%, and * 10%.
Table 4. Pedroni and Kao Residual Co-integration Test.
Alternative Hypothesis: Common A.R. Coefs. (Within-Dimension)
StatisticProb.StatisticProb.
Panel v-Statistic0.03540.4859−0.63570.7375
Panel rho-Statistic−0.82040.20600.68560.7535
Panel PP-Statistic−7.26710.0000 ***−4.78230.0000 ***
Panel ADF-Statistic−7.87610.0000 ***−2.22960.0129 **
Alternative Hypothesis: individual A.R. Coefs. (Between-Dimension)
StatisticProb.
Group rho-Statistic1.55650.9402
Group PP-Statistic−6.58210.0000 ***
Group ADF-Statistic−2.04910.0202 **
Kao Residual Co-Integration Test
ADF−8.87410.0000 ***
H0: No co-integration among the variables. Note: *** 1%, and ** 5%. Reject null at 5%.
Table 5. Regression results of FMOLS and DOLS.
Panel Fully Modified Least Squares (FMOLS) Panel Dynamic Least Squares (DOLS)
VariableCoefficientProb.OutcomeCoefficientProb.Outcome
GDP0.17080.0003 ***Significance0.12940.0001 ***Significance
IT0.04590.0000 ***Significance0.04290.0000 ***Significance
NRE0.69600.0000 ***Significance0.61190.0000 ***Significance
RE−0.11450.0363 ***Significance−0.19570.0005 ***Significance
UP−0.65620.0147 **Significance−0.74620.0022 ***Significance
R-squared0.9915 0.9986
Adjusted R-squared0.9911 0.9965
Note: Standard deviations are in parenthesis. *** 1%, and ** 5%. Reject at 5%.
Table 6. VIF outcomes.
VariableVIF
LNGDP1.3801
LNIT1.0875
LNNRE2.5432
LNRE2.0496
LNUP1.3817
Table 7. Pairwise Dumitrescu–Hurlin Panel Causality Tests.
NoNull Hypothesis:W-Stat.Z-BarOutcome
1LNGDP ——> LNGHG4.07550.0086Yes
2LNGHG ——> LNGDP3.77370.0272Yes
3LNIT ——> LNGHG4.58490.0009Yes
4LNGHG ——> LNIT4.75910.0003Yes
5LNNRE ——> LNGHG8.03440.0000Yes
6LNGHG ——> LNNRE3.52260.0628Yes
7LNRE ——> LNGHG6.35180.0000Yes
8LNGHG ——> LNRE4.42590.0018Yes
9LNUP ——> LNGHG5.48180.0000Yes
10LNGHG ——> LNUP5.00820.0001Yes
11LNIT ——> LNGDP4.74350.0004Yes
12LNGDP ——> LNIT3.46740.0744Yes
13LNNRE ——> LNGDP6.07950.0000Yes
14LNGDP ——> LNNRE5.39370.0000Yes
15LNRE ——> LNGDP5.13440.0000Yes
16LNGDP ——> LNRE5.07520.0001Yes
17LNUP ——> LNGDP7.58960.0000Yes
18LNGDP ——> LNUP3.09410.2055No
19LNNRE ——> LNIT4.47820.0014Yes
20LNIT ——> LNNRE4.88330.0002Yes
21LNRE ——> LNIT5.03020.0001Yes
22LNIT ——> LNRE2.64590.5196No
23LNUP ——> LNIT9.54780.0000Yes
24LNIT ——> LNUP3.02240.2434No
25LNRE ——> LNNRE3.86570.0195Yes
26LNNRE ——> LNRE3.13140.1876No
27LNUP ——> LNNRE5.03290.0001Yes
28LNNRE ——> LNUP5.61350.0000Yes
29LNUP ——> LNRE3.89150.0177Yes
30LNRE ——> LNUP7.71290.0000Yes
Disclaimer/Publisher’s Note: The statements, opinions and data contained in all publications are solely those of the individual author(s) and contributor(s) and not of MDPI and/or the editor(s). MDPI and/or the editor(s) disclaim responsibility for any injury to people or property resulting from any ideas, methods, instructions or products referred to in the content.

