Article

How Do Global Uncertainties Spillovers Affect Leading Renewable Energy Indices? Evidence from the Network Connectedness Approach

1
Department of Finance, College of Business Administration, King Saud University, P.O. Box 71115, Riyadh 11587, Saudi Arabia
2
College of Business Administration, Al Yamamah University, Riyadh 11587, Saudi Arabia
3
Department of Business Administration, Sukkur IBA University, Sukkur 65200, Pakistan
4
Health Administration Department, College of Business Administration, King Saud University, P.O. Box 71115, Riyadh 11587, Saudi Arabia
5
Faculty of Management and Economics, Ruhr University Bochum (RUB), 44801 Bochum, Germany
*
Author to whom correspondence should be addressed.
Sustainability 2023, 15(18), 13630; https://doi.org/10.3390/su151813630
Submission received: 30 June 2023 / Revised: 31 August 2023 / Accepted: 5 September 2023 / Published: 12 September 2023
(This article belongs to the Special Issue Renewable and Sustainable Energy in Post COVID-19 Economic Recovery)

Abstract

:
By using data from 2018 to 2022 and employing quantile VAR time-frequency and quantile VAR spillover models, this study investigates the spillover connectedness between global uncertainties, namely, geopolitical risk, economic policy uncertainty, and climate policy uncertainty, and seven leading global renewable energy indices. The results show strong total connectedness (82.87%) between renewable energy and uncertainty indices. DJRE, R&CE, MSCIEE, WRE_cpu, GEPU_C, and GEPU_P are found to be net receivers, and WRE to be net transmitters of spillovers. Additionally, the MSCIEE sector is the least connected, i.e., 2.51%, followed by the R&CE sector at 4.55%, while the ERE sector is the most connected one, i.e., 65.8%. We discover that the two market-based uncertainties have less impact than economic policy uncertainty (EPU), which has a significant impact. The conclusions have ramifications for decision-makers and investors in the renewable energy markets from the standpoint of sustainable development. The study reveals diversification avenues and recommends that investors consider MSCIEE and R&CE sectors for parking their funds because of lower risk, i.e., less connectivity and greater diversification.

1. Introduction

Taking advantage of low-carbon and renewable energy sources, the utilization systems, like wind and solar, is rising, while the deployment of fossil-based systems, like oil, gas, and coal, is waning. This shift can be seen in the global energy sector. Renewable energy originates from an endless supply of natural resources that can be renewed to compensate for any spent resources. Sunlight, wind, ocean, hydropower, and geothermal energy are some forms of renewable energy. Low generation costs, supporting policies and rules, technology breakthroughs, and environmental concerns all contribute to the growth of renewable energy.
The production of renewable energy, which makes up most of the energy supply, can optimize energy consumption and improve the environment, as [1] demonstrated. As a result, adopting renewable energy becomes the primary pathway toward the transition to a minimal carbon-based economy in both middle-income and high-income nations. As a result, in the past 10 years, much emphasis has been paid to the need for widespread renewable energy use [2,3]. International Renewable Energy Agency (2020) estimates that, by 2050, two-thirds of the world’s energy needs ought to be covered by renewable energy sources. According to a survey of OECD nations, over the last ten years, renewable energy consumption has climbed from 13.33% to 18.86%, and it is anticipated that, by 2040, it will make up more than half of all energy investments made globally [4]. The World Energy Outlook estimates that, by 2040, renewable energy sources will make up more than 20% and probably close to 30% of total energy consumption. The report also concludes that a system for generating sustainable renewable energy is possible in principle by the latter part of the century. The common consensus is that renewable energy is crucial for the economy and the environment. Renewable energy lessens reliance on exhaustible energy sources like coal, gas, and oil.
Additionally, it enhances energy security and stability, two crucial issues today. It fosters employment possibilities and economic growth (EG) [5,6]. Renewable energy is the best option to increase EG without deteriorating the environment. Therefore, improving the consumption of renewable energy (REN) is an international priority. The recent rapid growth of renewable energy sources has propelled the sector to the status of one of the most promising corporations, attracting an increasing number of investments.
Switching aims to assure energy security, reliability, access, affordability, and sustainability in addition to lessening the energy sector’s environmental impact. The scientific literature is currently highly engaged in addressing what markets, governments, corporations, and consumers may contribute to a more rapid change and a decarbonized society. Scholarly opinions in the literature acknowledge that renewable energy sources significantly reduce carbon emissions and boost energy use efficiency [7,8]. Economic, social, political, and regulatory issues are at the center of the significance of the energy transition to the environment [9,10].
Most governments altered their energy and expansionary economic policies after the COVID-19 epidemic emerged recently, creating uncertainty for businesses that utilize renewable energy sources [11,12]. Thus, more inquiries are required to comprehend how global uncertainties affect the advancement of renewable energy sources. The uncertainty index has been noticed to have a significant predictive impact on the turbulence of the markets for conventional energy sources and sustainable energy sources [13,14]. However, ref. [4] assert that different uncertainty indices have distinct effects on the market for renewable energy. This study offers proof of the impact of selected uncertainty indexes as a net transmitter of volatility for environmentally friendly energy assets during crisis periods like the global financial crisis. They claim that uncertainty indexes have a sizable degree of forecasting ability for clean and renewable energy indexes [15,16]
Consequently, accurate energy forecasting is essential for risk management, especially for the market for renewable energy and economic strategy. Therefore, understanding how global uncertainties affect the advancement of renewable energy can assist policymakers in creating effective development and investment plans for the renewable energy industries, as well as better allocation strategies. It can also help renewable energy companies better design their production and procurement. Advancing the shift to a greener industry will also help investors and asset managers create more effective portfolio and risk mitigation approaches. The empirical findings may be helpful for present and potential investors in new energy businesses. This research may appeal to investors who want to transform their portfolios by owning renewable energy assets as their worries about environmental sustainability grow. As a result, eco-friendly investors who must balance the risk in their portfolios should pay particular attention to our investigation. Thus, the study’s findings assist these investors in identifying potential risks associated with renewable energy portfolios and achieving greater return adjustments for risk.
The relationship between uncertainty and renewable energy indices has generally gained rising study interest. Although relatively little research contrasts the variations between different uncertainty measurements, several studies separately evaluate the effects of other forms of uncertainty (e.g., GPR, EMV, and EPU) on the renewable energy markets. Economic, financial, and geopolitical uncertainty indicators are considered by [17,18,19] for their distinct effects on the energy market. Sufficient research has yet to be carried out on the diverse uncertainties and their effect on the renewable energy market. Finding out what causes the market panic in the renewable energy market is critical because high fear and volatility negatively affect renewable energy trading, portfolio allocation, risk management, and negative economic and financial implications. This study looks at how the fear of the renewable energy market changes over time in response to several uncertainty metrics, namely geopolitical risk, economic policy uncertainty, and uncertainty surrounding climate change policy. More crucially, more research on the abovementioned theme needs to be done.
The three objectives of this paper are as follows. (i) This research investigates how the connectedness of clean energy markets changes over time to several forms of uncertainty measurements, namely, geopolitical risk, economic policy uncertainty, and ambiguity surrounding climate policy uncertainty. We utilized methodological estimations based on quantile connectedness. (ii) To examine the connection of the tail distribution employing quantile connectedness during extreme market circumstances. (iii) To investigate the effects of financial and economic shocks like the COVID-19 epidemic and the Russia-Ukrainian War of 2022 on the connectedness among the covered variables.
This study makes the following contributions to the extant literature. We first set up an expanded structure incorporating leading renewable energy indices and various global uncertainties, namely, climate risk, economic policy risk, and geopolitical risk, and organizing the estimation of their interactions. Second, we employ a new econometric estimate method for quantile connectedness to observe the influences of CPU, GPR, and EPU on renewable energy markets.
The empirical results show a strong connectedness (82.87%) between renewable energy and global uncertainty indices. Furthermore, DJRE R&CE MSCIEE, CPU, GPR, GEPU_C, and GEPU_P indices are found to be the largest directional connectedness receiver of spillovers and simply swayed by external influences (−40.37, −4.55, −2.51, −35.04, −40.05, −11.85, and −12.24, respectively). In contrast, ERE, MSCIR&EE, MSCIGAE, and WRE indices are found to be net transmitters of spillovers (65.8, 28.72, 45.22, and 6.86, respectively). Our findings also indicate that the most significant influence is from economic policy uncertainty (GEPU_C, GEPU_P) on the renewable energy sectors. This corroborates with the findings of [20], who report that economic policy uncertainty (EPU) has detrimental consequences on risk, the economy, and economic growth, all of which have an immediate impact on the use of energy, whereas the factor with the least influence is climate policy uncertainty, as supported by the study of [21]. Additionally, the MSCIEE sector is the least connected, i.e., 2.51%, followed by the R&CE sector at 4.55%, while the ERE sector is the most connected at 65.8%.
The remainder of the paper is structured as follows. Section 2 of this research presents the current literature. Section 3 discusses the empirical model and data sources. Section 4 presents the empirical findings. The final portion contains the conclusion and its consequences.

2. Literature Review

A set of notable studies highlighting the features of renewable stocks are presented. Ref. [22] conducts a volatility analysis among crude oil costs and the share prices of technology and green energy companies using a multivariate GARCH models approach. The study asserts that the prices of green energy stocks are sensitive to technological stock changes. In order to investigate the relationship and causation between the prices of renewable energy stock and those of crude oil, ref. [23] employ nonlinear Granger causality and wavelet functions. The study concludes that, while there is a relationship over the long term, it is not robust in the short term between these assets.
Additionally, it is demonstrated that the price of crude oil had nonlinear effects on stock prices for renewable energy at multiple periods. Ref. [24] explore time and frequency dynamics using US data on stock prices for renewable energy sources, oil prices, and other leading financial indicators. Impulse response analysis is employed. The fundamental findings of the study reveal that their volatilities and returns are strongly related over the short term. Additionally, the study reveals that the success of renewable energy companies, both in the short and long term, is unaffected by the price of oil. In a similar study, ref. [25] investigate the spillovers between the fossil fuel and renewable energy markets regarding these markets’ returns and volatilities. The study shows a strong correlation between the stock values of conventional energy companies and those of renewable energy companies. Ref. [15] offer proof of the impact of uncertainty indexes as a net transmitter of volatility for green investments during crises like the global financial crisis. However, the number of studies that are now provided still needs to be more extensive. Additionally, ref. [26] suggest that country responses to risks to energy security may vary among groupings of countries based on their level of wealth. The subject matter in the current literature is examined under three categories of global uncertainties based on the focus of this study, including the impact of geopolitical risk (GPR), climate policy uncertainty, and economic policy uncertainty on leading renewable energy indices.
The first set of research explores how geopolitical risk (GPR) affects renewable energy. In this respect, several investigations have linked changes in energy dynamics with the geopolitical risk index (GPR). The GPR index, created by [27], offers the possibility to look beyond how specific events affect markets and the economy. By accommodating variations in the level of geopolitical risk, the GPR index improves the reach of the research, enabling more accurate findings and a better comprehension of the results obtained [27]. The GPR’s impact on energy and metal prices has received much attention recently. Studies have examined the effects of geopolitical risk on the dynamics of stock markets generally and environmentally friendly energy equities [18,28].
In order to advance knowledge, Ref. [29] argues that it is critical to investigate the relationship between geopolitical risks and renewable energy. In recent years, these two criteria have evolved tremendously. Geopolitical dangers, as identified by [27], are linked to military conflicts, terrorism, and conflicts between states, all of which have an impact on international relations. Refs. [8,26] reveal that geopolitical risk can worsen countries’ energy insecurity, prompting governments and economic actors to redesign their energy mix in favor of a more productive and balanced framework. Additionally, ref. [30] demonstrate that geopolitical risks favor renewable energy, demonstrating that greater geopolitical risks stimulate and spread the use of renewable energy. Increased renewable energy is a beneficial instrument that can lessen the associated risks but also affects the geopolitical risks. Geopolitical risks, namely in the short term in Russia, have a favorable impact on the energy shift, as demonstrated by [31]. Ref. [32] also examine the stock markets for renewable energy and the accompanying geopolitical risks and confirm the considerable spillovers from geopolitical risk to renewable energy equities. Geopolitical risks are escalating due to the rapid expansion of renewable energy, and this stage is largely concerned with potential changes to the standing of individual nations within the international system. In this aspect, it is seen that the power balance to renewable energy is viewed as being more complex than traditional energy [33]. From a different geopolitical vantage point, ref. [34] discover that geopolitical risks resulting from conflict and coordination between various sovereign nations can have a major impact on the sustainability of renewable energy. Despite its potential influence on investment choices and the performance of financial assets, the GPR index needs to be properly utilized by academics and financial analysts in the renewable energy field, and the connection between multiple renewable energy indices and the GPR index has received little attention.
The second line of research examines how uncertainty in economic policy affects renewable energy. As [35] defined, EPU represents the uncertainty level in economic policies, such as monetary, regulatory, and fiscal policy. Previous research has observed that economic policy uncertainty causes unstable expectations among economic entities, affecting economic performance over various factors [36,37]. According to [38], environmentally friendly energy assets are not exempt from this dynamic, and financial market volatility (such as the VIX and EPU) can impact the price of environmentally friendly energy assets. Using an autoregressive model from 2003 to 2020, ref. [16] verify this connection. They claim that EPU has a sizable degree of forecasting ability for clean energy indexes. Renewable energy, non-renewable energy, and energy efficiency measures could be jeopardized in such a setting of lax laws and weak regulations [39]. Economic policy uncertainty (EPU) has detrimental consequences on risk, the economy, and economic growth, which immediately impact energy use [20]. Ref. [40] reveal that EPU is the main transmitter of shocks to crude oil prices through the weekly data from 1997 to 2013. Ref. [41], in a more recent investigation, looks into the effects of policy uncertainty on expanding renewable energy in twenty distinct countries. The empirical estimate found no correlation between the expansion of renewable energy sources and policy uncertainty.
A separate body of literature addresses the impact of EPU on renewable energy consumption [42,43]. In particular, EPU will likely delay renewable energy expenditures or discard projects in the sector, reducing renewable energy consumption. Furthermore, EPU hurts future revenue expectations and deters businesses from taking on greater risks [44,45]. This may cause a decrease in the use of sources of renewable energy. EPU tends to discourage using renewable energy [46]. Ref. [47] highlight that both short- and long-term renewable energy consumption is decreased by the unpredictable nature of monetary policy.
However, certain evidence indicates that EPU encourages investments in the renewable energy sector. In this regard, ref. [48] discovered that EPU could increase investments in renewable energy businesses. Even though there is much discussion about employing renewable energy, the impact of EPU on renewable energy development needs more attention. In addition, it is vital to investigate the relationship between EPU on renewable energy for economies with varied economic development stages, given its crucial role in using renewable energy.
The third line of research examines how uncertainty in climate policy affects renewable energy. Over the past few years, growing concerns about climate change have significantly increased the need for renewable energy sources. The study shows that funding in this industry will increase by nearly USD 4.1 trillion between 2026 and 2030 to attain climate neutrality. Irrespective of their current state of development, all economies have been influenced by climate change.
Increasing sea levels, severe weather, and altered weather patterns are all signs of climate change [21,49,50]. However, a major concern for many lawmakers, governments, experts, and other participants has been dealing with such a massive task in recent years. With the global rollout of carbon neutrality initiatives in recent years, the impact of climate on the market for renewable energy has been more evident. There is much concern about climate uncertainty worldwide, increasing study interest. As an illustration, ref. [51] explain the idea of climate risk and review some pertinent research.
Climate change is one of the most contentious socioeconomic topics right now [52]. Additional motivation to put the required regulations into place to reduce greenhouse gas emissions comes from the Paris Agreement, held in 2015. Considerations over deploying renewable energy sources and advancing energy-efficient technology may be delayed or altered due to the high uncertainty around climate policies. Climate policy uncertainty will lead to an unstable economy, increasing fear and volatility in the renewable energy market, if policies are unclear and inconsistent in the face of extreme weather events and the shift to a low-carbon economy.
Institutional investors have viewed climate risk as having an enormous effect on asset allocation [53]. Ref. [54] utilize the TVP-SVAR model to investigate how CPU affects REN. The investigation indicates that, while CPU reduces renewable energy in the intermediate term, it enhances renewable energy in both the short and long haul. Ref. [21] use the ARDL model to investigate how CPU influences renewable energy. The study’s findings reveal that the CPU has no short- or long-term impact on renewable energy. According to [53], institutional investors consider climate risk a central determinant affecting the companies in their portfolios. According to [55], CPU performance has a noticeable impact on green equities’ performance compared to brown stocks. Renewable energy is becoming more important in climate policy [56]. Changing the energy framework and using more renewable energy will result from changes in climate policy [57].
Investigating the CPU–renewable energy nexus is essential in determining the overall effect of CPU on renewable energy. The necessity of looking into the CPU–renewable energy relationship may be centered on the idea that, during the 26th UN Conference on Climate (COP26), the member countries’ primary goals were to accelerate renewable energy and investigate the components essential for the energy transition process. Meanwhile, the primary element that impacts renewable energy might be the uncertainty about CPU. Investigating the connection between CPU and renewable energy will thus undoubtedly help in achieving COP26 objectives. Ref. [58] examine the return and volatility of renewable energy pricing in the US. Their empirical findings show that geopolitical uncertainty substantially affects renewable energy prices in the long and short term. Ref. [59] demonstrates that geopolitical unpredictability has a considerable and advantageous effect on producing renewable energy in 10 net crude oil importing economies. Following [60], the realized volatility of renewable energy can be accurately predicted using the uncertainty index. In light of the prior research, we aim to determine how climate policy uncertainty impacts market volatility for renewable energy sources.
Few studies are looking at how uncertainties relate to renewable energy. Much study has yet to be carried out on how international uncertainties affect global economic investments in renewable energy.
None of the preceding studies considered the essential global uncertainties, namely, climate policy uncertainty, geopolitical risk, and economic policy uncertainty, in a single study. A thorough understanding of how global uncertainties affect the renewable energy asset class might help create suitable hedging tactics to manage risk because the size of these reactions may differ throughout the different renewable energy indexes. Therefore, the insights in our empirical findings may offer novel insights into how global uncertainties risk precisely predict the volatility of these assets. Hence, this research will provide important insights into the current literature gap regarding how global uncertainties influence renewable energy indices.

3. Methodology

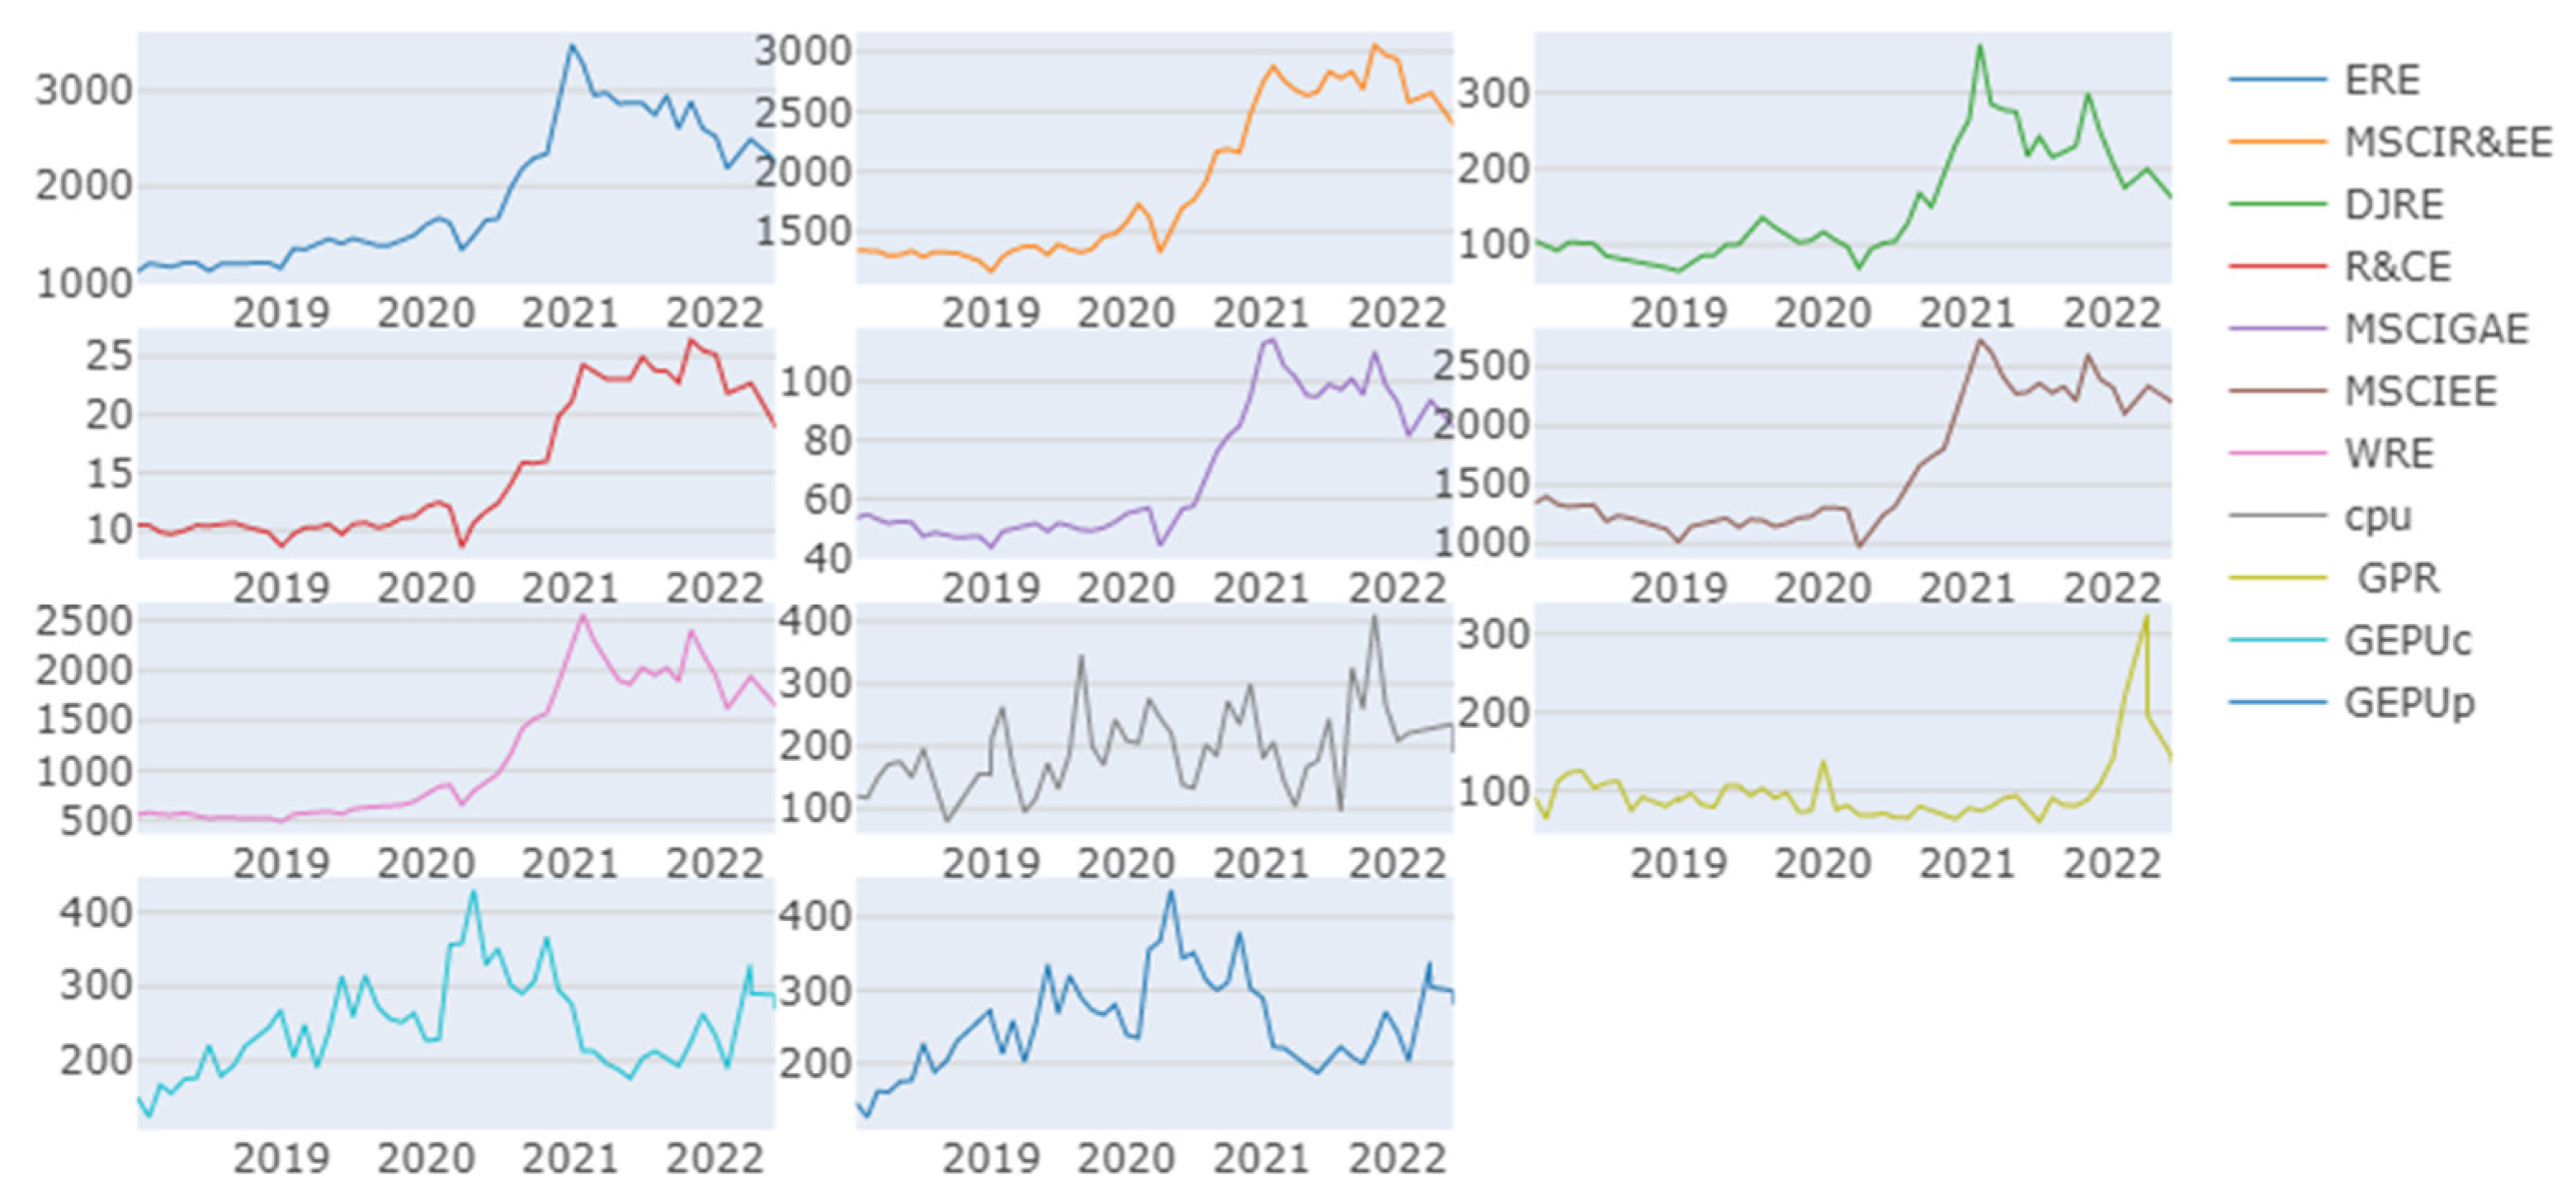
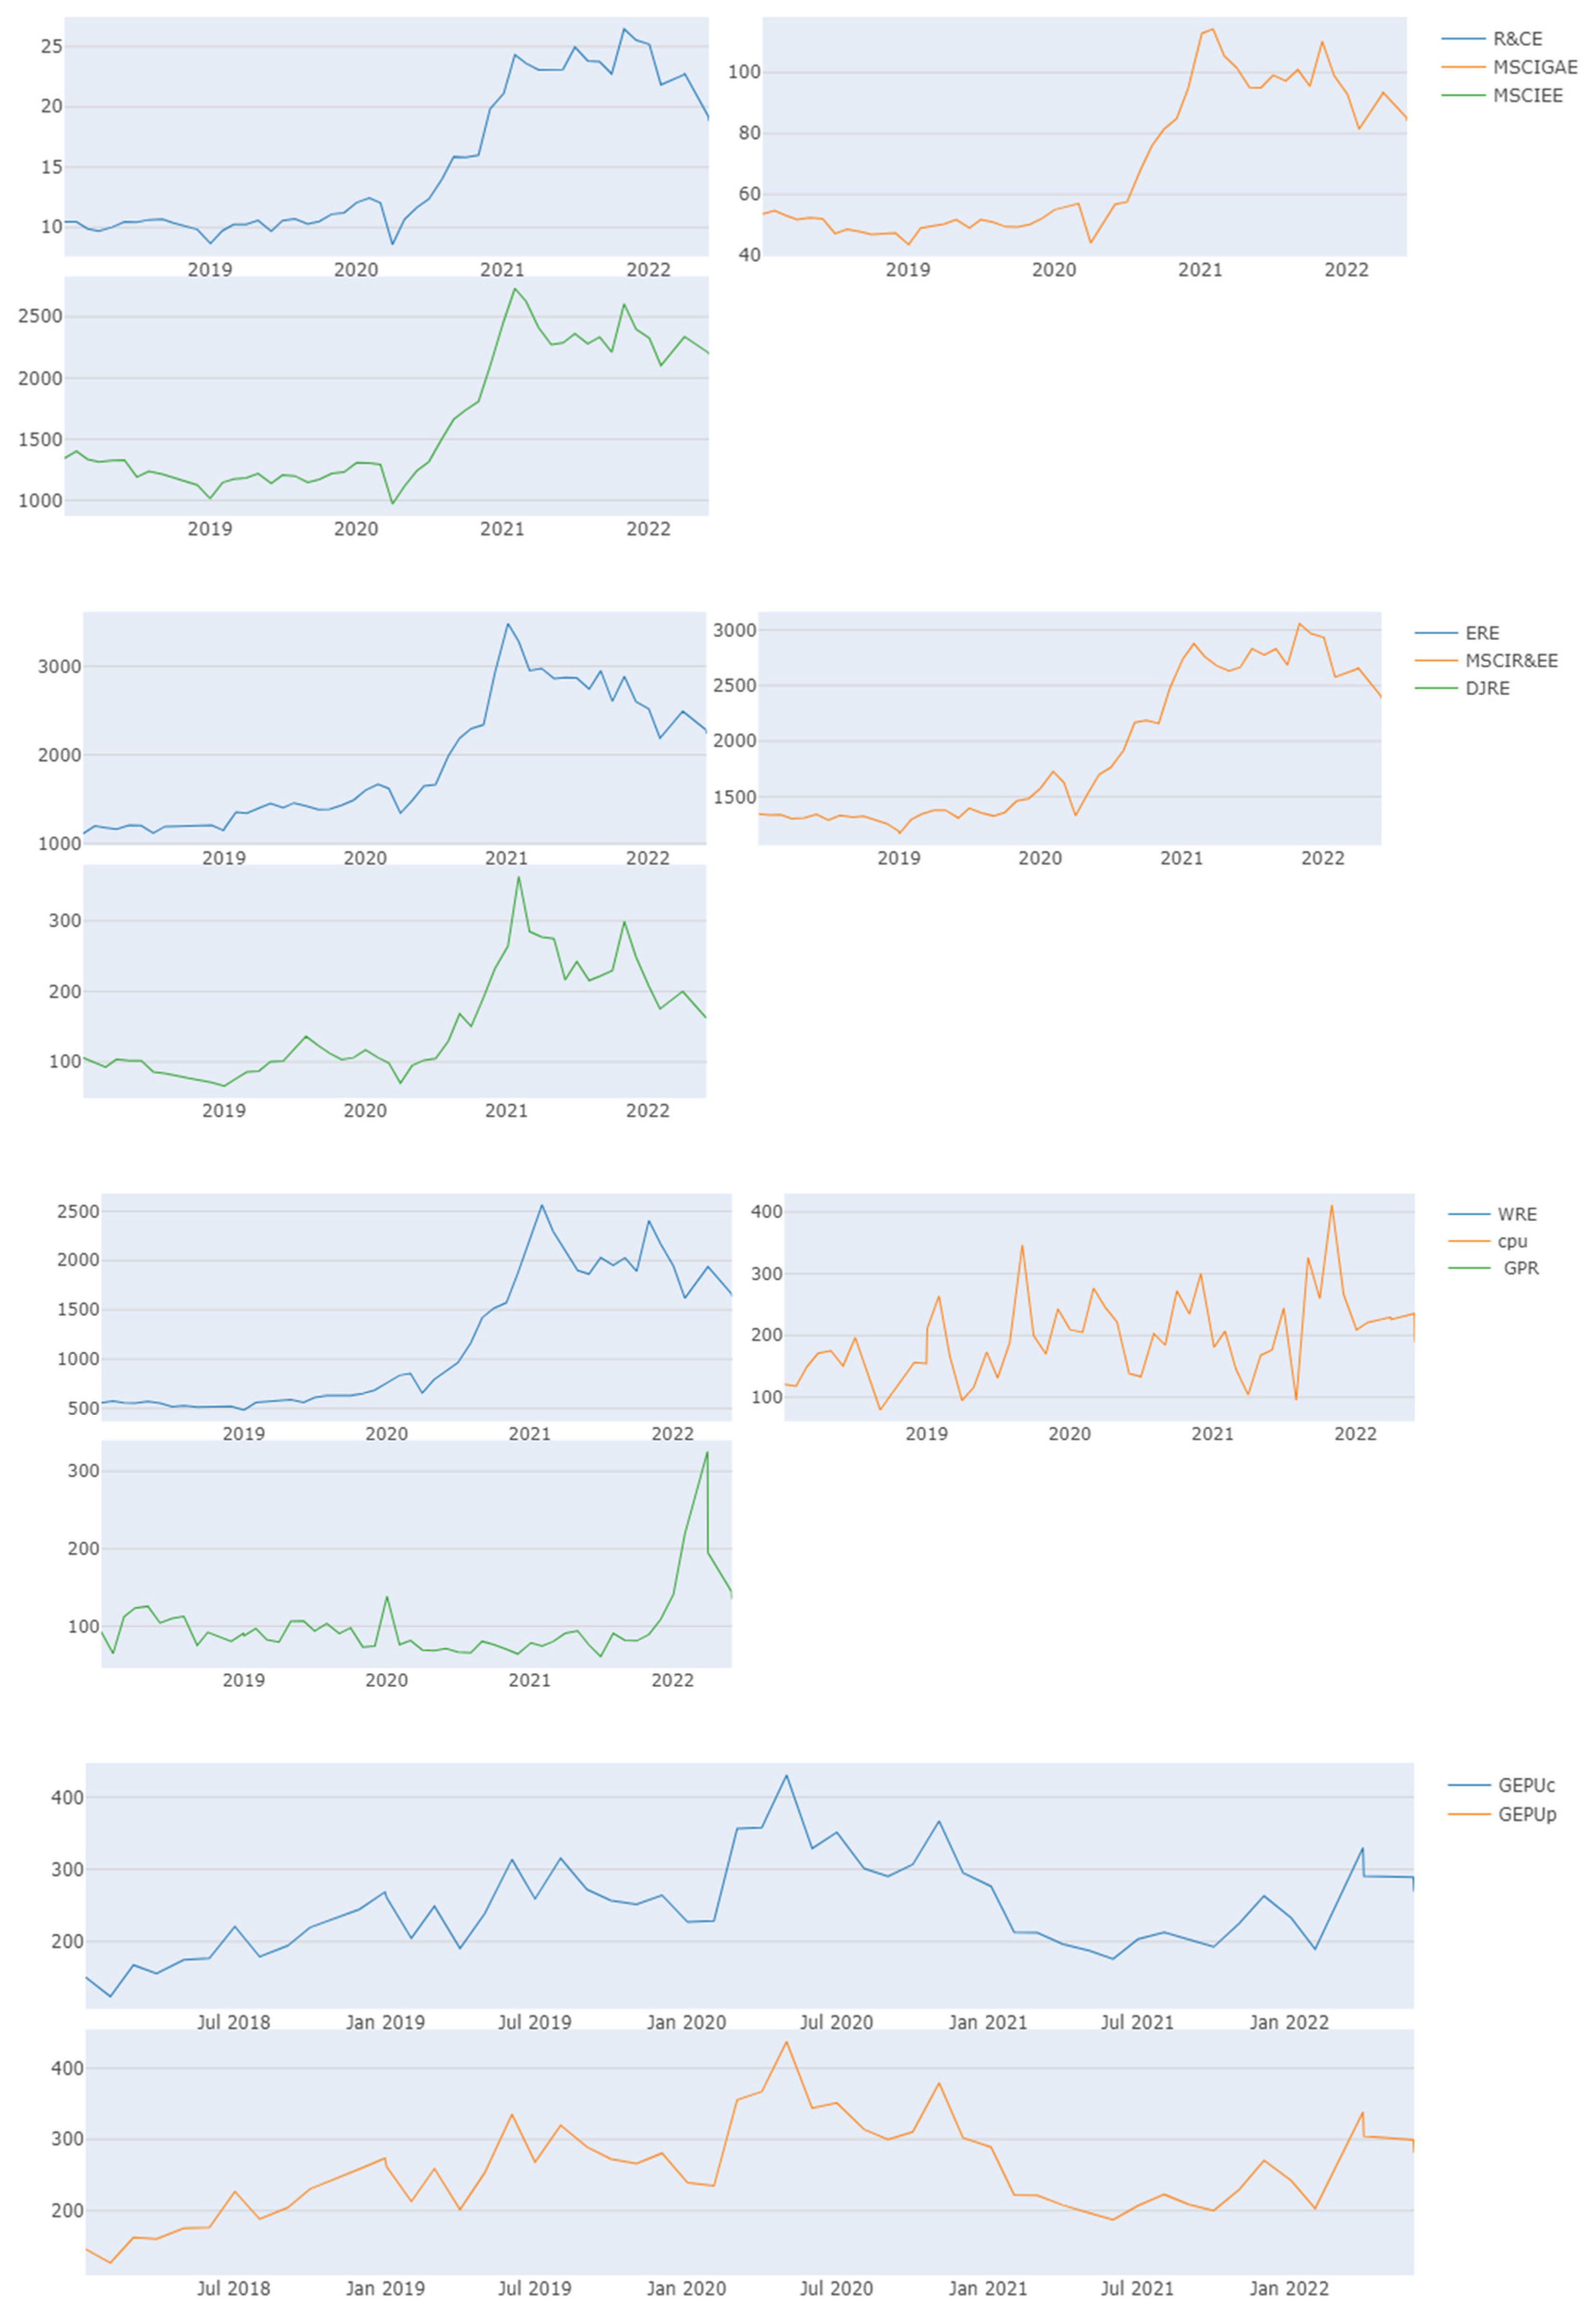
3.1. Data Description

This research examines the implications of Economic Policy Uncertainty (EPU), Geopolitical Risk (GPR), and Climate Policy Uncertainty (CPU) on the seven leading global Renewable Energy Indexes. These are, namely, the European Renewable Energy Index, MSCI ACWI IMI Renewables & Energy Efficiency Index, Dow Jones US Renewable Energy Index, Renewables & Clean Energy Index, MSCI Global Alternative Energy Index, MSCI ACWI IMI Efficient Energy Index, and World Renewable Energy. The Bloomberg terminal was used to download the dataset. This study assesses the connection between global uncertainties, namely, economic policy uncertainty, climate policy uncertainty, geopolitical risk, and renewable energy, with the data sets spanning from January 2018 to June 2022.
The methodologies provided by [35] are employed for determining the measurements of CPU, GPR, and EPU. In particular, the scaled frequency counts of numerous newspaper articles that contain specific keywords are used to generate the four uncertainty measures. Ref. [61] uses a variety of terms in formulating the CPU index, spanning regulation, legislation, carbon dioxide, climate, and greenhouse gases. The GPR index uses various word groupings related to conflicts, terrorist attacks, wars, and other events. The terms relating to economic and policy uncertainty are used in constructing the EPU index, as developed by [35]. http://www.policyuncertainty.com/index.html (accessed on 30 July 2022) provides the information and a more thorough explanation of the uncertainty indices.

3.2. Model Description

We should highlight the groundbreaking contributions, from an analytical standpoint, of the spillover connection in financial markets by [62]. They used novel techniques for condensing FEVDs to build the generalized VAR-based empirical methodology for connectedness and spillovers. They develop dynamic results in their work using the common rolling windows strategy. However, the authors introduced Bayesian TVP-VAR and demonstrated that TVP-VAR-based dynamic connectedness assessments are more reliable [63]. With these methodological achievements in mind, we broaden the scope of the literature’s application using quantile connection in this study. In order to evaluate the connectivity between the global uncertainty indices and leading renewable energy indices, we apply a unique econometric estimation approach to the quantile connectedness proposed by [64] and enhanced by [65].
The quantile spillover framework is more effective and distinct from existing approaches for several reasons. It distinguishes between the systematic and idiosyncratic parts of the error process. Utilizing a factor structure, it also handles the VAR residuals. Third, the unique shock that each system variable experiences can be isolated utilizing the quantile spillover approach. Finally, using this methodology, one may examine the tails of the multivariate distribution, which show market fluctuations.
In the beginning, we compute the quantile vector autoregression (QVAR):
z t = π τ + j = 1 p φ j τ z t j + ω t τ
where z t and z t 1 denote endogenous variables encompassing the first differenced 1-year renewable indices, Tau ( τ ) characterizes the quantile of renewable indices taking range (0, 1), QVAR approach lag length is signified by p, π τ shows conditional mean vector, φ j τ denotes QVAR coefficient, and ω t τ is an error term having k × k dimensional variance and covariance matrix ( Σ τ ).
The paper utilizes World’s theorem, i.e., z t = π τ + j = 1 p φ j τ z t j + ω t τ = π τ + i = 0 δ i τ ω t i for altering QVAR (p) into QVMA (∞).
Following [66,67], we compute the H-step-ahead Generalized Forecast Error Variance Decomposition (GFEVD) to determine the impact of a shock from variable j to variable i and, as a result, the following equation is advanced:
φ i j k H = Σ τ i i 1 h = 0 H 1 ( ε i δ h τ Σ τ ε j ) 2 h = 0 H 1 ( ε i δ h τ Σ τ δ h τ ε i )
φ ˜ i j k H = φ i j k H j = 1 k ( θ i j k H )
ε i indicates a zero vector with unity on the ith position, pointing to the next two equivalences:
j = 1 k φ ˜ i j k H = 1   and i j = 1 k φ ˜ i j k H = k
The following equation is created to evaluate the overall directional connectivity to others, i.e., the impact of the i variable on the j variables:
C i j k H = j = 1 ,   i j k φ ˜ j i k H
Also, the following equation is constructed to determine total directional connectedness from other measures, i.e., the impact of variables j on variables i:
C i j k H = j = 1 ,   i j k φ ˜ i j k H
The net total directional connectedness, or the difference between total directional connectedness to others and from others, can be calculated as the net influence of the ‘i’ variable on the system under inspection:
C i k H = C i j k H C i j k H
Lastly, the total connectivity index (TCI) with adjustments is computed as follows:
T C I H = i j = 1 ,   i j k φ ˜ i j k H K 1
If the TCI is higher, the degree of network connectivity is higher.

4. Results and Discussion

In Figure 1, the implications of COVID-19 are visible here in the renewable energy sector, where all renewable energy indices (ERE, MSCIR&EE, DJRE, R&CE, MSCIGAE, MSCIEE, and WRE) display a lower return trend. In other words, the health crisis negatively affected renewable energy indices during 2019–2020. Then, immediately after the impact of COVID-19, the markets started recovering as all these energy indices peaked during 2021, with a decline in 2022 due to the Russia–Ukraine war. This is consistent with the discoveries of [68], who found the negative implications of COVID-19 on conventional and Islamic stock markets in the Pakistan context. Similarly, there are continuous fluctuations in uncertainty indices, and the trend spiked during 2020 (coinciding with COVID-19) except for the geopolitical risk index (GPR). Moreover, fewer fluctuations are evident in the GPR index until 2022, when a sudden spike can be seen due to the Russia–Ukraine war.
Table 1 provides unit root tests and descriptive data for the renewable energy indices and global uncertainty factors. All the variables have positive average returns based on the data. The MSCIR&EE and ERE indexes have the highest returns, with average values of 1910.42 and 1904.83, respectively, while the R&CE and MSCIGAE indexes have the least favorable returns with 15.23 and 69.12, respectively. Except for the R&CE (26.51) and MSCIGAE (528.9) indices, the total standard deviations of the renewable energy indices are greater than those of the global uncertainty factors, suggesting that the relative volatility of the renewable indices is higher than that of the global factors. According to the Jarque–Bera (JB) normalcy test, the series is not normally distributed. Furthermore, except for CPU and GPR, the Elliott–Rothenberg–Stock unit root (ERS) test failed to show clinical significance across the sample period.
Moreover, average connectedness is shown in Table 2, where we can observe that the CPU index is the least influenced by others (43.97), and the greatest influence on other indices comes from the ERE index (140.65). The results show strong connectedness (82.87%) between these indices, corroborating with [69]. Their study demonstrates that the return spillover connectedness in global energy indices is substantial and more pronounced in economies, mostly in North America and Europe. Furthermore, the DJRE R&CE MSCIEE, CPU, GPR, GEPU_C, and GEPU_P indices are found to be the largest directional connectedness receivers of spillovers and swayed by external influences (−40.37, −4.55, −2.51, −35.04, −40.05, −11.85, and −12.24, respectively). In contrast, ERE, MSCIR&EE, MSCIGAE, and WRE indices are found to be net transmitters of spillovers (65.8, 28.72, 45.22, and 6.86, respectively). The MSCIEE sector is the least connected (2.51%) with other energy and global uncertainty indices, followed by the R&CE sector at 4.55%, while the ERE sector is the most connected at 65.8%.
Moreover, the main objective is to observe how the connectedness of renewable energy markets changes over time to several forms of uncertainty measurements, namely, climate policy uncertainty, geopolitical risk, and ambiguity surrounding economic policy uncertainty. In this regard, the ERE index was most connected to the spillovers from the GEPU_P (2.65) factor and least connected to/affected by the climate policy uncertainty factor CPU (0.12). Then, the MSCIR&EE index has the highest connectedness with GEPU_P (1.71) spillovers and the least with CPU factor (0.08). However, for the DJRE, R&CE, MSCIGAE, MSCIEE, and WRE indices, the most significant connectedness was from the spillovers of the GEPU_C factor (1.7, 1.18, 1.52, 1.28, and 1.65, respectively). Similarly, the least amount of connectedness for these indices (DJRE, MSCIGAE, MSCIEE, and WRE) was from the climate policy uncertainty (0.48, 0.09, 0.06, and 0.19), except for R&CE, which was least affected by GPR (0.79). Our findings indicate the most significant influence of economic policy uncertainty (GEPU_C, GEPU_P) on the renewable energy sectors. This is in line with the conclusions of [20], who conclude that economic policy uncertainty (EPU) has detrimental consequences on risk, the economy as a whole, and economic growth, all of which have an immediate impact on energy use. However, the least influence from climate policy uncertainty found in our analysis is vouched by [21]; their study uses the ARDL model to investigate how CPU influences renewable energy. The study’s findings show that the CPU has no short- or long-term impact on renewable energy. Likewise, among all the pairwise directional connectedness measures in renewable energy indices, we discover that the connectedness between the MSCI Global Alternative Energy Index (MSCIGAE) and European Renewable Energy Index (ERE) is the greatest among them all, coming in at 22.08% and 18.75%, respectively. This finding of close interaction between these indices is quite reasonable, as the European renewable energy index is a subclass of the global alternative energy index.
An estimation of the network of return connectedness at the lower quantile (10%) and upper quantile (90%) is shown in Figure 2 and Figure 3, respectively. We distinguish between blue color, a net transmitter, and yellow color, a net receiver. The R&CE and MSCIEE indices are net receivers for lower quantiles, but the same indices in upper quantiles act as net transmitters. Moreover, the MSCIGAE, WRE, MSCIR&EE, and ERE indices are net transmitters in both quantiles. Similarly, the CPU, GPR, GEPU_C, GEPU_P, and DJRE indices are net receivers in both quantiles. These changing patterns in the lower and upper quantiles found in energy indices are identical to the study of [70], which reveal dynamic patterns among renewable energy indices in different quantiles.
Figure 4 represents the total connectedness index (TCI) between the renewable energy indices (ERE MSCIR&EE, DJRE, R&CE, MSCIGAE, MSCIEE, and WRE) and global uncertainties indices (CPU, GPR, GEPRU_C, and GEPU_P). As per Figure 4, the TCI varies during our observations. The TCI fluctuates between 77% and 85%. Between 2020 and 2021, TCI reached its maximum peak; in the same period, COVID-19 was deemed a pandemic by the World Health Organization. Additionally, we observe that the elevated TCI falls during the second COVID-19 wave and resumes its upward trend during the early stages of the 2022 Russia–Ukraine conflict. The overall connectedness trends seen in our analysis during COVID-19 and the Russia–Ukraine conflict are in sync with the verdicts of those reported by [70]. Their study concluded that stronger TCI falls after the second wave of COVID-19 and climbs amid the hundred days of the conflict between Russia and Ukraine.

5. Conclusions and Policy Implications

This study assesses the connection among global uncertainties in economic policies, geopolitical peril, climate policy risks, and renewable energy sectors all around the world. The empirical results show strong connectedness between renewable energy (ERE MSCIR&EE, DJRE, R&CE, MSCIGAE, MSCIEE, and WRE) and global uncertainty indices (CPU, GPR, GEPU_C, and GEPU_P). Moreover, DJRE, R&CE, MSCIEE, WREcpu, GEPU_C, and GEPU_P are found to be net receivers of spillovers. In contrast, ERE MSCIR&EE, MSCIGAE, and WRE were found to be net transmitters of spillovers. Our findings also indicate that the most significant influence is from economic policy uncertainty (GEPU_C, GEPU_P) on the renewable energy sectors. This is in line with the conclusions of [20], who conclude that economic policy uncertainty (EPU) harms market risk. The economy and overall economic growth all immediately impact energy use. However, the least influence from climate policy uncertainty found in our analysis is corroborated by [21]; their study uses the ARDL model to investigate how CPU influences renewable energy. The study revealed that the CPU has no short- or long-term impact on renewable energy. Likewise, among all the pairwise directional connectedness measures in renewable energy indices, we discover that the connectedness between the MSCI Global Alternative Energy Index (MSCIGAE) and European Renewable Energy Index (ERE) is the greatest among them all, coming in at 22.08% and 18.75%, respectively. Lastly, the MSCIEE sector is the least connected, i.e., 2.51%, followed by the R&CE sector with 4.55%, while the ERE sector is the most connected (65.8%). The study reveals diversification avenues and recommends that investors consider the MSCIEE and R&CE sectors for parking their funds because of the lower risk, i.e., less connectivity and greater diversification.
These remarkable outcomes provide policy recommendations that require investors in renewable energy companies to pay close attention to these uncertainty indicators rather than rely on the core economic fundamentals when making investment choices. It is essential to note that this research will assist policymakers in modeling renewable energy policies related to the participants of renewable energy companies.

Author Contributions

Conceptualization, M.Z.R. and W.B.A.; Methodology, S.K. and U.A.K.; Software, S.K.; Validation, S.K. and A.A.N.; Formal analysis, S.K. and U.A.K.; Investigation, M.Z.R., S.K., U.A.K. and A.A.N.; Data curation, M.Z.R.; Writing—original draft, M.Z.R., S.K., U.A.K. and W.B.A.; Supervision, W.B.A.; Project administration, W.B.A. All authors have read and agreed to the published version of the manuscript.

Funding

The authors extend their appreciation to the Deputyship for Research and Innovation, “Ministry of Education” in Saudi Arabia for funding this research work through the project No. (IFKSUOR3–360–1).

Data Availability Statement

Not applicable.

Conflicts of Interest

The authors declare no conflict of interest.

References

  1. Xu, X.; Wei, Z.; Ji, Q.; Wang, C.; Gao, G. Global renewable energy development: Influencing factors, trend predictions, and countermeasures. Resour. Policy 2019, 63, 101470. [Google Scholar] [CrossRef]
  2. García-Álvarez, M.T.; Moreno, B.; Soares, I. Analyzing the environmental and resource pressures from European energy activity: A comparative study of EU member states. Energy 2016, 115, 1375–1384. [Google Scholar] [CrossRef]
  3. Liu, J.; Ma, F.; Tang, Y.; Zhang, Y. Geopolitical risk and oil volatility: A new insight. Energy Econ. 2019, 84, 104548. [Google Scholar] [CrossRef]
  4. Hemrit, W.; Benlagha, N. Does the renewable energy index respond to the pandemic uncertainty? Renew. Energy 2021, 177, 336–347. [Google Scholar] [CrossRef]
  5. Inglesi-Lotz, R. The impact of renewable energy consumption to economic growth: A panel data application. Energy Econ. 2016, 53, 58–63. [Google Scholar] [CrossRef]
  6. Lambert, R.J.; Silva, P.P. The challenges of determining the employment effects of renewable energy. Renew. Sustain. Energy Rev. 2012, 16, 4667–4674. [Google Scholar] [CrossRef]
  7. Kinab, E.; Elkhoury, M. Renewable energy use in Lebanon: Barriers and solutions. Renew. Sustain. Energy Rev. 2012, 16, 4422–4431. [Google Scholar] [CrossRef]
  8. Payne, J.E.; Truong, H.H.D.; Chu, L.K.; Doğan, B.; Ghosh, S. Economic complexity and energy security affect energy efficiency measures: Evidence from panel quantile analysis. Energy Policy 2023, 177, 113547. [Google Scholar] [CrossRef]
  9. Aguirre, M.; Ibikunle, G. Determinants of renewable energy growth: A global sample analysis. Energy Policy 2014, 69, 374–384. [Google Scholar] [CrossRef]
  10. Li, R.; Wang, Q.; Liu, Y.; Jiang, R. Per-capita carbon emissions in 147 countries: The effect of economic, energy, social, and trade structural changes. Sustain. Prod. Consum. 2021, 27, 1149–1164. [Google Scholar] [CrossRef]
  11. Hoang, A.T.; Nižetić, S.; Olcer, A.I.; Ong, H.C.; Chen, W.H.; Chong, C.T.; Nguyen, X.P. Impacts of COVID-19 pandemic on the global energy system and the shift progress to renewable energy: Opportunities, challenges, and policy implications. Energy Policy 2021, 154, 112322. [Google Scholar] [CrossRef] [PubMed]
  12. Shekhar, J.; Suri, D.; Somani, P.; Lee, S.J.; Arora, M. Reduced renewable energy stability in India following COVID-19: Insights and key policy recommendations. Renew. Sustain. Energy Rev. 2021, 144, 111015. [Google Scholar] [CrossRef] [PubMed]
  13. Wang, J.; Ma, F.; Bouri, E.; Zhong, J. The volatility of clean energy and natural gas, uncertainty indices, and global economic conditions. Energy Econ. 2022, 108, 105904. [Google Scholar] [CrossRef]
  14. Zhang, Y.; Wang, Y. Forecasting crude oil futures market returns: A principal component analysis combination approach. Int. J. Forecast. 2023, 39, 659–673. [Google Scholar] [CrossRef]
  15. Lundgren, A.I.; Milicevic, A.; Uddin, G.S.; Kang, S.H. Connectedness network and dependence structure mechanism in green investments. Energy Econ. 2018, 72, 145–153. [Google Scholar] [CrossRef]
  16. Wang, X.; Li, J.; Ren, X. Asymmetric causality of economic policy uncertainty and oil volatility index on time-varying nexus of the clean energy, carbon, and green bond. Int. Rev. Financ. Anal. 2022, 83, 102306. [Google Scholar] [CrossRef]
  17. Dutta, A.; Bouri, E.; Saeed, T. News-based equity market uncertainty and crude oil volatility. Energy 2021, 222, 119930. [Google Scholar] [CrossRef]
  18. Li, Y.; Huang, J.; Gao, W.; Zhang, H. Analyzing the time-frequency connectedness among oil, gold prices, and BRICS geopolitical risks. Resour. Policy 2021, 73, 102134. [Google Scholar] [CrossRef]
  19. Liang, C.; Wei, Y.; Li, X.; Zhang, X.; Zhang, Y. Uncertainty and crude oil market volatility: New evidence. Appl. Econ. 2020, 52, 2945–2959. [Google Scholar] [CrossRef]
  20. Pirgaip, B.; Dinçergök, B. Economic policy uncertainty, energy consumption, and carbon emissions in G7 countries: Evidence from a panel Granger causality analysis. Environ. Sci. Pollut. Res. 2020, 27, 30050–30066. [Google Scholar] [CrossRef]
  21. Shang, Y.; Han, D.; Gozgor, G.; Mahalik, M.K.; Sahoo, B.K. The impact of climate policy uncertainty on renewable and non-renewable energy demand in the United States. Renew. Energy 2022, 197, 654–667. [Google Scholar] [CrossRef]
  22. Sadorsky, P. Correlations and volatility spillovers between oil prices and the stock prices of clean energy and technology companies. Energy Econ. 2012, 34, 248–255. [Google Scholar] [CrossRef]
  23. Reboredo, J.C.; Rivera-Castro, M.A.; Ugolini, A. Wavelet-based test of co-movement and causality between oil and renewable energy stock prices. Energy Econ. 2017, 61, 241–252. [Google Scholar] [CrossRef]
  24. Ferrer, R.; Shahzad, S.J.H.; López, R.; Jareño, F. Time and frequency dynamics of connectedness between renewable energy stocks and crude oil prices. Energy Econ. 2018, 76, 1–20. [Google Scholar] [CrossRef]
  25. Song, Y.; Ji, Q.; Du, Y.J.; Geng, J.B. The dynamic dependence of fossil energy, investor sentiment, and renewable energy stock markets. Energy Econ. 2019, 84, 104564. [Google Scholar] [CrossRef]
  26. Chu, L.K.; Ghosh, S.; Doğan, B.; Nguyen, N.H.; Shahbaz, M. Energy security as the new determinant of renewable energy: The role of economic complexity in top energy users. Energy 2023, 263, 125799. [Google Scholar] [CrossRef]
  27. Caldara, D.; Iacoviello, M. Measuring geopolitical risk. Am. Econ. Rev. 2022, 112, 1194–1225. [Google Scholar] [CrossRef]
  28. Gong, X.; Xu, J. Geopolitical risk and dynamic connectedness between commodity markets. Energy Econ. 2022, 110, 106028. [Google Scholar] [CrossRef]
  29. Overland, I. The geopolitics of renewable energy: Debunking four emerging myths. Energy Res. Soc. Sci. 2019, 49, 36–40. [Google Scholar] [CrossRef]
  30. Cai, Y.; Wu, Y. Time-varying interactions between geopolitical risks and renewable energy consumption. Int. Rev. Econ. Financ. 2021, 74, 116–137. [Google Scholar] [CrossRef]
  31. Rasoulinezhad, E.; Taghizadeh-Hesary, F.; Sung, J.; Panthamit, N. Geopolitical risk and energy transition in Russia: Evidence from ARDL bounds testing method. Sustainability 2020, 12, 2689. [Google Scholar] [CrossRef]
  32. Yang, K.; Wei, Y.; Li, S.; He, J. Geopolitical risk and renewable energy stock markets: An insight from multiscale dynamic risk spillover. J. Clean. Prod. 2021, 279, 123429. [Google Scholar] [CrossRef]
  33. Overland, I.; Bazilian, M.; Uulu, T.I.; Vakulchuk, R.; Westphal, K. The GeGaLo index: Geopolitical gains and losses after energy transition. Energy Strategy Rev. 2019, 26, 100406. [Google Scholar] [CrossRef]
  34. Su, C.W.; Khan, K.; Umar, M.; Zhang, W. Does renewable energy redefine geopolitical risks? Energy Policy 2021, 158, 112566. [Google Scholar] [CrossRef]
  35. Baker, S.R.; Bloom, N.; Davis, S.J. Measuring economic policy uncertainty. Q. J. Econ. 2016, 131, 1593–1636. [Google Scholar] [CrossRef]
  36. Pham, L.; Nguyen, C.P. How do stock, oil, and economic policy uncertainty influence the green bond market? Financ. Res. Lett. 2022, 45, 102128. [Google Scholar] [CrossRef]
  37. Wen, H.; Lee, C.C.; Zhou, F. How does fiscal policy uncertainty affect corporate innovation investment? Evidence from China’s new energy industry. Energy Econ. 2022, 105, 105767. [Google Scholar] [CrossRef]
  38. Broadstock, D.C.; Cheng, L.T. Time-varying relation between black and green bond price benchmarks: Macroeconomic determinants for the first decade. Financ. Res. Lett. 2019, 29, 17–22. [Google Scholar] [CrossRef]
  39. Danish, U.R.; Khan, S.U.D. Relationship between energy intensity and CO2 emissions: Does economic policy matter? Sustain. Dev. 2020, 28, 1457–1464. [Google Scholar] [CrossRef]
  40. Antonakakis, N.; Chatziantoniou, I.; Filis, G. Dynamic spillovers of oil price shocks and economic policy uncertainty. Energy Econ. 2014, 44, 433–447. [Google Scholar] [CrossRef]
  41. Appiah-Otoo, I. Impact of economic policy uncertainty on renewable energy growth. Energy Res. Lett. 2021, 2, 19444. [Google Scholar] [CrossRef]
  42. Chu, L.K.; Le, N.T.M. Environmental quality and the role of economic policy uncertainty, economic complexity, renewable energy, and energy intensity: The case of G7 countries. Environ. Sci. Pollut. Res. 2022, 29, 2866–2882. [Google Scholar] [CrossRef] [PubMed]
  43. Sendstad, L.H.; Chronopoulos, M. Sequential investment in renewable energy technologies under policy uncertainty. Energy Policy 2020, 137, 111152. [Google Scholar] [CrossRef]
  44. Borozan, D. Asymmetric effects of policy uncertainty on renewable energy consumption in G7 countries. Renew. Energy 2022, 189, 412–420. [Google Scholar] [CrossRef]
  45. Shafiullah, M.; Miah, M.D.; Alam, M.S.; Atif, M. Does economic policy uncertainty affect renewable energy consumption? Renew. Energy 2021, 179, 1500–1521. [Google Scholar] [CrossRef]
  46. Zeng, Q.; Yue, X. Re-evaluating the asymmetric economic policy uncertainty, conventional energy, and renewable energy consumption nexus for BRICS. Environ. Sci. Pollut. Res. 2022, 29, 20347–20356. [Google Scholar] [CrossRef]
  47. Sohail, M.T.; Xiuyuan, Y.; Usman, A.; Majeed, M.T.; Ullah, S. Renewable energy and non-renewable energy consumption: Assessing the asymmetric role of monetary policy uncertainty in energy consumption. Environ. Sci. Pollut. Res. 2021, 28, 31575–31584. [Google Scholar] [CrossRef]
  48. Liu, R.; He, L.; Liang, X.; Yang, X.; Xia, Y. Is there any difference in the impact of economic policy uncertainty on the investment of traditional and renewable energy enterprises?—A comparative study based on regulatory effects. J. Clean. Prod. 2020, 255, 120102. [Google Scholar] [CrossRef]
  49. Lang, Q.; Ma, F.; Mirza, N.; Umar, M. The interaction of climate risk and bank liquidity: An emerging market perspective for transitions to low carbon energy. Technol. Forecast. Soc. Chang. 2023, 191, 122480. [Google Scholar] [CrossRef]
  50. Liang, C.; Umar, M.; Ma, F.; Huynh, T.L. Climate policy uncertainty and world renewable energy index volatility forecasting. Technol. Forecast. Soc. Chang. 2022, 182, 121810. [Google Scholar] [CrossRef]
  51. Hong, H.; Karolyi, G.A.; Scheinkman, J.A. Climate finance. Rev. Financ. Stud. 2020, 33, 1011–1023. [Google Scholar] [CrossRef]
  52. Bartram, S.M.; Hou, K.; Kim, S. Real effects of climate policy: Financial constraints and spillovers. J. Financ. Econ. 2022, 143, 668–696. [Google Scholar] [CrossRef]
  53. Krueger, P.; Sautner, Z.; Starks, L.T. The importance of climate risks for institutional investors. Rev. Financ. Stud. 2020, 33, 1067–1111. [Google Scholar] [CrossRef]
  54. Zhou, D.; Siddik, A.B.; Guo, L.; Li, H. Dynamic relationship among climate policy uncertainty, oil price, and renewable energy consumption—Findings from TVP-SV-VAR approach. Renew. Energy 2023, 204, 722–732. [Google Scholar] [CrossRef]
  55. Bouri, E.; Iqbal, N.; Klein, T. Climate policy uncertainty and the price dynamics of green and brown energy stocks. Financ. Res. Lett. 2022, 47, 102740. [Google Scholar] [CrossRef]
  56. Gernaat, D.E.; de Boer, H.S.; Daioglou, V.; Yalew, S.G.; Müller, C.; van Vuuren, D.P. Climate change impacts on renewable energy supply. Nat. Clim. Chang. 2021, 11, 119–125. [Google Scholar] [CrossRef]
  57. Mercure, J.F.; Salas, P.; Vercoulen, P.; Semieniuk, G.; Lam, A.; Pollitt, H.; Vinuales, J.E. Reframing incentives for climate policy action. Nat. Energy 2021, 6, 1133–1143. [Google Scholar] [CrossRef]
  58. Sarker, P.K.; Bouri, E.; Marco, C.K.L. Asymmetric effects of climate policy uncertainty, geopolitical risk, and crude oil prices on clean energy prices. Environ. Sci. Pollut. Res. 2023, 30, 15797–15807. [Google Scholar] [CrossRef]
  59. Sweidan, O.D. Is the geopolitical risk an incentive or obstacle to renewable energy deployment? Evidence from a panel analysis. Renew. Energy 2021, 178, 377–384. [Google Scholar] [CrossRef]
  60. Wang, Y.; Bouri, E.; Fareed, Z.; Dai, Y. Geopolitical risk and the systemic risk in the commodity markets under the war in Ukraine. Financ. Res. Lett. 2022, 49, 103066. [Google Scholar] [CrossRef]
  61. Gavriilidis, K. Measuring Climate Policy Uncertainty. 2021. Available online: https://papers.ssrn.com/sol3/papers.cfm?abstract_id=3847388 (accessed on 23 July 2023).
  62. Diebold, F.X.; Yilmaz, K. Measuring financial asset return and volatility spillovers, with application to global equity markets. Econ. J. 2009, 119, 158–171. [Google Scholar] [CrossRef]
  63. Koop, G.; Korobilis, D.; Pettenuzzo, D. Bayesian compressed vector autoregressions. J. Econom. 2019, 210, 135–154. [Google Scholar] [CrossRef]
  64. Ando, T.; Greenwood-Nimmo, M.; Shin, Y. Quantile connectedness: Modeling tail behavior in the topology of financial networks. Manag. Sci. 2022, 68, 2401–2431. [Google Scholar] [CrossRef]
  65. Chatziantoniou, I.; Gabauer, D.; Stenfors, A. Interest rate swaps and the transmission mechanism of monetary policy: A quantile connectedness approach. Econ. Lett. 2021, 204, 109891. [Google Scholar] [CrossRef]
  66. Koop, G.; Pesaran, M.H.; Potter, S.M. Impulse response analysis in nonlinear multivariate models. J. Econom. 1996, 74, 119–147. [Google Scholar] [CrossRef]
  67. Pesaran, H.H.; Shin, Y. Generalized impulse response analysis in linear multivariate models. Econ. Lett. 1998, 58, 17–29. [Google Scholar] [CrossRef]
  68. Bhutt, N.A.; Khan, S.; Khan, U.A.; Matlani, A. The impact of COVID-19 on conventional and Islamic stocks: Empirical evidence from Pakistan. J. Econ. Adm. Sci. 2022. online ahead of print. [Google Scholar]
  69. Singh, V.K.; Kumar, P.; Nishant, S. Global connectedness of MSCI energy equity indices: A system-wide network approach. Energy Econ. 2019, 84, 104477. [Google Scholar] [CrossRef]
  70. Lorente, D.B.; Mohammed, K.S.; Cifuentes-Faura, J.; Shahzad, U. Dynamic connectedness among climate change index, green financial assets, and renewable energy markets: Novel evidence from a sustainable development perspective. Renew. Energy 2023, 204, 94–105. [Google Scholar] [CrossRef]
Figure 1. Time series plots of renewable energy indices and global uncertainties indices. Source: Estimated by Authors using Data from Bloomberg.
Sustainability 15 13630 g001aSustainability 15 13630 g001b
Figure 2. Network of return connectedness at the lower quantile (10%).
Sustainability 15 13630 g002
Figure 3. Network of return connectedness at the upper quantile (90%).
Sustainability 15 13630 g003
Figure 4. Total connectedness index.
Sustainability 15 13630 g004
Table 1. Descriptive statistics.
EREMSCIR&EEDJRER&CEMSCIGAEMSCIEEWRECPUGPRGEPU_CGEPU_P
Mean1904.8321910.42149.87915.2369.1191646.201169.30195.2399.368247.31255.79
Variance497,851.258416,608.645425.61236.51528.988301,093.998459,465.8594435.671903.6354019.3534208.288
Skewness0.548 *0.4350.910 ***0.578 *0.539 *0.541 *0.521 *0.751 **3.199 ***0.534 *0.399
−0.082−0.161−0.007−0.068−0.087−0.086−0.097−0.0210−0.09−0.197
Ex. Kurtosis−1.144 ***−1.516 ***−0.148−1.376 ***−1.336 ***−1.365 ***−1.353 ***0.89612.524 ***−0.015−0.136
−0.0010−0.8870000−0.1170−0.701−0.869
JB5.643 *6.872 **7.510 **7.270 **6.631 **6.832 **6.559 **6.878 **445.041 ***2.5671.471
−0.06−0.032−0.023−0.026−0.036−0.033−0.038−0.0320−0.277−0.479
ERS−0.904−0.759−1.224−0.983−0.963−0.775−0.79−2.018 **−1.655 *−1.243−1.125
−0.371−0.452−0.227−0.331−0.341−0.443−0.434−0.05−0.105−0.221−0.266
Q(10)210.135 ***230.831 ***171.687 ***223.680 ***213.736 ***208.929 ***218.514 ***13.143 **43.615 ***64.623 ***68.363 ***
0000000−0.015000
Q2(10)191.119 ***223.947 ***128.474 ***216.212 ***199.228 ***197.156 ***187.531 ***9.789 *25.687 ***57.900 ***60.560 ***
0000000−0.077000
* p < 0.1, ** p < 0.05, and *** p < 0.01 denote significance at 10%, 5%, and 1%, respectively.
Table 2. Averaged dynamic connectedness.
EREMSCIR&EEDJRER&CEMSCIGAEMSCIEEWRECPUGPRGEPU_CGEPU_PFROM
ERE25.1515.483.098.7118.7510.0412.150.121.252.62.6574.85
MSCIR&EE19.4418.714.9813.2516.659.9912.220.081.291.681.7181.29
DJRE22.8713.087.327.9618.9211.1113.110.481.831.71.6192.68
R&CE18.5517.476.6414.3516.4810.7912.480.10.791.181.1785.65
MSCIGAE22.0816.473.789.7619.2111.5812.740.091.261.521.5180.79
MSCIEE20.0416.144.9210.4218.6612.9813.080.061.191.281.2487.02
WRE21.1116.384.7510.2417.6610.2414.50.191.671.651.6185.5
CPU2.534.465.795.242.371.224.1656.038.884.834.4943.97
GPR4.726.1913.638.984.766.54.661.5536.966.335.7163.04
GEPU_C4.692.092.533.35.876.543.883.122.5532.7132.7267.29
GEPU_P4.632.252.213.245.96.53.883.122.2832.6633.3466.66
TO140.65110.0152.3181.1126.0184.5192.368.9322.9955.4454.42828.74
Inc.Own165.8128.7259.6395.45145.2297.49106.8664.9659.9588.1587.76cTCI/TCI
NET65.828.72−40.37−4.5545.22−2.516.86−35.04−40.05−11.85−12.2482.87/75.34
NPT108459670123
Disclaimer/Publisher’s Note: The statements, opinions and data contained in all publications are solely those of the individual author(s) and contributor(s) and not of MDPI and/or the editor(s). MDPI and/or the editor(s) disclaim responsibility for any injury to people or property resulting from any ideas, methods, instructions or products referred to in the content.

