1. Introduction
After the housing crisis of 2007–2009 and the subsequent recession, the availability of mortgages decreased and lending standards tightened. This credit crunch drove borrowers to search for alternative sources of finance, such as peer-to-peer (P2P) lending, which is considered the most successful FinTech lending model.
The aim of our paper is to investigate whether P2P lending acted as a credit channel, bypassing the restrictions imposed by banks on mortgage lending, and can be considered a means to reduce inequalities and to facilitate the economic inclusion of borrowers in the mortgage market. In our paper, we show that the increase in volume of FHA mortgages, as it is fueled by P2P lending, among other factors, can be viewed as a path to financial inclusion for underserved borrowers, thus achieving the objective of equal access to financial resources, which is the main goal of sustainability. In that sense, P2P lending creates social impact by providing access to credit for individuals that are excluded or underserved by traditional financial institutions. In other words, this form of social lending aims to make mortgage financing and investing more accessible to all borrowers.
We focus on the Federal Housing Administration (FHA) mortgages because the FHA is considered the closest substitute for private subprime lending, thus representing the riskiest category of mortgages. Post crisis, subprime lending was almost eliminated, and riskier potential borrowers struggled to obtain a mortgage loan. FHA facilitated loan originations to low and moderate income borrowers, gaining market share, which peaked at 37% of overall home purchase mortgage market in 2009, while the corresponding percentage in 2007 was 7% [
1].
While regulators did not explicitly impose mandatory loan-to-value (LTV) ratios on residential mortgages, the FHA increased its caps. In 2008, the Housing and Economic Recovery Act (HERA) increased the minimum cash down payment requirement on FHA loans to 3.5%. The down payment for FHA loans was as low as 3% for forty-three years (1965–2008). Almost half of FHA mortgage originations in the period from 2002–2006 had an LTV ratio above 97%. In the following years, the origination of risky loans gradually declined, reaching an all-time low of 1.23% in 2017. Since fiscal year 2010, over 50% of issued loans were within the LTV ratio of 95–97% [
2].
Historically, the statutory cap on LTV was a commonly used borrower-based macroprudential policy to limit the risks, to curb the real estate boom, and to ensure safety in the economy. The effectiveness of the LTV policy was examined by studies such as [
3,
4,
5]. More precisely, by performing a counterfactual policy analysis, Ref. [
6] found that the dangerous expansion in the U.S. housing sector could have been effectively offset if authorities had followed a maximum LTV ratio policy.
One issue with implementing LTV limits is that there are ways to bypass the restrictions. In the U.S. during the housing boom, piggyback loans grew rapidly. They were used to help pay down payments on a property or to avoid paying private mortgage insurance (PMI). With piggyback mortgages, borrowers could obtain a secondary loan, usually from a different lender, to fund a fraction, or even the whole amount, of the down payment required for a home purchase. As a result, in many cases, the down payment was as low as zero [
7]. In our paper, we evaluate the ability of P2P lending, a lightly regulated channel of FinTech credit, to provide funds to potential borrowers to meet the increased down payment for a house purchase. P2P lenders are generally regulated by the U.S. Consumer Financial Protection Bureau, the Federal Trade Commission, and state regulators rather than by the Federal Reserve. We investigate the increase in FHA loans within the framework of tight mortgage lending criteria attributed to, inter alia, the expansion of FinTech lending as a complementary channel to mortgage lending for marginal borrowers. Given that FHA loans mostly address subprime borrowers, who are borrowers with low credit scores and less available cash, it is important to examine how FHA loan originations were evaluated during a period of credit tightness and increased down payment requirements.
The rationale behind the regulatory change in 2008 was the belief that low down payment combined with falling house prices would lead to high rates of default. The maximum LTV ratio was reduced to 96.5% in order to limit the access of risky borrowers to mortgage credit and to prevent negative default externalities.
However, our results show that FHA-insured mortgages increased, since marketplace lending allowed subprime borrowers to ensure the necessary financing and bypass the imposed LTV-based policy.
Marketplace lending emerged after the global financial crisis and is now the leading alternative financing format globally. In the U.S., it is estimated that marketplace lenders currently supply 38% of all unsecured personal lending. According to Ref. [
8], the P2P loan origination volume in the U.S. increased by 84%, on average, since 2007. In 2015, P2P consumer lending was equivalent to 12.5% of traditional consumer lending [
9]. In 2017, consumer marketplace lending reached 46 billion USD in total, growing by 12.3 billion USD (36.5%) in 2017 alone.
Many researchers, such as [
10,
11,
12,
13], examined the risk related to marketplace lending. Ref. [
14] mention six core problems associated with P2P lending, namely information asymmetry, determination of borrower credit scores, moral hazard, investment decisions, platform feasibility, and immature regulations.
Our results show that FHA mortgage originations rapidly increased in the post-crisis period and this event is closely related to the emergence of P2P lending in the U.S. Moreover, the recovery of FHA loans observed from 2015 to 2017, after the big loss of its market share from 2011 through 2014, coincides with the sharp increase in P2P loans. The total volume of FHA mortgages issued in 2015 was 72% higher than the previous year, and the corresponding increase in P2P lending was 83%.
Our analysis highlights the dynamic of crowdlending to circumvent tightened LTV caps (mortgage supply constraints) by providing small loans to borrowers, who can in turn meet the increased down payment requirements, thus increasing the total volume of FHA loans. To our knowledge, this paper is the first that examines to what extent the LTV cap policy can be bypassed by the availability of P2P lending. Beyond financial advantages such as faster approval, flexibility, and higher returns for investors, this form of lending can also encourage financial inclusion and social impact by providing access to credit for underserved segments of the population. In this sense, it supports social and environmental causes, thus promoting sustainability. Financial inclusion is essential for reducing poverty, promoting economic growth, and increasing the economic social and environmental impact of investments on people’s lives [
15].
Several recent studies have examined the U.S. residential mortgage market in light of new technological achievements and show that traditional methods of lending may no longer be common practice. For example, Ref. [
16] studies how the use of digital footprint is reshaping the mortgage market and shows that the number of lenders that use a borrower’s digital footprint has remarkably increased, and that these users bear a significantly lower risk compared to nonusers. Refs. [
17,
18] show that FinTech lenders dramatically increased their market share of U.S. mortgage lending, suggesting that technological innovation has improved the efficiency of financial intermediation in the U.S. mortgage market.
A paper closely related to ours is [
19], which is the first to examine the growth of Chinese P2P lending after the increase in LTV limits. Authors conclude that policy intervention in the real estate mortgage market caused an increase in the demand for peer-to-peer lending in China, as it acts, to some degree, as a credit channel that circumvents city-level LTV caps and the housing market macroprudential policy in China.
In addition to using U.S. data instead of Chinese data in our analysis, there are two key differences between this study and our paper. First, in addition to crowdfunding, we study the effect of other factors on the development of FHA mortgages, such as the GDP per capita and population growth, which, as empirical results show, have a significant impact on mortgage origination. Second, while they use a difference-in-differences setting to study changes in P2P lending after the change in the LTV policy, we use a panel data model to analyze the correlation between FHA mortgages and crowdlending from 2007 to 2017. The panel data technique is common in applied research and it uses all the data information available. The use of panel data may offer several advantages, such as control for heterogeneity across individual units (states in this study), support of a great number of variables, and less multicollinearity among independent variables.
Clearly, the volume of FHA-endorsed mortgages is affected by many factors. The most important ones are related to the prevailing economic conditions over the eleven-year period under review. Some of the most significant economic and financial factors that are incorporated in our model to examine their effect on the U.S. mortgage originations are interest rate, GDP per capita, unemployment rate, house price index, new residential housing units, population growth, broad money growth rate, and consumer confidence index.
The main goal of this study is to examine the correlation between FHA-endorsed mortgages and marketplace lending, taking into account other macroeconomic and financial factors as well.
Technically, we use panel data analysis for the period 2007–2017. We employ a state-level data set for all 50 U.S. states, and we test the correlation with FHA loans.
This study suggests that the evolution of FHA loans in the sample period 2007–2017 was influenced by many factors, among which was the boom of P2P lending, our main variable of interest. The study finds that the emergence of crowdlending is causally associated with a significant rise in the volume of FHA loans during the study period, implying that P2P lending has a positive impact on mortgage loans.
Furthermore, there is evidence for seven more determinants of FHA mortgage endorsements: GDP per capita, population growth, broad money growth rate, interest rate, unemployment rate, new housing units, and consumer confidence Index.
The rest of the paper is organized as follows:
Section 2 summarizes the growth in post-crisis FHA-insured mortgages and marketplace lending.
Section 3 reviews the literature.
Section 4 presents Holmstrom and Tirole’s 1997 model, which allows us to formulate the hypothesis that P2P lending has a positive effect on FHA mortgage origination.
Section 5 describes the data used and the methodology.
Section 6 presents and discusses the empirical results. Finally,
Section 7 concludes the paper.
2. Loan Origination Behavior in the Post-Crisis Period
We conducted a data analysis of FHA mortgages and P2P loans issued from 2007 to 2017, as after the housing market downturn mortgage endorsements were severely curtailed while FHA mortgage volume significantly increased.
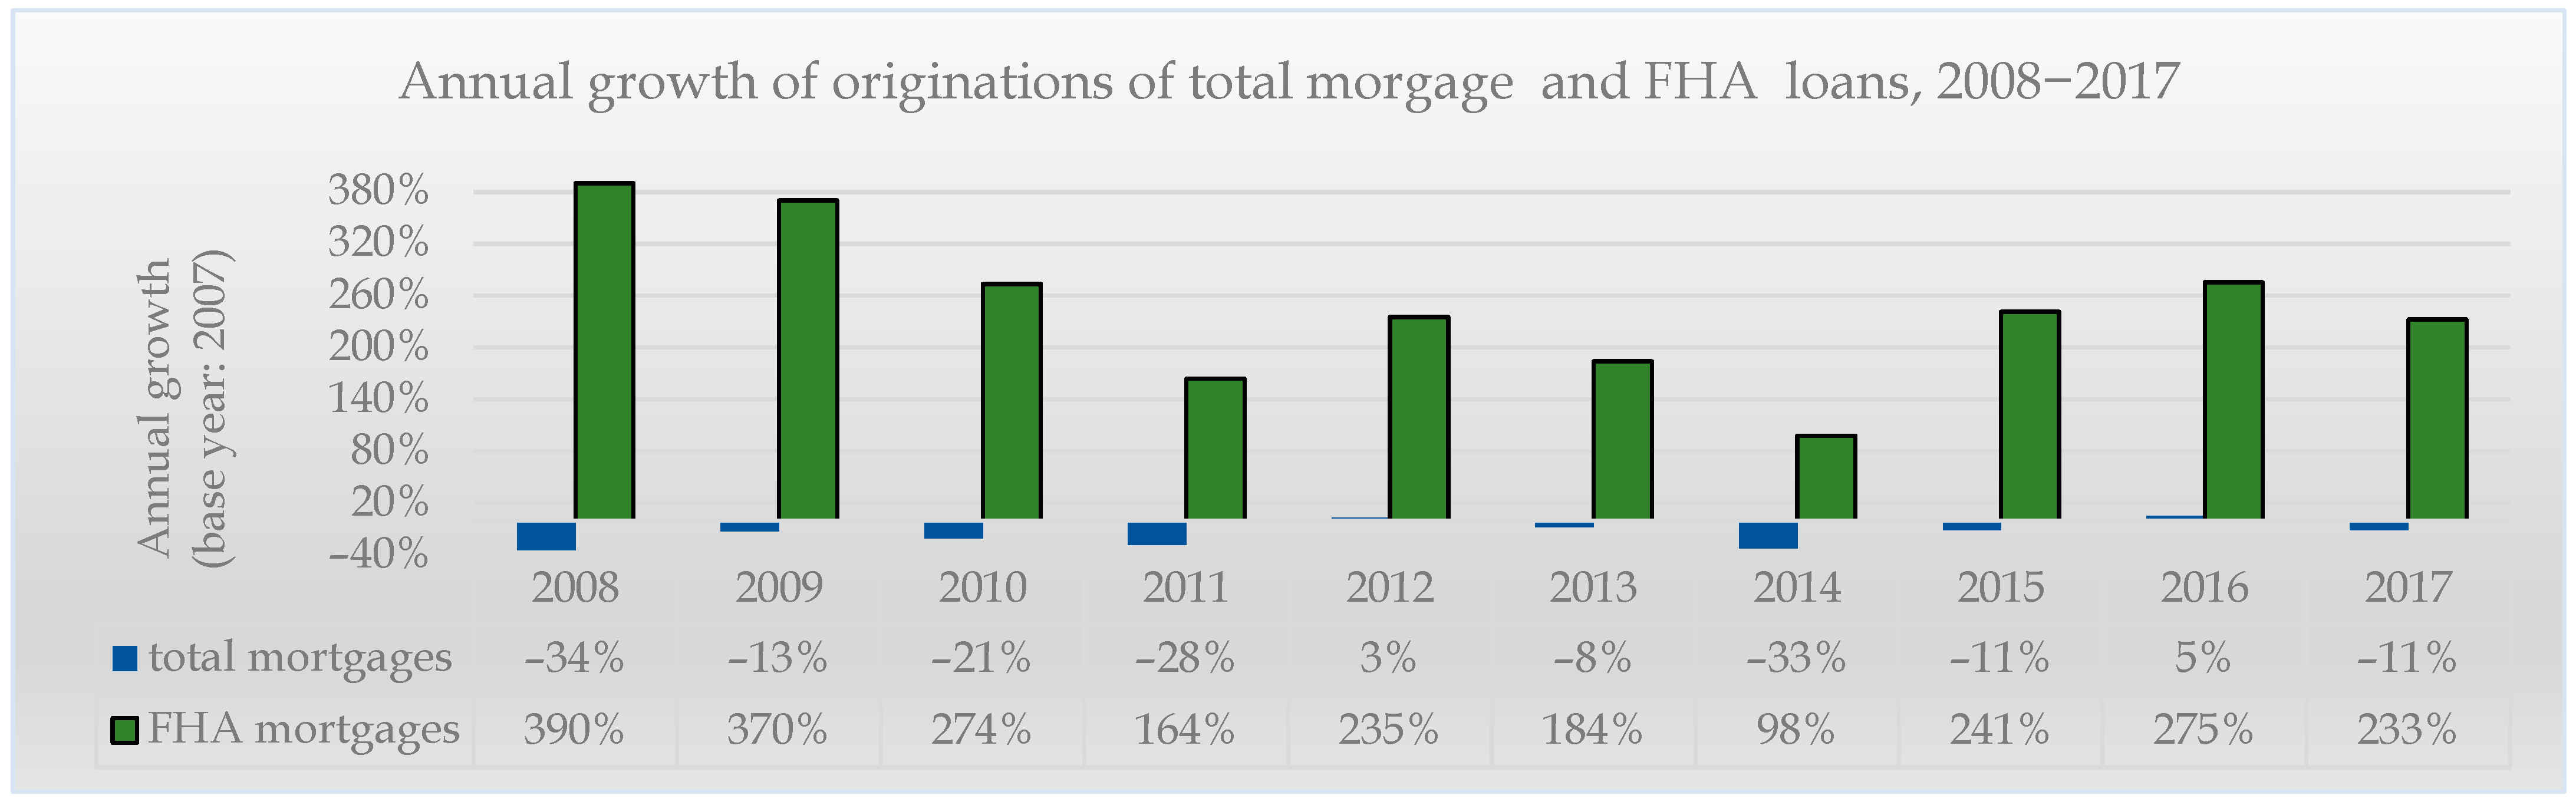
Figure 1 presents the percentage change in total mortgage originations versus the percentage change in total FHA loan originations during the period under review. The 2007 financial year, which was the beginning of the financial crisis, is used as the base year for comparison purposes.
During the entire period under review and especially the first four years (2008–2011), aggregate mortgage endorsements were severely curtailed while FHA mortgages skyrocketed, despite the reduction in the LTV ratio. A characteristic example is the year 2008, during which the total mortgage originations decreased by 34% compared to the base year 2007, while FHA loans increased sharply by 390%.
This remarkable trend reversal provides evidence that economic factors that lead to an increase in FHA mortgages may exist, despite the declining trend in mortgages (in general).
P2P lending started in the U.S. in February 2006 with the launch of Prosper Marketplace, followed by Lending Club. We use a data set from Lending Club, the largest (based upon issued loan volume and revenue) online lender in the U.S. and worldwide. Lending Club matches borrowers’ demand and lenders’ supply for funding, without the intermediation of traditional banks. It does not originate loans itself but relies on WebBank, an online bank whose main activity is to finance peer-to-peer lending platforms.
Loan amounts requested on Lending Club vary from 1000 to 40,000 USD, and borrowers may ask for a loan for different reasons, such as debt consolidation, large purchases, or credit card refinancing.
Table 1 shows the total volume of funded P2P loans, the total number of loans approved, and the number of states that participated in the P2P process from 2007 to 2017.
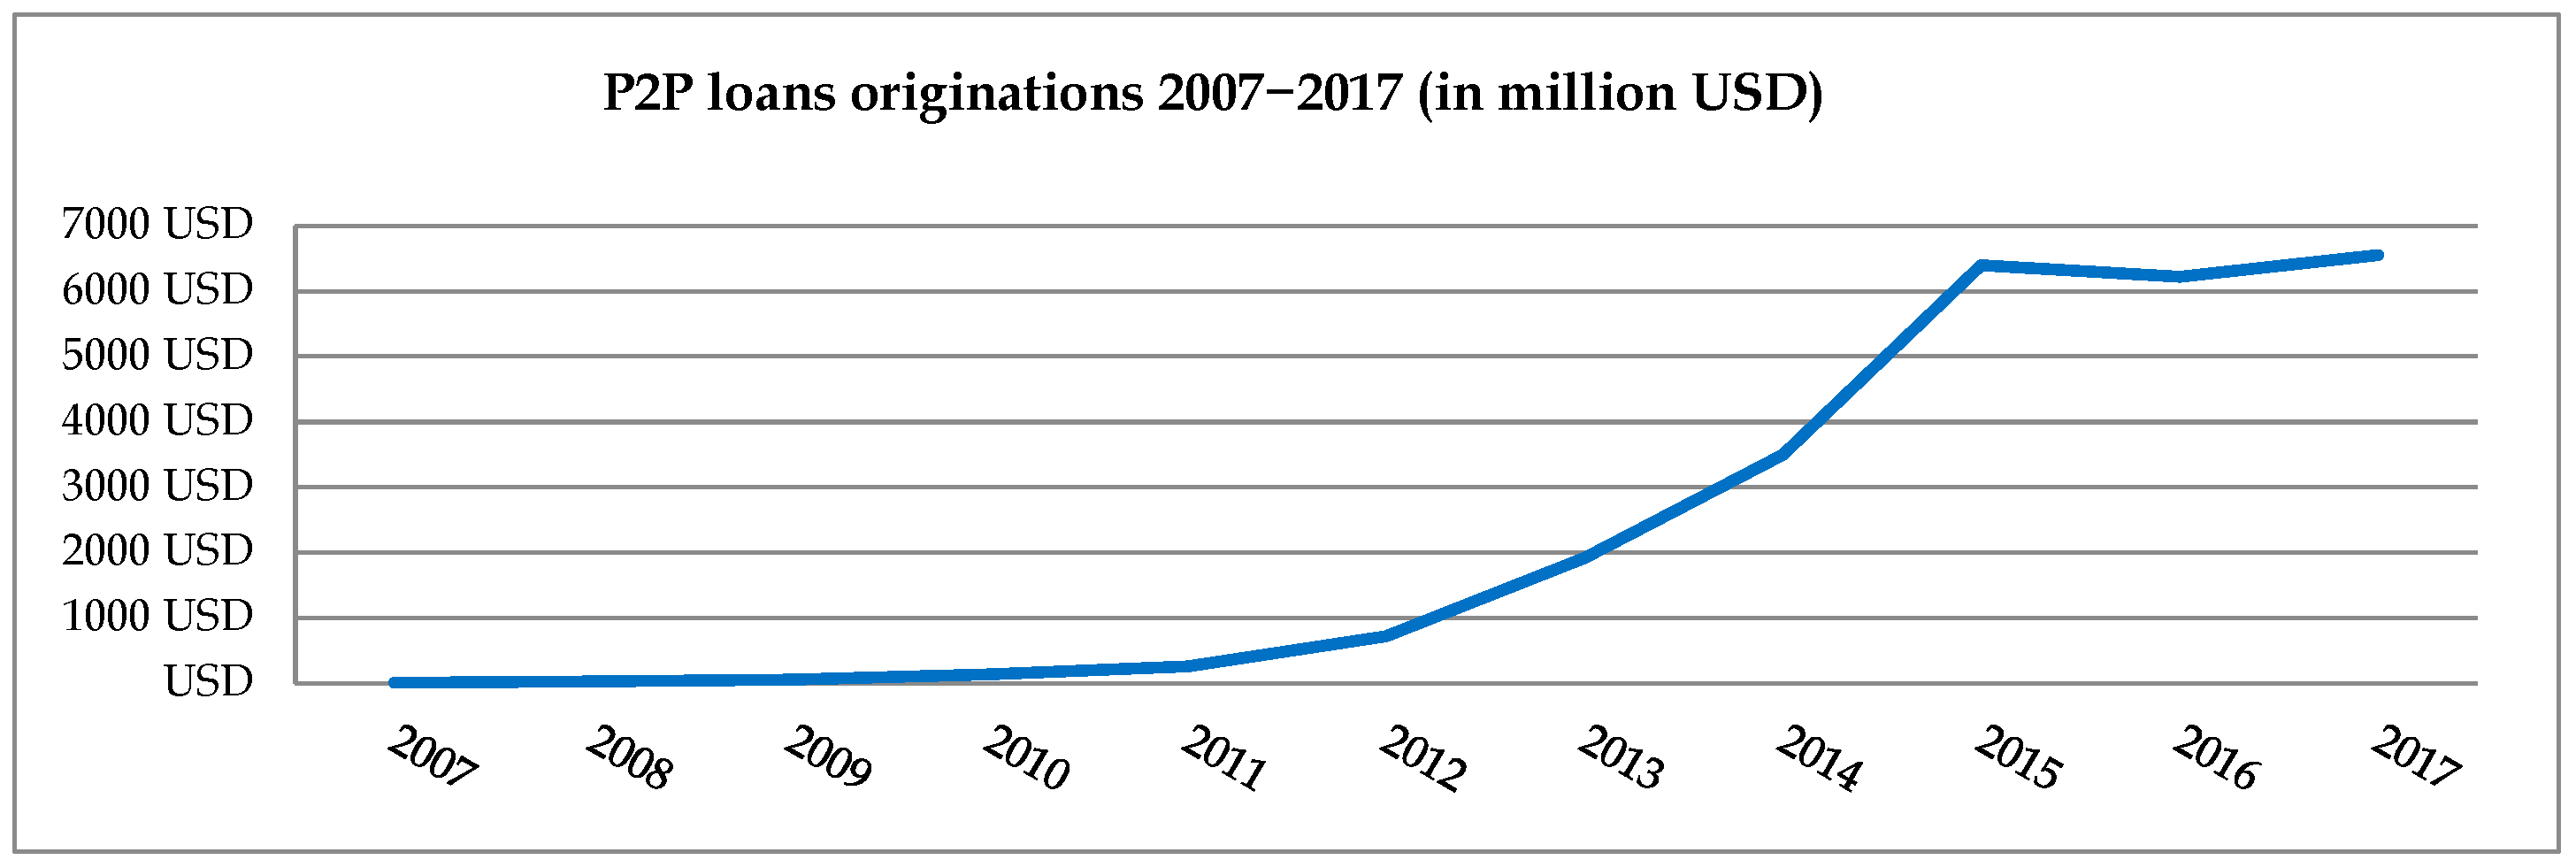
For the period from 2007–2017, Lending Club facilitated more than 25.7 billion USD in loans (total number of loan originations: 1.8 million). The loan originations progressively increased until 2012, and from 2013 onward, they experienced exponential growth.
Figure 2 depicts the growth in P2P loans over the period analyzed.
Table A1 and
Table A2 in
Appendix A show the loan volume (USD) and the number of mortgages and P2P loans, respectively, issued by each state for each year under study.
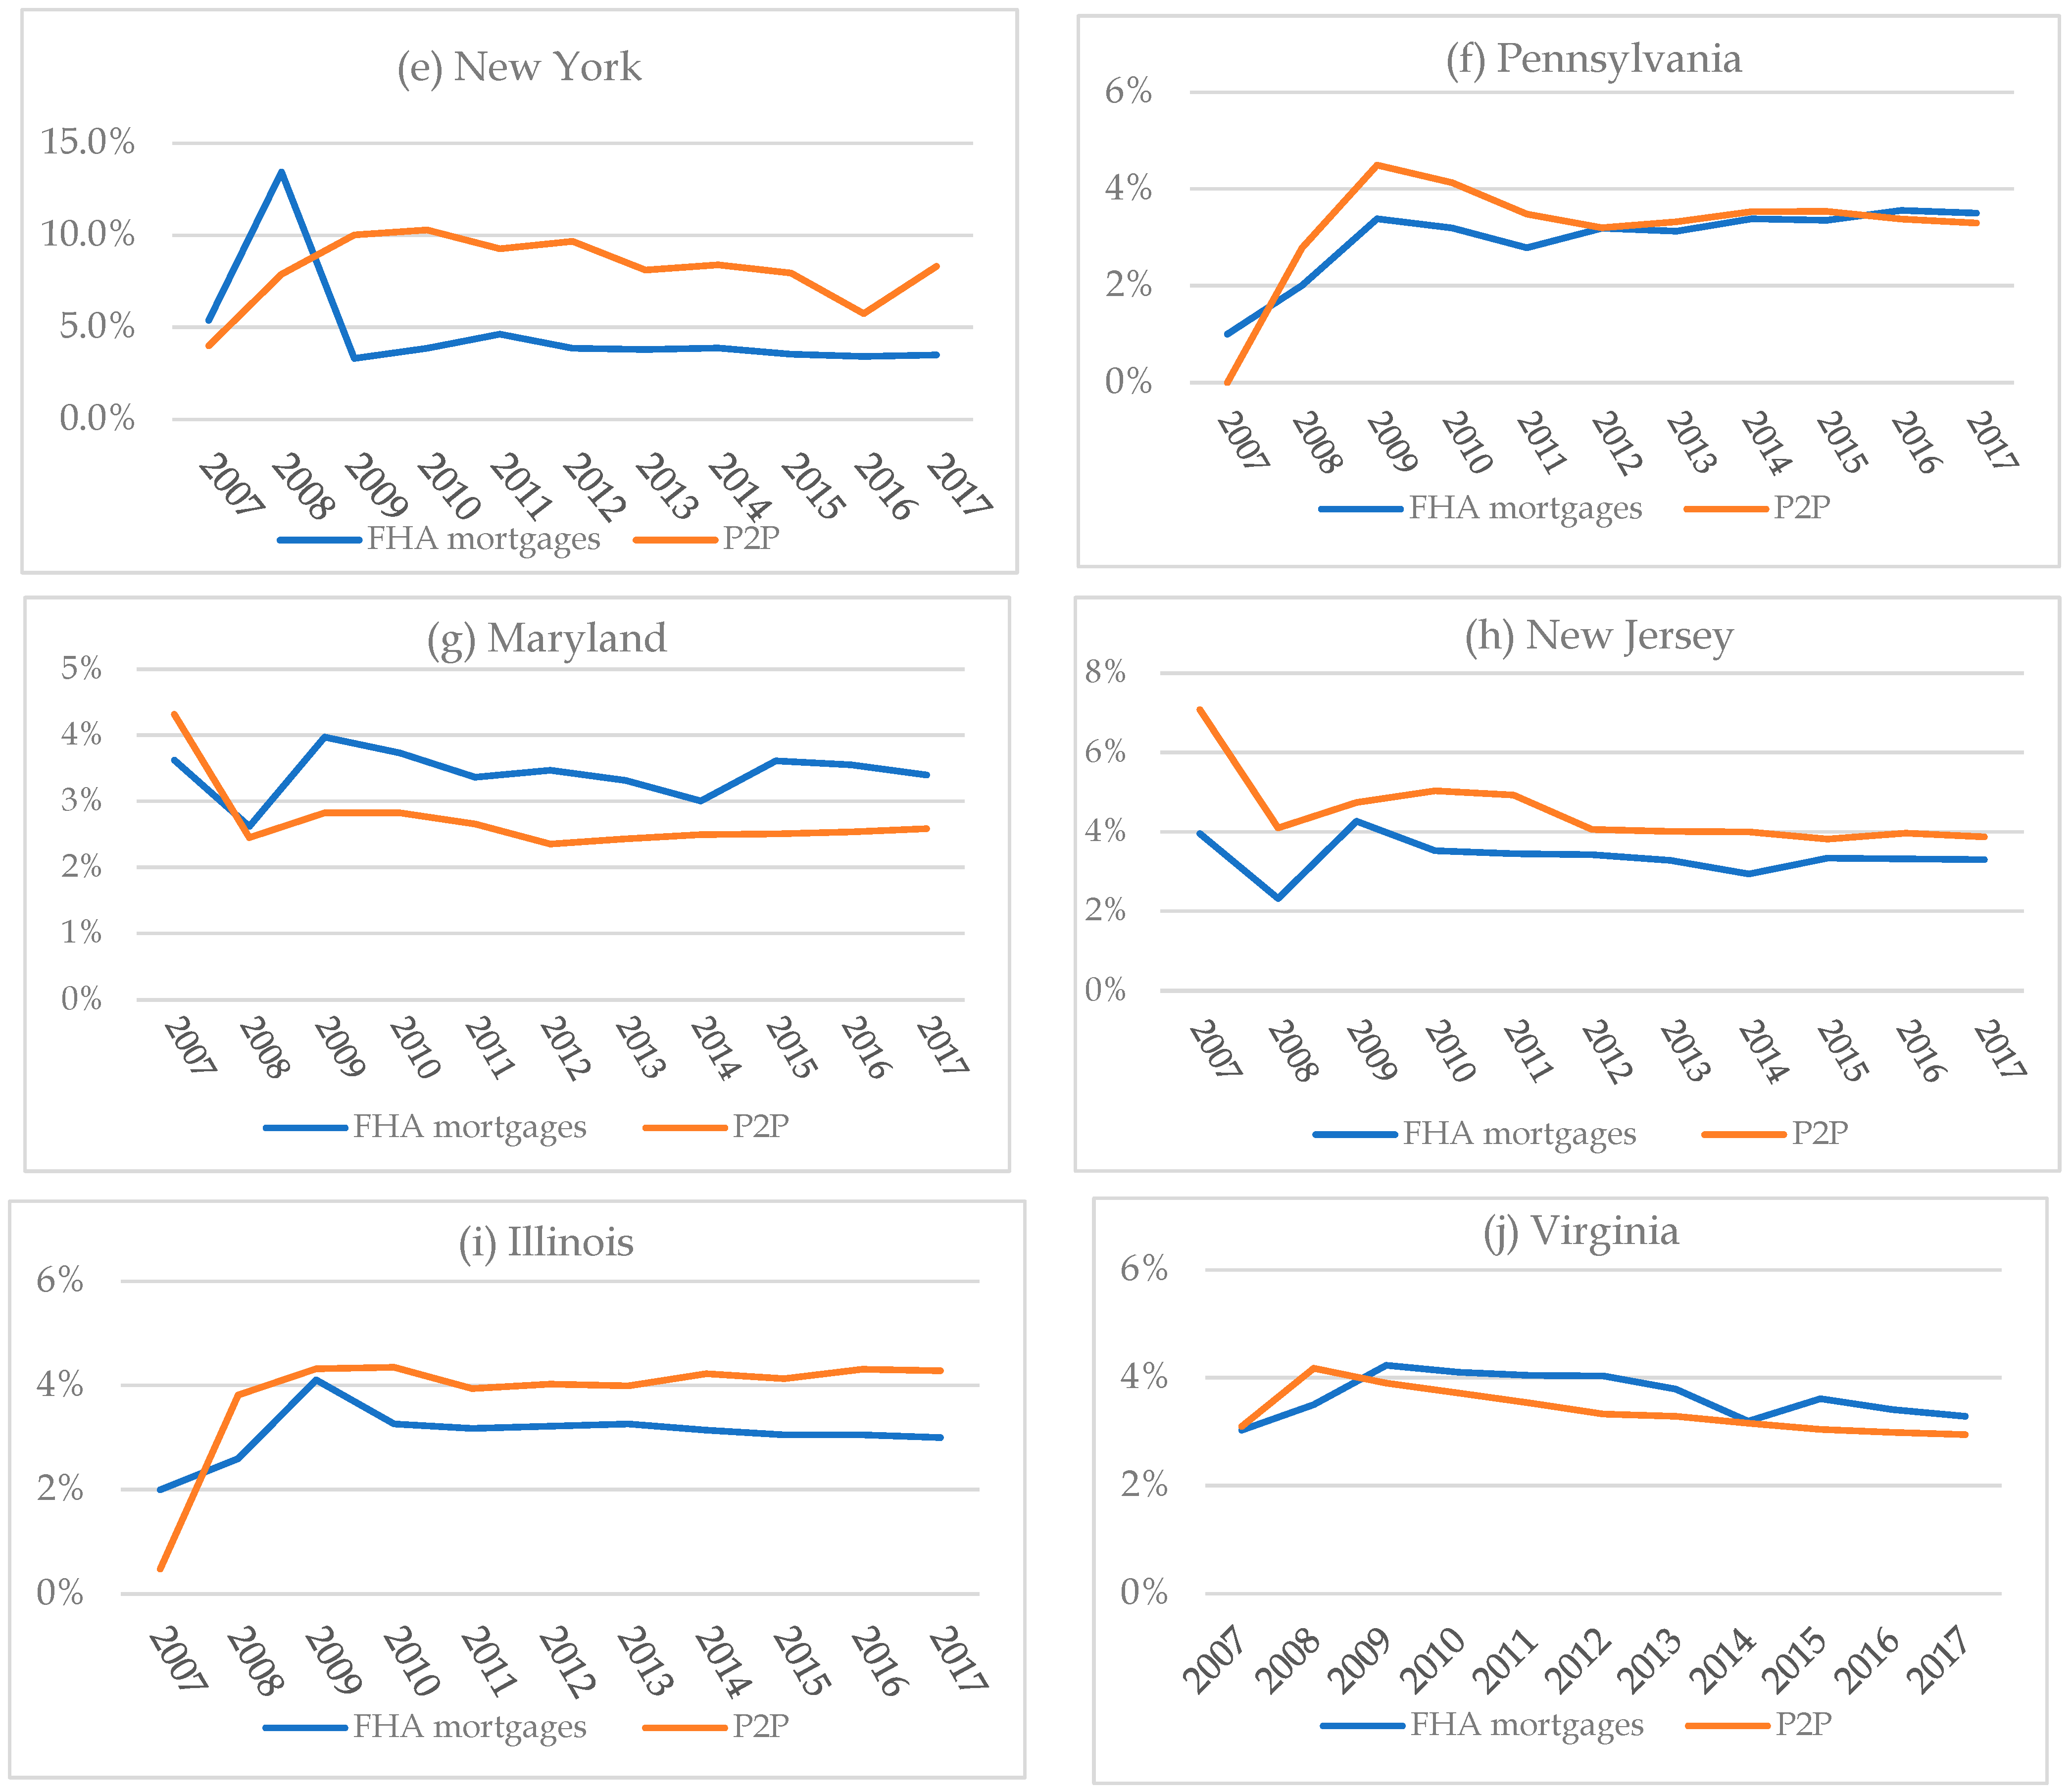
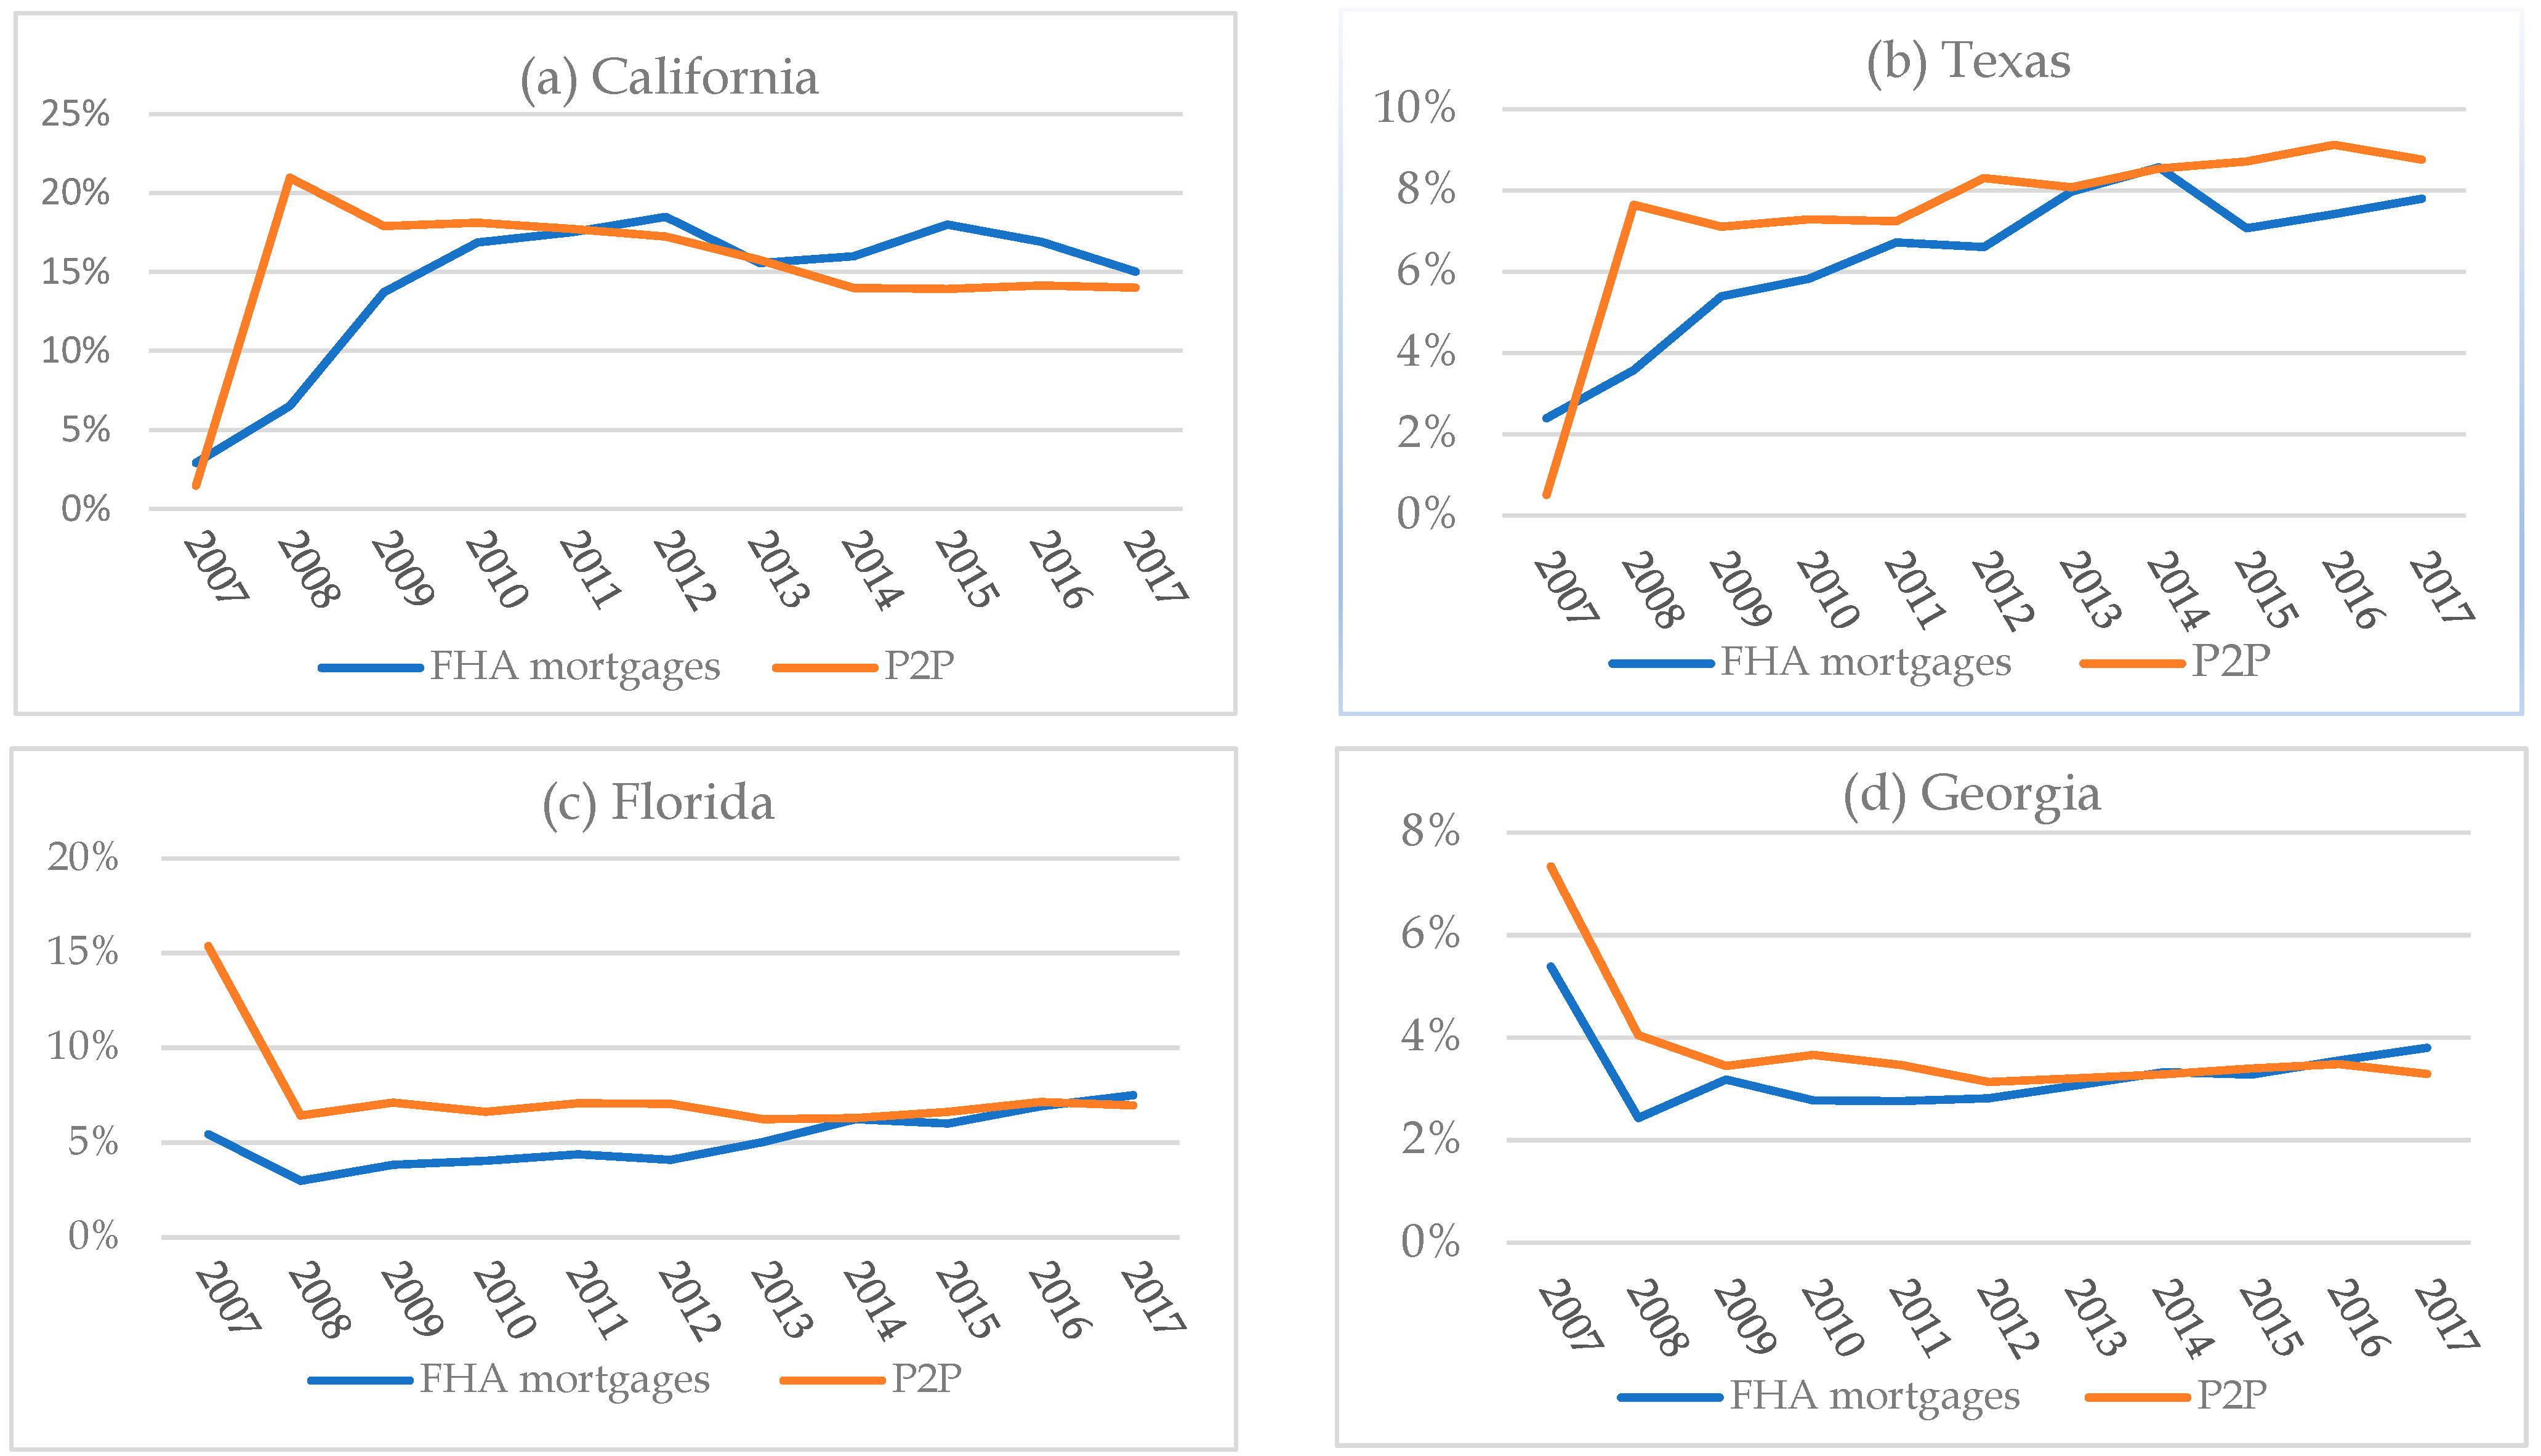
Examining the volume of FHA mortgage and the P2P loan origination in each of the U.S. states, we observe that there are ten states with the highest origination of P2P loans and FHA mortgages. More specifically, 50% of total endorsements of U.S. FHA mortgages are issued in these ten states with more than 60% of total P2P endorsements originated in the same states.
Table A3 in
Appendix A presents the percentages of the total FHA mortgage volume issued in each of these ten states during the eleven-year period in question.
Table A4 shows the corresponding percentages of the total P2P loan volumes issued in each of these ten states. Finally,
Figure A1 illustrates the evolution of P2P loans and FHA mortgages in each of these ten states over time (2007–2017).
The patterns followed by both types of loans in each of these states over time are remarkably similar, confirming our prediction that there is a positive correlation between the increase in P2P credit and the increase in FHA mortgages.
The diagrams illustrate the housing crisis of 2007–2009. The greatest fluctuations are observed in the first three years of the period analyzed (housing crisis period). Following the first three years, the patterns of the two types of loans become quite similar and smoother without remarkable deviations during the entire period in question.
3. Literature Review
The emerging literature on P2P lending is diverse and rapidly growing. Among the different studies investigating the significant impact of FinTech lending on the housing market, this is the first study, to our knowledge, to examine P2P as a source of credit to which borrowers resort to bypass tightened LTV caps and obtain mortgages from conventional banks, thus ensuring equal opportunities to everybody. In this sense, our research contributes to three aspects of financial literature: residential mortgage lending, LTV policy, and P2P lending.
3.1. Changes in Mortgage Lending after Crisis
In a broad sense, this study is related to the literature investigating the structural changes in residential mortgage lending in the U.S. in the aftermath of the financial crisis; for example, see Refs. [
20,
21,
22,
23]. Ref. [
24] measures the mortgage originations in order to quantify the tightness of mortgage credit post-crisis. The author finds that credit tightness resulted in more than one million fewer housing purchase loans per year than would have been originated with reasonable lending standards. Moreover, he assesses the policy actions taken by Federal Housing Finance Agency (FHFA) and FHA, concluding that the FHA still has some important actions to undertake.
Ref. [
25] investigates the increased demand for FHA loans as a result of the expansion of loan limits in 2008. They find evidence that the boom in FHA led to a riskier pool of borrowers than would have existed in the absence of FHA loans.
Another study [
26], using a seemingly unrelated regression model, examines the impact of FHA availability on the overall mortgage market and conventional lending. It shows that FHA endorsements in 2008 were associated with an increase in overall volume originations without substantially displacing conventional loans. In 2014, the FHA impact on overall lending was smaller, but the degree of substitution between FHA and conventional was greater (one-for-one).
3.2. Effectiveness of LTV Cap Policy
This paper is also related to a large body of research, such as [
3,
27,
28,
29], which examines the effectiveness of LTV ratio as a macroprudential tool to constrain loan creation.
Using panel data methods from 46 countries, Ref. [
3] finds that the imposition of an LTV cap reduces credit by 5.9% one year after its implementation, whereas Ref. [
30] finds that macroprudential policies are much more effective in booms than in bust periods.
Based on data from 57 countries over three decades, Ref. [
31] investigates the effect of LTV ceiling imposition on house prices and concludes that there are no significant effects of such a policy.
Ref. [
4] examines the effects of a maximum LTV policy on the behavior of borrowers and finds that the imposition of a more conservative ceiling reduces both probability of arrears and the mean value of loans. Similarly, Ref. [
5] finds the LTV policy to be effective in reducing both household mortgage leverage and systematic risk associated with boom-and-bust cycles in property markets by reducing mortgage delinquency ratios.
Ref. [
32] shows that the effectiveness of macroprudential measures in Europe has been limited by circumvention, particularly through nonbanks when nonbanks are subject to less stringent regulation. Ref. [
33], similarly, shows evidence of leakages to the shadow banking sector. Using cross-country data, their results suggest that macroprudential policies lead to substitution from bank-based financial intermediation to nonbank intermediation.
3.3. Peer-to-Peer Lending in the U.S.
Finally, this study falls into the rapidly growing literature on P2P lending marketplaces in the U.S.; for example, see Refs. [
34,
35,
36].
Ref. [
37] finds that the Lending Club platform penetrates areas where traditional financial institutions are underserved (small number of bank branches per capita), and the portion of the loans increases in areas where the local economy is not performing well.
There are several studies that examine whether crowdlending platforms and traditional banks are substitutes or complements in the credit market. For instance, Ref. [
38] shows that a substantial fraction of the P2P loan volume substitutes the small commercial bank personal loan volume. Thus, small banks appear to lower their borrower quality threshold to curtail volume loss.
Ref. [
39] shows that the P2P lending market both substitutes and complements the traditional banking system. Using a regulatory change to accounting standards (i.e., the implementation of FAS 166/167 in 2011), as an exogenous shock to bank credit supply, Ref. [
39] finds that P2P lending is a substitute for bank lending in terms of serving inframarginal bank borrowers yet complements bank lending with respect to small loans.
Although Ref. [
40] examines the effect of P2P lending on the overall volume of small business loans issued by traditional lenders, in our study we investigate the link between marketplace lending and FHA-insured mortgages. Our results are consistent with the hypothesis that P2P platforms complement banks.
A segment of the existing emergent literature that reviews financial technology explores the rise of FinTech lending in the U.S. mortgage market.
Our paper is close to [
17], which provides a detailed analysis of the growth of shadow banks, particularly FinTech shadow banks, in the residential lending market. It finds a shift in mortgage lending from banks to shadow banks in response to improved technology and post-crisis regulatory burdens on traditional banks.
Similarly, Ref. [
18] shows that FinTech lenders increased their market share of U.S. mortgage lending, as they process mortgage applications faster than other lenders, alleviating capacity constraints associated with traditional mortgage lending.
4. Holmstrom and Tirole’s Model in Our Analysis
The analysis is based on the framework of the Holmstrom and Tirole (1997) model [
41], which allows us to formulate our key empirical prediction: the impact of P2P lending on the effects of changes in loan-to-value caps and mortgage down payment borrower requirements, as in Braggion et al. (2019) [
19]. The rise in down payment requirements from traditional lenders is analogous to a “collateral squeeze”, which restrains credit in Holmstrom and Tirole’s model. We show that the availability of P2P lending allows borrowers to bypass the important LTV cap, neutralizing its effects such that the levels of new credit are not reduced. These results allow us to formulate the empirical prediction for our test.
We construct a principal–agent equilibrium model, based on the abovementioned model, which explains how loan provision and investments are affected by changes in the supply of capital. The fixed investment scale model has three types of agents: firms, intermediaries (banks), and individual (uninformed) investors. This paper examines the effect of firms’ capital tightening (due to a collateral squeeze) on investment behavior and interest rates in the economy. The increase in down payment requirements in FHA-insured mortgages corresponds to this collateral squeeze.
Firstly, we analyze the possibility for financing a project (home purchase) by using indirect financing from banks (“the two-party contract”).
Each firm (borrower) has an asset (down payment) that is pledged as collateral. If the project (I) costs more than the asset (A) available, the borrower must find external funds (I-A) to undertake the investment. The project yields R (success) or 0 (failure). The probability of success depends on whether the borrower exerts effort after the project has received funding. A borrower needs to exert effort to raise the probability of success to pH. The borrower’s private benefit (opportunity cost from managing the project diligently) from not exerting effort is B, which lead to pL, with pH − pL = Δp > 0.
If the project fails, neither party obtains anything. If the project succeeds, the borrower is paid Rb > 0 and the bank is paid Rm > 0. If the borrower does not default, the distribution in returns is R = Rb + Rm.
The open market rate of return-on-investment capital is γ.
The participation constraint for the bank is
and for the borrower is p
HR
b ≥ γA. The incentive constraint for the borrower is p
HR
f ≥ p
LR
b + B, where R
F is the risk-free rate, i.e., the borrower must prefer to be diligent, so that R
b ≥
. The maximum expected income for banks must be
Combining (1) and (2) constraints, we have
We rearrange (3) and have the following condition for the banks to originate a loan:
So, only borrowers with assets (down payment) A ≥ can purchase a house using a residential mortgage issued by traditional banks.
The rise in down payment requirements that was imposed post-crisis on FHA-insured mortgages equals an increase in minimum required assets ( + δ).
Holmstrom and Tirole in 1997 proved that when aggregate firm capital is reduced, investment will decrease and the minimum initial assets will increase. Consequently, poorly capitalized firms will be the first to lose their financing. Similarly, in our study, subprime borrowers, with less available cash, cannot afford the increased minimum down payment and will be excluded from the mortgage market, leading to a decrease in the FHA loan volume.
When we introduce P2P lending in the model, the outcome on the housing market is reversed. When a borrower fails to obtain a mortgage from a bank due to insufficient assets (down payment), they use P2P lending to cover the difference δ and the minimum required down payment (‘the three-party contract”).
The participation constraint for the P2P lender is
The participation constraint for the banks becomes
The incentive constraint for the borrower remains
The distribution of returns becomes
Therefore, this analysis allows us to formulate the hypothesis that P2P lending has a positive effect on FHA mortgage origination, which is tested in
Section 5.
5. Data and Description of Variables and Methodology
To explain the increase in FHA mortgages in the years during and after the financial crisis, we must consider both macroeconomic and financial factors. One of the most important factors is expected to be crowdlending.
We employ annual data over the period 2007–2017 for all 50 U.S. states. Thus, we consider a panel with 50 cross-sectional units and 11 time-series observations per unit. We assemble a hand-collected database containing FHA loan originations and examine nine factors that are considered as important determinants of the changes in the FHA mortgage market. The volume of FHA mortgage loans is the dependent variable in our model and the variables P2P lending, interest rate, GDP per capita, unemployment rate, house price Index, new residential housing units, population growth, broad money, and consumer confidence index are the independent variables.
The following regression model is used for the analysis:
Among them,
i identifies a particular state,
t denotes time (year), and FHA is the FHA-insured mortgage volume of state
i in time
t. β
0 is a constant, β
1 to β
9 are the coefficients of the independent variables, and u
it is the random error term. All the variables are summarized in
Table 2.
5.1. Dependent Variable
The volume of FHA mortgage loans is the dependent variable in our model. Information on the majority of U.S. mortgage loans is available in the Home Mortgage Disclosure Act of 1975 (HMDA). The Federal Financial Institution Examination Council (FFIEC) requires financial institutions to maintain, report, and publicly disclose information about home-lending activity every year. Data include, among others, the year, state, loan amount, loan type, and the borrower’s income, race, and ethnicity.
5.2. Explanatory Variables
In the literature, various economic indicators have been proposed as factors that affect the endorsements of mortgages. In this study, we examine the economic and financial factors that may affect the FHA mortgage market. These are in accordance with previous studies, such as [
1,
42,
43], but also enhanced with variables that emerge because of unusual economic conditions (financial crisis).
The P2P is the main variable of interest. Other factors equal, a positive association between FHA-insured mortgage loans and P2P lending is expected, since P2P loans may be used as a source of financing the increased mortgage down payment. This study uses data from Lending Club, the largest P2P platform in the U.S. The original dataset contains 1,756,154 borrowing records.
Many studies consider the interest rate and the GDP per capita as important economic factors that affect the mortgage market.
The interest rate reflects the conditions in the credit market. Higher interest rates increase the cost of borrowing, lowering the demand for houses [
44,
45]. In this study, we use the effective federal funds rates (EFFR).
GDP per capita is an indicator of economic development and standard of living. Ref. [
46] noted that GDP growth has a positive impact on the housing market. High GDP per capita indicates high purchasing power and high demand for houses, increasing the mortgage uptake.
In the literature, the unemployment rate has been assessed as a factor that also affects mortgage endorsements. Ref. [
47] argues that the unemployment rate has an impact on the ability of potential borrowers to take up mortgages. Ref. [
48] claims that lack of job security affects the ability to access housing loans. Thus, we expect rising unemployment to reduce the demand for housing.
Many studies suggest that population growth is another factor that affects housing demand and explains the fluctuations in the housing market. For instance, Refs. [
49,
50] study the relationship between demographics and the housing market. We expect that an increase in population increases the demand for residential mortgage loans.
Another variable that is introduced in our model is the house price index. Based on this index, an increase in housing prices is expected to be negatively related to the volume of mortgages.
Two additional factors are also included in our study: broad money and residential housing units. Broad money represents the money supply in an economy. According to [
51], excessive money supply may lead to an inflationary environment and might affect investments and mortgage uptake. So, we expect that an increase in broad money has a negative effect on mortgage originations. Additionally, an excess supply of houses leads to a decrease in prices. So, new housing units are expected to be positively correlated to the demand for housing loans.
Finally, the consumer confidence index is another important economic indicator for investors and measures how optimistic consumers are regarding both their financial situation and the overall economic outlook. Confidence increases the willingness for house purchases and leads to an increase in new granted mortgages.
To determine the relevant factors that affect the FHA mortgages, this study employs the panel data model. Before proceeding to estimate the model, a multicollinearity test and correlation analysis was carried out.
6. Presentation and Discussion of Empirical Results
Table 3 presents the descriptive statistics of the variables. Apart from the variables UR, HPI, CCI, and BM, all the other independent variables and the dependent variable are log-transformed to reduce data variability.
The higher the coefficient of variation (CV) is, the greater the level of dispersion around the mean. CCI, HPI, GDP per capita, POPUL, NHU, P2P loans, and FHA loans have a lower CV value. However, this is not the case for UR, IR, and BM growth rate.
Table A5 in
Appendix A lists the U.S. states along with the varying median across state variables (FHA mortgages, P2P loans, GDP per capita, unemployment rate, house price index, new residential housing units growth rate, and population growth) during the sample period. As can be observed, there are considerable differences in the values of these parameters across the states.
Although the panel data model can better solve the collinearity problem compared with cross-sectional and time-series models, there is also the possibility of intercorrelations and interassociations among the independent variables. A high degree of multicollinearity makes the model estimation of the coefficients unstable and significantly inflated the standard errors of the coefficients.
Thus, we tested multicollinearity using the variance inflation factor (VIF) method. Based on the results shown in
Table 4, we can see that the VIF of all variables is below 10; therefore, there is no collinearity problem as there is no linear association among predictor variables. Moreover, the tolerance value (1/VIF) is greater than 0.10, indicating that variables are not correlated.
Correlation analysis is also carried out to measure the strength of the relationship between the variables considered in the study. Pearson’s moment correlation coefficient test is used to measure the degree of correlation between two variables with the correlation coefficient varying between +1 and −1. A value of ±1 indicates a perfect correlation between the two variables.
Table 5 shows the correlation among all the chosen variables.
Our results show that there is a highly negative relationship between interest rate (IR) and unemployment rate (UR) and a highly positive correlation between IR and the broad money growth (BM). The inflationary pressure that the BM creates justifies this highly positive correlation with the IR variable; i.e., a higher inflation rate explains a higher interest rate. On the other hand, job loss and the inability of people to save or borrow money may also justify this highly negative correlation with the interest rate, i.e., the higher the UR the lower the IR.
Afterward, we observe a highly negative correlation between UR and the consumer confidence index (CCI) (−0.5179). A possible explanation is that when the unemployment rate increases, the optimism that the CCI captures decreases. Concerning the positive correlation between GDP per capita and house price index (HPI) (0.4670), it can be explained by the following: as GDP per capita increases, personal income increases as well, which means that the demand in the housing market may also rise, thus increasing house prices.
The panel data estimation is employed to capture the impact of the explanatory variables (P2P lending, interest rate, GDP per capita, unemployment rate, house price index, new residential housing units, population growth, broad money growth and consumer confidence index) on the explained variable (FHA mortgages). For the estimation, two techniques of panel data analysis are used: fixed effects model (FE) and random effects model (RE).
The difference between the FE and RE models is that in the RE model, unlike the FE model, the variation across entities is assumed to be random and not correlated with the predictor or independent variables of the model.
The selection between these two models is made using the Hausman test, with the preferred model being the RE model under the null hypothesis and the preferred model being the FE model under the alternative hypothesis.
The Hausman test gives a ch2 = 61.10 and p-value > chi2 = 0.000, p-value is less than 0.05, demonstrating that the hypothesis test is statistically significant, the null hypothesis is rejected, and the FE model is preferred.
Table 6 below presents the estimation results from Equation (9) using the FE model.
The modified Walt test is used for groupwise heteroscedasticity in the residuals of the FE regression model. The results (
p-value < 0.05) indicate that we must reject the null hypothesis of homoscedasticity. The heteroscedasticity robust HR-test introduced in Ref. [
52] is used to identify serial correlation in the error term in our panel data model. The null hypothesis is no first order autocorrelation. The HR-test confirms a statistically significant correlation in the error term in the model (
p-value < 0.05).
Because of the problems of heteroscedasticity and serial correlation, the Driscoll and Kraay standard errors (D-K Std. Err.) estimation model is used to manage these issues. This model proposes a nonparametric covariance matrix estimator that is spatially and temporally independent.
Table 7 below presents the estimation results from Equation (9) using the D-K Std. Err. model.
The regression results with the D-K Std. Err. model show that the value of the adjusted R2 has increased in comparison with the adjusted R2 with the FE model (which was 0.4256) and is now significant. This adjusted R2 of the D-K Std. Err. model (0.67) shows that the independent variables included in the model can explain most of the variation in the dependent variable.
Furthermore, we checked the normality of residuals since it helps to ensure that the model’s assumptions are met and that the data fits well to our model. The assumption is that the error terms are normally distributed; thus, the estimators are efficient and have desirable statistical properties such as minimum variance. To assess normality, we use the statistical test of Shapiro–Wilk. The results of the test indicate that the residuals are normally distributed because the p-value is greater than the conventional significance level of 0.05.
The estimated coefficients of the variables included in the model confirm our hypotheses about the signs of the coefficients. For example, the sign of the interest rate coefficient is now negative, as expected, (while with the FE model the sign is positive) and the sign of the new house units coefficient has a positive and statistically significant effect on FHA mortgages (while with the FE model this correlation was significantly negative). Moreover, the sign of the unemployment rate variable remains negative (as expected), but in the regression with the D-K Std. Err. model, it becomes statistically significant at the 10% level. The P2P, GDP per capita, and POPUL coefficients carry the expected sign and are significant at the 1% confidence interval. The coefficient of P2P lending is positive and highly significant. This finding indicates that as more P2P loans are issued, the higher the volume of FHA mortgage origination. Therefore, the main hypothesis of our analysis is fulfilled (that an increase in P2P loans is strictly related to an increase in FHA mortgages).
The variable GDP per capita has a positive and statistically significant (at 1% level) effect on real FHA mortgages, as expected. Specifically, a 1% increase in GDP per capita is associated with about a 0.97% increase in FHA loans. The same holds between FHA mortgages and population with a 1% increase in the population leading to a 0.58% increase in FHA mortgages.
Finally, BM growth has to have a statistically significant (at 10% level) and negative impact on FHA mortgages, with a 1% increase in the variable leading to a 0.028% decrease in FHA mortgages.
7. Discussion of Results
The main aim of our study is to examine the relationship between the volume of FHA mortgages and P2P lending, considering various economic and financial factors, and the possibility of financial inclusion of underserved borrowers.
Indeed, based on our results, the initial hypothesis of our study, that there is a positive relationship between crowdlending and FHA mortgages, is verified. P2P lending has a positive and statistically significant (at the 1% level) impact on the volume of FHA mortgages, which is in line with the existing literature supporting that FinTech lending has a significant impact on the housing market. However, among the studies that investigate FinTech lending as a substitute for traditional mortgage lending (banks), this study is the first to examine P2P as a source of financing for subprime borrowers to obtain FHA mortgages from conventional banks. Based on our analysis, P2P lending can be a strong alternative for house buyers who do not fulfill the typical criteria required to obtain a FHA mortgage for their purchase. As a result, P2P reinforces the housing market and the economy as a whole, thus contributing to its sustainability.
Another result, also strictly related to sustainability, is the highly positive and statistically significant impact (coefficient 0.969) of the GDP per capita variable on FHA mortgages. This finding is in line with various studies in the literature, such as Refs. [
42,
46], and shows that a unit increase in the GDP per capita drives a significant increase in the volume of FHA mortgage loans. “GDP per capita” is a crucial variable in our analysis and its increase is directly related to the sustainability of the economy concerning economic growth, higher income, and improvement in people’s welfare that may also drive an increase in the housing demand.
Population growth is another important factor in our study that also has a positive and significant impact (coefficient +0.5811) on FHA originations and promotes sustainability in terms of economic growth, housing demand, and improvement in living conditions. This result is straightforward since the greater the population, the greater the housing needs, and is also shown in the existing literature such as Ref. [
49], the results of which are directly comparable to ours (coefficient +0.337).
A positive relationship is also observed between the volume of FHA mortgages and the new residential housing units. This result is strictly related to the law of supply and demand. If the market functions well, then an excess supply of houses lowers house prices, and boosts the housing market and the economy growth. So, we can safely conclude that if the market functions well, a positive relationship between FHA mortgages and new residential housing units contributes to the sustainability of the economy in terms of economic growth and welfare.
Other important variables in our analysis that also significantly affect the volume of FHA mortgage loans in a negative way are broad money growth, unemployment rate, and interest rate. Studies such as Refs. [
51,
53] concerning money supply, Ref. [
54] concerning interest rate, and Refs. [
47,
48] concerning the unemployment rate, among others, indicate similar results to our study and show this negative relation between those variables and the volume of mortgages. An increase in these variables drives a significant decrease in the volume of FHA mortgages, which actually harms the sustainability of an economy. More specifically, an increase in the interest rate implies an increase in the cost of borrowing: an increase in the unemployment rate reinforces a sense of uncertainty, lowering people’s willing to spend or to borrow, and the broad money growth increases inflationary pressures. An increase in these variables lowers the demand in the housing market, thus increasing poverty and the income discrepancies among segments of the population, and harming sustainability.
8. Conclusions
In this paper, we set under examination the determinants of the FHA mortgage volume in the years following the financial crisis, where mortgage credit was tight and borrowers’ creditworthiness particularly low. We examine all 50 U.S. states in the period from 2007 to 2017 and run a correlation analysis for various variables as determinants of FHA mortgages.
The models used for the relationship analysis between FHA mortgage loans and crowdlending are the fixed effects and the Driscoll and Kraay standard errors models, which are used to address the problems of heteroscedasticity and serial correlation. The variables used in the analysis are interest rate, GDP per capita, unemployment rate, house price index, new residential housing units, population, broad money growth rate, and consumer confidence index.
Based on our results from the panel data analysis, we conclude that P2P lending, the GDP per capita, unemployment rate, interest rate, new residential housing units, population growth, broad money growth rate, and the consumer confidence index are significant determinants for the volume of FHA mortgages. More specifically, we show that there is a positive and significant relationship between the volume of FHA mortgages and P2P lending, GDP per capita, population growth, and new residential housing units, and a significant negative relationship with unemployment rate, interest rate, consumer confidence index and broad money growth rate.
An interesting result of our analysis is that we considered P2P lending as a factor of FHA loan volume, since P2P loans are used as a source for financing the increased down payment requirements. The empirical evidence of this study supports the hypothesis that an increased volume in P2P loans had a positive and significant impact on FHA mortgages for the period 2007–2017, in line with the SDGs for sustainable finance and economic inclusion, adopted by the United Nations.
P2P lending has various financial advantages such as flexibility, simplified process, speed, lower lending standards, and higher returns for investors. Beyond the financial advantages, P2P lending also creates social impact. In this context, crowdlending can provide financial resources to underserved people who have limited or no access to the traditional banking system due to their lack of credit history, lack of collateral, or other barriers. In this way, poverty, economic inequalities, and regional economic disparities may be reduced, and sustainable development with social and economic equity may be promoted.
In our paper, we show that P2P lending can contribute to a country’s sustainable development goals, mainly through the financial inclusion. Thus, this analysis concerning the relationship between the volume of FHA mortgages and various economic and financial factors, with an emphasis on P2P lending, is directly related to the notion of sustainability.
Nonetheless, it is crucial to note that while crowdlending has the potential to contribute to sustainable growth, there are also associated risks, such as borrowers defaulting and regulatory complexities. Thus, it is recommended that policy decision-makers establish a regulatory framework for the crowdlending market, analogous to that of traditional banking system, and an effective mechanism for assessing and managing risks.
Based on our results, the policy intervention that imposes limits on LTV ratios as a tool to constrain mortgage lending has proved ineffective, since it is eluded via the P2P credit channel. Even if P2P loans concern small amounts, they drive an increase in household debt and mortgage lending. In light of this research, one potential approach to contain household leverage would be for macroprudential regulation to design additional tools, to monitor not only LTV but other indicators as well. With appropriate regulation, crowdlending can contribute to a more inclusive and resilient economy.


