
Environmental Impact Analysis to Achieve Sustainability for Artisan Chocolate Products Supply Chain

 ,
,  , , and
Abstract
:
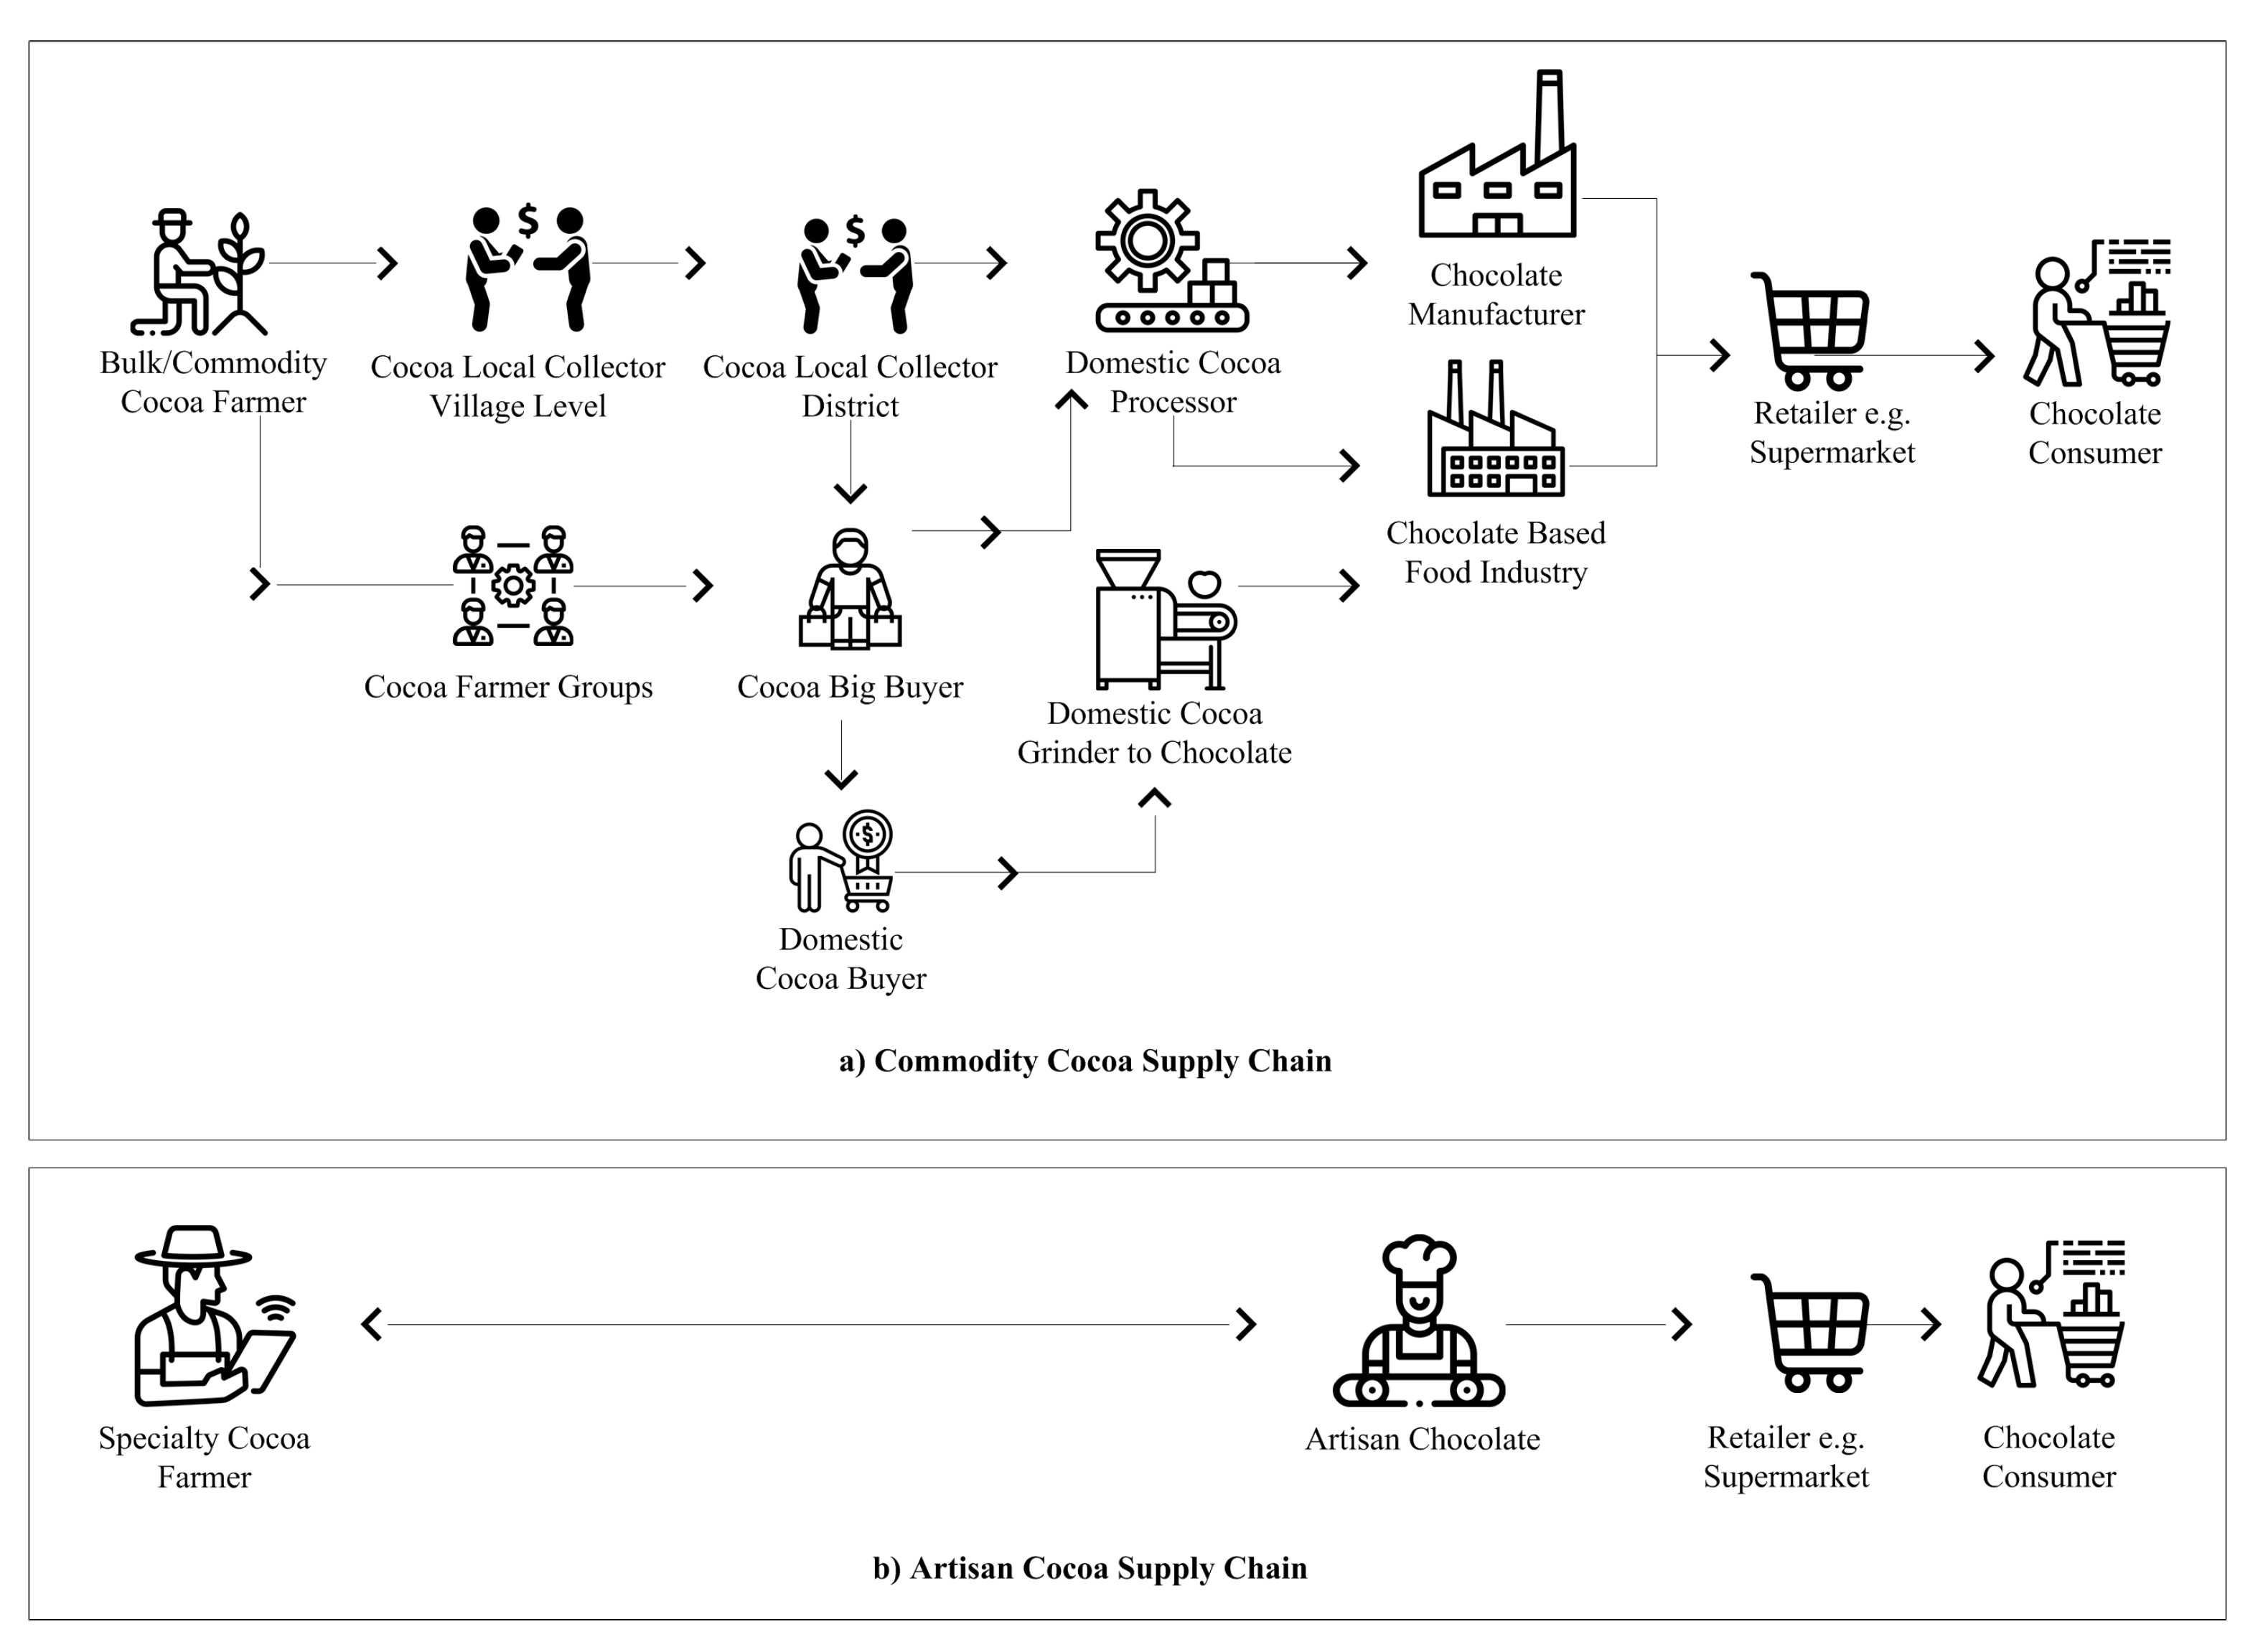
1. Introduction
2. Materials and Methods
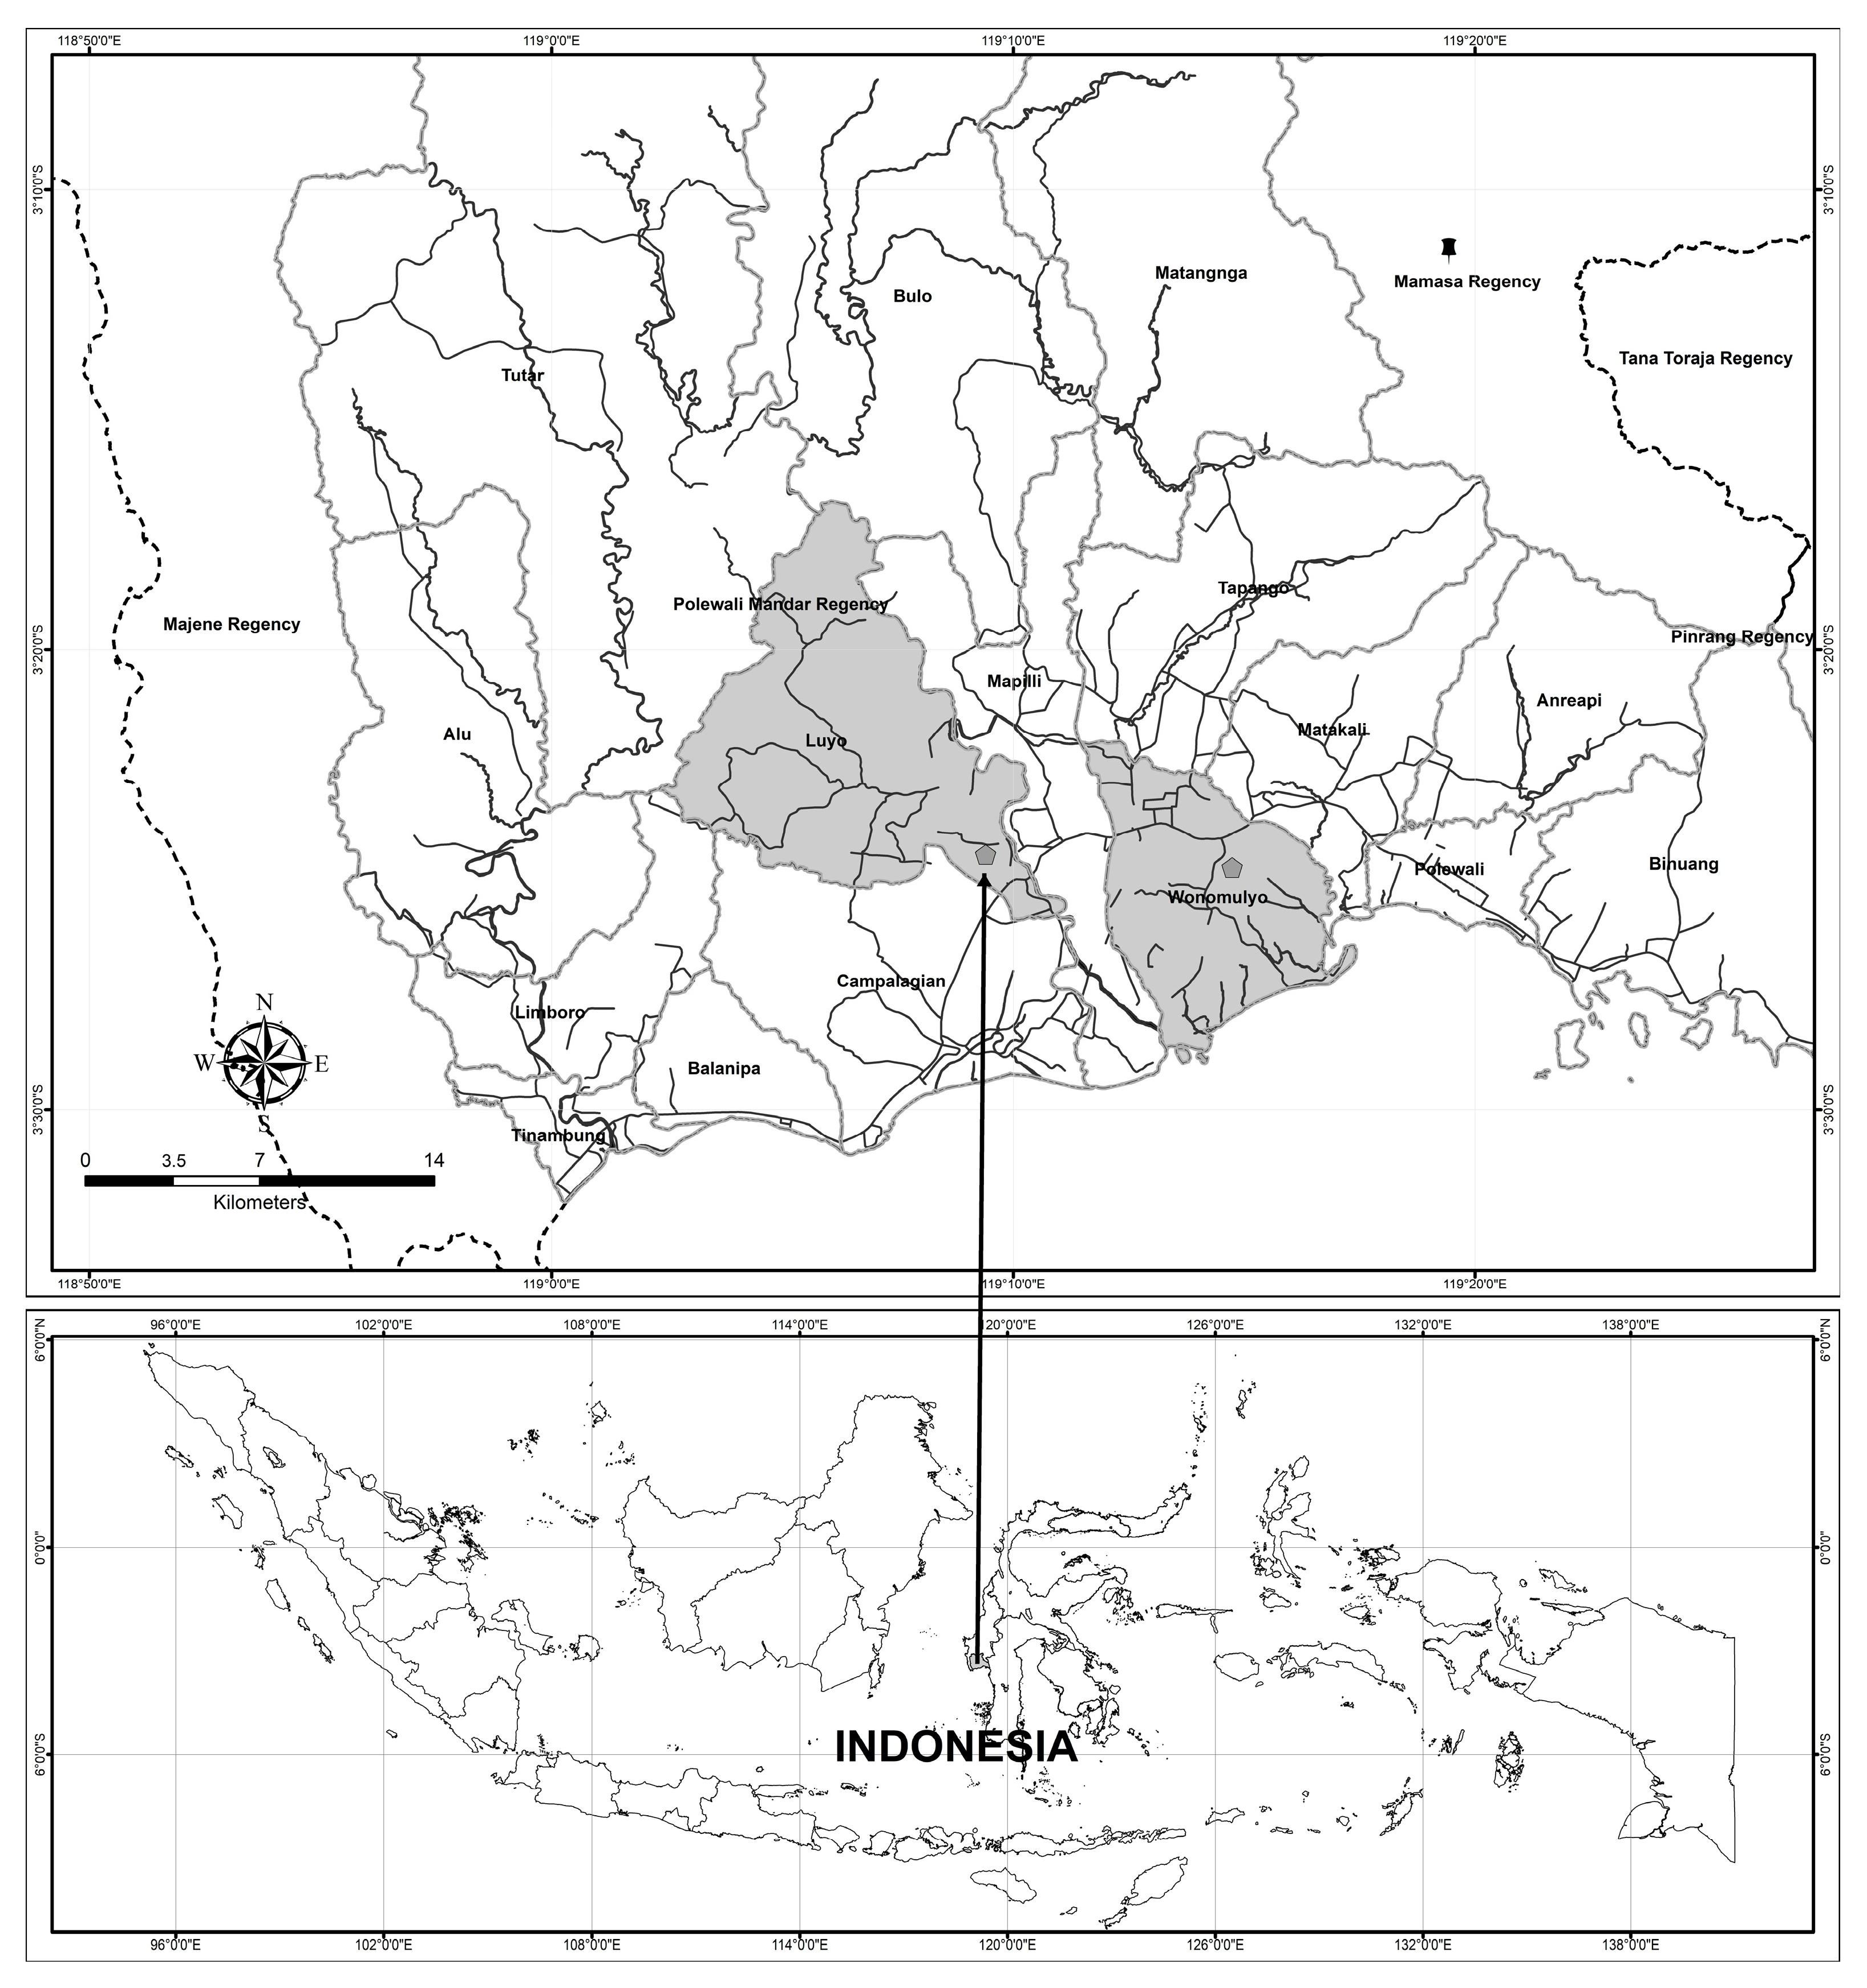
2.1. Study Site
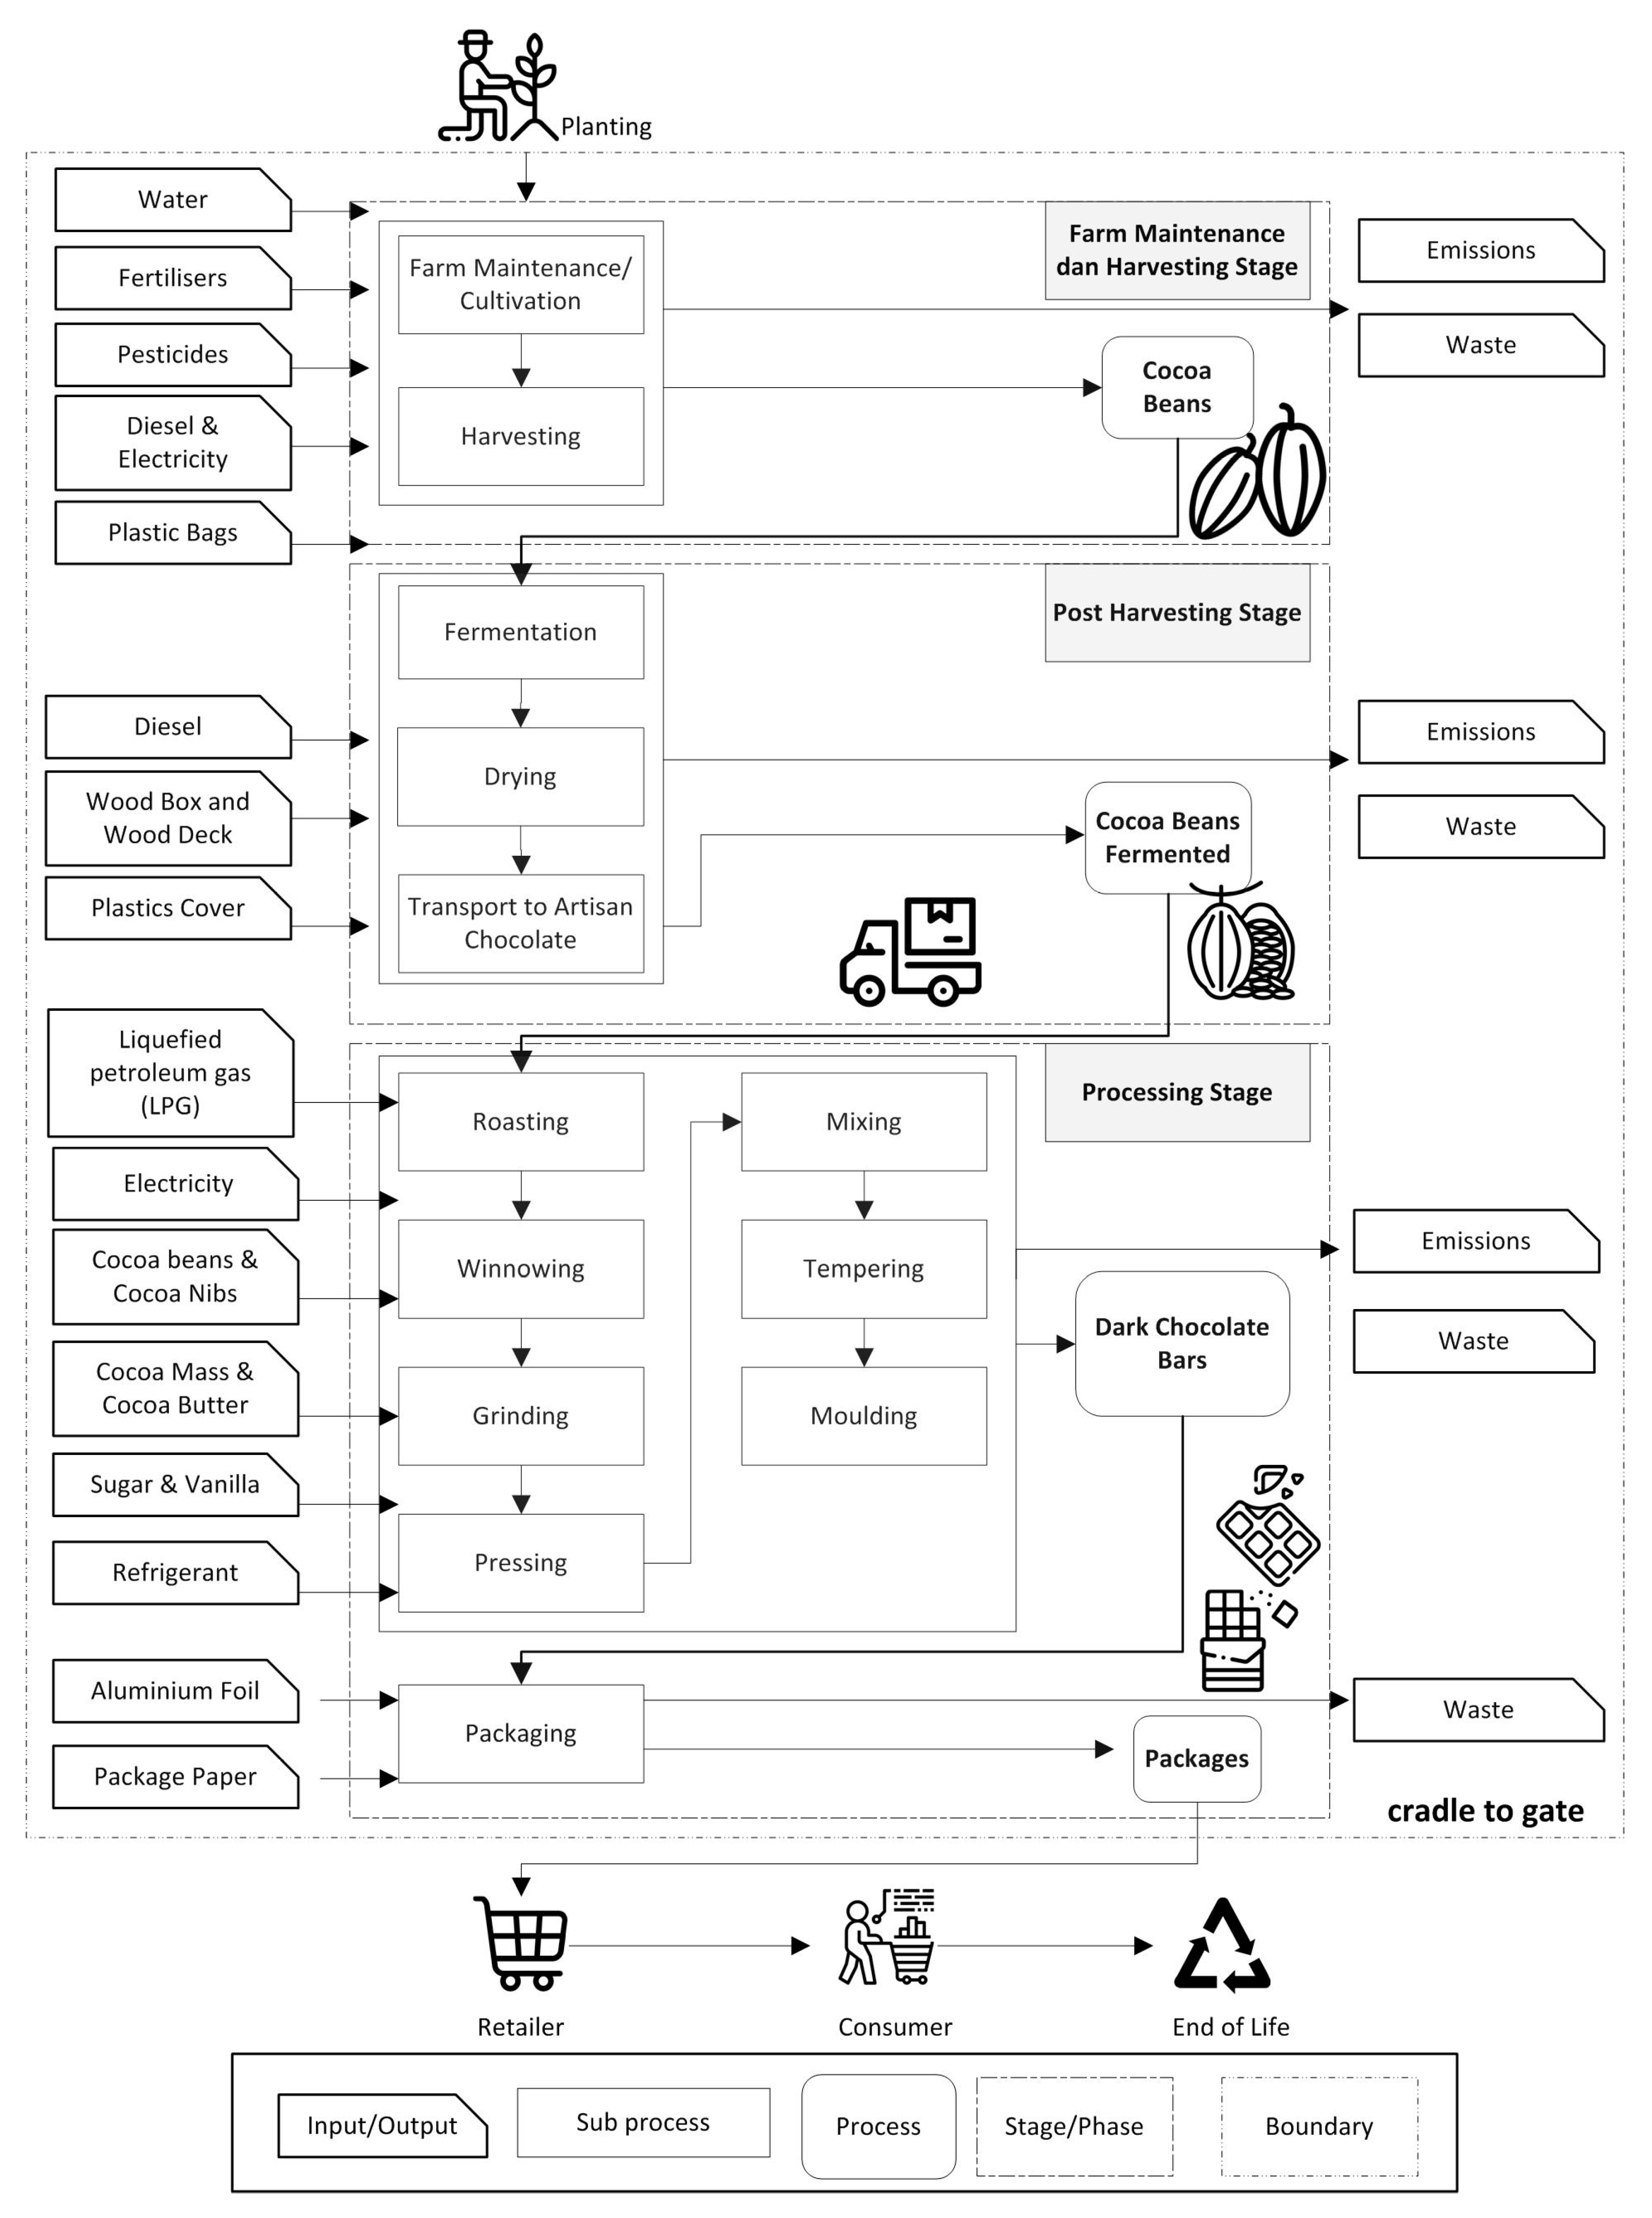
2.2. System Boundaries
2.3. Impact Assessment Indicators
2.4. Life-Cycle Inventory
2.4.1. Farm Maintenance and Harvesting Stage
2.4.2. Post-Harvesting Stage
2.4.3. Processing Stage
3. Results
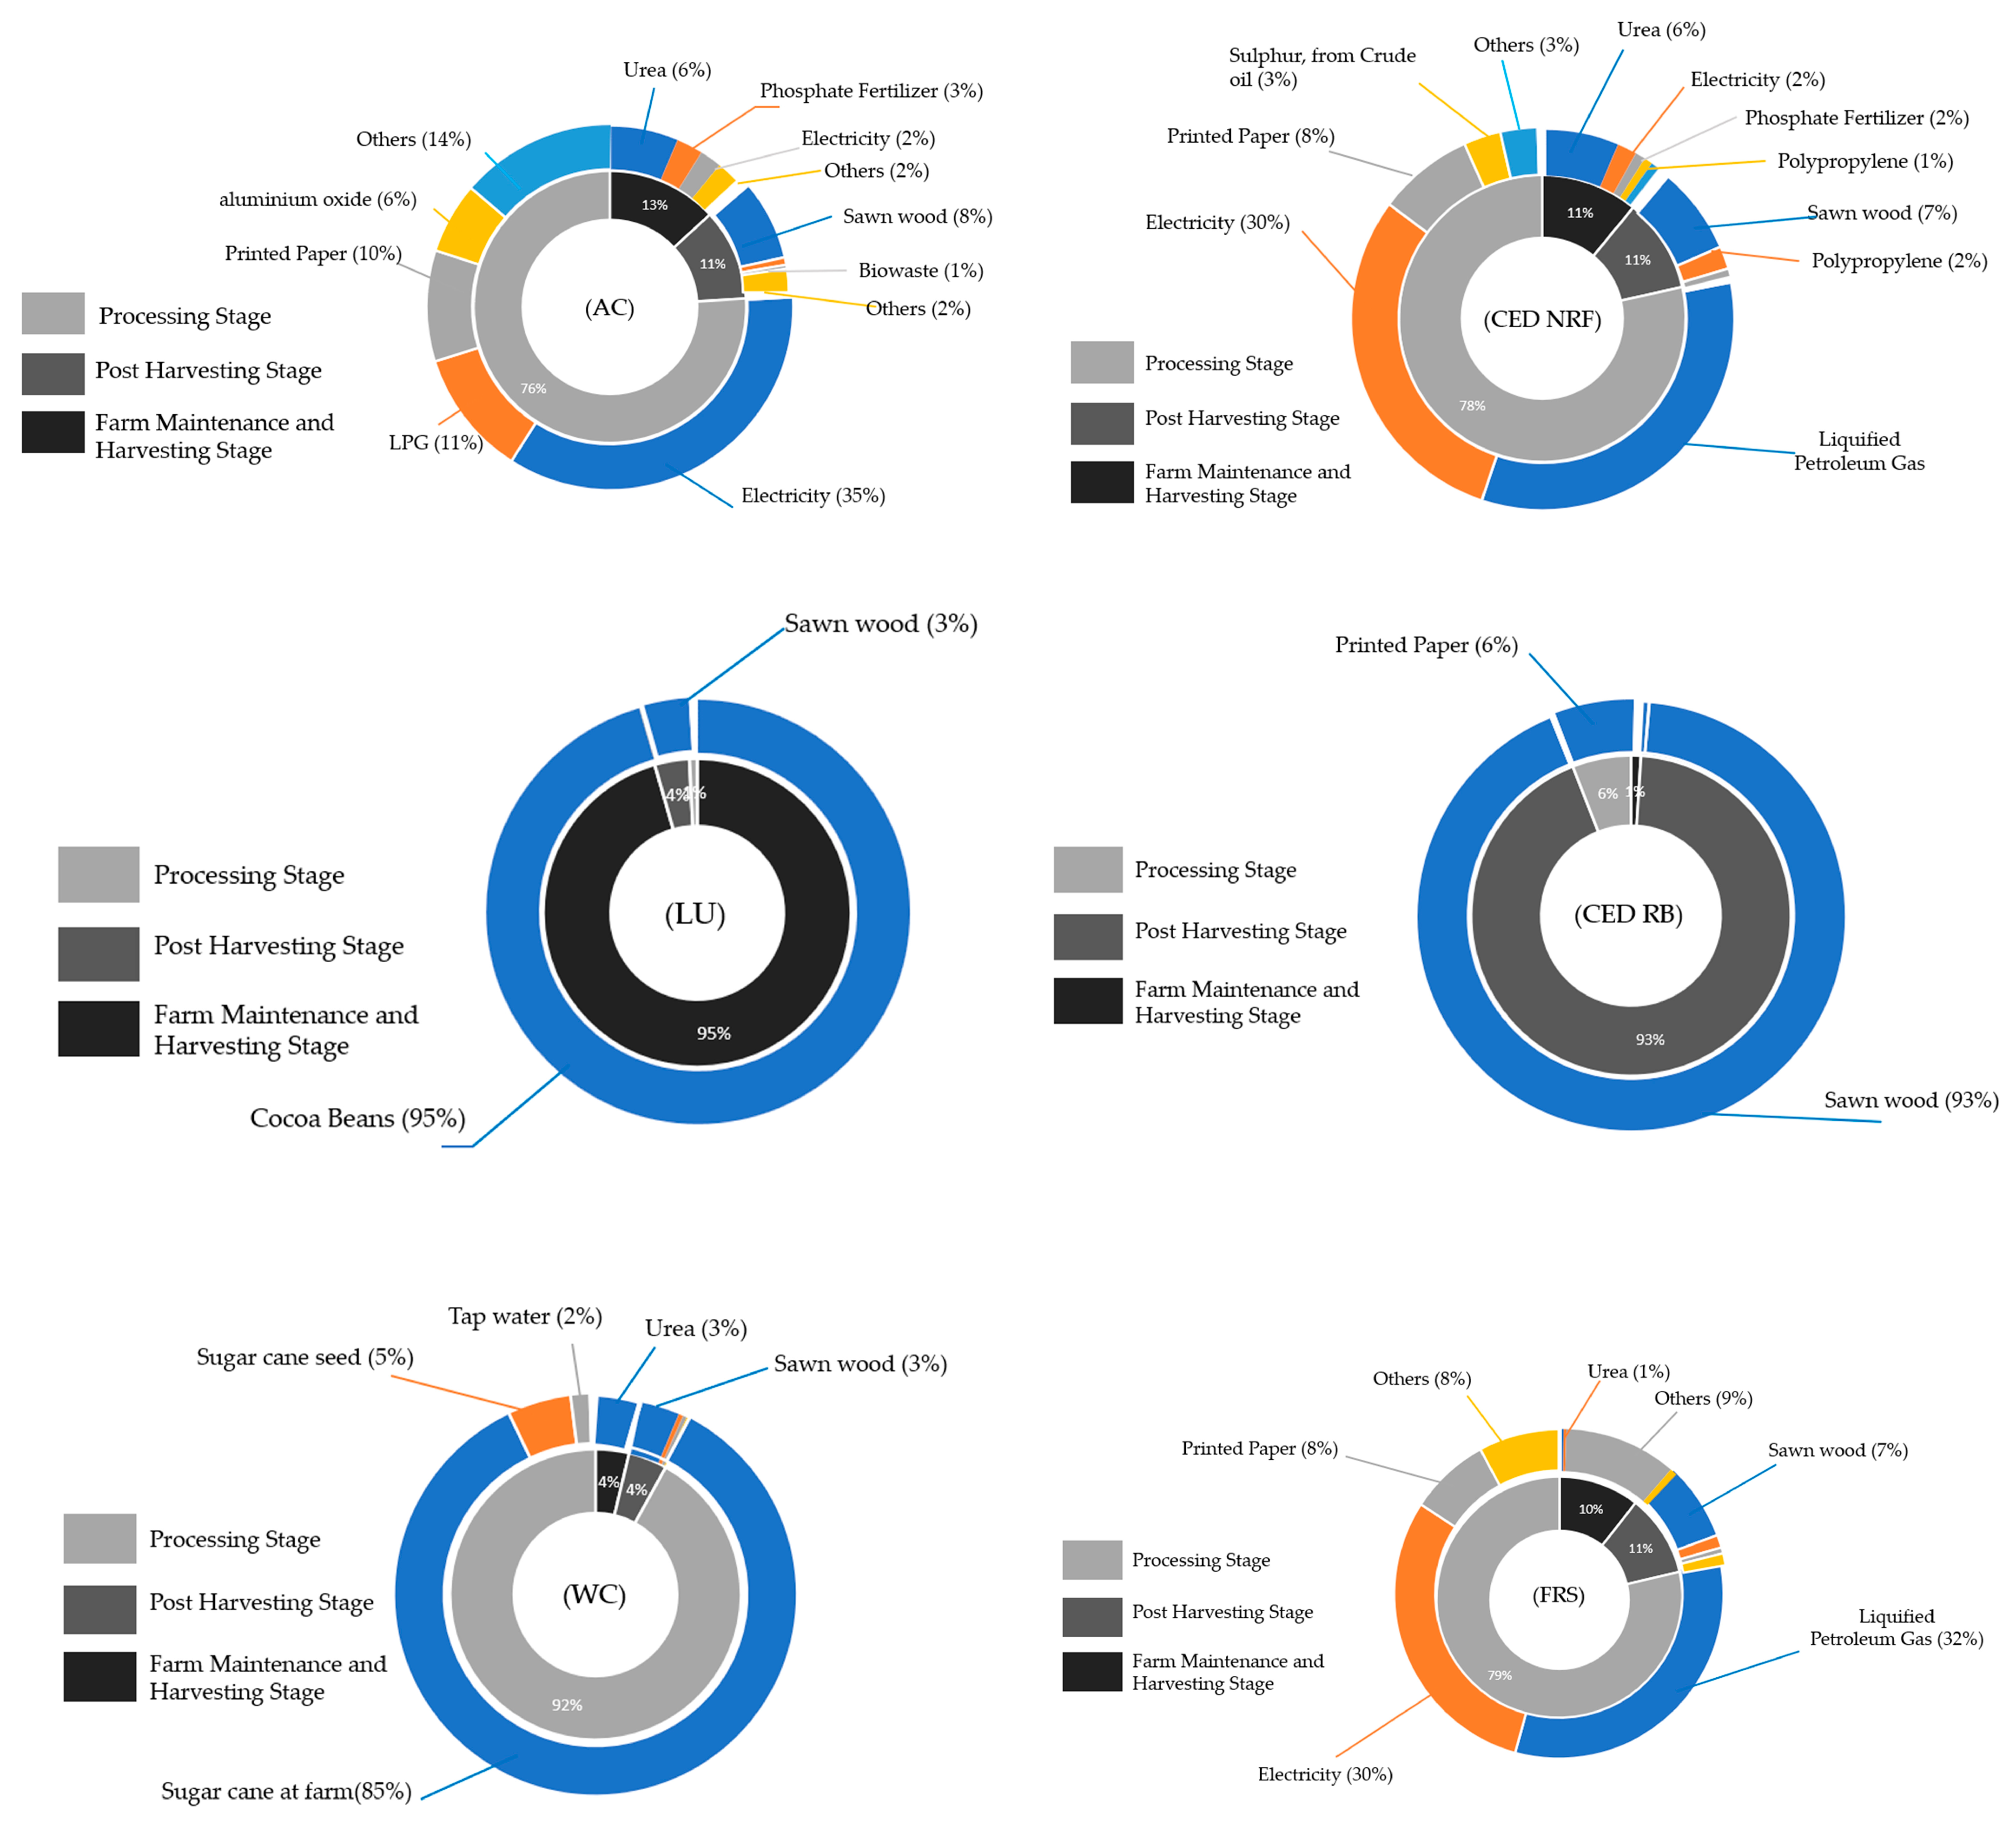
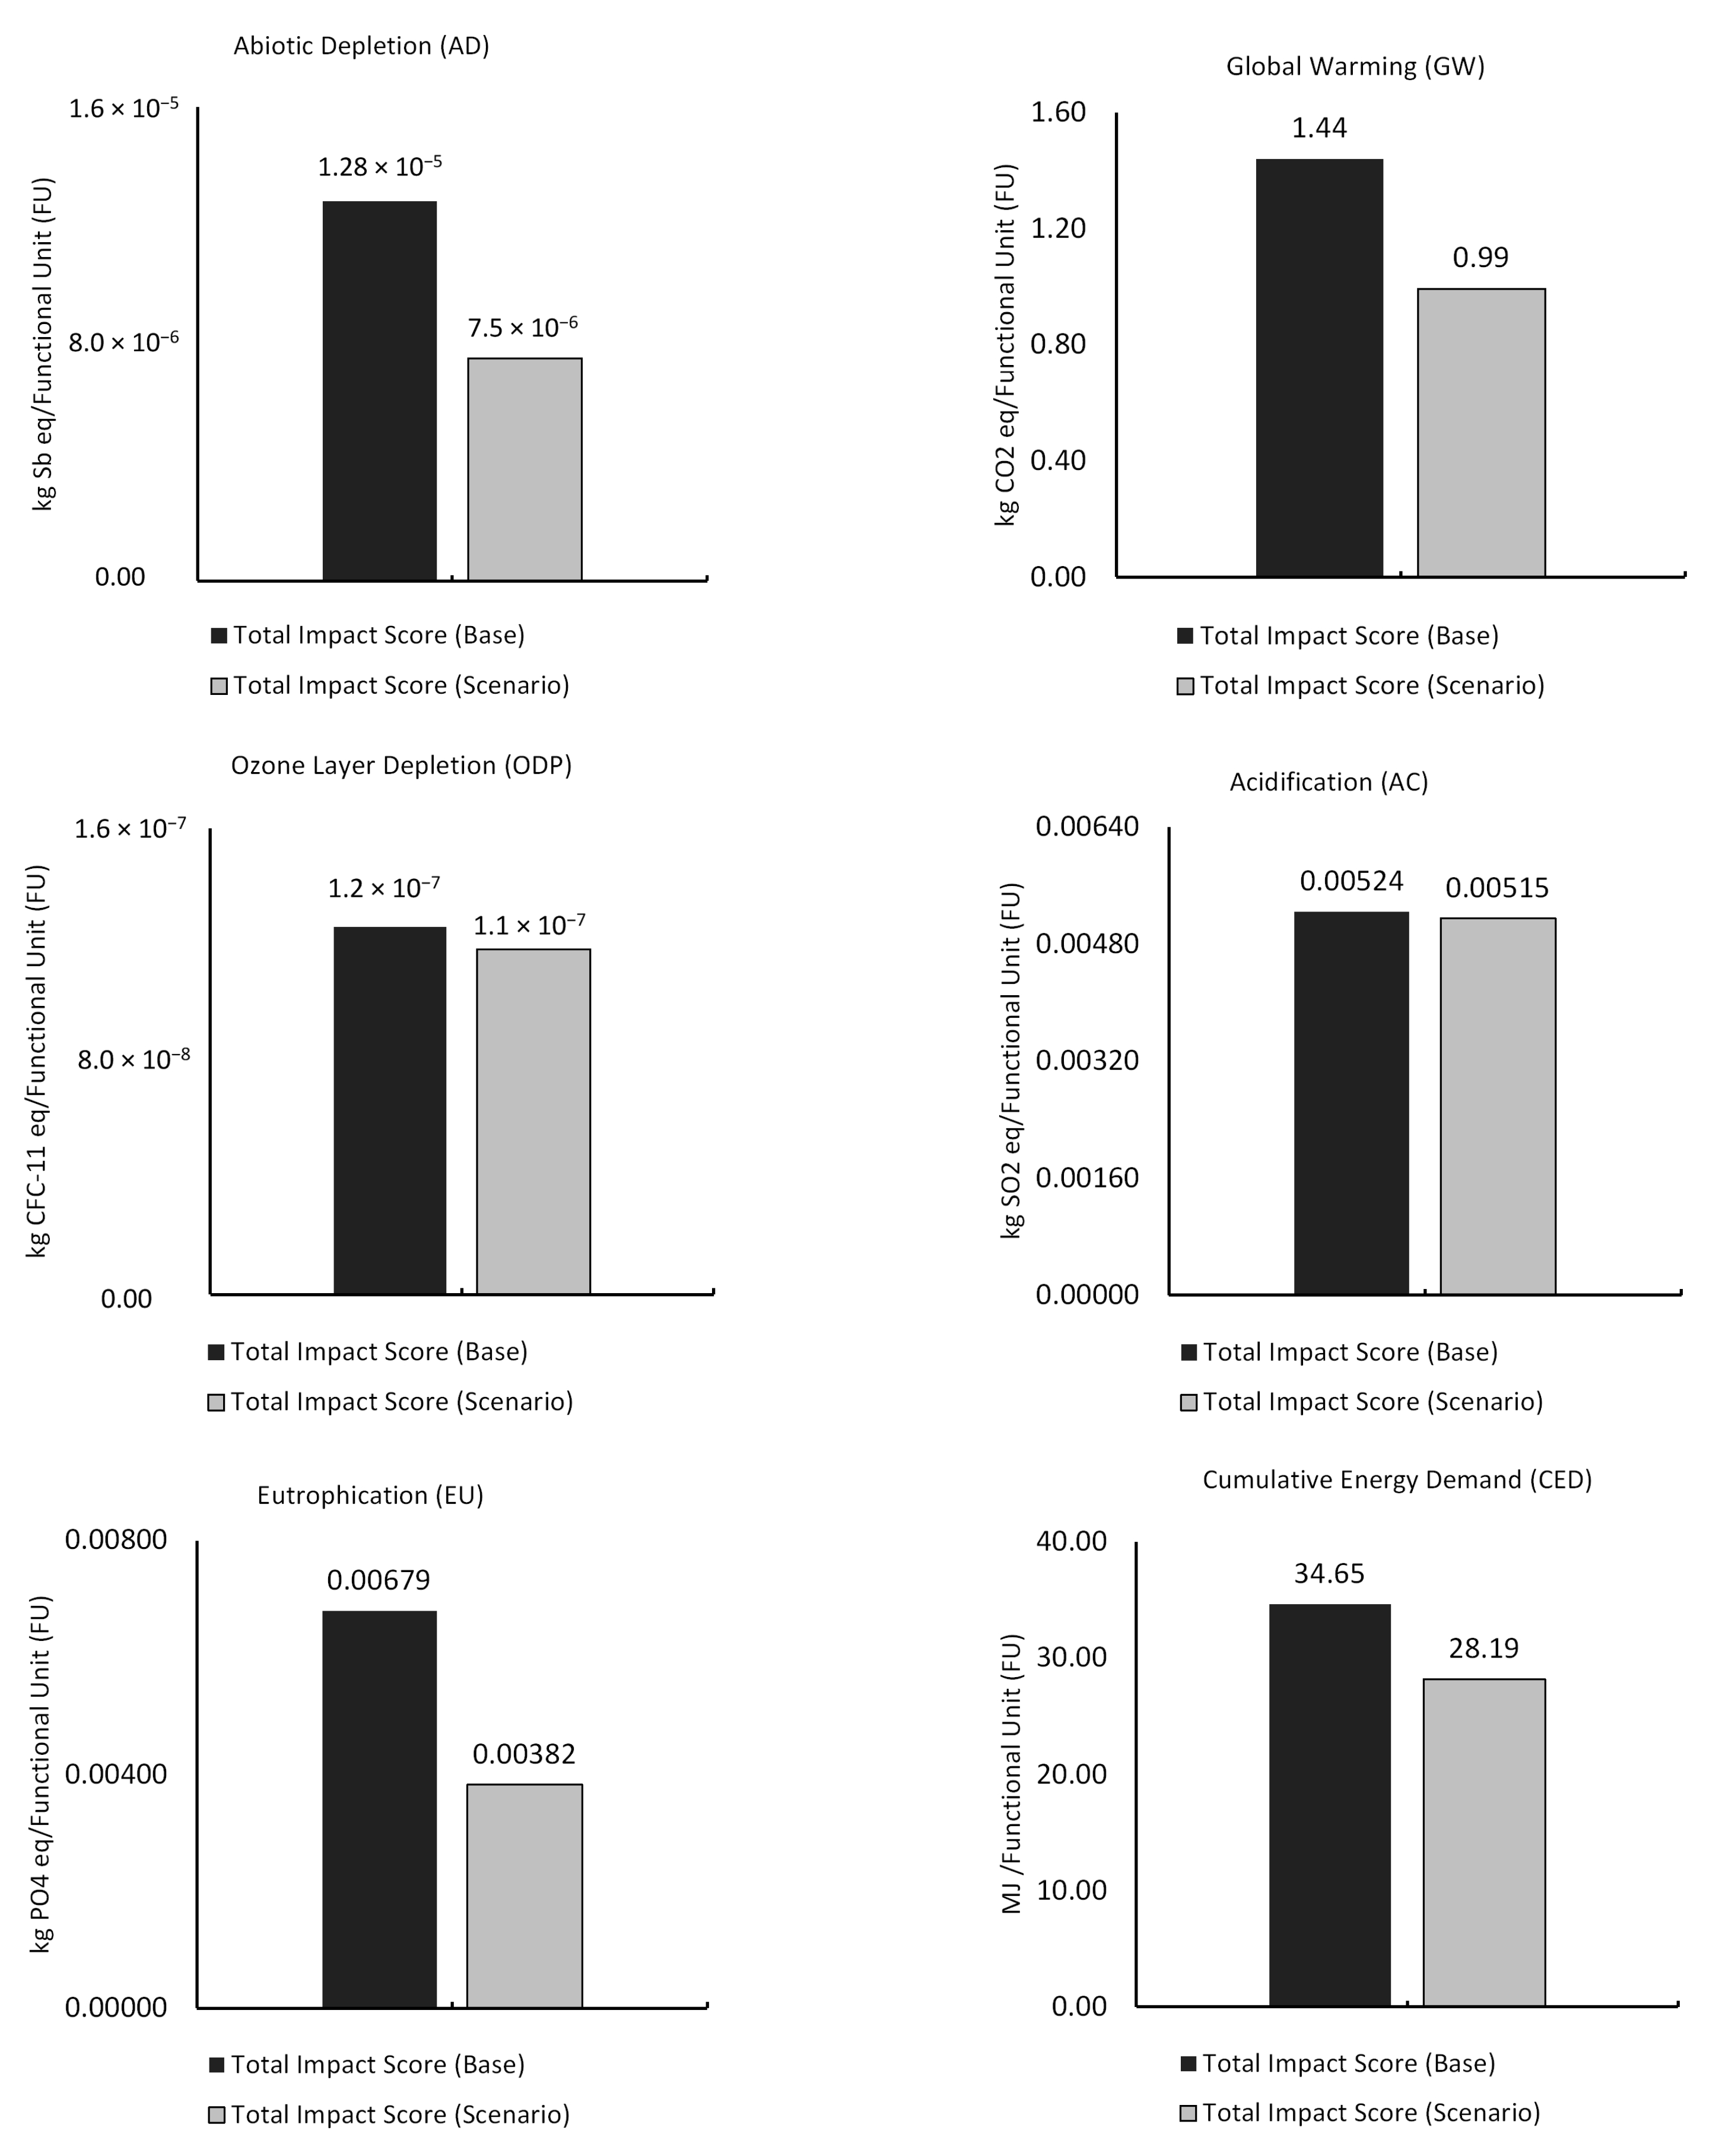
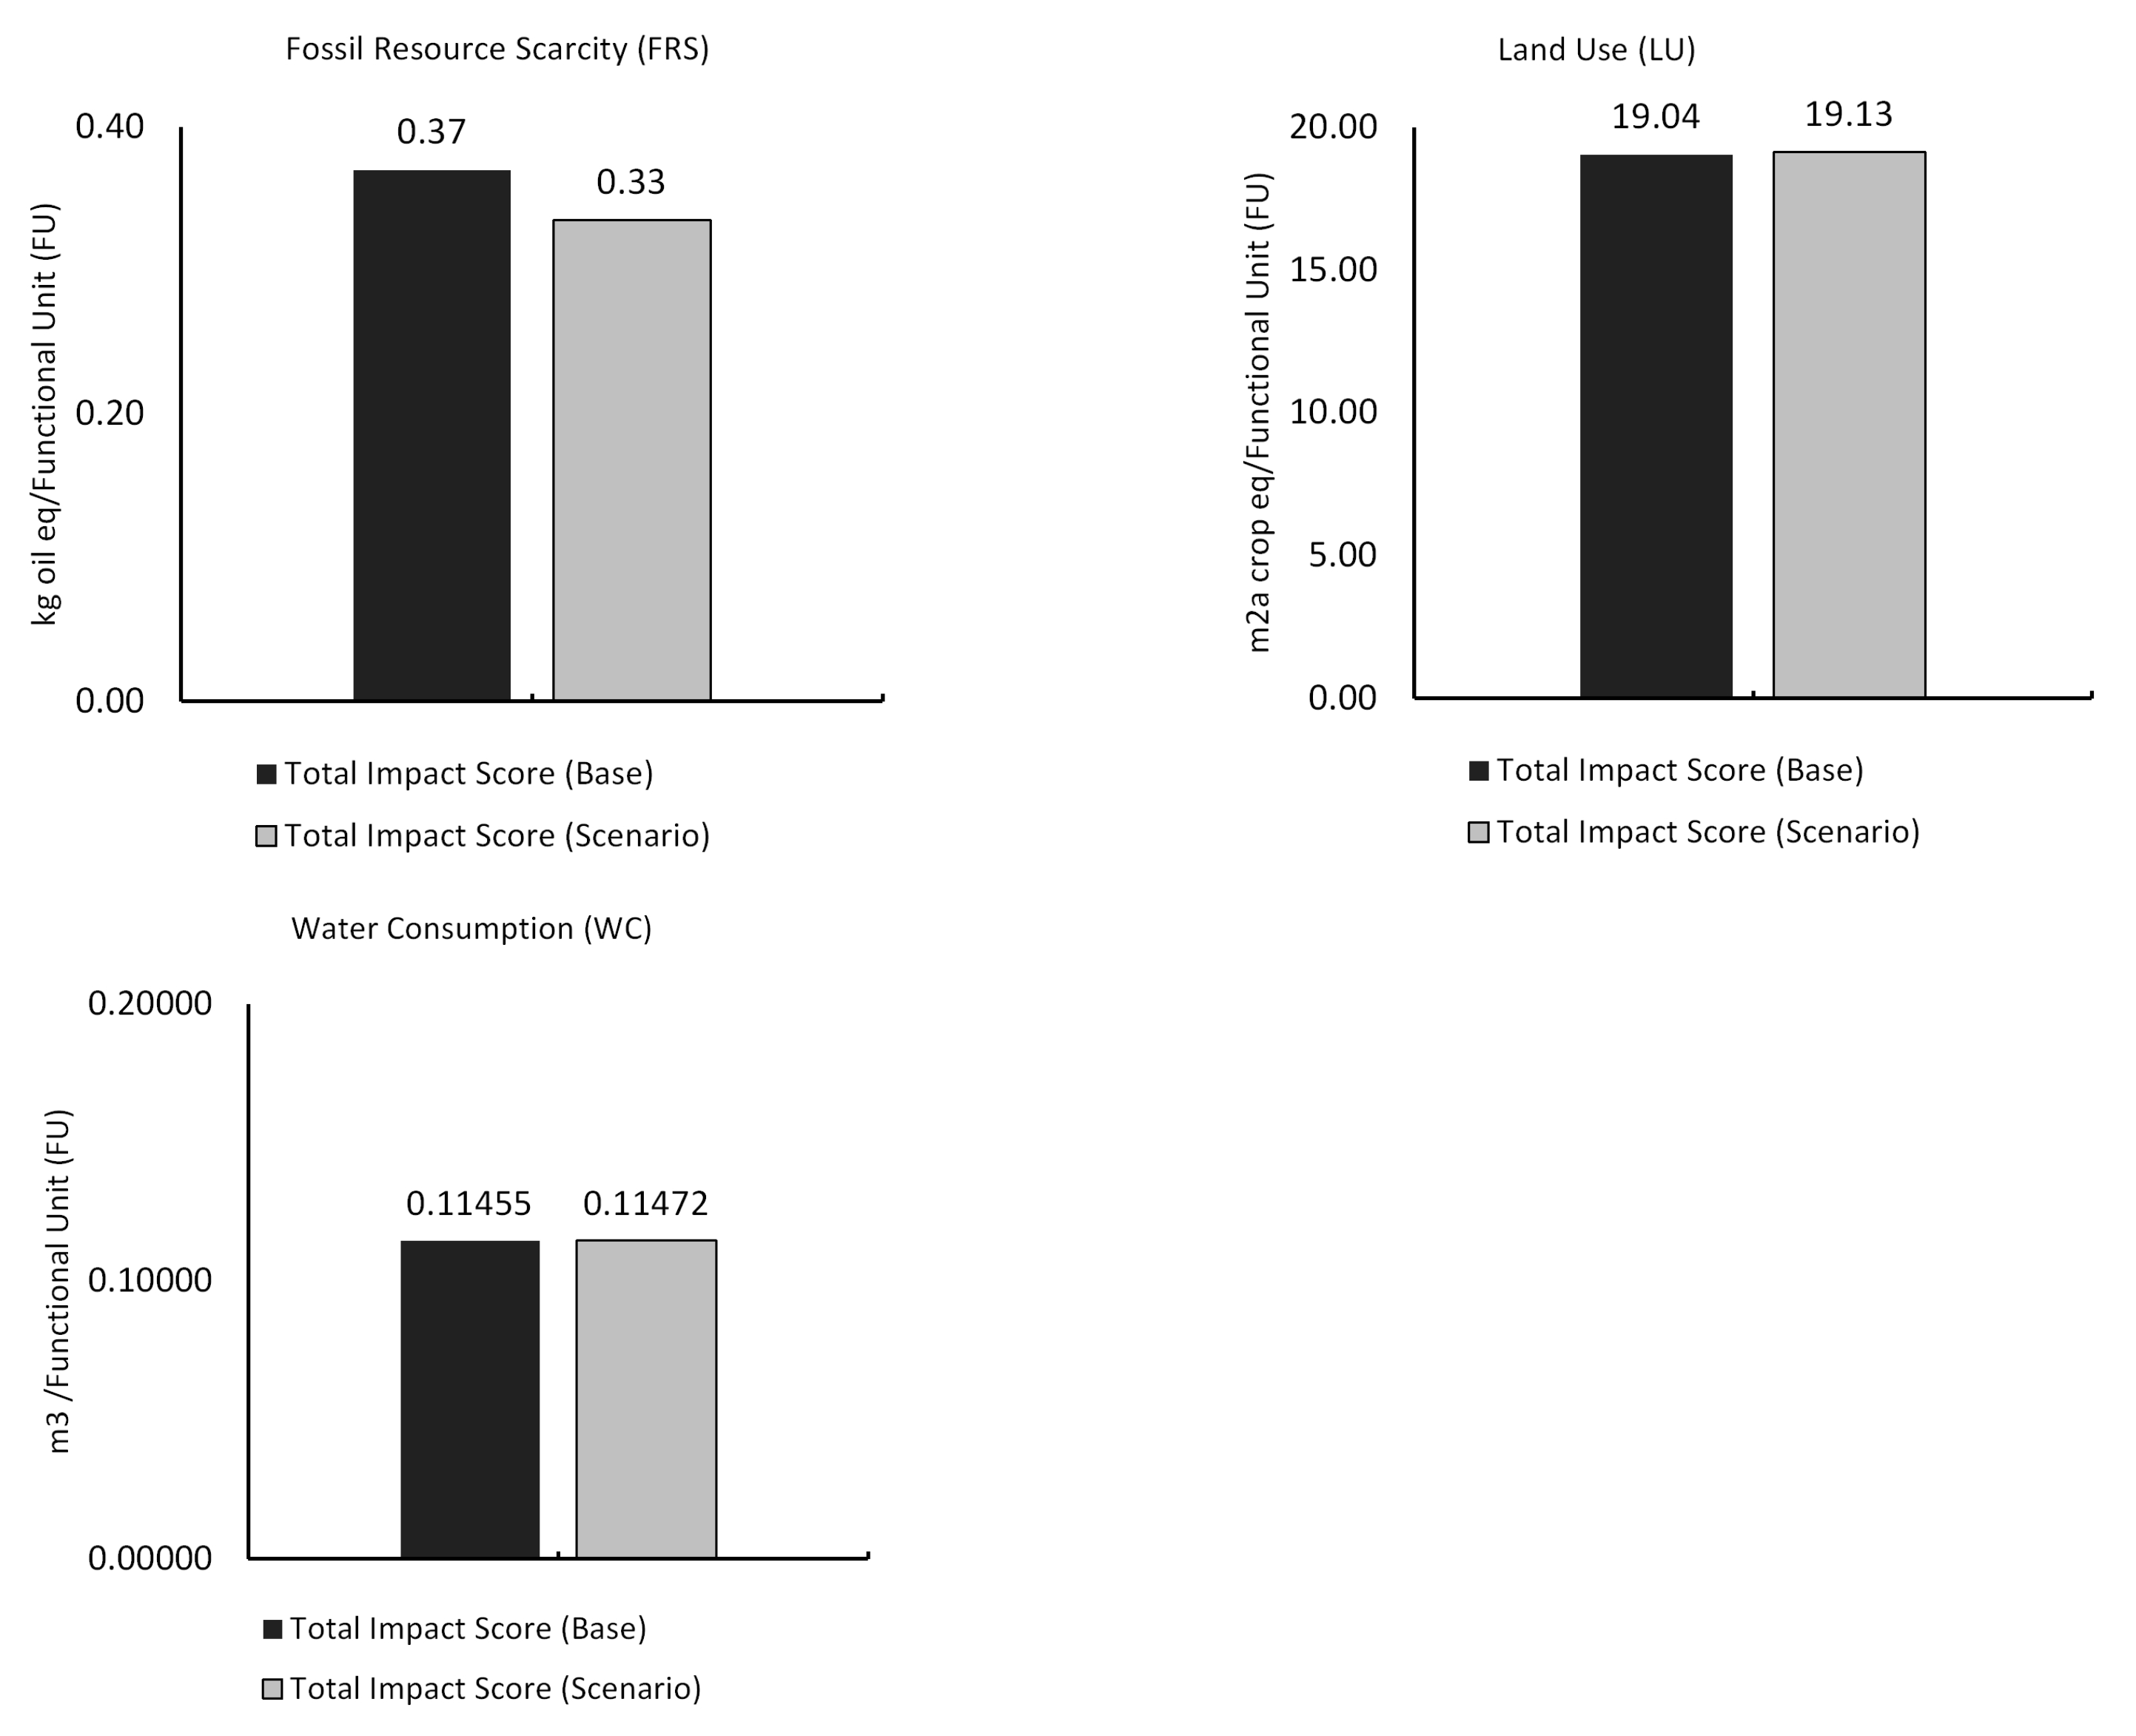
3.1. Life Cycle Impact (LCI) Assessment Overall Process
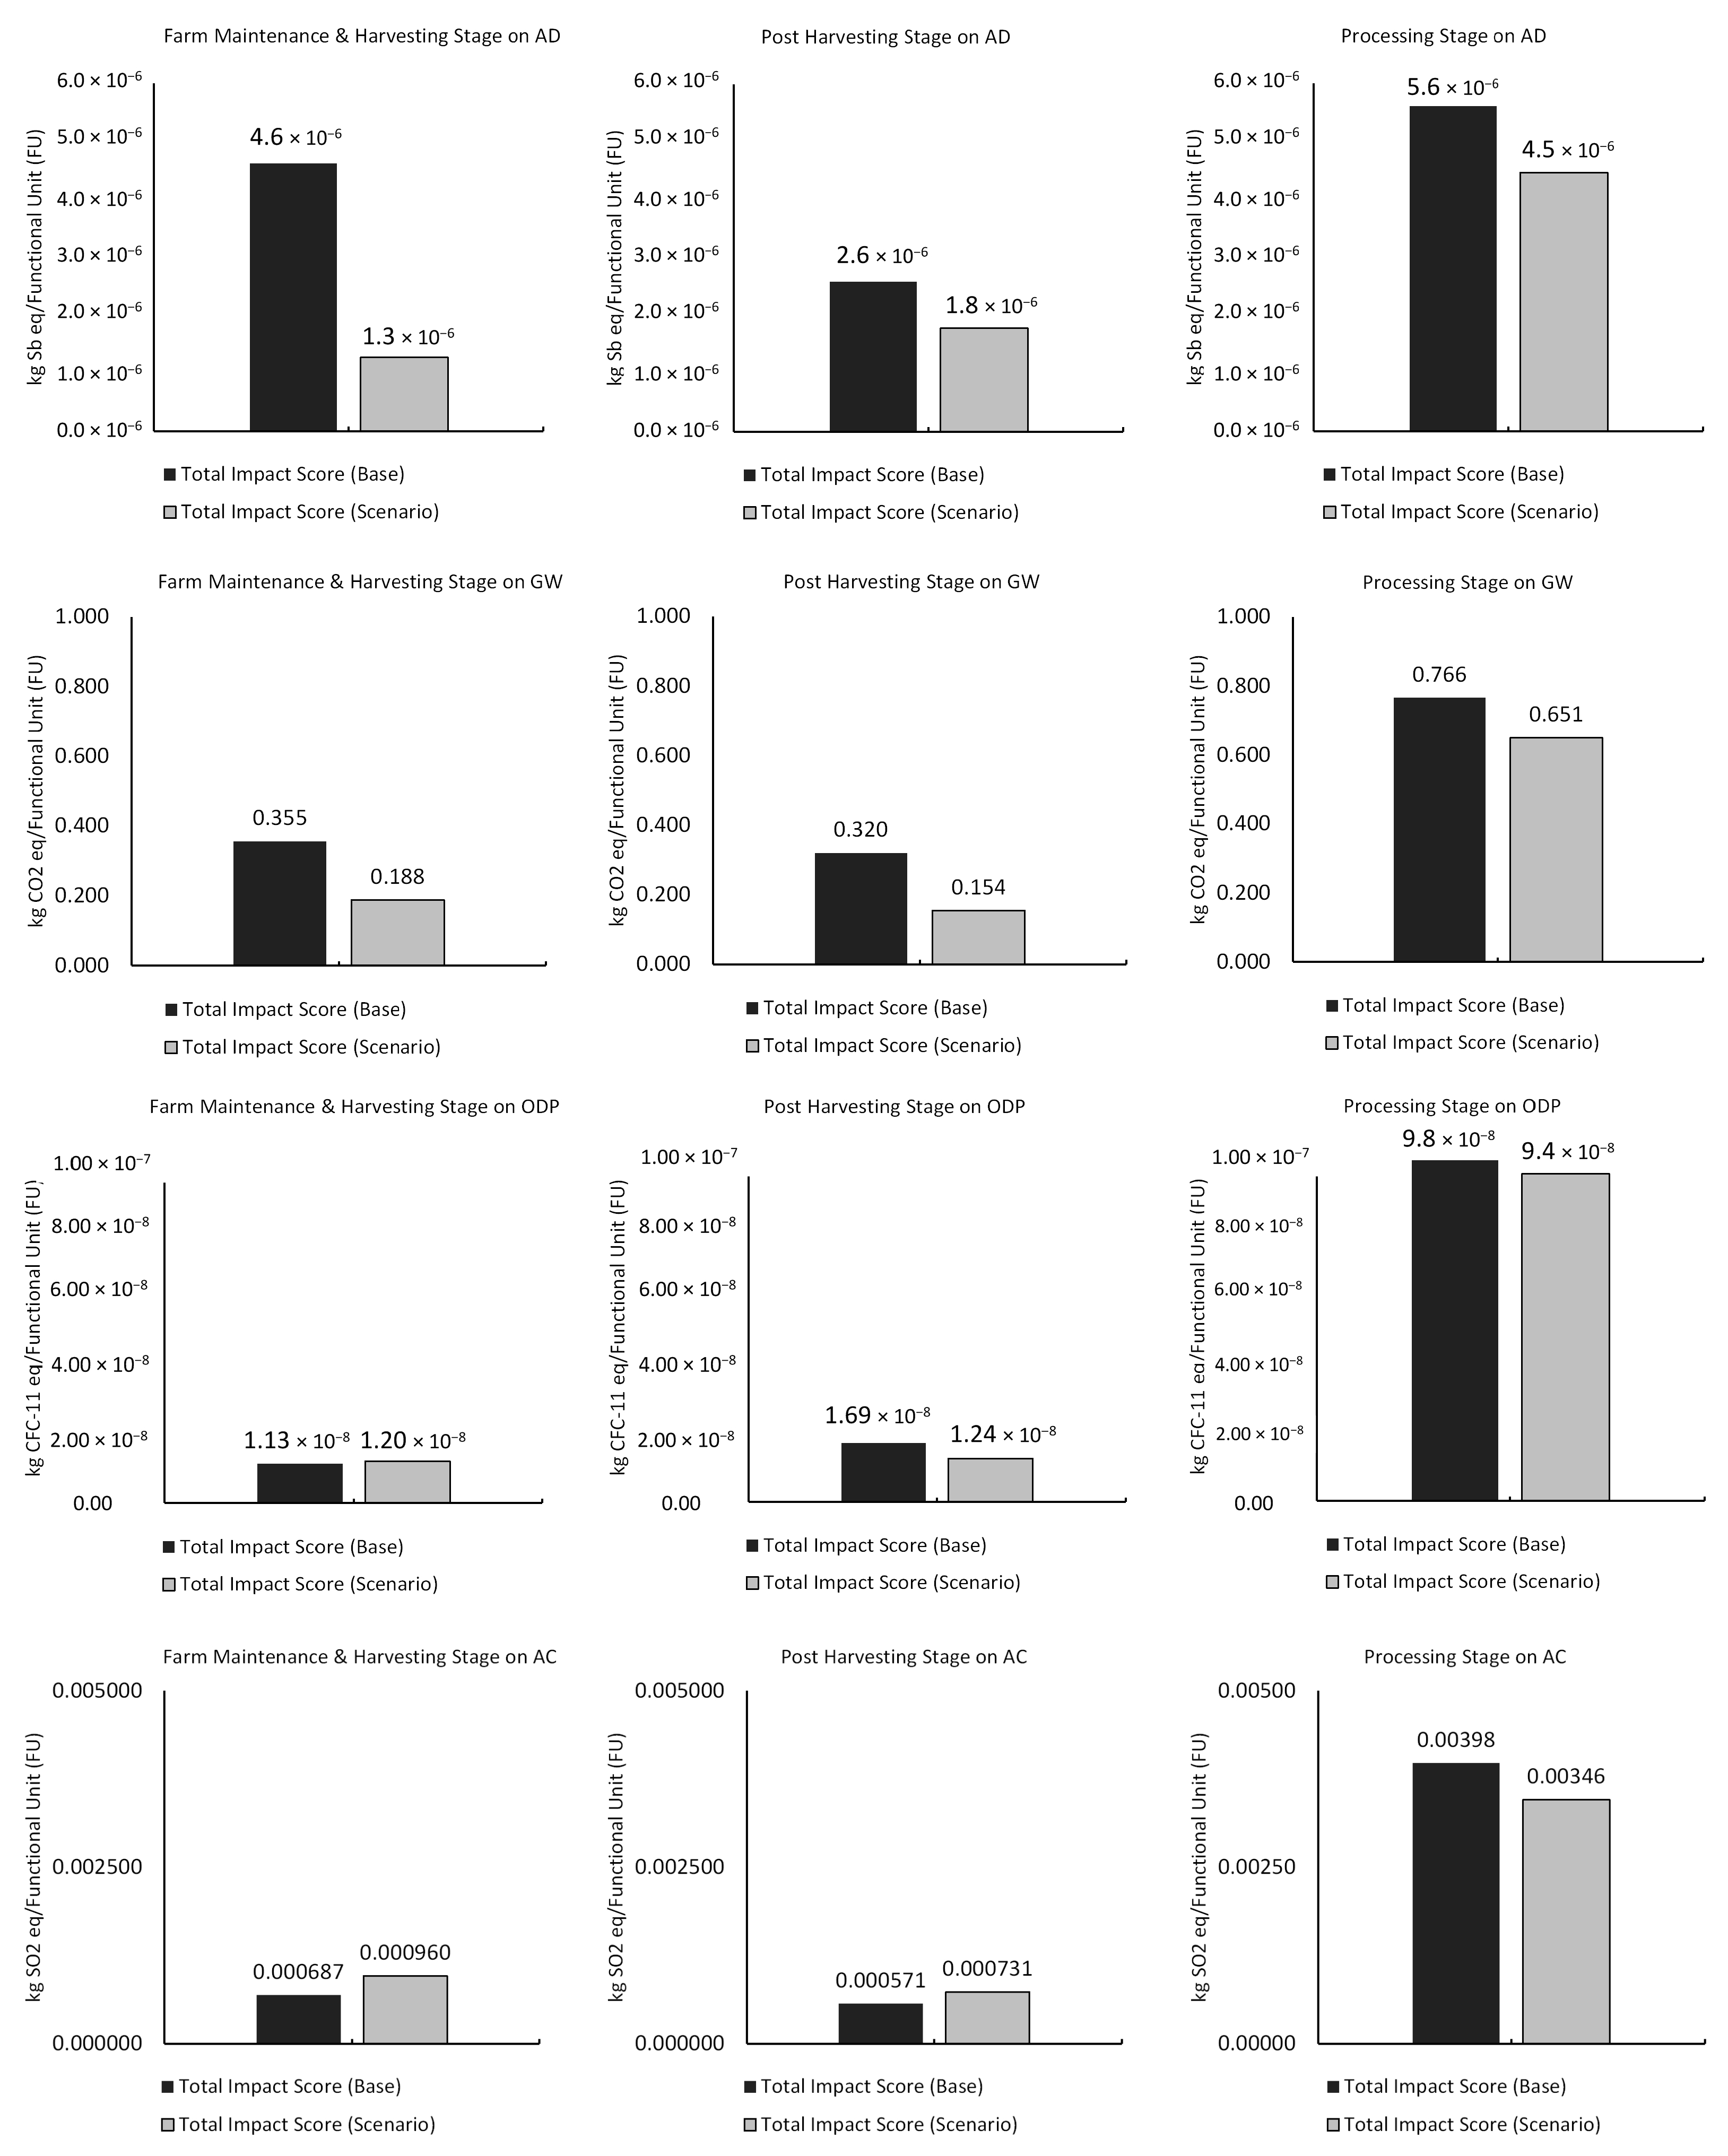
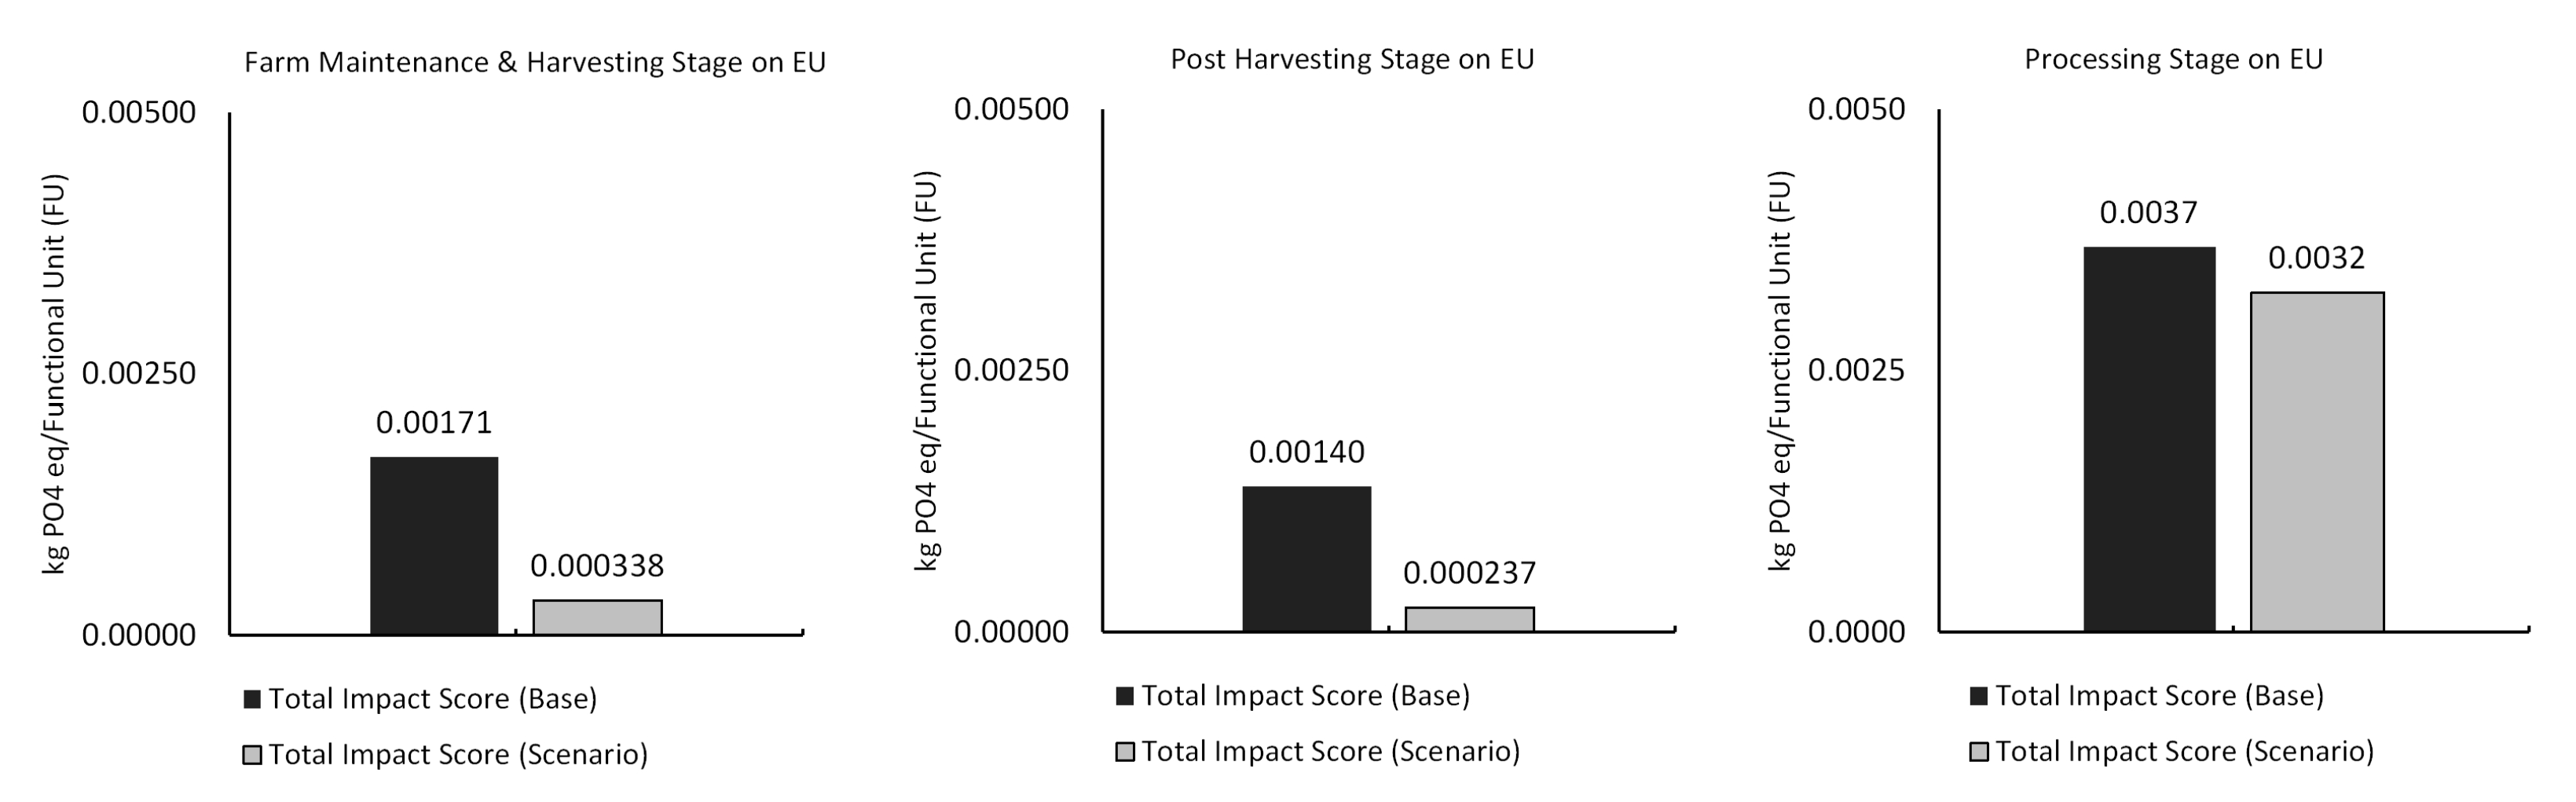
3.2. Farm Maintenance and Harvesting Stage
3.3. Post-Harvesting Stage
3.4. Processing Stage
4. Discussion
5. Conclusions
Author Contributions
Funding
Institutional Review Board Statement
Informed Consent Statement
Data Availability Statement
Conflicts of Interest
Appendix A

References
- Gallo, P.J.; Antolin-Lopez, R.; Montiel, I. Associative Sustainable Business Models: Cases in the bean-to-bar chocolate industry. J. Clean. Prod. 2018, 174, 905–916. [Google Scholar] [CrossRef]
- Beg, M.S.; Ahmad, S.; Jan, K.; Bashir, K. Status, supply chain and processing of cocoa—A review. Trends Food Sci. Technol. 2017, 66, 108–116. [Google Scholar] [CrossRef]
- Díaz-Montenegro, J.; Varela, E.; Gil, J.M. Livelihood strategies of cacao producers in Ecuador: Effects of national policies to support cacao farmers and specialty cacao landraces. J. Rural Stud. 2018, 63, 141–156. [Google Scholar] [CrossRef]
- Solazzo, R.; Donati, M.; Tomasi, L.; Arfini, F. How effective is greening policy in reducing GHG emissions from agriculture? Evidence from Italy. Sci. Total Environ. 2016, 573, 1115–1124. [Google Scholar] [CrossRef]
- Recanati, F.; Marveggio, D.; Dotelli, G. From beans to bar: A life cycle assessment towards sustainable chocolate supply chain. Sci. Total Environ. 2018, 613–614, 1013–1023. [Google Scholar] [CrossRef]
- Cadby, J.; Araki, T. Towards Ethical Chocolate: Multicriterial Identifiers, Pricing Structures, and the Role of the Specialty Cacao Industry in Sustainable Development; Springer International Publishing: Cham, Switzerland, 2021; Volume 1. [Google Scholar] [CrossRef]
- Homann, F. Fine Cocoa Market Dynamics-Bid for the Future. In Proceedings of the ICCO World Cocoa Conference 2016, International Conference, Punta Cana, Dominican Republic, 22–25 May 2016. [Google Scholar]
- Leissle, K. “Artisan” as Brand: Adding Value in a Craft Chocolate Community. Food Cult. Soc. 2017, 20, 37–57. [Google Scholar] [CrossRef]
- Cadby, J.; Araki, T.; Villacis, A.H. Breaking the mold: Craft chocolate makers prioritize quality, ethical and direct sourcing, and environmental welfare. J. Agric. Food Res. 2021, 4, 100122. [Google Scholar] [CrossRef]
- Villacis, A.H.; Alwang, J.R.; Barrera, V.; Dominguez, J. Prices, specialty varieties, and postharvest practices: Insights from cacao value chains in Ecuador. Agribus. Int. J. 2022, 38, 426–458. Available online: https://onlinelibrary.wiley.com/doi/epdf/10.1002/agr.21730 (accessed on 15 November 2022). [CrossRef]
- FCIA. About Fine Chocolate: Defining Fine Chocolate. Published 2021. Available online: https://www.finechocolateindustry.org/fine_chocolate_glossary.php (accessed on 5 September 2021).
- Engeseth, N.J.; Ac Pangan, M.F. Current context on chocolate flavor development — A review. Curr. Opin. Food Sci. 2018, 21, 84–91. [Google Scholar] [CrossRef]
- Jano, P.; Mainville, D. The Cacao Marketing Chain in Ecuador: Analysis of Chain Constraints to the Development of Markets for High-Quality Cacao. In Proceedings of the IAMA, Parma, Italy, 23–26 June 2007; pp. 25–40. [Google Scholar]
- Muñoz, M.S.; Cortina, J.R.; Vaillant, F.E.; Parra, S.E. An overview of the physical and biochemical transformation of cocoa seeds to beans and to chocolate: Flavor formation. Crit. Rev. Food Sci. Nutr. 2020, 60, 1593–1613. [Google Scholar] [CrossRef]
- Sepúlveda, W.S.; Maza, M.T.; Uldemolins, P.; Cantos-Zambrano, E.G.; Ureta, I. Linking Dark Chocolate Product Attributes, Consumer Preferences, and Consumer Utility: Impact of Quality Labels, Cocoa Content, Chocolate Origin, and Price. J. Int. Food Agribus. Mark. 2022, 34, 518–537. [Google Scholar] [CrossRef]
- Alberts, H.C.; Cidell, J.L. Chocolate Consumption, Manufacturing and Quality in Western Europe and the United States. Geography 2020, 91, 218–226. [Google Scholar] [CrossRef]
- Brown, A.L.; Bakke, A.J.; Hopfer, H. Understanding American premium chocolate consumer perception of craft chocolate and desirable product attributes using focus groups and projective mapping. PLoS ONE 2020, 15, e0240177. [Google Scholar] [CrossRef]
- Direktorat Jenderal Perkebunan. Road Map Kakao 2015–2045; Hudoro, H.B., Ed.; Direktorat Tanaman Tahunan dan Penyegar Direktorat Jenderal Perkebunan: Jakarta, Indonesia, 2016. [Google Scholar]
- Kementerian Perindustrian, R.I.; Kemitraan dan Cokelat Artisan Pacu Daya Saing Industri Pengolahan Kakao. Kementerian Perindustrian Republik Indonesia. Published 2023. Available online: https://kemenperin.go.id/artikel/23835/Kemitraan-dan-Cokelat-Artisan-Pacu-Daya-Saing-Industri-Pengolahan-Kakao (accessed on 28 February 2023).
- Afoakwa, E.O.; Paterson, A.; Fowler, M.; Ryan, A. Flavor formation and character in cocoa and chocolate: A critical review. Crit. Rev. Food Sci. Nutr. 2008, 48, 840–857. [Google Scholar] [CrossRef] [PubMed]
- Hanifah, A.; Firmanto, H.; Putri, S.P.; Fukusaki, E. Unique metabolite profiles of Indonesian cocoa beans from different origins and their correlation with temperature. J. Biosci. Bioeng. 2022, 134, 125–132. [Google Scholar] [CrossRef] [PubMed]
- Kitani, Y.; Putri, S.P.; Fukusaki, E. Investigation of the effect of processing on the component changes of single-origin chocolate during the bean-to-bar process. J. Biosci. Bioeng. 2022, 134, 138–143. [Google Scholar] [CrossRef] [PubMed]
- Kompas, I.D. Mengangkat Jenama Cokelat Lokal ke Panggung Global. In Kompas Media Nusantara; 30 December 2022. [Google Scholar]
- McCabe, M. Fine Chocolate, Resistance, and Political Morality in the Marketplace. J. Bus. Anthropol. 2015, 4, 54–81. [Google Scholar] [CrossRef]
- Saltini, R.; Akkerman, R.; Frosch, S. Optimizing chocolate production through traceability: A review of the influence of farming practices on cocoa bean quality. Food Control 2013, 29, 167–187. [Google Scholar] [CrossRef]
- Nur, T.; Hidayatno, A. Literature Review of a Multi Actor Analysis for Developing a Sustainable Agriculture Supply Chain (Case Study of Cocoa). In Proceedings of the ICITM 20209th International Conference on Industrial Technology and Management, Oxford, UK, 11–13 February 2020; pp. 57–62. [Google Scholar] [CrossRef]
- Pakpahan, O.P.; Moreira, L.; Camelo, A.; Karya, D.; Martins, A.C.; Gaspar, P.D.; Santo, C.E. Evaluation of comparative scenarios from different sites of chestnut production using life cycle assessment (LCA): Case study in the Beira Interior region of Portugal. Heliyon 2023, 9, e12847. [Google Scholar] [CrossRef]
- Ntiamoah, A.; Afrane, G. Environmental impacts of cocoa production and processing in Ghana: Life cycle assessment approach. J. Clean. Prod. 2008, 16, 1735–1740. [Google Scholar] [CrossRef]
- Bianchi, F.R.; Moreschi, L.; Gallo, M.; Vesce, E.; Del Borghi, A. Environmental analysis along the supply chain of dark, milk and white chocolate: A life cycle comparison. Int. J. Life Cycle Assess. 2020, 26, 807–821. [Google Scholar] [CrossRef]
- Konstantas, A.; Jeswani, H.K.; Stamford, L.; Azapagic, A. Environmental impacts of chocolate production and consumption in the UK. Food Res. Int. 2018, 106, 1012–1025. [Google Scholar] [CrossRef] [PubMed]
- Utomo, B.; Prawoto, A.A.; Bonnet, S.; Bangviwat, A.; Gheewala, S.H. Environmental performance of cocoa production from monoculture and agroforestry systems in Indonesia. J. Clean. Prod. 2016, 134, 583–591. [Google Scholar] [CrossRef]
- Vesce, E.; Olivieri, G.; Pairotti, M.B.; Romani, A.; Beltramo, R. Life cycle assessment as a tool to integrate environmental indicators in food products: A chocolate lca case study. Int. J. Environ. Health 2016, 8, 21–37. [Google Scholar] [CrossRef]
- ISO 14044:2006; Environmental Management–Life Cycle Assessment–Principles and Framework. International Standards Organisation: Geneva, Switzerland, 2006.
- Boenzi, F.; Digiesi, S.; Facchini, F.; Silvestri, B. Life Cycle Assessment in the Agri-Food Supply Chain: Fresh Versus Semi-Finished Based Production Process. Sustainability 2022, 14, 13010. [Google Scholar] [CrossRef]
- Effendy; Pratama, M.F.; Rauf, R.A.; Antara, M.; Basir-Cyio, M.; Mahfudz; Muhardi. Factors influencing the efficiency of cocoa farms: A study to increase income in rural Indonesia. PLoS ONE 2019, 14, e0214569. [Google Scholar] [CrossRef]
- Tothmihaly, A.; Ingram, V.; von Cramon-Taubadel, S. How Can the Environmental Efficiency of Indonesian Cocoa Farms Be Increased? Ecol. Econ. 2019, 158, 134–145. [Google Scholar] [CrossRef]
- Leksono, A.S.; Mustafa, I.; Gama, Z.P.; Afandhi, A.; Zairina, A. Organic cocoa farming in Indonesia: Constraints and development strategies. Org. Agric. 2021, 11, 445–455. [Google Scholar] [CrossRef]
- Pré Sustainability. Simapro Database Manual Methods Library; PRé Sustainability B.V: Amersfoort, The Netherlands, 2022; Available online: http://www.pre-sustainability.com/download/DatabaseManualMethods.pdf (accessed on 19 September 2022).
- Boakye-Yiadom, K.A.; Duca, D.; Pedretti, E.F.; Ilari, A. Environmental performance of chocolate produced in ghana using life cycle assessment. Sustainability 2021, 13, 6155. [Google Scholar] [CrossRef]
- Blonk, H.; Tyszler, M.; Van Paassen, M.; Braconi, N.; Draijer, N.; Van Rijn, J. Agri-Footprint 6 Methodology Report Part 1: Methodology and Basic Principles about Us Title Agri-Footprint 6 Methodology Report. 2022. Available online: www.blonksustainability.nl (accessed on 10 November 2022).
- PRé Sustainability, B.V. SimaPro 9.4.0.3 Faculty License Computer Software; PRé Sustainability B.V: Amersfoort, The Netherlands, 2022. [Google Scholar]
- Wernet, G.; Bauer, C.; Steubing, B.; Reinhard, J.; Moreno-ruiz, E.; Weidema, B. The ecoinvent database version 3 (part I): Overview and methodology. Int. J. Life Cycle Assess. 2016, 3, 1218–1230. [Google Scholar] [CrossRef]
- National Refrigerants Inc. R-22 Safety Data Sheet; National Refrigerants Inc.: Bridgeton, NJ, USA, 2021. [Google Scholar]
- SNI 2323; Cocoa Beans. Badan Standardisasi Nasional-BSN: Jakarta, Indonesia, 2008; pp. 1–41.
- Perez Neira, D. Energy sustainability of Ecuadorian cacao export and its contribution to climate change. A case study through product life cycle assessment. J. Clean. Prod. 2016, 112, 2560–2568. [Google Scholar] [CrossRef]
- Del Borghi, A.; Moreschi, L.; Gallo, M. Circular economy approach to reduce water–energy–food nexus. Curr Opin Environ Sci Health 2020, 13, 23–28. [Google Scholar] [CrossRef]
- Suprapto, M.E.; Rosniawaty, S.; Ariyanti, M. Pengaruh Pupuk Kompos Kulit Buah Kakao Dan Pupuk Tablet Terhadap Produksi Kakao (Theobroma cacao L.). Paspalum J. Ilm. Pertan. 2018, 6, 41. [Google Scholar] [CrossRef]


| Input/Output | Unit/FU | Amount | Source | Data Type |
|---|---|---|---|---|
| Land Use | ha | 0.000955 | Cocoa producer | Primary |
| Water | kg | 4.0944882 | Cocoa producer | Primary |
| Fertilizer | ||||
| Urea | kg | 0.0113846 | Utomo et al. [31] | Secondary |
| SP36 | kg | 0.0006923 | Utomo et al. [31] | Secondary |
| Organic Fertilizer | kg | 0.0035846 | Utomo et al. [31] | Secondary |
| Pesticides | ||||
| Insecticide | kg | 0.0007269 | Ecoinvent v3.0 | Secondary |
| Energy | ||||
| Electricity | kWh | 0.0138462 | Cocoa producer | Primary |
| Diesel | kWh | 0.0092308 | Cocoa producer | Primary |
| Others | ||||
| Polypropylene | kg | 0.0009231 | Cocoa producer | Primary |
| Water Emission | ||||
| Nitrates | kg | 1.238 × 10⁻¹¹ | Utomo et al. [31] | Secondary |
| Phosphates | kg | 6.992 × 10⁻¹² | Utomo et al. [31] | Secondary |
| Chemical oxygen demand | kg | 1.231 × 10⁻¹⁹ | Utomo et al. [31] | Secondary |
| Soil Emission | ||||
| Pesticides | kg | 0.0007269 | Ecoinvent v3.0 | Secondary |
| Waste | ||||
| Biowaste, open dump | kg | 0.2307692 | Cocoa producer | Primary |
| Final Waste Flow | ||||
| Waste Organic | kg | 0.3846154 | Cocoa producer | Primary |
| Input/Output | Unit/FU | Amount | Source | Data Type |
|---|---|---|---|---|
| Wood Fermentation Box | cm3 | 0.00016 | Cocoa producer | Primary |
| Wood Drying Tools | cm3 | 0.000522 | Cocoa producer | Primary |
| Others | ||||
| Polypropylene (drying cover) | kg | 0.002 | Ecoinvent v3.0 | Secondary |
| Emissions to Air | ||||
| Acetic acid | kg | 0.34 | Cocoa producer | Primary |
| Lactic acid | kg | 0.01 | Cocoa producer | Primary |
| Chemical oxygen demand | kg | 0.07 | Cocoa producer | Primary |
| Waste | ||||
| Polypropylene (plastic bag) | kg | 0.0012 | Ecoinvent v3.0 | Secondary |
| Polypropylene (drying cover) | kg | 0.002 | Ecoinvent v3.0 | Secondary |
| Biowaste (fermentation) | kg | 0.25 | Ecoinvent v3.0 | Secondary |
| Input/Output | Process | Unit/FU | Amount | Source | Data Type |
|---|---|---|---|---|---|
| Energy | |||||
| Liquified Petroleum Gas (LPG) | Roasting | kg | 0.0986301 | Chocolate producer | Primary |
| Electricity, medium voltage | Winnowing | kWh | 0.0060274 | Chocolate producer | Primary |
| Electricity, medium voltage | Grinding | kWh | 0.0912329 | Chocolate producer | Primary |
| Electricity, medium voltage | Pressing Liquor | kWh | 0.0663014 | Chocolate producer | Primary |
| Electricity, medium voltage | Mixing | kWh | 0.1031507 | Chocolate producer | Primary |
| Electricity, medium voltage | Tempering | kWh | 0.1369863 | Chocolate producer | Primary |
| Electricity, medium voltage | Molding | kWh | 0.0125068 | Chocolate producer | Primary |
| Ingredients | |||||
| Sugar, from sugar cane | Mixing | kg | 0.1154795 | Agri-footprint 5.0 | Secondary |
| Vanilla | Mixing | kg | 0.0002740 | Chocolate producer | Primary |
| Cocoa Butter | Pressing | kg | 0.1767123 | Chocolate producer | Primary |
| Cocoa Mass | Grinding | kg | 0.7082192 | Chocolate producer | Primary |
| Water | |||||
| Water (tap water) | Grinding | kg | 0.4424658 | Chocolate producer | Primary |
| Water (tap water) | Pressing Liquor | kg | 0.4424658 | Chocolate producer | Primary |
| Water (tap water) | Mixing | kg | 0.5 | Chocolate producer | Primary |
| Water (tap water) | Tempering | kg | 0.5 | Chocolate producer | Primary |
| Others | |||||
| Tetrafluoroethene | Molding | kg | 0.0031096 | National Refrigerants Inc. [43] | Secondary |
| Printed paper | Packaging | kg | 0.04 | Chocolate producer | Primary |
| Aluminum oxide | Packaging | kg | 0.0190411 | Ecoinvent v3.0 | Secondary |
| Emission to air | |||||
| CO2 | Roasting | kg | 0.0029452 | Chocolate producer | Primary |
| Methane | Roasting | kg | 2.329 × 10⁻⁷ | Chocolate producer | Primary |
| Dinitrogen monoxide | Roasting | kg | 4.671 × 10⁻⁹ | Chocolate producer | Primary |
| Hydrogen Fluoride | Roasting | kg | 7 × 10⁻⁹ | Chocolate producer | Primary |
| Emission to water | |||||
| Water | Grinding | l | 0.4424658 | Chocolate producer | Primary |
| Water | Pressing Liquor | l | 0.4424658 | Chocolate producer | Primary |
| Water | Mixing | l | 0.5 | Chocolate producer | Primary |
| Water | Tempering | l | 0.5 | Chocolate producer | Primary |
| Municipal solid waste | Winnowing | kg | 0.0465753 | Chocolate producer | Primary |
| Municipal solid waste | Packaging | kg | 0.005 | Chocolate producer | Primary |
| Environmental Indicators | |||||||||
|---|---|---|---|---|---|---|---|---|---|
| Chain Stage | AD | GW | ODP | AC | EU | CED | FRS | LU | WC |
| Stage 1. Farm Maintenance | 36% | 24.7% | 8.93% | 13.1% | 25.1% | 6.0% | 10.6% | 96.0% | 3.90% |
| Farm Maintenance | ● | ○ | ○ | ○ | ○ | ○ | ○ | ● | ○ |
| Harvesting | ○ | ● | ○ | ○ | ● | ○ | ○ | ○ | ○ |
| Stage 2. Post-harvesting | 20.2% | 22.2% | 13.4% | 10.9% | 20.6% | 51.0% | 10.8% | 3.70% | 0.45% |
| Fermentation | ○ | ● | ○ | ○ | ● | ○ | ○ | ○ | ○ |
| Drying | ● | ○ | ● | ○ | ○ | ● | ○ | ○ | ○ |
| Transportation | ○ | ○ | ○ | ○ | ○ | ○ | ○ | ○ | ○ |
| Stage 3. Processing | 43.8% | 53.2% | 77.7% | 76% | 54.3% | 43.0% | 78.6% | 0.80% | 95.7% |
| Roasting | ○ | ○ | ● | ● | ○ | ● | ● | ○ | ○ |
| Winnowing | ○ | ○ | ○ | ○ | ○ | ○ | ○ | ○ | ○ |
| Grinding | ○ | ● | ● | ● | ● | ● | ● | ○ | ○ |
| Pressing | ○ | ● | ● | ● | ● | ● | ● | ○ | ○ |
| Mixing | ○ | ● | ● | ● | ● | ● | ● | ○ | ● |
| Tempering | ○ | ● | ● | ● | ● | ● | ● | ○ | ○ |
| Molding | ● | ○ | ○ | ○ | ○ | ○ | ○ | ○ | ○ |
| Packaging | ● | ○ | ○ | ● | ○ | ○ | ○ | ○ | ○ |
| ● | significant impact value | ||||||||
| ○ | insignificant impact value | ||||||||
| Chain | Description Process | Description of Change | Value Change Calculation |
|---|---|---|---|
| Stage I. Farm Maintenance | |||
| 1. Farmer technical assistance program for utilization of biowaste as compost | Cacao pod husk reused as compost | Cocoa pod husk can be used as compost in quantities of up to 300 kg. |
|
| 2. Farmer Education Program for the Use of Organic and Environmentally Friendly Fertilizers | Effectiveness of fertilization with the use of organic phosphate fertilizers (horn meal) | SP36 of approximately 4.66 kg replaced with organic phosphate (horn meal) | |
| Stage II. Post-harvesting | |||
| 3. Farmer technical assistance program for Utilization of fermented liquid waste as compost. | Cocoa pulp waste is used to accelerate the composting process | Pulp with a concentration of 250 kg is used as a compost acceleration material |
|
| 4. Environmentally friendly cocoa drying-equipment assistance program. | drying board which is entirely made from wood material modified by using shade net | Wooden material for drying 0.174 m3 of blocks to 0.09 m3 of logs and modified by replacing the wooden sheets used as a drying base with shade net | |
| Stage III. Processing | |||
| 5. Increase production capacity and improve machine effectiveness. | Effective use of production machinery and refrigerant for cooling | Adding capacity of 10 kg per batch on grinding, mixing and tempering machines as well as adding 20 kg per batch on the cooling process of chocolate bar refrigerant |
|
| 6. Selecting a more environmentally friendly paper printed packaging. | Selecting the lighter printed paper | Replacing the packaging paper from 4 g to 2 g per package |
|
Disclaimer/Publisher’s Note: The statements, opinions and data contained in all publications are solely those of the individual author(s) and contributor(s) and not of MDPI and/or the editor(s). MDPI and/or the editor(s) disclaim responsibility for any injury to people or property resulting from any ideas, methods, instructions or products referred to in the content. |
© 2023 by the authors. Licensee MDPI, Basel, Switzerland. This article is an open access article distributed under the terms and conditions of the Creative Commons Attribution (CC BY) license (https://creativecommons.org/licenses/by/4.0/).
Share and Cite
Nur, T.; Hidayatno, A.; Setiawan, A.D.; Komarudin, K.; Suzianti, A. Environmental Impact Analysis to Achieve Sustainability for Artisan Chocolate Products Supply Chain. Sustainability 2023, 15, 13527. https://doi.org/10.3390/su151813527
Nur T, Hidayatno A, Setiawan AD, Komarudin K, Suzianti A. Environmental Impact Analysis to Achieve Sustainability for Artisan Chocolate Products Supply Chain. Sustainability. 2023; 15(18):13527. https://doi.org/10.3390/su151813527
Chicago/Turabian StyleNur, Taufik, Akhmad Hidayatno, Andri D. Setiawan, Komarudin Komarudin, and Amalia Suzianti. 2023. "Environmental Impact Analysis to Achieve Sustainability for Artisan Chocolate Products Supply Chain" Sustainability 15, no. 18: 13527. https://doi.org/10.3390/su151813527
APA StyleNur, T., Hidayatno, A., Setiawan, A. D., Komarudin, K., & Suzianti, A. (2023). Environmental Impact Analysis to Achieve Sustainability for Artisan Chocolate Products Supply Chain. Sustainability, 15(18), 13527. https://doi.org/10.3390/su151813527