Article

Sustainability of a Rainfed Wheat Production System in Relation to Water and Nitrogen Dynamics in the Soil in the Eyre Peninsula, South Australia

1
Crop Sciences, South Australian Research and Development Institute, GPO Box 397, Adelaide, SA 5001, Australia
2
School of Agriculture, Food and Wine, The University of Adelaide, PMB No.1, Glen Osmond, SA 5064, Australia
3
College of Science and Engineering, Flinders University, Adelaide, SA 5042, Australia
4
Department of Environmental Sciences, University of California, Riverside, CA 92521, USA
5
School of Mechanical and Manufacturing Engineering, The University of New South Wales, Sydney, NSW 2052, Australia
6
Future Regions Research Centre, Federation University, Gippsland, VIC 3841, Australia
7
Faculty of Agriculture, University of Zagreb, Svetošimunska Cesta 25, 10000 Zagreb, Croatia
*
Author to whom correspondence should be addressed.
Sustainability 2023, 15(18), 13370; https://doi.org/10.3390/su151813370
Submission received: 11 August 2023 / Revised: 30 August 2023 / Accepted: 4 September 2023 / Published: 6 September 2023

Abstract

:
Rainfed wheat production systems are usually characterized by low-fertility soils and frequent droughts, creating an unfavorable environment for sustainable crop production. In this study, we used a processed-based biophysical numerical model to evaluate the water balance and nitrogen (N) dynamics in soils under rainfed wheat cultivation at low (219 mm, Pygery) and medium rainfall (392 mm, Yeelanna) sites in south Australia over the two seasons. Estimated evapotranspiration components and N partitioning data were used to calibrate and validate the model and to compute wheat’s water and N use efficiency. There was a large disparity in the estimated water balance components at the two sites. Plant water uptake accounted for 40–50% of rainfall, more at the low rainfall site. In contrast, leaching losses of up to 25% of seasonal rainfall at the medium rainfall site (Yeelanna) indicate a significant amount of water evading the root zone. The model-predicted N partitioning revealed that ammonia–nitrogen (NH4–N) contributed little to plant N nutrition, and its concentration in the soil remained below 2 ppm throughout the crop season except immediately after the NH4–N-based fertilizer application. Nitrate–nitrogen (NO3–N) contributed to most N uptake during both seasons at both locations. The N losses from the soil at the medium rainfall site (3.5–20.5 kg ha−1) were mainly attributed to NH4–N volatilization (Nv) and NO3–N leaching (NL) below the crop root zone. Water productivity (8–40 kg ha−1 mm−1) and N use efficiency (31–41 kg kg−1) showed immense variability induced by climate, water availability, and N dynamics in the soil. These results suggest that combining water balance and N modeling can help manage N applications to optimize wheat production and minimize N losses in rainfed agriculture.

1. Introduction

Water is one of the most limiting factors to increasing food and fiber production, especially in the arid and semi-arid regions of the world. In these regions, rainfall is insufficient and highly variable, often failing to satisfy the evapotranspiration demand of rainfed crop production. Low and sporadic rainfall in rainfed cultivated regions impacts crop water uptake and nutrient mineralization in soils of poor fertility [1,2]. Thus, crop production is affected by the unpredictability of water availability at crucial crop growth stages, causing yield and quality loss. Numerous studies have shown that grain production in semi-arid rainfed cropping systems strongly depends on soil moisture and N supply, i.e., it is thus co-limited [3,4]. Therefore, water-saving technologies, water retention, and effective use of water and nutrients are of paramount importance in fragile rainfed production systems.
Wheat production in Australia is characterized by low to medium rainfall (<450 mm) and a very high evaporative demand relative to rainfall (>3:1), with a coefficient of variation of 25–30% [5], making it one of the driest rainfed cropping environments in the world [6]. Moreover, the soils in rainfed regions vary in texture, composition, water-holding capacity, and nutrient availability, which adds to the challenges of sustainable crop production. These factors lead to wide region-to-region and seasonal variability in wheat production. For example, wheat production during 2021-22 (36 Mt) was more than double that in 2019-20 [7], predominantly associated with favorable climatic conditions. However, a long-term yield assessment revealed that Australia’s average annual wheat yield was only 50% (1.73 t ha−1) of the potential yield [8]. Therefore, identifying yield-limiting constraints in the soil–plant–atmosphere continuum [9] can help devise ways and means to close this wide gap in the water-limited yield and year-to-year variability in wheat production.
Achieving potential yield with less water has always been an endeavor in increasing crop productivity and water use efficiency. One major stumbling block in this pursuit is limited and seasonally varying water availability for rainfed wheat. In this regard, the French and Schultz [10] model has provided a valuable benchmark for assessing the water-limited yield potential of grain crops based on seasonal rainfall. It is widely used by many farmers from rainfed regions in Australia and other parts of the world. For example, the model prediction for wheat is 20 kg grain ha−1 mm−1 of water transpired above 110 mm evaporation. This prediction has been revised numerous times to include various climatic factors such as rainfall distribution and evaporative demand of the environment [11,12] and co-limitation of water and nitrogen factors [13,14]. The co-limitation assessment raised the water-limited wheat yield to 24 kg ha−1 mm−1, suggesting that low nutrient availability reduces water use efficiency and increases the gap between actual and water-limited yield potential. The major limitations of the French and Schultz [10] approach include its inability to account for the impact of the timing of growing season rain and water losses such as runoff or drainage and the assumption of constant seasonal evaporation [15]. These limitations can be addressed by more complex processed-based models commonly used for water balance studies under cropped conditions [16,17].
Water availability in the soils tremendously impacts nutrient availability and its uptake by the roots. The soil water content not only determines the crop N uptake but also controls biogeochemical N transformations, such as volatilization, nitrification, and urea hydrolysis. Therefore, water and N interactions in the soil affect crop growth and yield attributes, including photosynthesis, foliage growth, crop yield, protein content, leaf senescence, root-to-shoot water and N translocations, and microbial enzyme activity in the soil [4,18,19,20,21]. Benjamin et al. [22] reported that N uptake and N use efficiency were reduced with limited water availability during crop growth and corresponding limited N movement in the soil. On the other hand, N leaching and denitrification can occur when excessive water is applied [23,24]. Similarly, an appreciable amount of N can be lost to the atmosphere due to ammonium volatilization, especially when urea is top-dressed on the soil surface during the growing season [25,26,27].
Angus and Grace [1] reported that most grain cropping systems in Australia have a negative N balance, resulting from more N exported off-farm in agricultural products than applied as fertilizer or through biological nitrogen (N2) fixation. Numerous studies found that the recovery efficiency of N in rainfed wheat production is as low as 30–50% [1,28,29,30]. Furthermore, Gastal et al. [28] reported that between 50 and 75% of the applied N is either retained in the crop residues, remains in the soil, or is lost from the system, leading to environmental problems. Other studies also revealed that N applications higher than the crop demand might result in leaching losses, which could contaminate groundwater and trigger the eutrophication of freshwater and marine ecosystems [31,32]. Climate change further aggravates the problem and uncertainty regarding the supply of resources [33] and their optimum utilization [34]. Thus, maximization of water and N use is essential for ensuring long-term productive potential and maintaining the ecological functions of natural resources [35]. Hence, an increase in nitrogen use efficiency (NUE) will not only reduce the amount of applied N but also minimize N-related environmental pollution [36]. Therefore, accurate estimates of N reactive fluxes, plant uptake, and N losses (including gaseous) are required to fully understand N dynamics in the soil under rainfed wheat production systems.
Several process-based models (e.g., APSIM and HYDRUS) can provide estimates of effective water and N balances, use efficiencies, and losses from agricultural production systems. These models integrate the effect of rainfall, soil, weather, and other management practices to predict the dynamics of water and N movement in soils [37]. APSIM has been widely used in Australia to model the fate of water and nitrogen in rainfed farming systems (e.g., Keating et al. [16,38]). However, most of these studies have only used the bucket-type water balance module, the results of which can deviate from those provided by numerical simulations (e.g., HYDRUS), which provide more precise solutions of the partial differential equations describing non-linear water flow and convective–dispersive solute transport in soils [17].
Hence, the objectives of this investigation were to evaluate daily and seasonal soil water balances, including wheat’s root water uptake and the dynamics of N in the soil (mineralization, transformation, plant uptake, and gaseous losses), using HYDRUS-1D. Water (WUE) and N use efficiency (NUE) of wheat were also estimated using the model-simulated water and N balance components. This information can help devise better guidelines for enhancing fertilizer use efficiency and reducing N losses in rainfed wheat production regions.

2. Materials and Methods

2.1. Description of Study Sites

This study was part of a project to evaluate soil moisture and N information to assist farmers on the Eyre Peninsula in south Australia in making better management decisions for profitable wheat production. Two sites, i.e., Pygery (−32.9838° S, 135.3642° E) and Yeelanna (−34.1369° S, 135.7665° E), representing different soils, climates, and N applications, were selected for this study to assess water and nitrogen dynamics in the soils under wheat production. These sites were selected based on large differences in the rainfall, soil, growing conditions, and fertilizer use, which enabled the evaluation of diverse rainfed wheat growing systems. The Pygery (Py) site is located in the west coast region of the Eyre Peninsula and is characterized as a low rainfall zone. Annual average rainfall and reference crop evapotranspiration (ET0) at this site during the last 100 years amounted to 327 and 1397 mm, respectively. The Yeelanna (Ye) site is located in the lower Eyre Peninsula region, with annual average rainfall and ET0 of 411 and 1172 mm, respectively. More details about this project and specific growing conditions can be found in [39].
Cereals (wheat, barley), rotated with canola or pasture legumes, are the widely grown crops in the study region. However, a wheat crop was grown at both locations during the study period (2018 and 2019). Details about wheat variety, spacing, density, sowing, harvesting, and fertilizer applications during the two seasons are given in Table 1. Notably, the amount of N fertilizer applied at Yeelanna was much higher than at Pygery. At Pygery, N was added only at the time of sowing. In 2018, 55 kg of mono ammonium phosphate (MAP) and 30 kg of a blend of urea and ammonium sulfate/ha was applied, while in 2019, 40 kg of urea and 60 kg of a blend of urea and ammonium sulfate/ha was applied. The basal dose at Yeelanna applied at the time of sowing was 100 kg urea + 66 kg MAP/ha and 75 kg urea/ha during the 2018 and 2019 seasons, respectively. Apart from the initial application, two doses of 100 kg of N were applied during the season as a top dressing at Yeelanna. An extra N application is typically added in medium rainfall environments to enhance yield and, thus, profitability [40]. This reflects a wide range of farmers’ N use practices in different rainfall regions. Essentially, the extent and timing of N applications in dryland wheat farming systems depend on the timing and intensity of rainfall, which provides the necessary water to dissolve the fertilizer in the soil and make it available for root uptake.
Soil moisture probes (Sentek Sensor Technologies, Adelaide, SA, Australia) were installed in 2017, with sensors every 10 cm down to a depth of 40 cm and every 20 cm down to 100 cm. Soil samples were collected in triplicate from close to each sensor before crop sowing, and a representative composite sample from each layer was analyzed. The basic physicochemical properties of the soil were estimated following the standard procedures [41]. Data on soil texture, bulk density, pH, and organic carbon content are given in Table 2 for both sites. Soil texture at Pygery ranged from sandy loam to sandy clay, with clay contents increasing gradually with depth, while the texture at Yeelanna represents a typical duplex, sandy clay loam at the surface (0–10 cm) with heavy clay underneath. Both sites have soils with pH in the alkaline range and almost similar organic carbon contents (OC), except for a higher OC level (2.03%) in the surface soil at Yeelanna. The soil’s cation exchange capacity (CEC) at different depths was almost double at Yeelanna than at Pygery except in the surface layer (0–15 cm). The soil nitrate (NO3–N) and ammonium N (NH4–N) contents were analyzed at 0–15, 15–30, 30–60, and 60–100 cm soil depths.
The particle size distribution and bulk density of different layers at the study sites were measured to estimate the soil hydraulic parameters, which were used as inputs into the HYDRUS-1D model [17]. Measured values of the air-dry (θr) and saturated (θs) water contents were used in the simulations. Typically, the θr values (≈1500 kPa) were relatively high, a characteristic feature of heavy sub-soil clay commonly occurring in the dryland belt of the study region [42]. These parameters were further fine-tuned during the model calibration using water content dynamics data in the soil. Optimized parameters for both sites used in the numerical model are shown in Table 3.

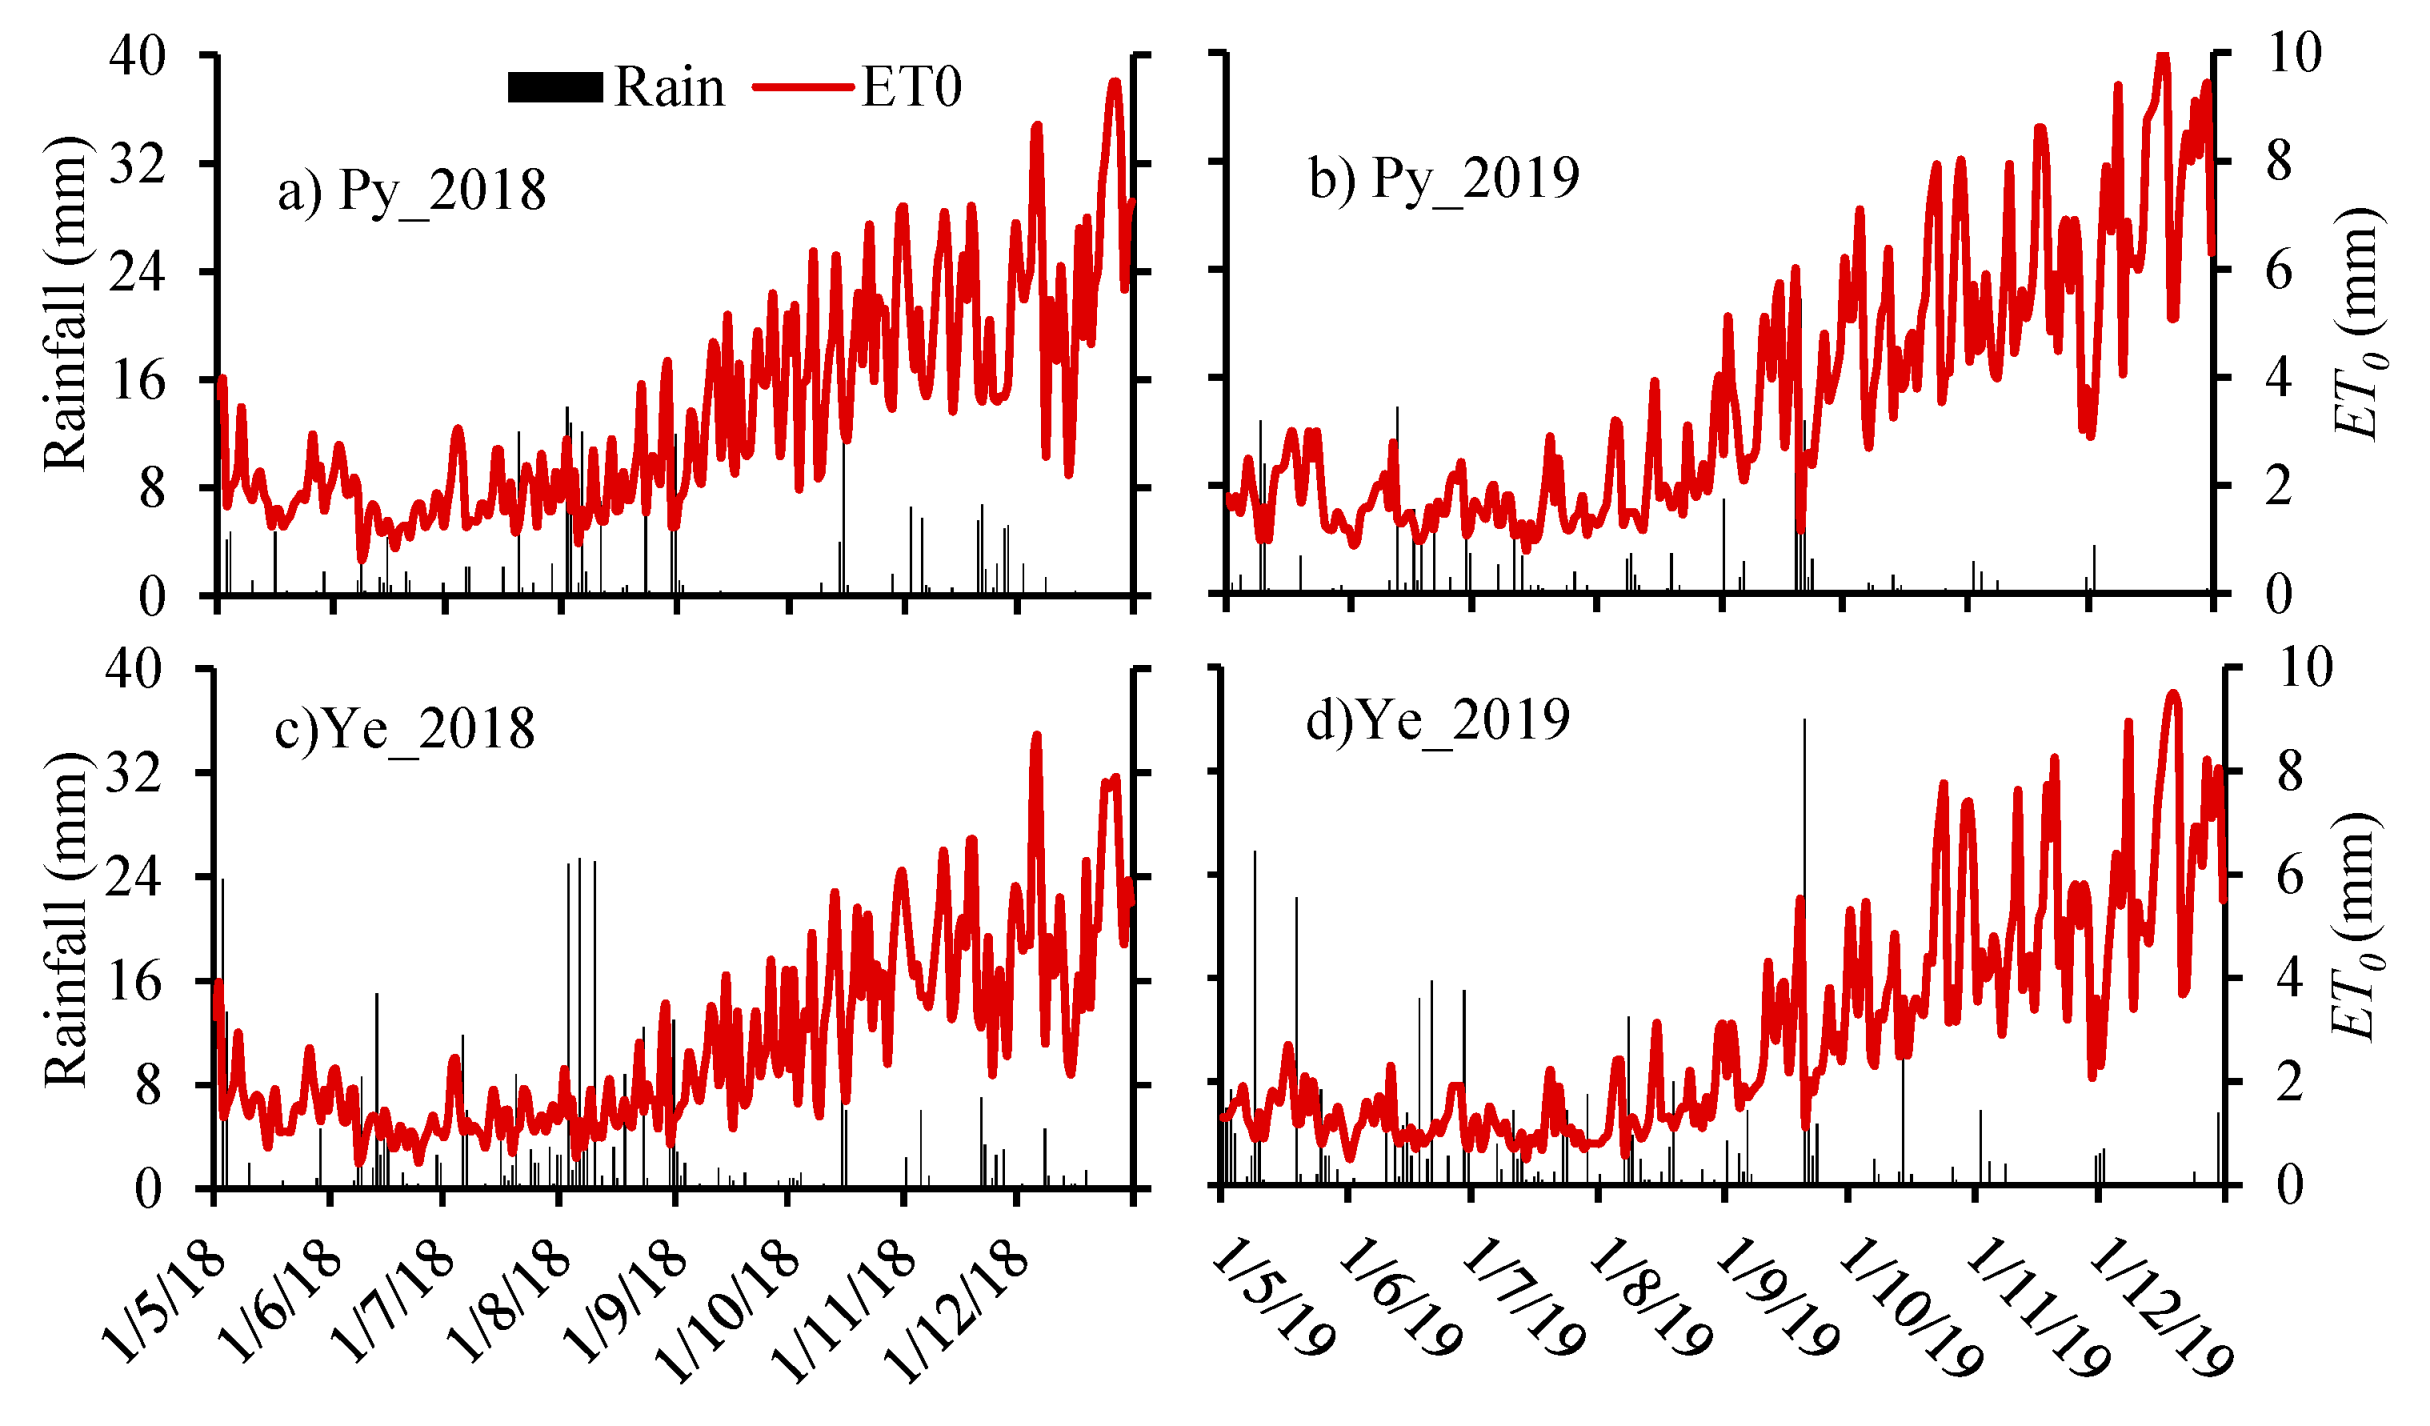
2.2. Climate Parameters

Local climate parameters were obtained from the SILO climate database [43] using the Wudinna Aero station (station 18083) for the Pygery site and the Yeelanna station (station 18,099) for the Yeelanna site. At Pygery, both 2018 and 2019 were dry years, with total rainfall during the wheat growing season (May to December) amounting to 208 and 190 mm, respectively (Figure 1). Most of the rain occurred during the winter period (May to August) when the crop water demand was low. Corresponding values of ET0 at the Py and Ye sites were 829 and 886 mm, respectively (Figure 1).
At Yeelanna, average values of rainfall and ET0 during the study period (2018–2019) and the wheat cropping season (May–December) were 365 and 693 mm, respectively (Figure 1). The ET0 values were usually low during the winter season and then increased during the wheat’s post-anthesis period, thus enhancing crop water demand between anthesis and harvest. Thus, low rainfall and high climate water demand at Pygery impose relatively adverse conditions for wheat cultivation compared to the Yeelanna site. Gradually increasing trends in the daily ET0 values suggest that the wheat growing season overlaps the winter season, slowly transitioning to summer under the Mediterranean climate.
Daily crop evapotranspiration (ETC) values for wheat were estimated from daily reference crop evapotranspiration (ET0) and crop coefficients (Kc) for different growth stages [44]. The daily ETC values were divided into the evaporation (Es) and transpiration (Tp) components based on the leaf area index (LAI) as follows [45]:
E s = E T c   .   e K g r   ×   LAI
T p = E T c E s  
where Kgr is the light extinction coefficient for wheat, and its value was set to 0.46 [46] for rainfed conditions. Estimated LAI values for wheat at both locations are shown in Figure 2. Daily wheat ETc values during the 2018 and 2019 seasons are shown in Supplementary Material (Figure S1a–d). Annual ETc values for wheat at Pygery and Yeelanna during 2018 and 2019 were 375.1 and 389.6 and 287.5 and 296.5 mm, respectively. These values and daily rainfall were then used as inputs into the HYDRUS-1D model to estimate the actual values of Es and Tp (Es act and Tp act) for wheat at both locations.

2.3. Brief Description of HYDRUS-1D

The HYDRUS-1D software can simulate one-dimensional variably saturated water flow, heat movement, and transport of solutes involved in sequential first-order decay reactions [17]. The governing one-dimensional water flow equation is described as follows:
θ t = z K ( h ) h z K ( h ) R ( h , z , t )
where θ is the soil water content (L3L−3), t is the time (T), h is the soil water pressure head (L), z is the vertical coordinate (L), K(h) is the unsaturated hydraulic conductivity function (LT−1), and R(h,z,t) is the sink term accounting for an actual volume of water uptake by plant roots from a unit volume of soil per unit time (L3L−3T−1). Water extraction R(h,z,t) from the soil was computed using the Feddes model [47]. Different values of the stress response function for wheat were taken from the HYDRUS-1D data repository. In this method, the potential transpiration rate, Tp, is distributed over the root zone using the normalized root density distribution between 0 and 1 and multiplied by the dimensionless water stress response function. Hence, this model assigns plant root water uptake rates according to local soil water pressure heads at any point in the root zone. Therefore, potential transpiration (Tp) is reduced below its potential value when the soil can no longer supply the amount of water required by the plant under the prevailing climatic conditions.
The partial differential equations governing one-dimensional dynamics of N involved in sequential first-order decay chain reactions during transient water flow in a variably saturated rigid porous medium [17] are given as:
d θ C 1 d t = d d z θ D 1 w d C 1 d z d q C 1 d z μ w , 1 θ C 1
d θ C 2 d t + d ρ S 2 d t + d a v g 2 d t = d d z θ D 2 w d C 2 d z + d d z a v D 2 g d g 2 d z d q C 2 d z μ w , 2 θ C 2 + γ s , 2 ρ + μ w , 1 θ C 1 r a , 2
d θ C 3 d t = d d z θ D 3 w d C 3 d z d q C 3 d z μ w , 3 θ C 3 + μ w , 2 θ C 2 r a , 3
where C is the solute concentration in the liquid phase (mg L−1), S is the solute concentration in the solid phase (mg g−1), g is the solute concentration in the gas phase (mg L−1), ρ is the dry bulk density (g cm−3), q is the volumetric flux density (cm day−1), µ’w is the first-order rate constant for the solute in the liquid phase (day−1), providing connections between individual chain species, γs is a zero-order rate constant in the solid phase (day−1), ra is the root nutrient uptake (mg L−1 day−1), Dw is the dispersion coefficient (cm2 day−1) for the liquid phase, and Dg is the diffusion coefficient (cm2 day−1) for the gas phase. The subscripts 1, 2, and 3 represent (NH2)2CO (urea), NH4+–N (ammonium N), and NO3–N (nitrate N), respectively. Adsorption/desorption of NH4+ is an instantaneous reaction between the soil solution and the exchange sites of the soil matrix [48].

2.4. Nitrogen Balance Parameters

Input parameters for the nitrogen transport in HYDRUS-1D are required to characterize the three main sets of processes: solute transport, solute reactions/transformations, and root solute uptake. Baldock et al. [49] defined the following N balance components in the soil, which are crucial to understanding and estimating the annual soil N dynamics.
N balance = (NF + NMin + Ndfa + Ndep) − (NR + NL + NV + NDen + NE)
where NF is N added to the soil in the form of chemical fertilizers, NMin is N added to the soil in the form of organic amendments (e.g., manure, composts, etc.), Ndfa is N derived from atmospheric N2 by symbiotic and non-symbiotic fixation, Ndep is the N deposition from the atmosphere, NR is N removed in harvested products, NL is N leached from the root zone, NV is N volatilized as ammonia from fertilizers and soils, NDen is N lost as N2 and N2O by denitrification, and NE is N lost by erosion.
In the N modeling study, all components of the N balance except for Ndfa, Ndep, NDen, and NE were considered. Neglected components were either present only in minute amounts (Ndfa, Ndep) in the wheat fields or represented negligible processes in dryland conditions (NDen, NE) [50,51]. Organic N mineralization (NMin) was estimated based on the assumption of 3% annual mineralization estimated for the study region [49].
The following values of solute transport parameters were used in the simulation; the molecular diffusion coefficients in free water (Dw) for NH4–N and NO3–N were 1.52 and 1.64 cm2 day−1, respectively, the molecular diffusion coefficient in the air (Dg) for NH3 was optimized as 18057.6 cm2 day−1, similar to other studies [52], the longitudinal dispersivity was considered equal to one-tenth of the profile depth [53], and Henry’s law constant (KH, at 25 °C) for NH4–N was 2.95 × 10⁻⁴ [54]. The distribution coefficients (Kd) for NH4 that varied from 1.0 to 1.8 cm3 mg−1 in different soil layers were adapted from Li et al. [52]. These values fall within the range reported for different mixed and layered soils [55]. The urea hydrolysis rate (Kh) of 0.74 day−1 in the topsoil layer (0–10 cm) adapted in the current study is consistent with the reported values in numerous studies under different soils and climate conditions [52,56,57].
The nitrification rates were calibrated to vary from 0.02 to 0.25 day−1, with higher surface soil values, then decreasing gradually with depths. The volatilization rate of 0.24 kg ha−1 day−1 reported under rainfed wheat cultivation in south Australia [27] was used in the current study. While some of these processes are temperature- and water-content-dependent, neglecting these dependencies is common [37,52] due to the lack of such information and measured data. Unlimited passive uptake of NO3–N was allowed in the root solute uptake model [58] by specifying the maximum allowed uptake concentration exceeding NO3–N concentrations in the root zone. In addition to passive uptake, active uptake of NH4–N was also integrated into the simulations. The Michaelis–Menten constant for active uptake of NH4 was assumed to equal the default value of 0.5 mg L−1.

2.5. Initial and Boundary Conditions

The initial water contents at various depths were set using the soil water contents measured by the capacitance probe. Measured ammonium and nitrate contents in the soil, specified in terms of N concentrations (NH4–N and NO3–N), were set as the initial conditions for N simulations. The initial concentration representing the basal fertilizer application was calculated using the initial soil water content, assuming fertilizer was mixed within the surface 10 cm layer. An atmospheric boundary condition with surface runoff was specified at the soil surface for water flow. The free drainage boundary condition was imposed at the bottom of the domain (105 cm). Root water uptake was calculated using the potential transpiration rate, specified rooting depth and density, and the Feddes’ stress response function [47]. The upper boundary condition for solute transport was set as a ‘volatile’ boundary condition [59] with a stagnant boundary layer of 2.5 cm. This boundary condition assumes a stagnant boundary layer (air) at the top of the soil profile and that upward solute movement through this layer is by solute diffusion in air, facilitating the simulation of volatilization losses of N. A third-type boundary condition was used at the lower boundary. The concentration fluxes of N for all fertilizer applications were calculated in N content terms. The top-dressed fertilizer application during the wheat season is represented in the model by converting the amount of applied urea into the boundary concentration using the known value of the water content in the topsoil layer (from the previous water flow simulation) at the time of fertilizer application.
HYDRUS-1D simulations were commenced on 1 May 2018 and continued until 31 December 2019 for both locations. Theoretical details and more information on the HYDRUS-1D software and related references can be found at https://www.pc-progress.com/en/Default.aspx?HYDRUS-3D (accessed on 30 August 2023).

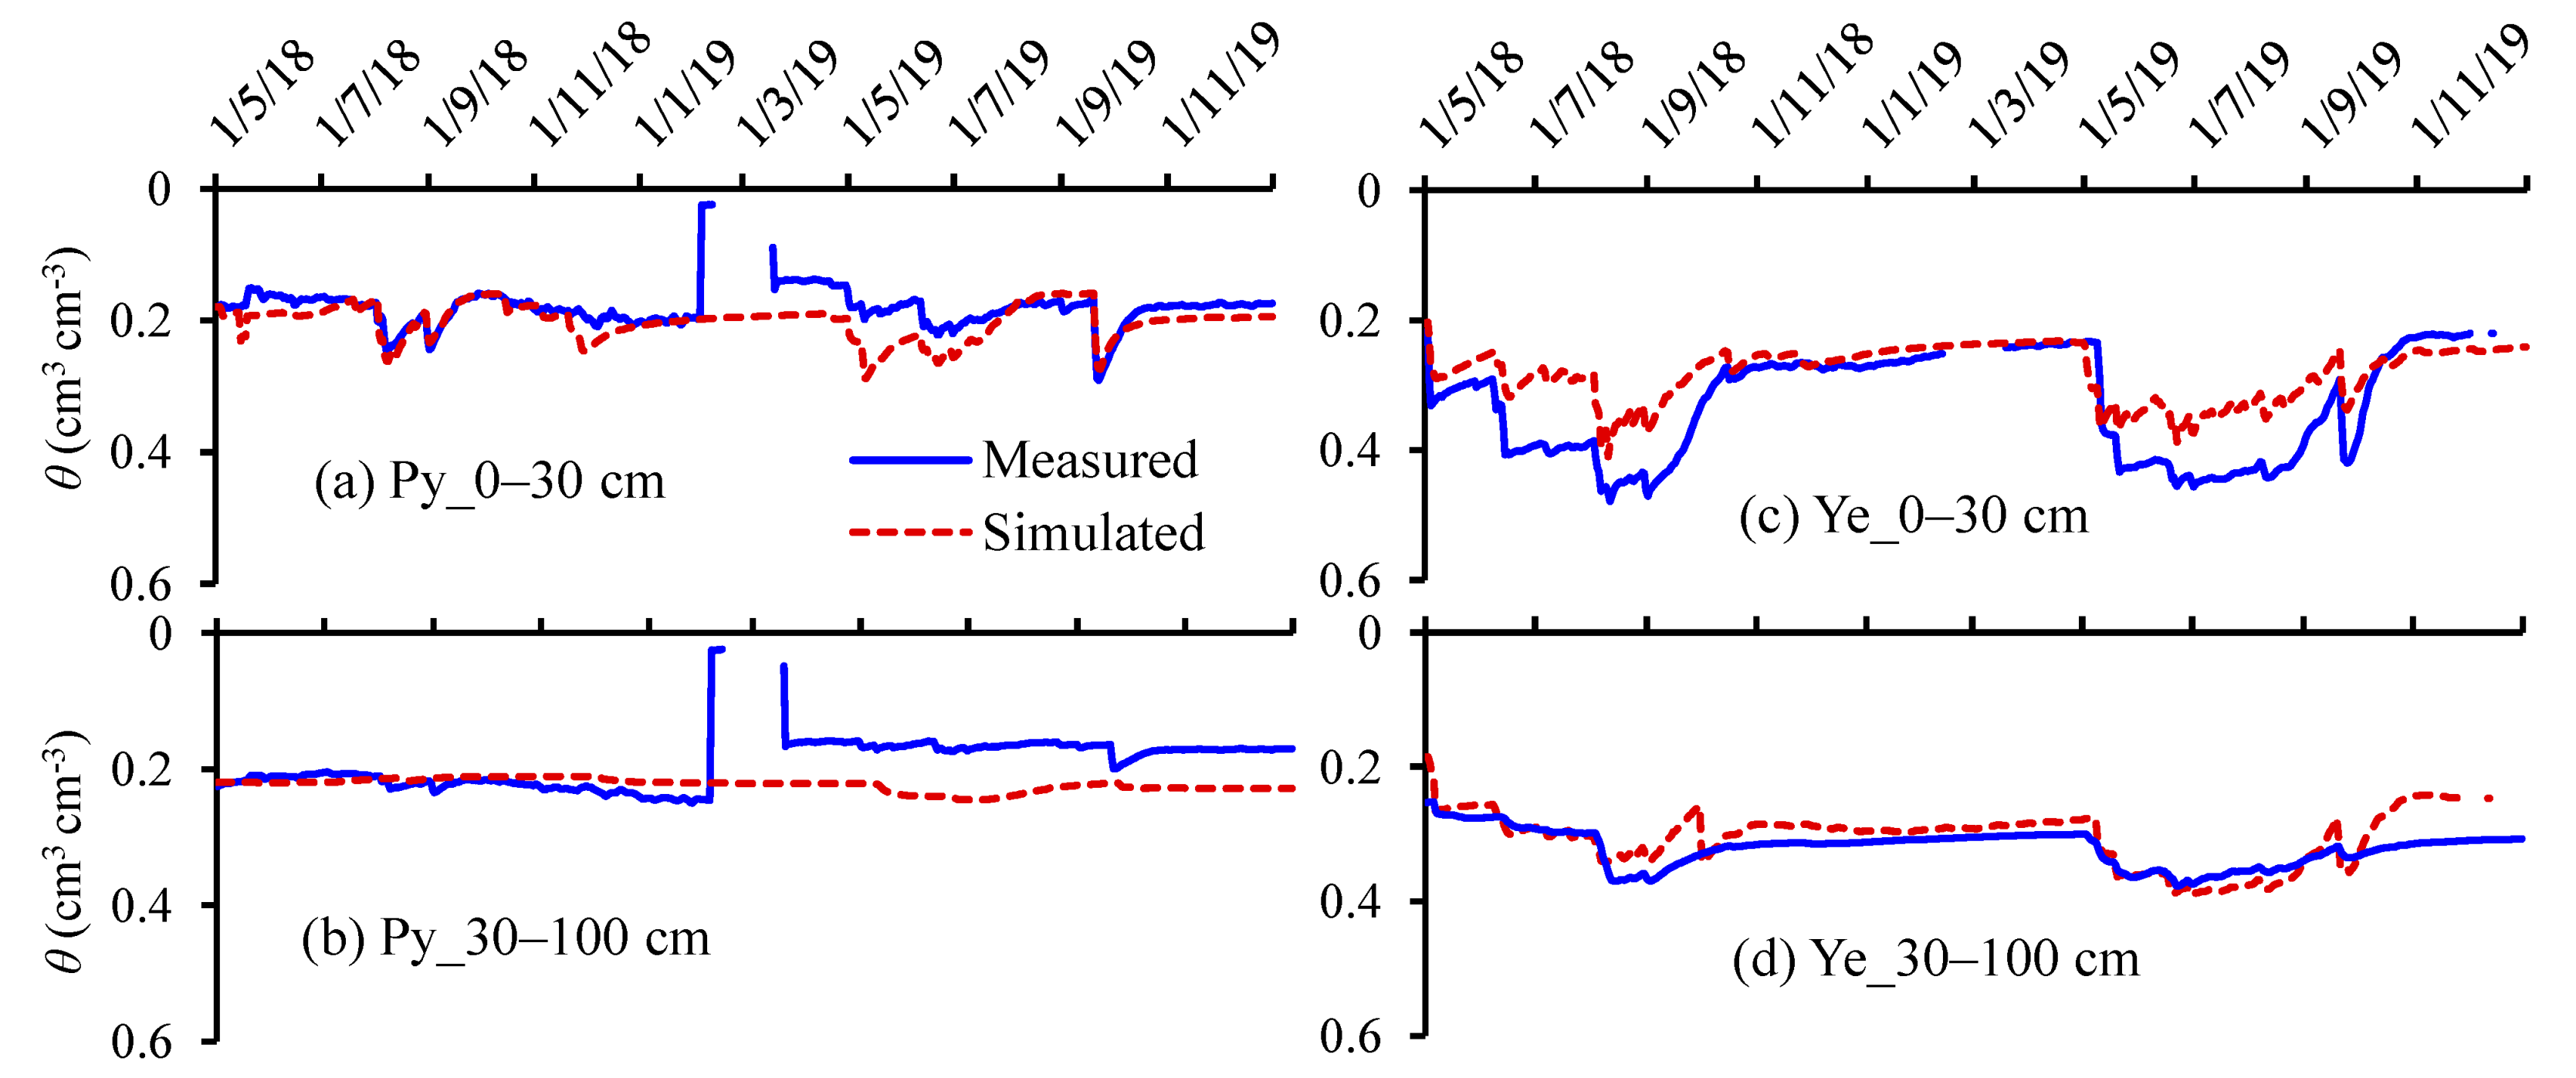
2.6. Model Evaluation

The modeling performance for water balance was evaluated by comparing capacitance probe-measured (O) soil moisture values at various depths with those predicted by HYDRUS-1D (P) for the 2018 and 2019 crop seasons. The statistical error estimates, mean error (ME), mean absolute error (MAE), and root mean square error (RMSE), between the measured and simulated spatiotemporal water contents, were estimated as:
M E = 1 N i = 1 N O i P i
M A E = 1 N i = 1 N O i P i
R M S E = 1 N i = 1 N O i P i 2

3. Results

3.1. Soil Water Dynamics in the Soil

The capacitance probe measured daily soil water contents in 0–30 cm and 30–100 cm depths at the Pygery and Yeelanna sites, which were compared with corresponding HYDRUS-1D simulated values in Figure 3. The simulations showed small changes in the wetting of the upper horizon (<30 cm) at the Py site due to the instant depletion of soil moisture in response to soil evaporation and plant transpiration. However, at the medium rainfall site (Ye), the water content rapidly increased in the 0–30 cm horizon. In the second horizon (30–100 cm), both data sets showed only small changes in moisture content over the two wheat seasons. A close correspondence between the observed and modeled moisture distribution patterns exists in both horizons, despite the probe malfunction in 2018 during a short period from mid-February to mid-March 2019 (Figure 3). The moisture probe measured slightly lower values during the post-harvest wheat season, especially at deeper depths (>30 cm). The HYDRUS-1D results distinctly show two soil horizons with a boundary at a depth of 30 cm. It should be noted that measured and simulated moisture contents in the soil below 30 cm are consistently high during both seasons, especially at the Yeelanna site (between 0.25 and 0.35 cm3 cm−3). Similar values of soil water contents were observed in other regional studies [60]. This is a typical characteristic of sub-soil heavy clay in the study region, with the clay fraction at the Yeelanna site as high as 75% (Table 1). These soils can hold a large amount of water, varying between 0.2 and 0.25 cm3 cm−3 at the wilting point (1500 kPa), which is unavailable to plants. In addition, these soils may have sub-soil constraints such as compaction, which further restricts the water movement and uptake by growing crop plants [60]. Hence, the water contents in the sub-soils (>30 cm depth) remained consistently static during the entire cropping season.
Statistical errors (ME, MAE, and RMSE) assessing the comparison between HYDRUS-1D simulated and measured soil water contents for the soil surface (0–30 cm) and deeper (30–100 cm) layers showed a varied response (Table 4). The RMSE, MAE, and ME values for the surface depth (0–30 cm) during 2018 and 2019 at Pygery remained between −0.02 and 0.03 cm3 cm−3, indicating a close agreement. The corresponding values for the 30–100 cm profile were between −0.06 and 0.07 cm3 cm−3, slightly higher than for the surface layer. At Yeelanna, the error estimates during 2018 ranged from −0.02 to 0.06 and from 0.03 to 0.04 cm3 cm−3 in the 0–30 cm and 30–100 cm soil depths, respectively. During the validation period (2019), the error values varied from −0.04 to 0.07 cm3 cm−3. Wang et al. [61] reported RMSE and mean relative error (MRE) values of 0.07 cm3 cm−3 and 21.6%, respectively, as accurate estimation of water content dynamics in the soil by SWAP model under wheat irrigated with varied levels of deficit irrigations. Error estimates reported in other studies [37,62] also corroborate well with the values estimated in the current study, which showed a good agreement between measured and simulated water content dynamics in the soil.
There are numerous possible reasons for the deviations in the behavior of water content dynamics in the soil. Apart from model assumptions, capacitance probes can induce significant errors in the water content measurements. Numerical modeling depends on three crucial factors: (a) the accuracy of model input parameters; (b) the precision of observed values compared with the model output; and (c) sensitivity in the initial conditions. Ramos et al. [62] showed that deviations between measured and model-predicted water content dynamics in the soils might be related to field measurements, model inputs, and model structural errors. The moisture probe’s calibration and the inherent complexities of the soil [63] are additional crucial factors that immensely affect the extent of the divergence between observed and modeled data. These factors may contribute to a similar extent of deviations in water contents as obtained by modeling predictions. It is also likely that higher observed values of the water content at lower depths (>50 cm) at Yeelanna may have contributed to larger values of the error statistics. Overall, a good agreement between the measured and simulated data shows that the model can predict the effects of different weather and soil properties at different sites and respond to various field variations.

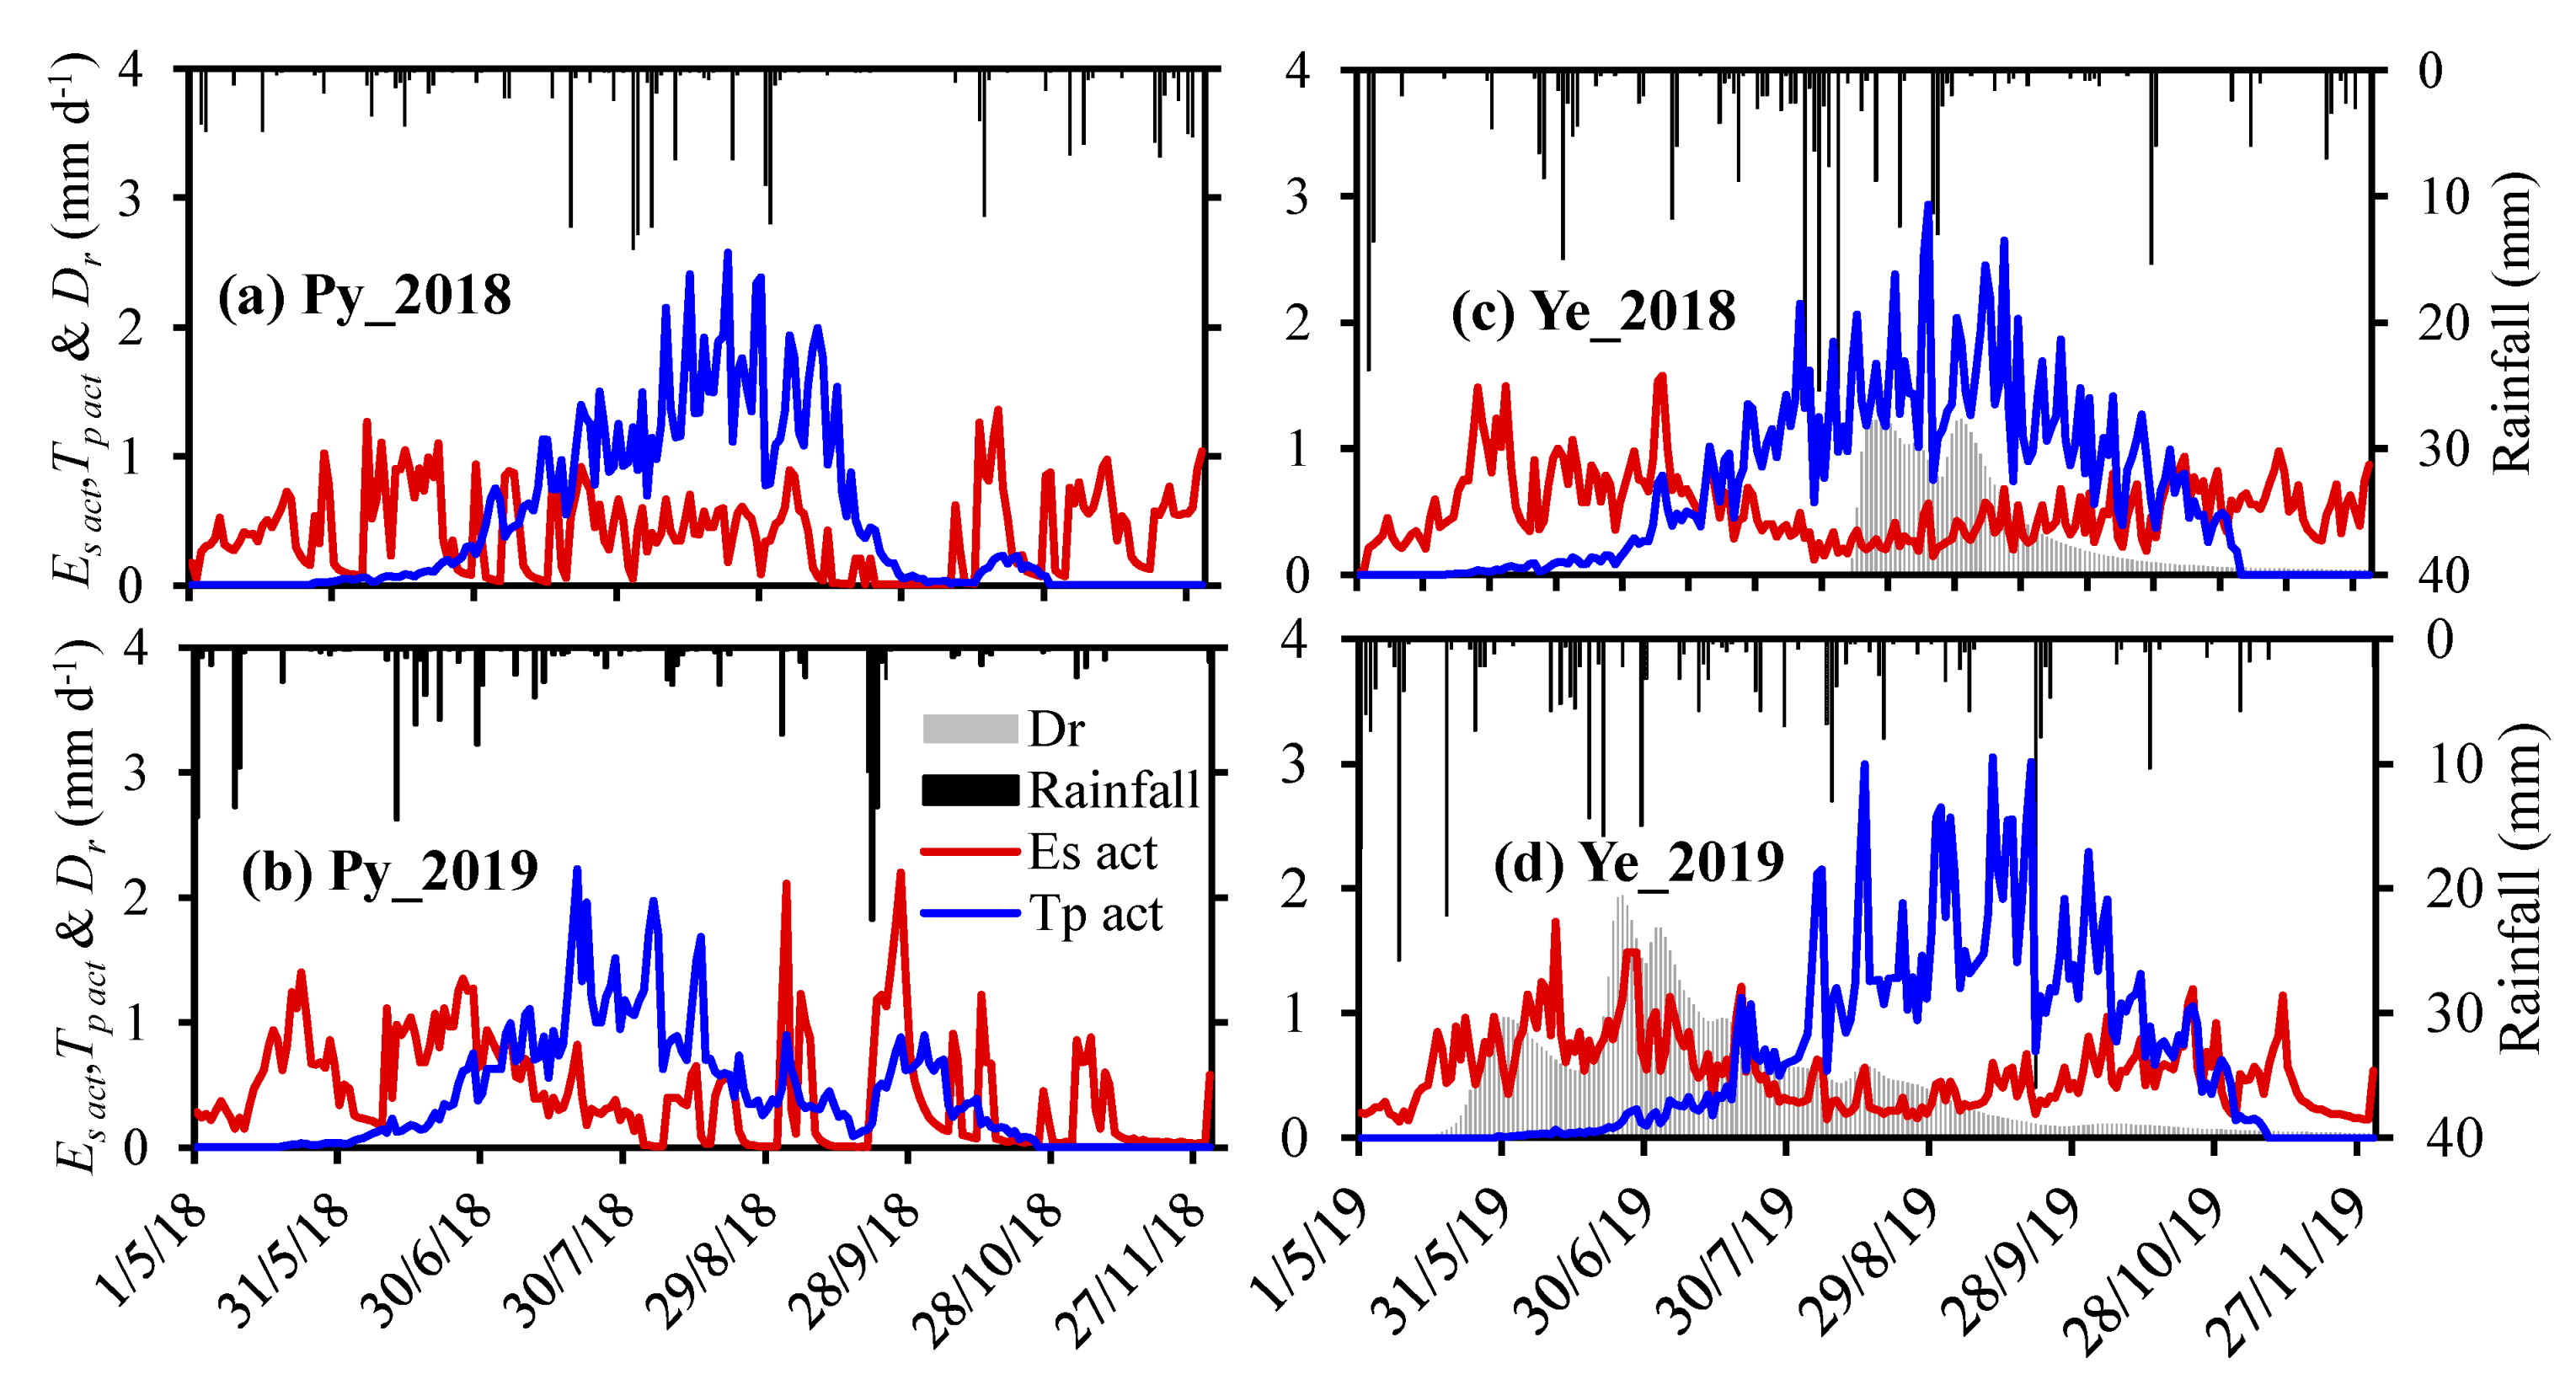
3.2. Soil Water Balance

Seasonal water balance components (Tp act = actual plant water uptake, Es = soil evaporation, Dr = drainage, ∆S = soil storage/depletion) for the wheat crop at Pygery (Py) and Yeelanna (Ye) predicted by HYDRUS-1D during 2018 and 2019 are shown in Table 5. At Pygery, evaporation losses during the crop season (May to October) varied from 44 to 57%, with an average of 50% of the rainfall received. The remaining water (43–58%) was attributed to plant uptake, while drainage losses were negligible. At Yeelanna, Es losses varied from 29 to 42%, with an average value of 33%, significantly lower than at Pygery. Plant water uptake varied from 41 to 49%, with an average value of 40%. The drainage component (Dr) represents 12–26% (41–90 mm) of the rainfall received during the cropping season, which is the main difference between the two sites.
Daily Tp act and Es components of the water balance simulated by HYDRUS-1D during 2018 and 2019 at Pygery and Yeelanna are shown in Figure 4. At Pygery, daily plant water uptake varied from 0 to 2.6 mm during 2018, while the maximum value was 2.2 mm during the 2019 crop season. As expected, daily evaporation losses (Es) were higher before sowing and after the crop harvest. However, the magnitude remained low during 2018 (0–1.5 mm), reflecting the moisture availability in the surface soil layer. During 2019, spikes in daily evaporation (up to 2 mm) were similar to plant water uptake, especially during crop maturity and harvest (September and October).
At Yeelanna, the maximum daily plant water uptake (Tp act) reached about 3 mm during the 2018 and 2019 seasons (Figure 4). The magnitude of daily Tp act losses was similar to Pygery, but there was less fluctuation in the daily dynamics, probably due to the consistent availability of moisture in the surface layer. One of the important components of the water balance at Yeelanna is drainage (Dr), which was negligible at Pygery. Daily drainage (Dr) losses occurred in August–September of 2018, while these losses were higher early in the season (mid-May to August) during 2019.

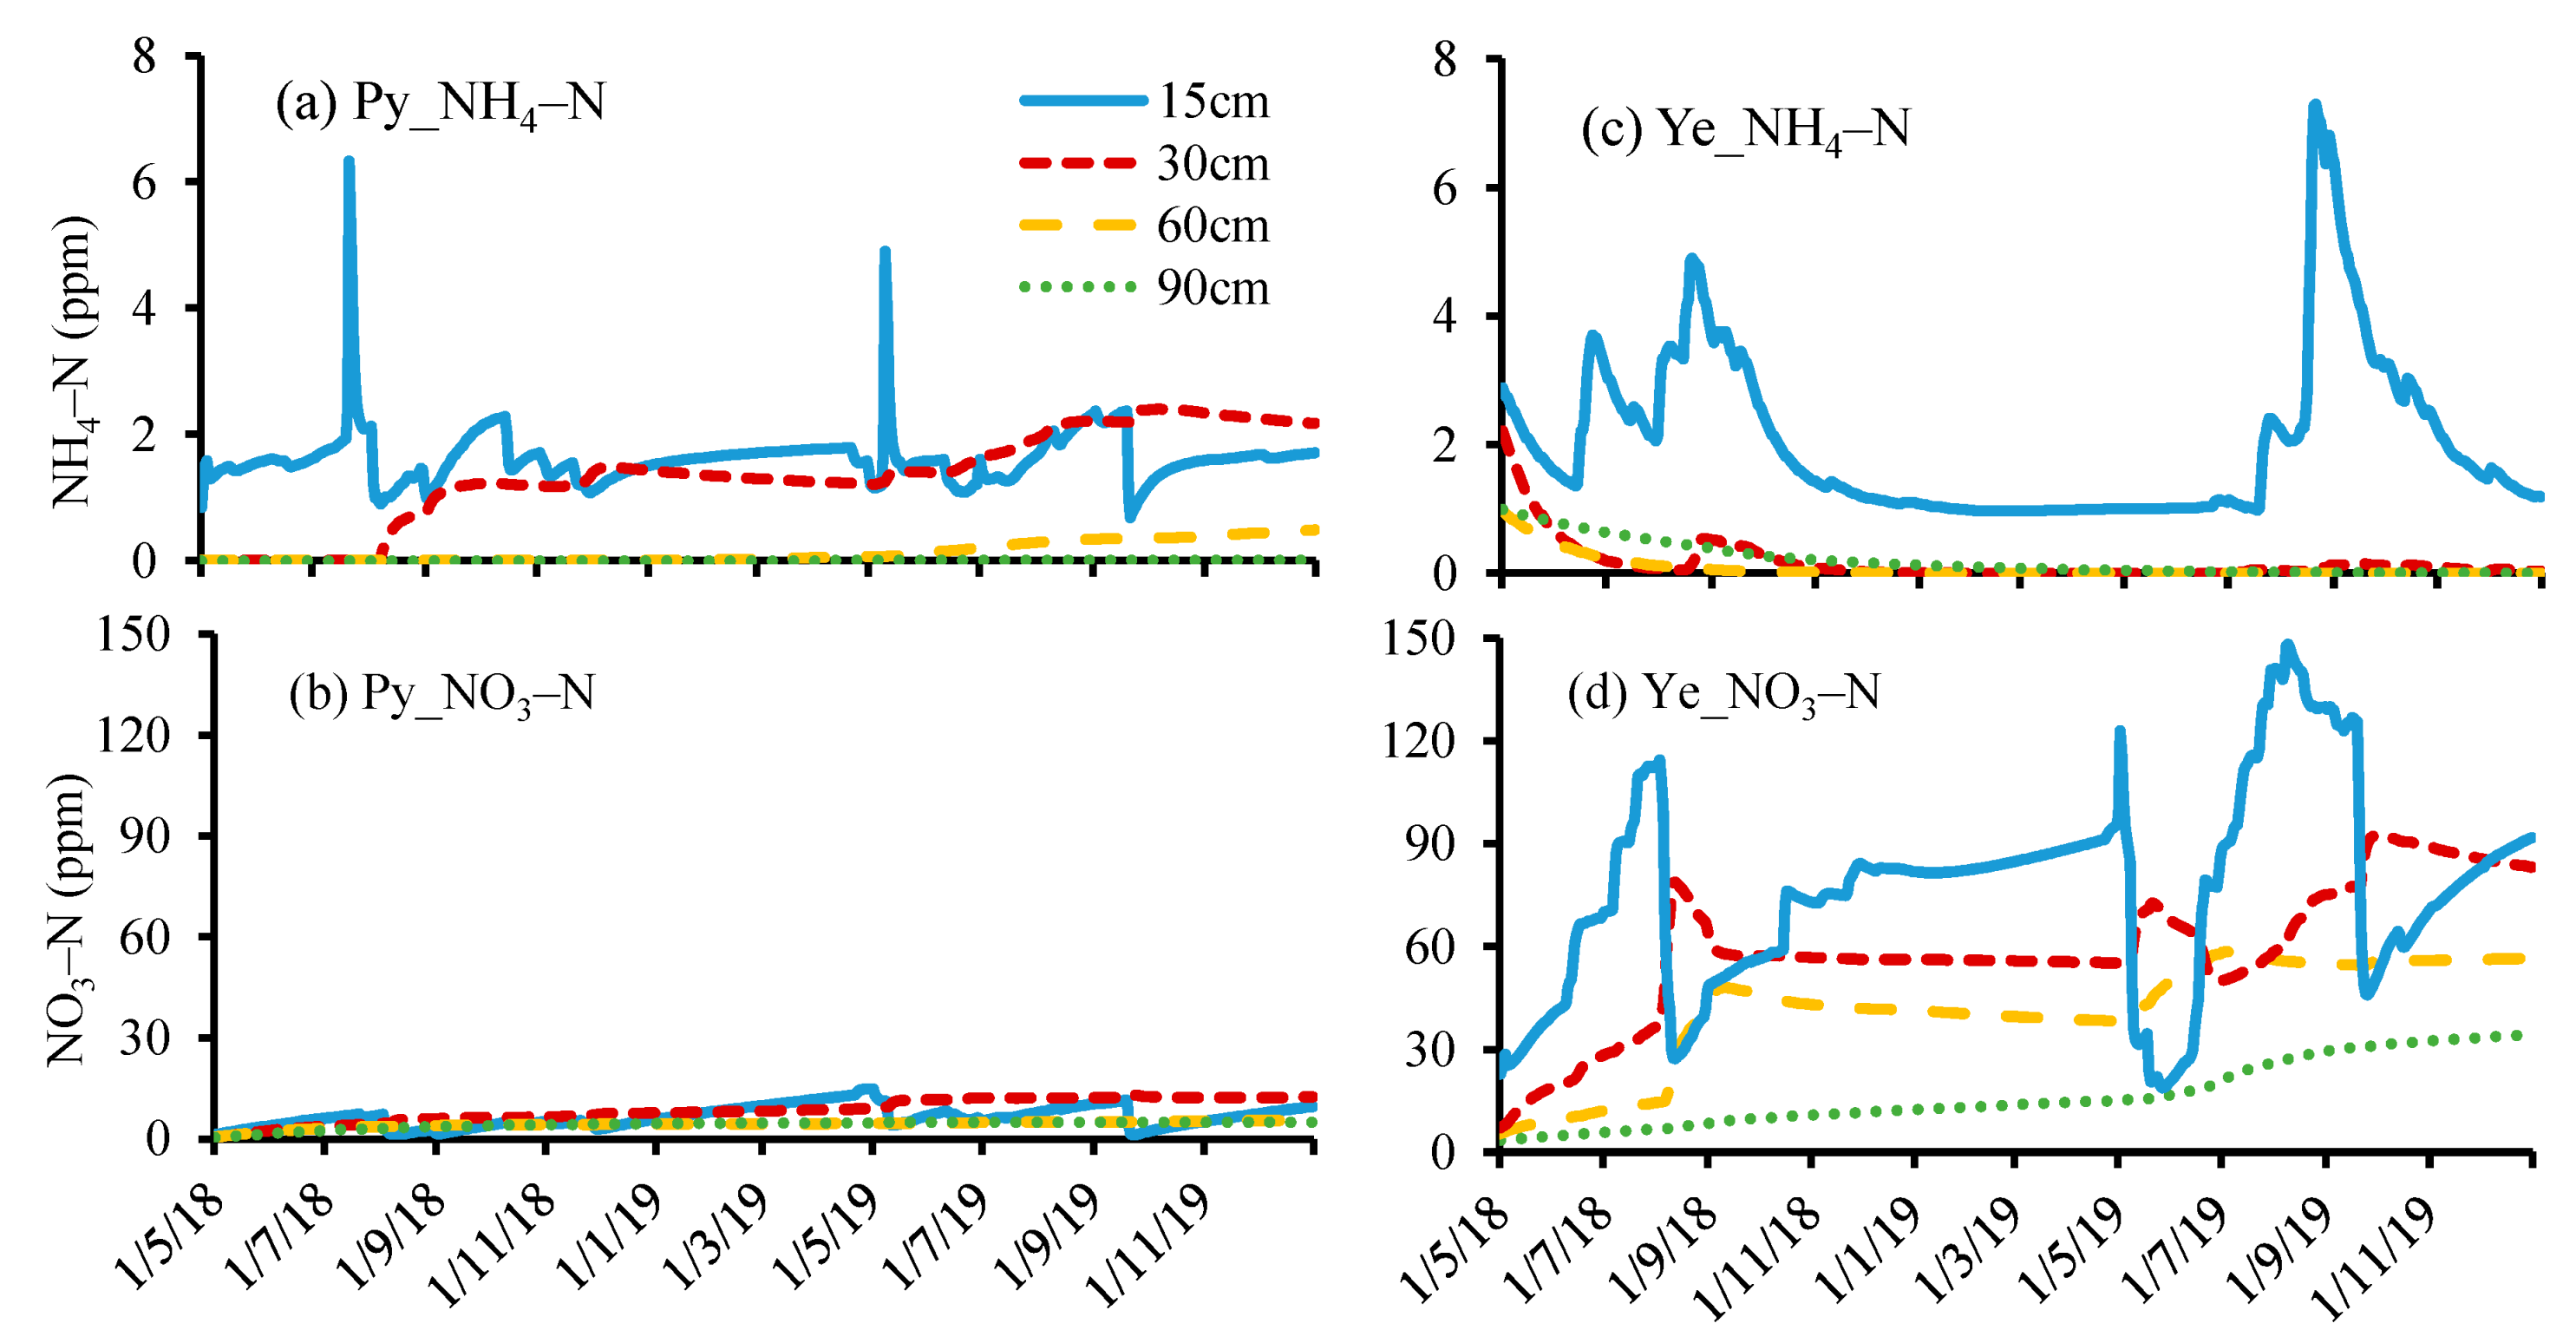
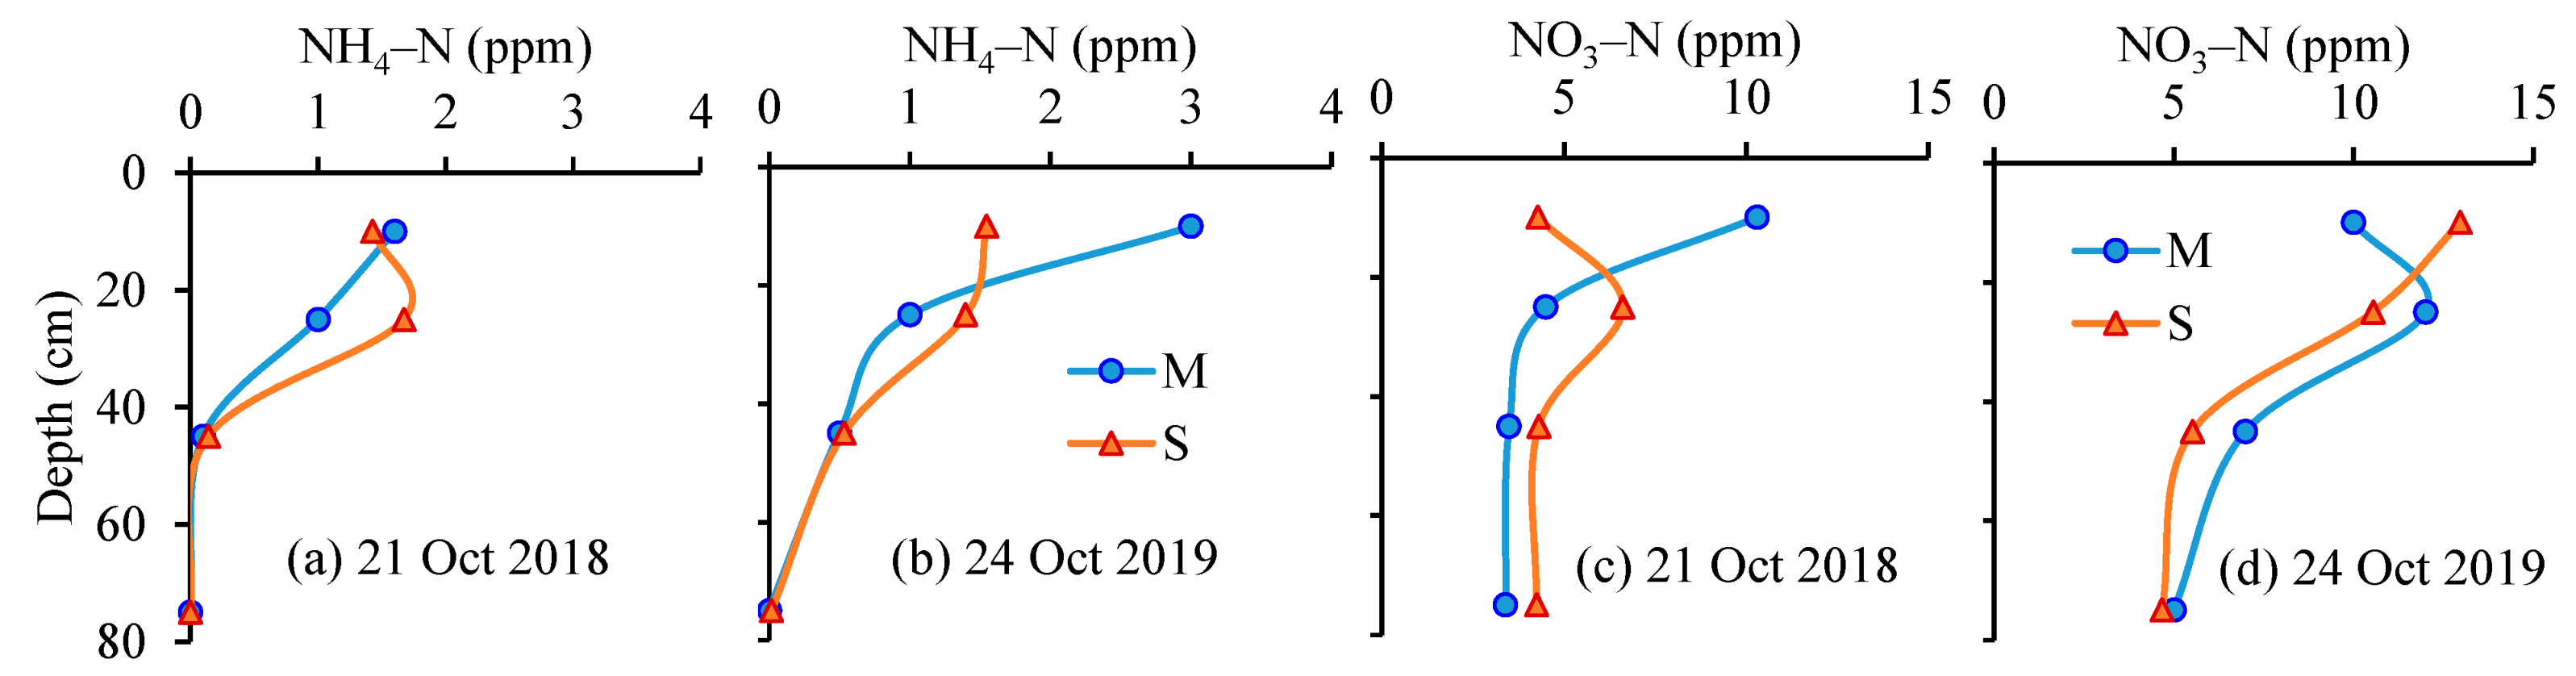
3.3. Nitrogen Simulation in the Soils

Nitrogen species commonly occurring in a dissolved state in the soil solution are NH4–N and NO3–N. These species control the plant-available forms of N in the soils. The dynamics of these species depend on the number and magnitude of N pools in the soil, their interactions, transformations, and exchanges among them. The comparison of measured and simulated values of NH4–N and NO3–N in the soil at various depths at the time of wheat harvest is shown in Figure 5 for the Pygery site. Some inconsistencies include the higher simulated value of NO3–N than measured in the surface soil (0–15 cm) during 2018, which subsequently increased in the second layer (15–30 cm) and then showed a similar pattern as measured values. Similarly, the measured NH4–N value was higher than simulated, while the reverse was true for NO3–N in the surface layer during the 2019 season. However, at other depths, the simulated values of both species matched well with the measured values. Furthermore, the profile-averaged measured NH4–N values of 0.7 and 1.1 ppm were comparable to the corresponding simulated values of 0.8 and 0.9 ppm, respectively, during the 2018 and 2019 wheat seasons.
Similarly, measured profile-averaged NO3–N contents of 5.4 and 8.5 ppm matched well with the corresponding simulated values of 4.9 and 8.4 ppm, respectively, during 2018 and 2019. This indicates that the model has been able to simulate the N dynamics in the soil profile under wheat crop at the Pygery site. Modelled N dynamics in the soil at the Yeelanna site could not be compared in the absence of appropriate measured data. Overall, the patterns of NH4–N and NO3–N values in the soil indicate that the modeling approaches used to account for N mineralization, transformation, plant uptake, and conversions of N among different pools in the soils are reasonably sound. However, intensive soil observations for nitrogen transformations, losses, and soil solution species are required to improve the simulation at both field sites.
The spatiotemporal dynamics of the simulated concentrations of these species are shown in Figure 6 for both sites. The distribution pattern of N species revealed that a fraction of NH4–N always remained in the soil due to the continuous decomposition of organic N to NH4–N considered by the HYDRUS-1D model. High peaks of NH4–N in the soil, especially in the surface layers (0–15 and 15–30 cm), corresponded to the fertilizer applications. However, the increasing presence of NH4–N in low concentrations in the lower layers of the soil profile indicates a slow downward movement of NH4–N in the soil with time. However, NH4–N concentrations in the soil remained below 2 ppm throughout the simulation except after applying the NH4–N fertilizer.
Simulated daily NO3–N concentrations at the Pygery site gradually increased with time, especially in the surface soil layer (0–40 cm). They fluctuated between 1.2 and 14.9 ppm in the 0–15 cm layer (Figure 6b). The gradual peaks in the surface layer (0–15 cm) reveal the conversion of NH4–N to NO3–N via nitrification. These peaks subsequently moved to lower depths with lower concentrations and a lag time reflecting plant uptake. At deeper soil layers (below 50 cm), the NO3–N concentrations were more or less stable around 5 ppm, indicating reduced N uptake and transformation activities in this zone. This also suggests a lack of deep drainage at Pygery, a crucial driver for transporting NO3–N deeper into the soil. The water balance at the Pygery site strongly supports this observation (Table 4).
At Yeelanna, HYDRUS-1D predicted higher NH4–N concentrations in the soil than at Pygery (Figure 6c). The NH4–N concentrations in the surface layer (0–15 cm) reached high values of 4.8 and 7 ppm after the fertilizer application. The continued presence of NH4–N in low concentrations in the surface zone indicates the continual production of NH4–N by mineralizing organic matter. On the other hand, the peak NO3–N concentration in the 0–15 cm soil depth at Yeelanna was almost 8–10 times higher than at Pygery. During 2018, the NO3–N concentration increased to 112 ppm in response to fertilizer application and subsequently decreased in early September, likely due to leaching (Figure 6d). Later in the season, during the post-harvest summer period, the NO3–N concentration in the upper soil layers (0–15 cm) increased with a decrease in the soil water content. The NO3–N concentration in the soil peaked at 144 ppm in 2019 due to much higher N application and then decreased due to plant uptake and late-season leaching. At the end of the simulation in 2019 (31 December 2019), the NO3–N concentration in the soil ranged from 34 to 91 ppm. Higher concentrations of NH4–N and NO3–N in the soil at Yeelanna were directly related to higher N applications. High levels of NO3-N concentration were reported in other modeling studies under similar N fertilization and wheat production conditions [64].

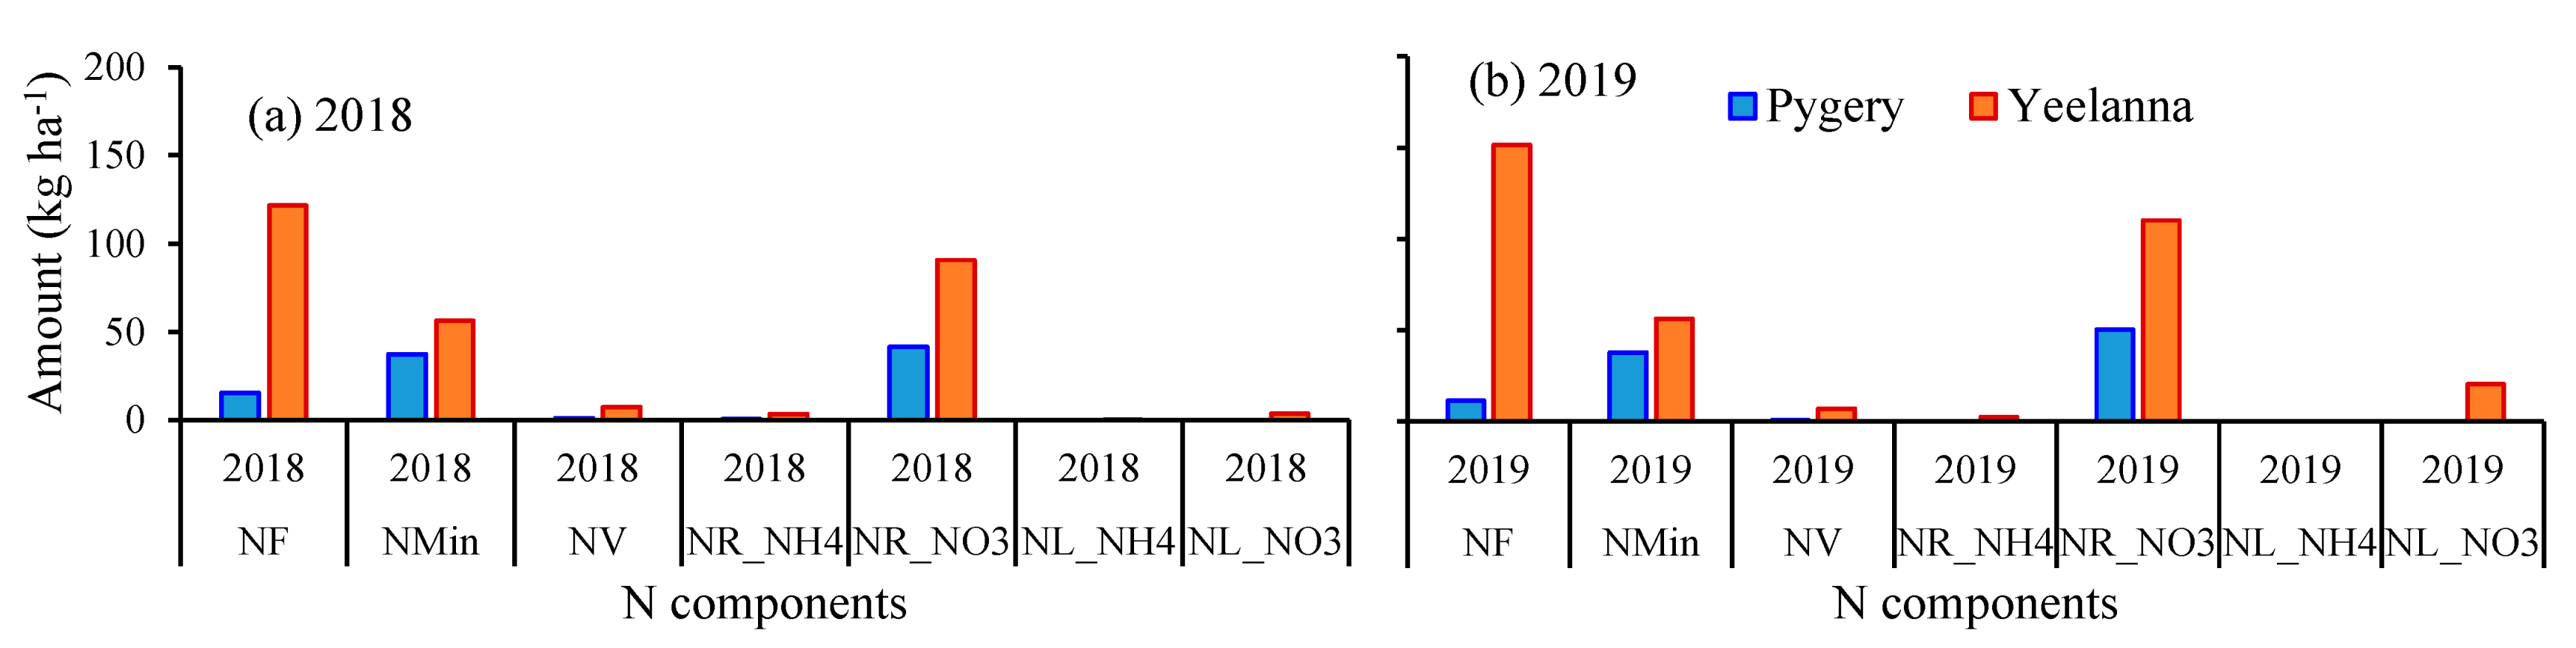
3.4. Nitrogen Balance in Soils

3.4.1. Mineralization of Organic N in the Soil

The breakdown of organic matter in the soil (NMin) at Pygery during the cropping season (May–December) added 37.3 kg N ha−1 during 2018 and almost a similar amount during 2019 (Figure 7). HYDRUS-1D predicted higher NMin (56.2 to 56.4 kg N ha−1) for the soil at Yeelanna than at Pygery due to the higher organic carbon content in the soil at the former (2.03%) relative to the latter (1.17%) site. Additionally, relatively low rainfall at Pygery perhaps impacted the microbial decomposition of organic matter because the mineralization rate is only about two-thirds of that at Yeelanna. The absolute values of daily NMin at Pygery ranged between 0.15 and 0.17 kg N ha−1, whereas the corresponding values for Yeelanna ranged from 0.22 to 0.25 kg N ha−1, with an average seasonal total of 37.5 and 56.3 kg N ha−1 at Pygery and Yeelanna, respectively. The conversion of NH4–N to NO3–N in the soil at Pygery was relatively poor compared to Yeelanna due to unfavorable moisture and temperature conditions. Therefore, relatively higher NH4–N deposition/storage in the soil occurred at Pygery than at Yeelanna. There was a slight increase in the NMin rate during the cropping/winter season at both locations. However, these estimates will vary over the years, depending on the substrate’s content and quality, the C:N ratio, microbial activity, and climate variability, including rainfall and temperature variations [1,65].

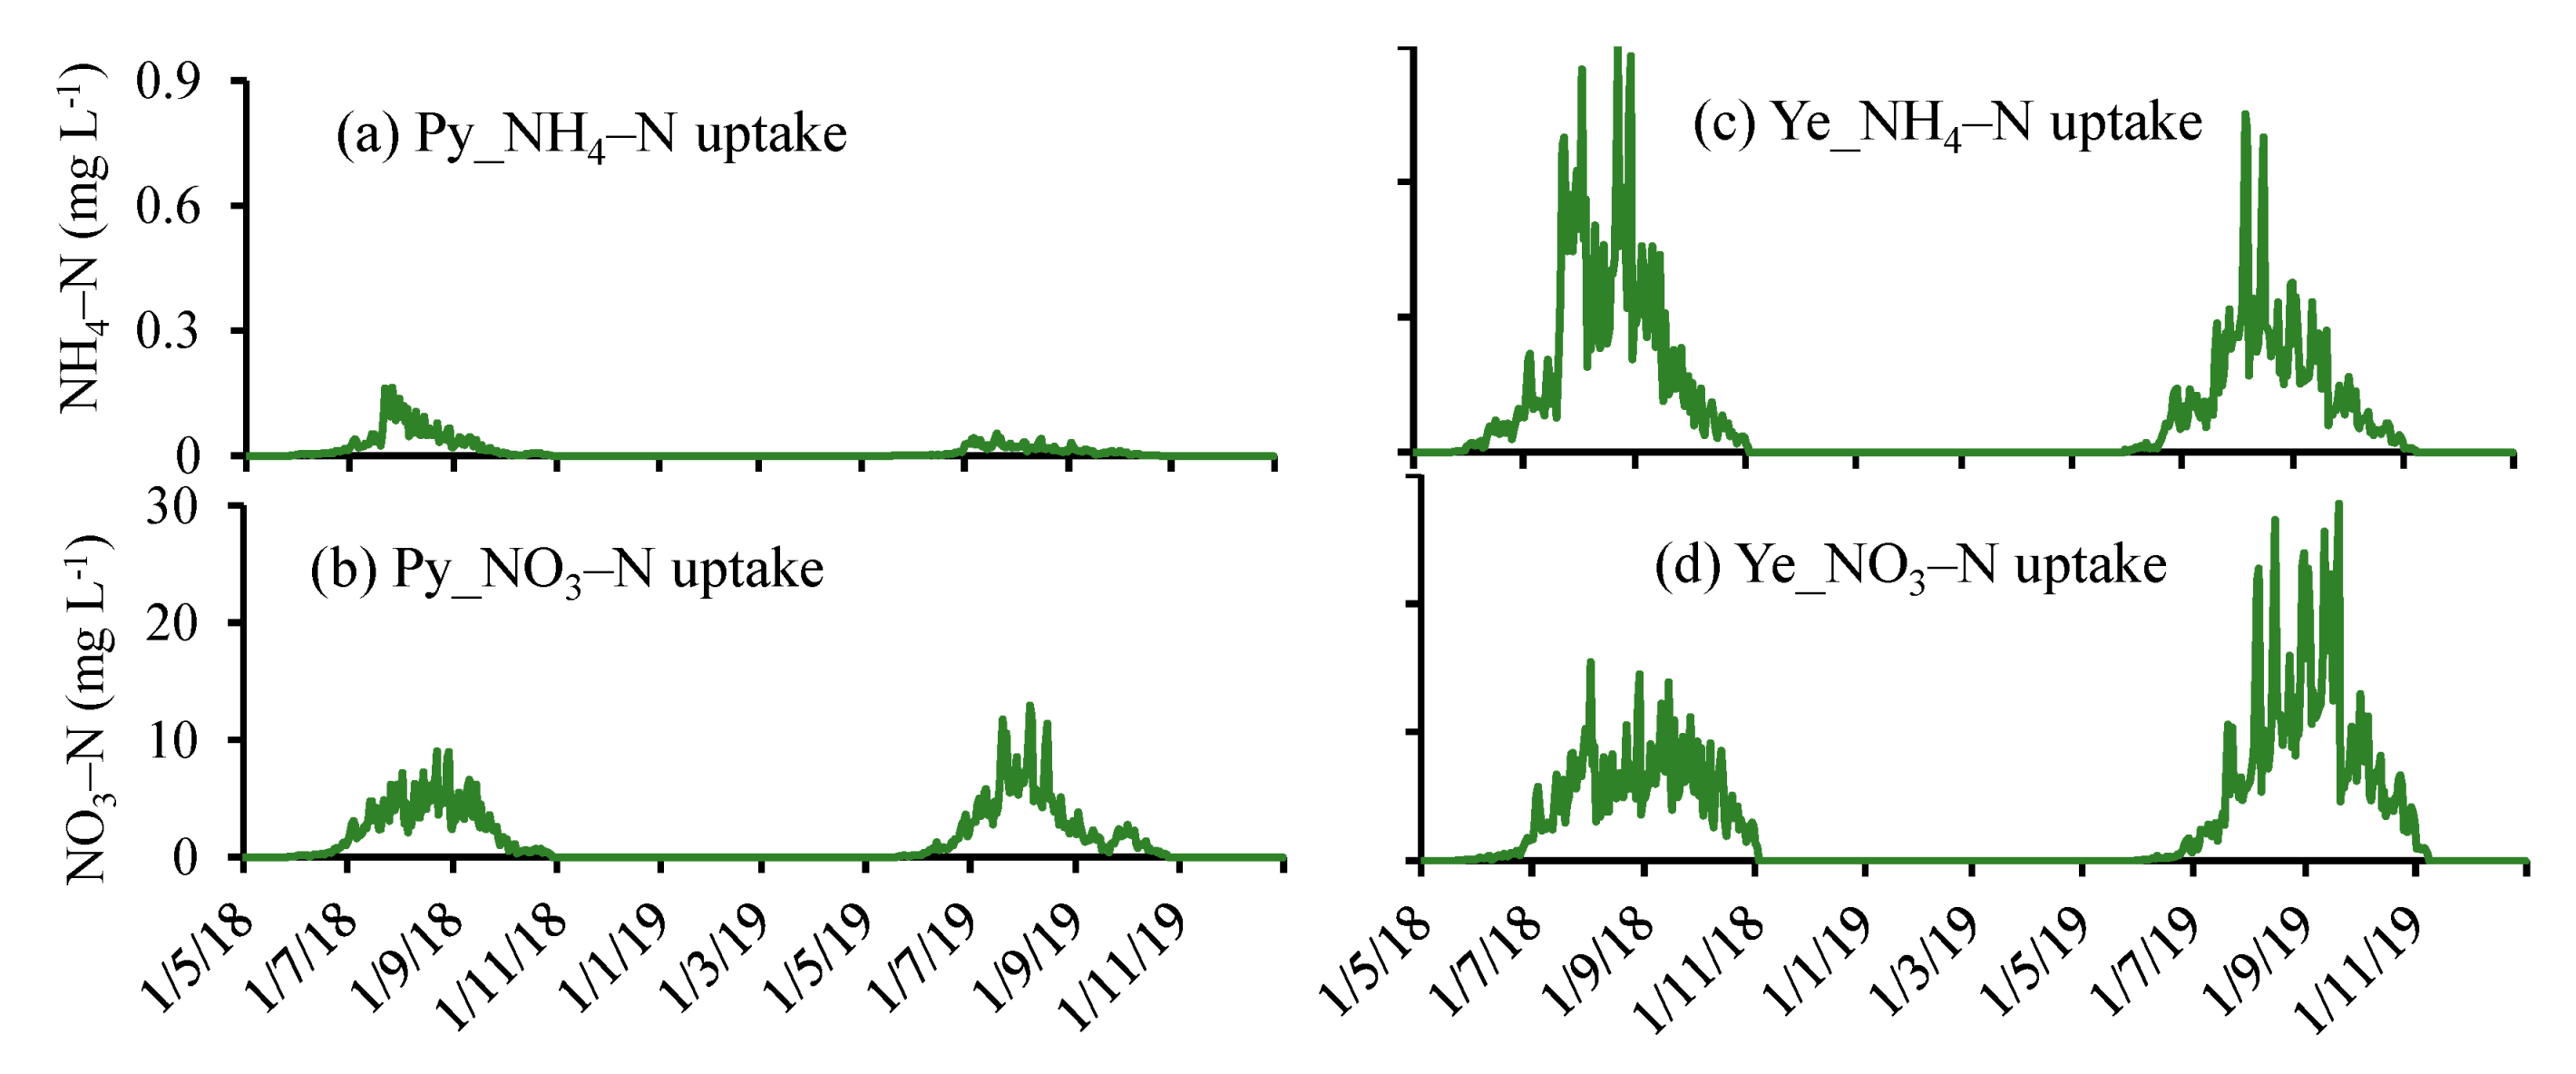
3.4.2. Nitrogen Uptake by Wheat

Nitrogen available to wheat includes inorganic nitrogen (NH4–N and NO3–N), such as fertilizers, and soluble organic nitrogen. The amount of N delivered from soil to plants is location-specific due to the variations in the environmental conditions, soil types, and different agricultural management practices implemented at the two locations. Simulations showed that NH4–N contributed very little to the plant N nutrition and that most N uptake was in the form of NO3–N during both crop seasons (Figure 8). The simulated total N uptake at Yeelanna was more than twice that at Pygery. Daily NH4–N and NO3–N uptake by wheat at Pygery ranged from 0 to 0.16 mg L−1 and 0 to 13 mg L−1, respectively. While at Yeelanna, maximum daily NH4–N and NO3–N uptakes were 0.9 and 0.8 mg L−1 in 2018 and 15.5 and 27.8 mg L−1 in 2019, respectively. Notably, wheat’s maximum daily N uptake occurred from early August to late September, coinciding with the wheat’s maximum growth period. Seasonal crop N uptake at Pygery ranged from 55 to 62% of the total N (NF + NMin+ NS), whereas the corresponding N uptake at Yeelanna was only 40–44%. However, wheat N uptake during 2019 at Yeelanna was roughly double the amount of N mineralized in the soil (Figure 7). This implies that almost half of the N uptake by wheat was contributed by the N fertilizer.

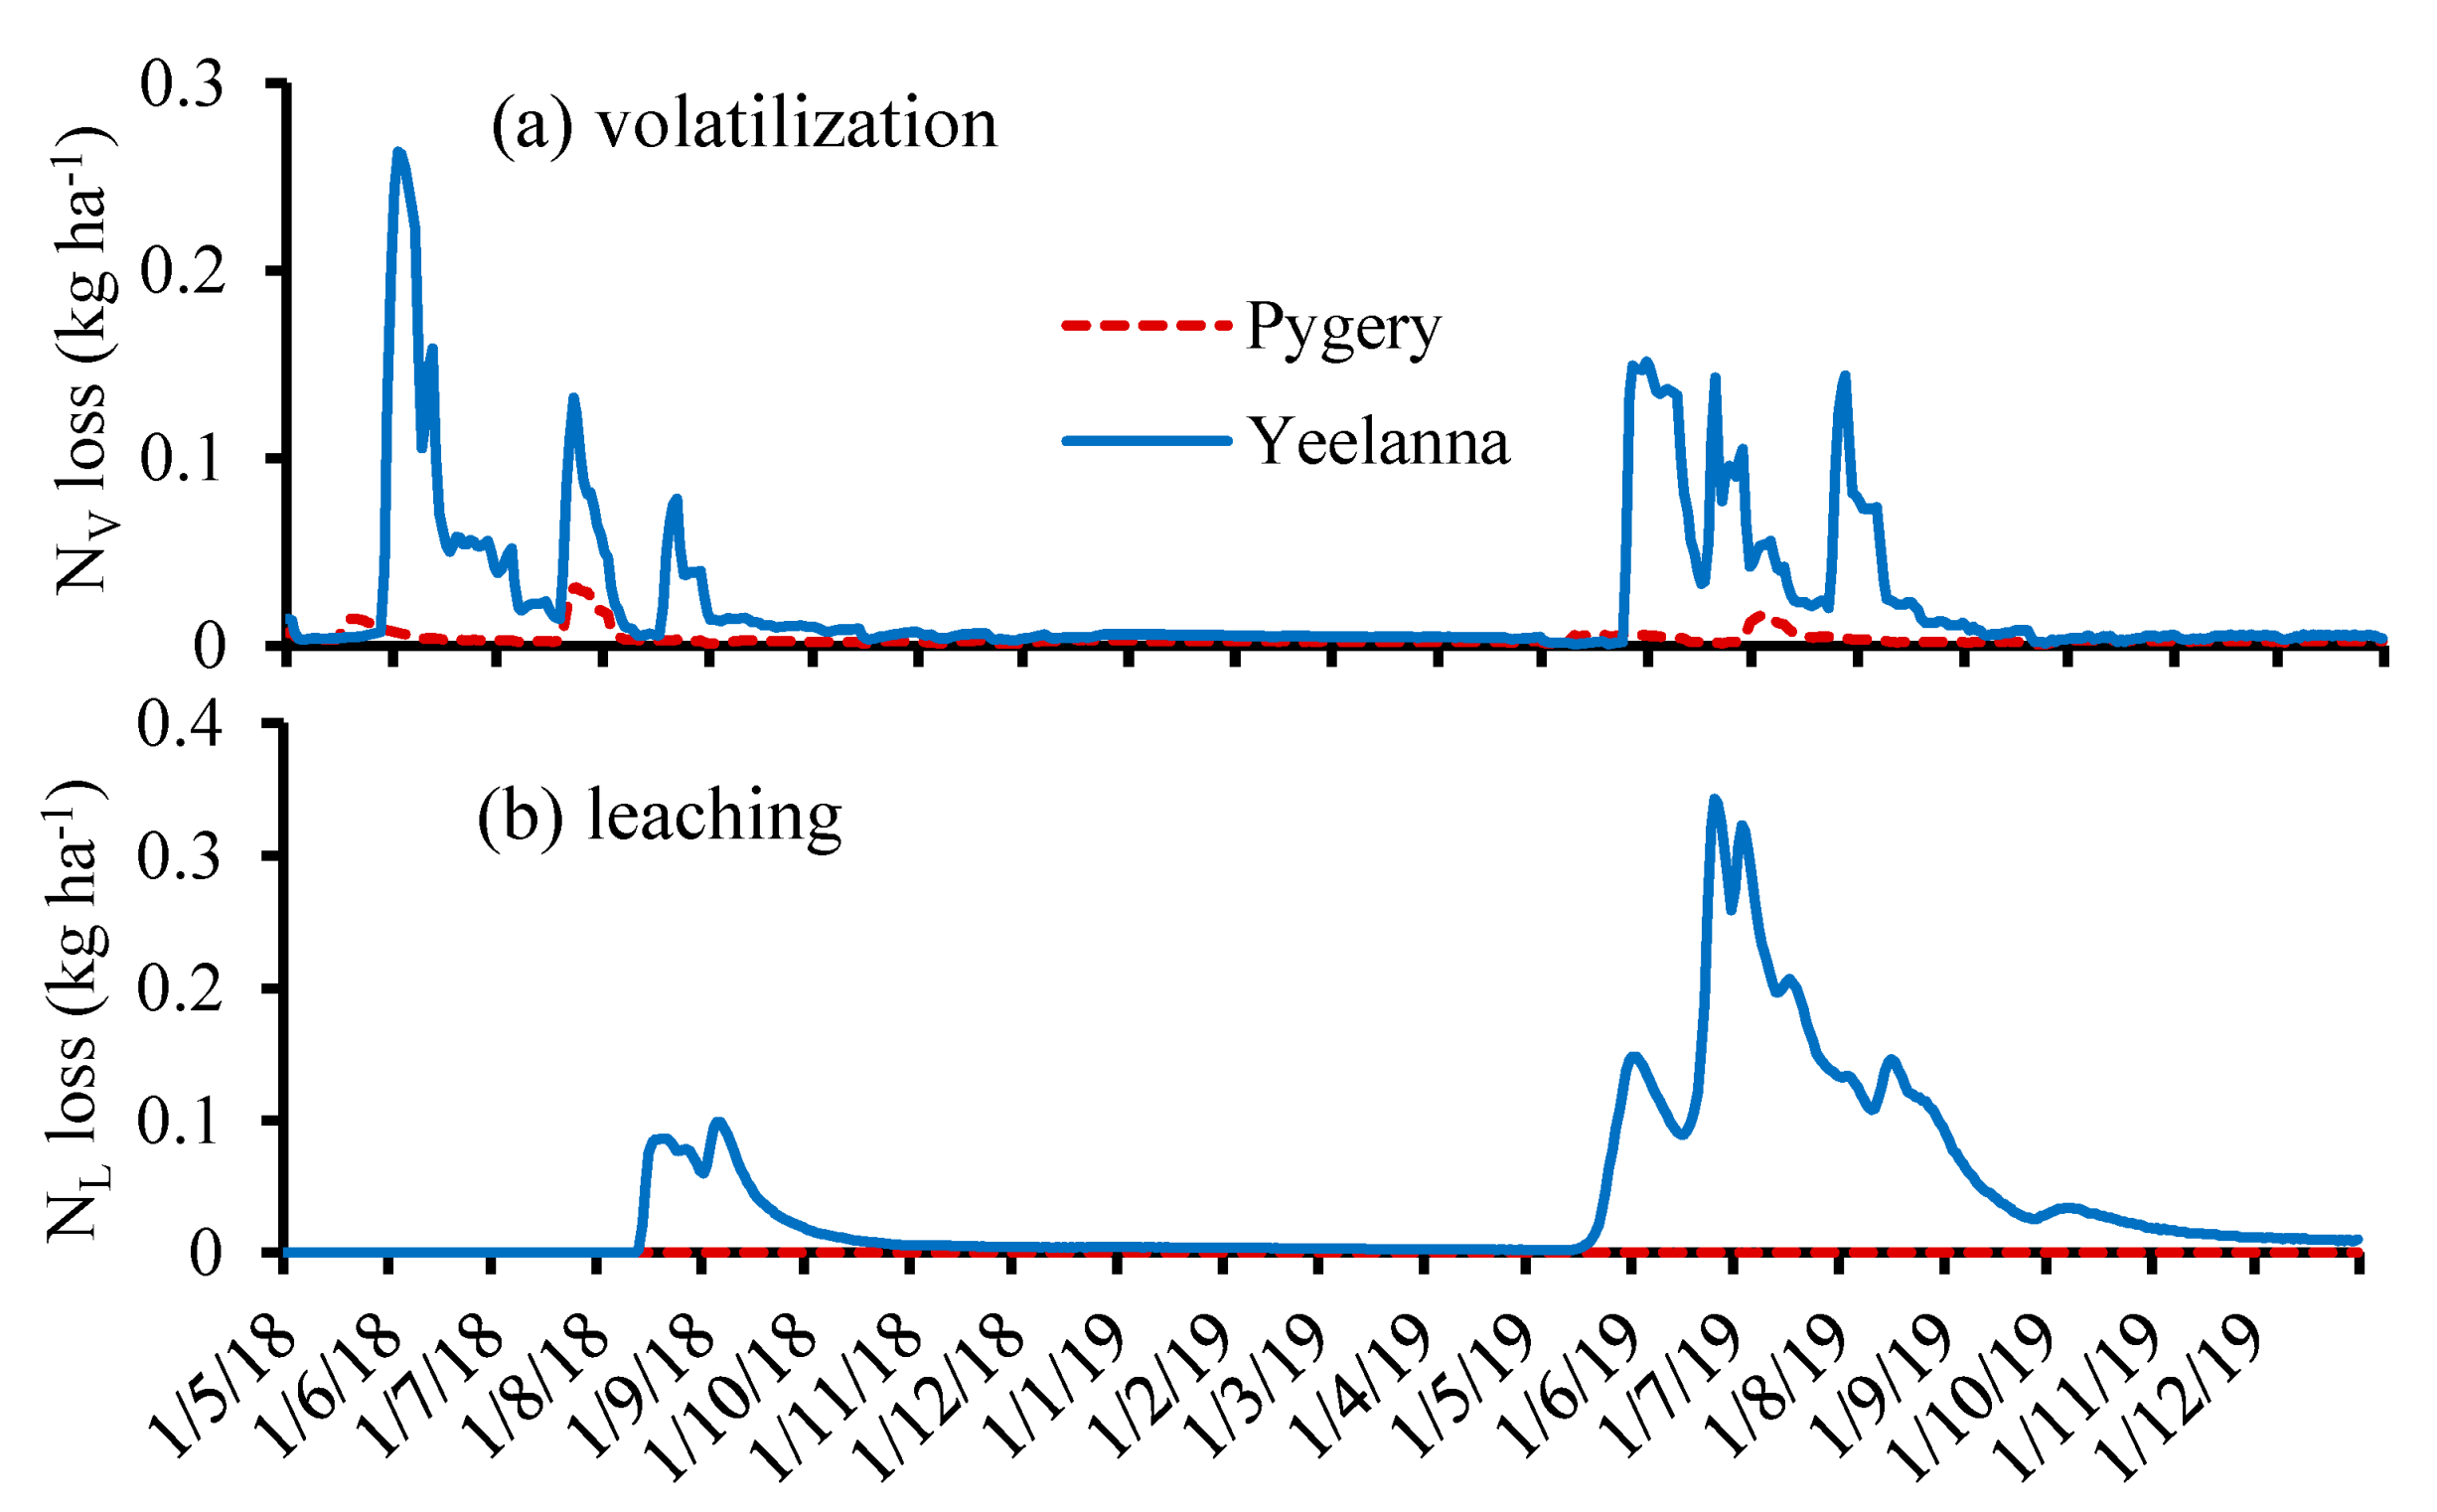
3.4.3. Simulated Volatilization Losses of N

Volatilization N losses (NV) usually occur when urea or ammonium fertilizers are top-dressed or applied on the soil surface. Typically, this is a regular feature of the dryland cropping system in Australia [27]. When there is not enough moisture in the soil to hydrolyze and move the dissolved fertilizer into the soil, NH4–N is partially converted into NH3 and escapes into the atmosphere. High temperatures, high wind, and low water contents in the surface layer, commonly present during wheat sowing, create ideal conditions for NV losses. Moreover, NH4–N may move towards the soil surface via capillary rise with intense evaporative fluxes, contributing to gaseous losses. There is an even greater potential for NH3 losses in areas with alkaline soils [66,67].
HYDRUS-1D simulations in the current study suggest that volatilization losses of N (Nv) at Pygery are smaller than at Yeelanna because fertilizer applications at the latter site (121–151 kg N ha−1) are higher than at the former site (11–15 kg N ha−1) for the same crop (Figure 9). The maximum daily NV losses at Pygery were only 0.02 and 0.03 kg N ha−1 during 2018 and 2019, respectively (Figure 9a). Corresponding amounts at Yeelanna were 0.26 and 0.15 kg N ha−1, respectively. At the Yeelanna site, daily NV losses increased initially in response to fertilizer application and then rapidly dropped as the applied N was translocated deeper into the soil. This was due to high NH4–N concentrations from the applied fertilizer in the surface soil layer with low water contents providing favorable conditions for Nv losses. Seasonal NV losses at Pygery were 1.1 and 0.8 kg N ha−1 during the 2018 and 2019 cropping seasons (Figure 9), respectively. At Yeelanna, the corresponding losses were 7.3 and 6.9 kg N ha−1, respectively. These losses represent 4.6 to 7.3% of the N applied. This amount falls within the range of NV losses (1.8–23%) measured by Turner et al. [27] at different southern Australian locations involving fertilizers applied to rainfed crops, including wheat.

3.4.4. Leaching Losses of Nitrogen

Leaching losses refer to the N losses induced by a drainage flux from the root zone to deeper soil layers and groundwater. These losses usually occur in the form of NO3–N, a mobile component of N. At Pygery, leaching losses of NO3–N (NL) were negligible as there was not a sufficient drainage flux to trigger N losses. However, at Yeelanna, seasonal NO3–N leaching amounted to 3.5 and 20.5 kg ha−1 during 2018 and 2019, respectively (Figure 9b). In 2018, drainage losses occurred during mid-season (mid-August to late September), even though drainage fluxes were low during that time. The maximum daily NO3–N losses were 0.1 kg ha−1 (Figure 9b). On the other hand, N losses increased many folds during 2019. Most NO3–N losses occurred early in the season when the Tp requirement was small. Heavy rain events during this period can leach an enormous quantity of NO3–N from the root zone. Therefore, the daily rate of NO3–N leaching increased to 0.35 kg N ha−1, leading to N losses via off-site movement. On a percentage basis, NL losses accounted for 3–13.5% of N applied by fertilizers and 1.5–7.6% of the total plant-available N in the soil.

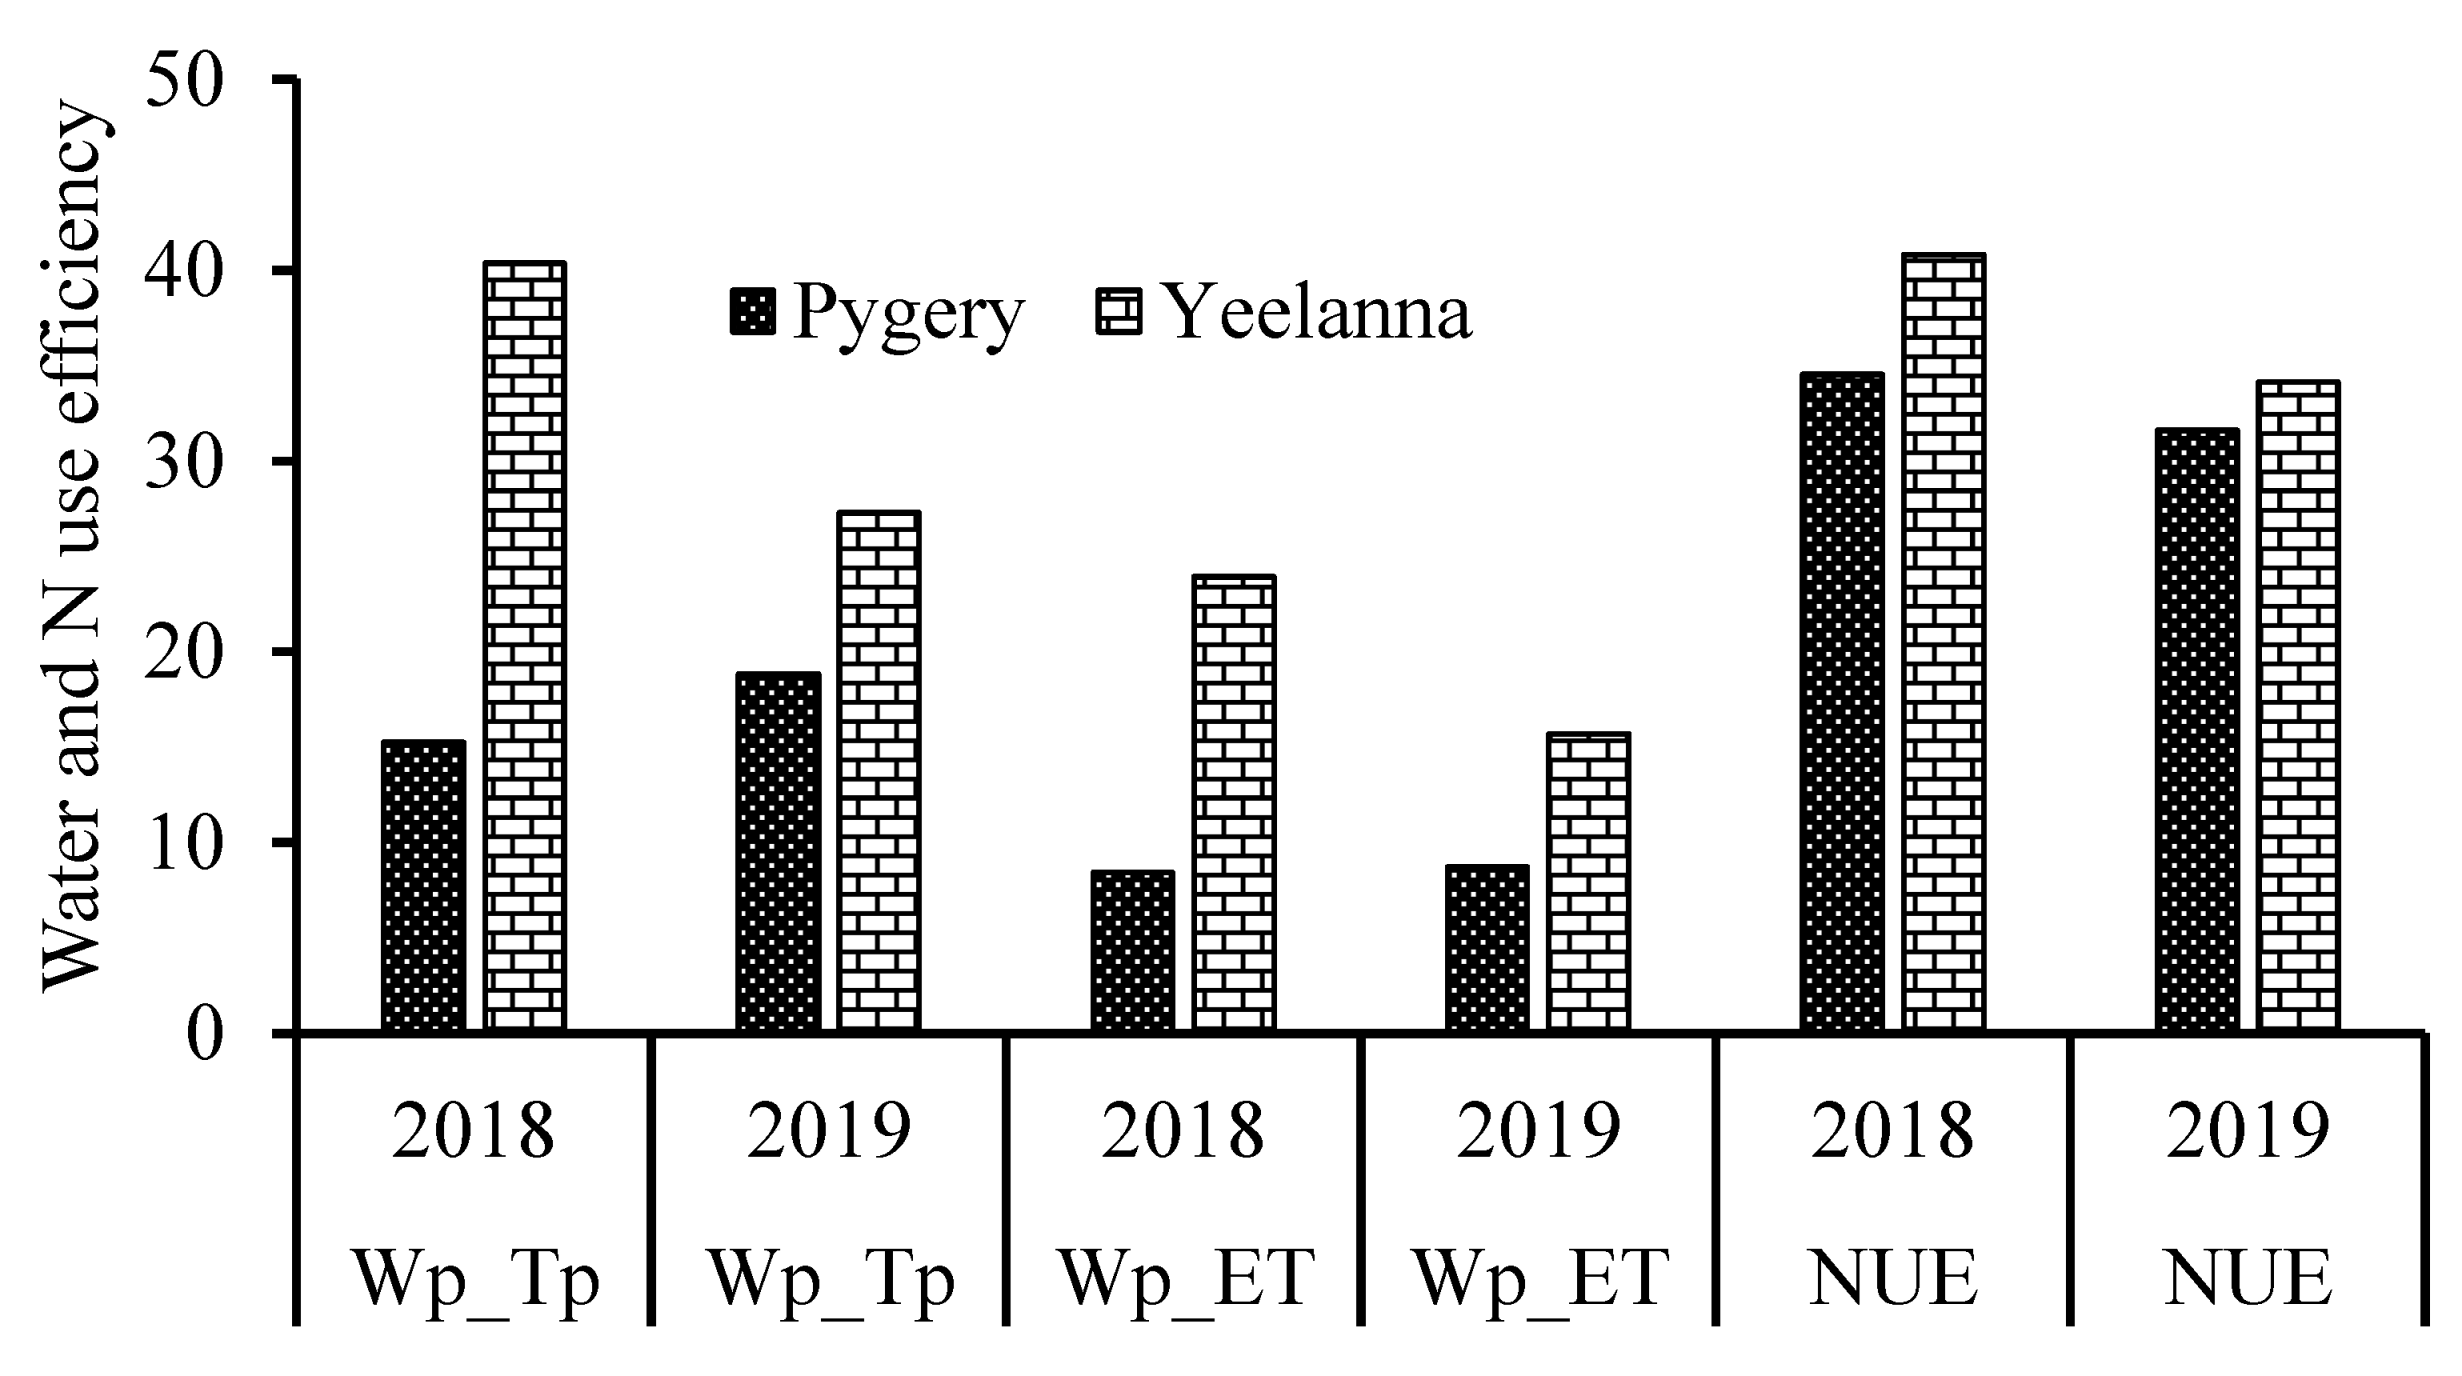
3.5. Water Productivity and N Use Efficiency

Model-simulated seasonal water and nitrogen use and yield estimates for the experimental sites at Pygery and Yeelanna were used to estimate the water productivity in terms of transpiration (Wp_Tp) and evapotranspiration (Wp_ET), and nitrogen use efficiency (NUE) of dryland wheat (Figure 10). Both water productivities (Wp_Tp and Wp_ET) and NUE were higher at Yeelanna (high rainfall zone) as compared to Pygery (low rainfall zone). This explains a three times higher wheat yield at Yeelanna than the corresponding yield (1.52 t ha−1) obtained at Pygery. The Wp_Tp and Wp_ET efficiencies at Pygery varied from 15 to 18 and 8 to 9 kg ha−1 mm−1, respectively, while corresponding values at Yeelanna ranged from 27 to 40 and 16 to 24 kg ha−1 mm−1. Different Wp values obtained at both sites signify the importance of rainfall quantities, soil’s water retention properties, and farmers’ management practices.
Similarly, NUE varied from 31 to 34 and 34 to 41 kg grain yield kg−1 N uptake at Pygery and Yeelanna, respectively (Figure 8). Normally, the N use efficiency is relatively low, irrespective of crop type. For example, Hu et al. [68] found that about 40% of the N fertilizer is recovered in the aboveground parts of dryland wheat. The rest was either retained in the soil, denitrified, or lost by N leaching.

4. Discussion

4.1. Soil Water Balance and Wheat Water Uptake

Under rainfed conditions, the soil moisture regime is dictated by the timing, amounts, and intensity of rain, which are crucial for sustainable crop production. Therefore, accurate estimation of soil water balance helps understand the interrelationship among different hydrological components, including plant water availability and incipient water losses. Water content dynamics in the soil showed that most of the soil profile moisture regime variability occurred in the surface layer (0–30 cm), with a more static moisture regime in the deeper depths (Figure 3). The water content retained in the 0–30 cm horizon is crucial for seed germination and subsequent growth of crops, as the bulk of the fibrous roots of cereal crops mine this region for water and nutrient needs [69]. Wang et al. [61] reported that the root activity of winter wheat is concentrated within the 0–40 cm soil layer and reported small changes in water content dynamics at the deeper depths.
The model-simulated actual seasonal transpiration (Tp act) at both locations falls within the range estimated by French and Schultz [10] and Sadras and Angus [11] for the rainfed wheat crop. Site-specific climate, soil properties, and crop variety highly influence the extent of water uptake by wheat. In addition to low rainfall at Pygery, soils had low water holding capacity compared to Yeelanna, significantly influencing wheat’s water availability in the soil. Indeed, soils with low water holding capacity and scanty rainfall during winter led to frequent terminal droughts [11]. Seasonal evaporation can tremendously impact the water availability for crop needs in the surface soils. Several studies [10,11] assumed a fixed value of the seasonal evaporation loss (110 mm) when determining water availability for rainfed wheat, which seems unreasonable. However, inter- and intra-season variabilities in the evaporation losses are common and are highly correlated with the diurnal and seasonal changes in the climate parameters and ground cover [61]. In the current study, seasonal Es losses were 5–30% lower than a fixed value (110 mm) suggested by French and Schultz [10]. Numerous other studies [70,71,72] reported soil evaporation significantly lower (45–70 mm) than the proposed fixed value. Direct water loss from the soil surface can be reduced by adopting appropriate water storage and mulching practices, improving water retention in the soil [73]. Improved water regimes in surface soils can boost wheat growth and sustainable production in a water-limited environment.
Water uptake and crop yields of rainfed wheat are severely influenced by climate, soil and crop characteristics, and a large gap exists between the potential and actual crop yield [11,15]. These variabilities ultimately impact the water use efficiency of crops in rainfed environments. The average water productivity (WP_ET) values (8.6 kg ha−1 mm−1) estimated in the current study are comparable to water use efficiency reported in other studies in the rainfed region of Australia [11,72]. Similarly, the transpiration efficiency (WP_Tp) values are similar to values reported by Harries et al. [72] and Sadras and Lawson [14] for the rainfed wheat production environments. However, the average values of WP_ET (19.8 kg ha−1 mm−1) and WP_Tp (33.8 kg ha−1 mm−1) obtained at the Yeelanna site were much higher than those reported in previous studies. Unlike the current study, these studies usually ignored the deep drainage component. The model predicted that 25% of rainfall received at Yeelanna is lost as deep drainage, a significant factor contributing to higher WP_ET and WP_Tp at this site. Thus, HYDRUS-1D has been able to predict the actual water balance fluxes, including deep drainage, depending on the climate, crop, and soil conditions [74], and provide an accurate assessment of water use efficiency and water-limited yield estimation for the rainfed wheat production system.

4.2. Nitrogen Losses and Recovery by Crop

Nitrogen supplement in the form of fertilizer is essential for profitable crop production. The fertilizer requirement of wheat may vary each season, depending on NMin in the soil and climate variability. Angus and Grace [1] reported that the minimum level of N fertilizer applied to dryland wheat should be 45 kg N ha−1 for sustainable crop production. However, the long-term (15 years) application of the fixed amount of N fertilizer (45 kg ha−1) at 50 farms resulted in a reduction in the wheat yield by 60% of the water-limited potential yield [75]. This suggests that the N fertilizer application at the Pygery site was much lower than required, significantly impacting obtaining a potential water-limited yield and N use efficiency. On the other hand, the amount of N applied was very high at Yeelanna (121–151 kg ha−1), potentially leading to high N concentration in the soil and consequent losses of applied N. Therefore, blanket applications of N adopted by the growers in the current study can have varied impacts on crop growth and yield and may lead to potential N losses from the fields. Moreover, N transformation and loss mechanisms are highly influenced by climate variability and soil environment at different locations, impacting plant N uptake by rainfed crops. Angus et al. [76] reported that the average aboveground recovery of total N was around 36% at six commercial dryland wheat sites in south-eastern Australia. However, with improved management practices, the N recovery efficiency in grain production can be increased to 44% [1]. Thus, the wheat’s NUE estimates in the current study corroborate well with other studies.
Soil factors such as texture, pH, and organic matter content, as well as soil constraints such as salinity and sodicity, also significantly impact the processes of N transformation in the soils [77]. Therefore, N recovery improvements require better temporal matching of N supply to periods of high crop demand and avoiding periods when risks of losses surge [37,65]. Monjardino et al. [78] concluded that adopting non-limiting or near-non-limiting nitrogen fertilizer practices could help close the wheat yield gap in the Australian rainfed cropping system. The results from this study indicate that site-specific water availability and N management play a crucial role in enhancing the efficient resource utilization of rainfed cropping systems. Thus, we recommend conducting further research on fertilizer-application timing and evaluating different fertilizer-application scenarios to increase crop recovery of fertilizers applied to dryland wheat production.
Ammonium volatilization (NV), similar to ammonia and nitrate leaching (NL) from the root zone, represents an important N loss for rainfed wheat cropping systems. The Nv losses from applied urea fertilizers typically contribute to greenhouse gas emissions from rainfed wheat production systems. However, in the present study, this fraction is lower than the emission threshold (10%) from the applied synthetic fertilizers considered by IPCC [79]. Nonetheless, NV losses to the extent observed in the current study (4.6 to 7.3% of the N applied) still represent a major economic loss to farmers. Therefore, an accurate assessment of NV losses could help devise better management practices for improving the productive and sustainable practices of rainfed wheat production systems.
Leaching drives the NL losses due to rain events and the mass of N in the NO3–N form in the soil. In sandy soils, N leaching (NL) can be significantly higher [80], ranging between 6 and 20% of the total N flux (16–159 kg N ha−1 year−1). Numerous other studies [81,82,83,84] have reported significant leaching losses of NO3–N, varying from 4 to 59 kg ha−1 year−1 for different cropping systems in Australia. This represents a financial loss to the growers and an increased risk of groundwater pollution. Indeed, NO3 leaching occurs infrequently at most dryland cropping farms in Australia because the soil water-holding capacity is generally sufficient to retain the surplus rainfall over potential evapotranspiration.
The HYDRUS-1D simulations suggested that maintaining the N balance is crucial for the wheat production system, explaining how soil N storage changes over the years. Matching the supply of available N to the crop N demand will reduce the potential accumulation of available N and potential N losses. Although increasing N stocks is encouraged, it should be acknowledged that temporary periods of mining N stocks are acceptable, provided the extent of N mining is quantified and followed by a rebuilding phase, in which N stocks are replenished [49]. It is recommended that annual N balance calculations are performed. However, these values should be integrated and accumulated over time to define the full effect of applied management practices and temporal trends. Such information will allow grain growers to implement appropriate actions to maintain their production base in the future and continue to maximize profitable grain yield outcomes. Further optimization of N applications can reduce the N losses by linking them with soil water content, rainfall, and meteorological data for a particular site. This requires more modeling efforts and intensive N estimation at the field site for developing rainfall-based guidelines.

5. Conclusions

Mathematical modeling tools can play a pivotal role in understanding the water and fertilizer used by the rainfed wheat production system. This study used the numerical model HYDRUS-1D to simulate the water balance and nitrogen dynamics under rainfed wheat cultivation at two locations (Pygery and Yeelanna) with varied climate and soil conditions. The model output of water and N balance was compared with measured data across various soil depths at both locations.
The modeled and measured water content suggested that plant water uptake by rainfed wheat mostly occurred in the top 30 cm of soil, signifying the importance of the surface soil layer, which stores water received by small rain events in rainfed environments. Nevertheless, moisture retained in the surface layer is vulnerable to evaporation imposed by hot and dry weather conditions in arid and semi-arid environments. In the current study, 50 and 30% of seasonal rainfall at low and medium rainfall sites were lost via evaporation. Significant leaching losses (25% of seasonal rainfall) at the medium rainfall site indicate considerable water loss in the rainfed wheat production system. Therefore, adopting appropriate water storage and mulching practices can reduce this direct water loss, enhancing water availability in the soil and improving the water-limited yield potential of rainfed wheat.
Assessing the off-site movement of N (leaching losses) can help devise better strategies for N fertilizer applications, which will reduce the environmental impacts of fertilizer use. This study showed that ammonium volatilization (NV) and nitrate leaching (NL) represent large potential N losses under the rainfed wheat system, depending on the seasonal rainfall and climate pattern. The NV losses account for 4.6 to 7.3% of the added N fertilizer, while NL losses ranged between 3 and 13.5% of N applied, especially at the medium rainfall site. Low N volatilization losses suggest that the contribution of dryland wheat farming to greenhouse N gas emissions is very low. This study evaluated water and N dynamics in the soil of the rainfed wheat production system for two years only. However, longer-term efforts are needed to reduce N leaching losses by managing the appropriate timing and dose of N applications in response to available soil moisture levels and crop needs.

Supplementary Materials

The following supporting information can be downloaded at https://www.mdpi.com/article/10.3390/su151813370/s1, Figure S1a–d: Daily values of estimated seasonal crop evapotranspiration (ETc) at the Pygery and Yeelanna sites during 2018 and 2019.

Author Contributions

Conceptualization, V.P.; methodology, V.P.; software, V.P. and J.Š.; formal analysis, V.P.; investigation, V.P.; resources and project management, P.P.; data curation, V.P.; writing—original draft preparation, V.P.; writing—review and editing, V.P., J.Š., P.P., V.F. and T.P.; visualization, V.P.; supervision, P.P. All authors have read and agreed to the published version of the manuscript.

Funding

The authors acknowledge the financial support provided by Grain Research Development Corporation (GRDC) vide Grant Number GRDC1911-004BXL for this investigation on using soil water information to make better decisions on the Eyre Peninsula.

Institutional Review Board Statement

Not applicable.

Informed Consent Statement

Not applicable.

Data Availability Statement

Data are available upon reasonable request to the corresponding author.

Acknowledgments

We acknowledge the collaboration with Amanda Cook and SARDI, Minnipa Agriculture Centre and the soil moisture probe landholders.

Conflicts of Interest

The authors declare no conflict of interest. The funders had no role in the study’s design, in the collection, analyses, or interpretation of data, in the writing of the manuscript, or in the decision to publish the results.

References

  1. Angus, J.F.; Grace, P.R. Nitrogen balance in Australia and nitrogen use efficiency on Australian farms. Soil Res. 2017, 55, 435–450. [Google Scholar] [CrossRef]
  2. Sadras, V.O.; Denison, R.F. Neither crop genetics nor crop management can be optimised. Field Crops Res. 2016, 189, 75–83. [Google Scholar] [CrossRef]
  3. Connor, D.J. Designing cropping systems for efficient use of limited water in southern Australia. Eur. J. Agron. 2004, 21, 419–431. [Google Scholar] [CrossRef]
  4. Sadras, V.O.; Rodriguez, D. Modelling the nitrogen-driven trade-off between nitrogen utilisation efficiency and water use efficiency of wheat in eastern Australia. Field Crops Res. 2010, 118, 297–305. [Google Scholar] [CrossRef]
  5. Cawood, R.M. (Ed.) Climate of south-eastern Australia. In Climate, Temperature and Crop Production in South-Eastern Australia; Principles of Sustainable Agriculture; Agriculture Victoria: Horsham, Australia, 1996; pp. 21–33. [Google Scholar]
  6. Unkovich, M.; McBeath, T.; Llewellyn, R.; Hall, J.; Gupta, V.V.S.R.; Macdonald, L.M. Challenges and opportunities for grain farming on sandy soils of semi-arid south and south-eastern Australia. Soil Res. 2020, 58, 323–334. [Google Scholar] [CrossRef]
  7. ABARES. Wheat Forecast 20-22-23 Season; Department of Agriculture, Fisheries and Forestry, Australian Government: Canberra, Australia, 2023. [Google Scholar]
  8. Hochman, Z.; Gobbett, D.; Horan, H.; Garcia, J.N. Data rich yield gap analysis of wheat in Australia. Field Crops Res. 2016, 197, 97–106. [Google Scholar] [CrossRef]
  9. Bodner, G.; Nakhforoosh, A.; Kaul, H.-P. Management of crop water under drought: A review. Agron. Sustain. Dev. 2015, 35, 401–442. [Google Scholar] [CrossRef]
  10. French, R.; Schultz, J. Water use efficiency of wheat in a Mediterranean-type environment. I. The relation between yield, water use and climate. Aust. J. Agric. Res. 1984, 35, 743–764. [Google Scholar] [CrossRef]
  11. Sadras, V.O.; Angus, J.F. Benchmarking water-use efficiency of rainfed wheat in dry environments. Aust. J. Agric. Res. 2006, 57, 847–856. [Google Scholar] [CrossRef]
  12. Sadras, V.O.; Rodriguez, D. The limit to wheat water-use efficiency in eastern Australia. II. Influence of rainfall patterns. Aust. J. Agric. Res. 2007, 58, 657–669. [Google Scholar] [CrossRef]
  13. Hochman, Z.; Gobbett, D.L.; Horan, H. Climate trends account for stalled wheat yields in Australia since 1990. Glob. Chang. Biol 2017, 23, 2071–2081. [Google Scholar] [CrossRef]
  14. Sadras, V.O.; Lawson, C. Nitrogen and water-use efficiency of Australian wheat varieties released between 1958 and 2007. Eur. J. Agron. 2013, 46, 34–41. [Google Scholar] [CrossRef]
  15. Angus, J.F.; van Herwaarden, A.F. Increasing Water Use and Water Use Efficiency in Dryland Wheat. Agron. J. 2001, 93, 290–298. [Google Scholar] [CrossRef]
  16. Keating, B.A.; Carberry, P.S.; Hammer, G.L.; Probert, M.E.; Robertson, M.J.; Holzworth, D.P.; Huth, N.I.; Hargreaves, J.N.G.; Meinke, H.; Hochman, Z.; et al. An overview of APSIM, a model designed for farming systems simulation. Eur. J. Agron. 2003, 18, 267–288. [Google Scholar] [CrossRef]
  17. Šimůnek, J.; van Genuchten, M.T.; Sejna, M. Recent developments and applications of the HYDRUS computer software packages. Vadose Zone J. 2016, 15, 1–25. [Google Scholar] [CrossRef]
  18. Li, S.-X.; Wang, Z.-H.; Malhi, S.S.; Li, S.-Q.; Gao, Y.-J.; Tian, X.-H. Chapter 7 Nutrient and Water Management Effects on Crop Production, and Nutrient and Water Use Efficiency in Dryland Areas of China. Adv. Agron. 2009, 102, 223–265. [Google Scholar]
  19. Cossani, C.M.; Slafer, G.A.; Savin, R. Co-limitation of nitrogen and water, and yield and resource-use efficiencies of wheat and barley. Crop Pasture Sci. 2010, 61, 844–851. [Google Scholar] [CrossRef]
  20. Wang, Z.-H.; Li, S.-X. Nitrate N loss by leaching and surface runoff in agricultural land: A global issue (a review). Adv. Agron. 2019, 156, 159–217. [Google Scholar]
  21. Osman, R.; Tahir, M.N.; Ata-Ul-Karim, S.T.; Ishaque, W.; Xu, M. Exploring the Impacts of Genotype-Management-Environment Interactions on Wheat Productivity, Water Use Efficiency, and Nitrogen Use Efficiency under Rainfed Conditions. Plants 2021, 10, 2310. [Google Scholar] [CrossRef] [PubMed]
  22. Benjamin, J.G.; Porter, L.K.; Duke, H.R.; Ahuja, L.R. Corn Growth and Nitrogen Uptake with Furrow Irrigation and Fertilizer Bands. Agron. J. 1997, 89, 609–612. [Google Scholar] [CrossRef]
  23. Lehrsch, G.; Sojka, R.; Westermann, D. Furrow irrigation and N management strategies to protect water quality. Commun. Soil Sci. Plant Anal. 2001, 32, 1029–1050. [Google Scholar] [CrossRef]
  24. Smith, C.J.; Hunt, J.R.; Wang, E.; Macdonald, B.C.T.; Xing, H.; Denmead, O.T.; Zeglin, S.; Zhao, Z. Using fertiliser to maintain soil inorganic nitrogen can increase dryland wheat yield with little environmental cost. Agric. Ecosyst. Environ. 2019, 286, 106644. [Google Scholar] [CrossRef]
  25. Keller, G.D.; Mengel, D.B. Ammonia Volatilization from Nitrogen Fertilizers Surface Applied to No-till Corn. Soil Sci. Soc. Am. J. 1986, 50, 1060–1063. [Google Scholar] [CrossRef]
  26. Chien, S.; Prochnow, L.; Cantarella, A.H. Recent developments of fertilizer production and use to improve nutrient efficiency and minimize environmental impacts. Adv. Agron. 2009, 102, 267–322. [Google Scholar]
  27. Turner, D.A.; Edis, R.E.; Chen, D.; Freney, J.R.; Denmead, O.T. Ammonia volatilization from nitrogen fertilizers applied to cereals in two cropping areas of southern Australia. Nutr. Cycl. Agroecosystems 2012, 93, 113–126. [Google Scholar] [CrossRef]
  28. Gastal, F.; Lemaire, G.; Durand, J.-L.; Louarn, G. Chapter 8—Quantifying crop responses to nitrogen and avenues to improve nitrogen-use efficiency. In Crop Physiology, 2nd ed.; Sadras, V.O., Calderini, D.F., Eds.; Academic Press: San Diego, CA, USA, 2015; pp. 161–206. [Google Scholar]
  29. Raun, W.R.; Johnson, G.V. Improving Nitrogen Use Efficiency for Cereal Production. Agron. J. 1999, 91, 357–363. [Google Scholar] [CrossRef]
  30. Kubar, M.S.; Alshallash, K.S.; Asghar, M.A.; Feng, M.; Raza, A.; Wang, C.; Saleem, K.; Ullah, A.; Yang, W.; Kubar, K.A.; et al. Improving Winter Wheat Photosynthesis, Nitrogen Use Efficiency, and Yield by Optimizing Nitrogen Fertilization. Life 2022, 12, 1478. [Google Scholar] [CrossRef]
  31. Galloway, J.N.; Townsend, A.R.; Erisman, J.W.; Bekunda, M.; Cai, Z.; Freney, J.R.; Martinelli, L.A.; Seitzinger, S.P.; Sutton, M.A. Transformation of the Nitrogen Cycle: Recent Trends, Questions, and Potential Solutions. Science 2008, 320, 889–892. [Google Scholar] [CrossRef]
  32. Powlson, D.S.; Addiscott, T.M.; Benjamin, N.; Cassman, K.G.; de Kok, T.M.; van Grinsven, H.; L’Hirondel, J.L.; Avery, A.A.; van Kessel, C. When does nitrate become a risk for humans? J. Environ. Qual. 2008, 37, 291–295. [Google Scholar] [CrossRef]
  33. Asseng, S.; Ewert, F.; Rosenzweig, C.; Jones, J.W.; Hatfield, J.L.; Ruane, A.C.; Boote, K.J.; Thorburn, P.J.; Rötter, R.P.; Cammarano, D.; et al. Uncertainty in simulating wheat yields under climate change. Nat. Clim. Chang. 2013, 3, 827–832. [Google Scholar] [CrossRef]
  34. Ishaque, W.; Osman, R.; Hafiza, B.S.; Malghani, S.; Zhao, B.; Xu, M.; Ata-Ul-Karim, S.T. Quantifying the impacts of climate change on wheat phenology, yield, and evapotranspiration under irrigated and rainfed conditions. Agric. Water Manag. 2023, 275, 108017. [Google Scholar] [CrossRef]
  35. Gonzalez-Dugo, V.; Durand, J.-L.; Gastal, F. Water deficit and nitrogen nutrition of crops. A review. Agron. Sustain. Dev. 2010, 30, 529–544. [Google Scholar] [CrossRef]
  36. Norton, R.; Walker, C.; Farlow, C. Nitrogen removal and use on a long-term fertilizer experiment. In Proceedings of the 17th Australian Society of Agronomy Conference, Hobrt, Australia, 20–24 September 2015. [Google Scholar]
  37. Phogat, V.; Skewes, M.A.; Cox, J.W.; Sanderson, G.; Alam, J.; Šimůnek, J. Seasonal simulation of water, salinity and nitrate dynamics under drip irrigated mandarin (Citrus reticulata) and assessing management options for drainage and nitrate leaching. J. Hydrol. 2014, 513, 504–516. [Google Scholar] [CrossRef]
  38. Gaydon, D.S.; Balwinder, S.; Wang, E.; Poulton, P.L.; Ahmad, B.; Ahmed, F.; Akhter, S.; Ali, I.; Amarasingha, R.; Chaki, A.K.; et al. Evaluation of the APSIM model in cropping systems of Asia. Field Crops Res. 2017, 204, 52–75. [Google Scholar] [CrossRef]
  39. Ware, A.; Spriggs, B.; Budarick, S.; Scholz, N. Delivering Value from Soil Moisture Probes on Eyre Peninsula; Minnipa Agriculture Centre: Minnipa, Australia, 2020. [Google Scholar]
  40. Fabio, A.; Cook, A.; Richter, I.; King, N. Benchmarking Water Limited Yield of Cereal Crops on Major Soil Types across Eyre Peninsula; Minnipa Agriculture Centre: Minnipa, Australia, 2019. [Google Scholar]
  41. Rayment, G.E.; Lyons, D.J.; Shelley, B. Soil Chemical Methods—Australasia: Australasia; CSIRO Publishing: Clayton, Australia, 2011. [Google Scholar]
  42. ASRIS. Australian Soil Resource Information System. 2011. Available online: http://www.asris.csiro.au (accessed on 30 August 2023).
  43. Jeffrey, S.J.; Carter, J.O.; Moodie, K.B.; Beswick, A.R. Using spatial interpolation to construct a comprehensive archive of Australian climate data. Environ. Model. Softw. 2001, 16, 309–330. [Google Scholar] [CrossRef]
  44. Allen, R.G.; Pereira, L.S.; Raes, D.; Smith, M. Crop Evapotranspiration: Guidelines for Computing Crop Water Requirements; FAO: Rome, Italy, 1998. [Google Scholar]
  45. Ritchie, J.T. Model for predicting evaporation from a row crop with incomplete cover. Water Resour. Res. 1972, 8, 1204–1213. [Google Scholar] [CrossRef]
  46. Miralles, D.J.; Slafer, G.A. Radiation interception and radiation use efficiency of near-isogenic wheat lines with different height. Euphytica 1997, 97, 201–208. [Google Scholar] [CrossRef]
  47. Feddes, R.A.; Kowalik, P.J.; Zaradny, H. Simulation of Field Water Use and Crop Yield; Pudoc for the Centre for Agricultural Publishing and Documentation: Wageningen, The Netherlands, 1978. [Google Scholar]
  48. Nakasone, H.; Abbas, M.A.; Kuroda, H. Nitrogen transport and transformation in packed soil columns from paddy fields. Paddy Water Environ. 2004, 2, 115–124. [Google Scholar] [CrossRef]
  49. Baldock, J.; Macdonald, L.; Farrell, M.; Welti, N.; Monjardino, M. Nitrogen Dynamics in Modern Cropping Systems; Grain Research and Development Corporation: Barton, Australia, 2018. [Google Scholar]
  50. Barton, L.; Hoyle, F.C.; Stefanova, K.T.; Murphy, D.V. Incorporating organic matter alters soil greenhouse gas emissions and increases grain yield in a semi-arid climate. Agric. Ecosyst. Environ. 2016, 231, 320–330. [Google Scholar] [CrossRef]
  51. Yang, Y.; Tong, Y.; Gao, P.; Htun, Y.M.; Feng, T. Evaluation of N(2)O emission from rainfed wheat field in northwest agricultural land in China. Environ. Sci. Pollut. Res. Int. 2020, 27, 43466–43479. [Google Scholar] [CrossRef]
  52. Li, Y.; Šimůnek, J.; Zhang, Z.; Jing, L.; Ni, L. Evaluation of nitrogen balance in a direct-seeded-rice field experiment using Hydrus-1D. Agric. Water Manag. 2015, 148, 213–222. [Google Scholar] [CrossRef]
  53. Phogat, V.; Mahalakshmi, M.; Skewes, M.; Cox, J.W. Modelling soil water and salt dynamics under pulsed and continuous surface drip irrigation of almond and implications of system design. Irrig. Sci. 2012, 30, 315–333. [Google Scholar] [CrossRef]
  54. Renard, J.J.; Calidonna, S.E.; Henley, M.V. Fate of ammonia in the atmosphere—A review for applicability to hazardous releases. J. Hazard. Mater. 2004, 108, 29–60. [Google Scholar] [CrossRef] [PubMed]
  55. Wang, S.; Chen, J. Study on the integrated distribution coefficient of ammonium N migration in layered soil. Environ. Sci. Pollut. Res. Int. 2020, 27, 25340–25352. [Google Scholar] [CrossRef]
  56. Chowdary, V.M.; Rao, N.H.; Sarma, P.B.S. A coupled soil water and nitrogen balance model for flooded rice fields in India. Agric. Ecosyst. Environ. 2004, 103, 425–441. [Google Scholar] [CrossRef]
  57. Yadav, D.; Kumar, V.; Singh, M.; Relan, P. Effect of temperature and moisture on kinetics of urea hydrolysis and nitrification. Soil Res. 1987, 25, 185–191. [Google Scholar] [CrossRef]
  58. Šimůnek, J.; Hopmans, J.W. Modeling compensated root water and nutrient uptake. Ecol. Model. 2009, 220, 505–521. [Google Scholar] [CrossRef]
  59. Jury, W.A.; Spencer, W.F.; Farmer, W.J. Behavior Assessment Model for Trace Organics in Soil: I. Model Description. J. Environ. Qual. 1983, 12, 558–564. [Google Scholar] [CrossRef]
  60. Adcock, D. Soil Water and Nitrogen Dynamics of Farming Systems on the upper Eyre Peninsula, South Australia. Ph.D. Thesis, School of Earth and Environmental Sciences, University of Adelaide, Adelaide, Australia, 2005. [Google Scholar]
  61. Wang, X.; Cai, H.; Li, L.; Wang, X. Estimating Soil Water Content and Evapotranspiration of Winter Wheat under Deficit Irrigation Based on SWAP Model. Sustainability 2020, 12, 9451. [Google Scholar] [CrossRef]
  62. Ramos, T.B.; Šimůnek, J.; Gonçalves, M.C.; Martins, J.C.; Prazeres, A.; Pereira, L.S. Two-dimensional modeling of water and nitrogen fate from sweet sorghum irrigated with fresh and blended saline waters. Agric. Water Manag. 2012, 111, 87–104. [Google Scholar] [CrossRef]
  63. Evett, S.R.; Schwartz, R.C.; Casanova, J.J.; Heng, L.K. Soil water sensing for water balance, ET and WUE. Agric. Water Manag. 2012, 104, 1–9. [Google Scholar] [CrossRef]
  64. Shafeeq, P.M.; Aggarwal, P.; Krishnan, P.; Rai, V.; Pramanik, P.; Das, T.K. Modeling the temporal distribution of water, ammonium-N, and nitrate-N in the root zone of wheat using HYDRUS-2D under conservation agriculture. Environ. Sci. Pollut. Res. Int. 2020, 27, 2197–2216. [Google Scholar] [CrossRef] [PubMed]
  65. Wallace, A.J.; Armstrong, R.D.; Grace, P.R.; Scheer, C.; Partington, D.L. Nitrogen use efficiency of 15N urea applied to wheat based on fertiliser timing and use of inhibitors. Nutr. Cycl. Agroecosystems 2020, 116, 41–56. [Google Scholar] [CrossRef]
  66. Fenn, L.B.; Miyamoto, S. Ammonia Loss and Associated Reactions of Urea in Calcareous Soils. Soil Sci. Soc. Am. J. 1981, 45, 537–540. [Google Scholar] [CrossRef]
  67. Freney, J.R.; Simpson, J.R.; Denmead, O.T. Volatilization of ammonia. In Gaseous Loss of Nitrogen from Plant-Soil Systems; Freney, J.R., Simpson, J.R., Eds.; Springer: The Hague, The Netherlands, 1983. [Google Scholar]
  68. Hu, C.; Zheng, C.; Sadras, V.O.; Ding, M.; Yang, X.; Zhang, S. Effect of straw mulch and seeding rate on the harvest index, yield and water use efficiency of winter wheat. Sci. Rep. 2018, 8, 8167. [Google Scholar] [CrossRef] [PubMed]
  69. White, R.G.; Kirkegaard, J.A. The distribution and abundance of wheat roots in a dense, structured subsoil—Implications for water uptake. Plant Cell Environ. 2010, 33, 133–148. [Google Scholar] [CrossRef]
  70. Zhang, S.; Sadras, V.; Chen, X.; Zhang, F. Water use efficiency of dryland wheat in the Loess Plateau in response to soil and crop management. Field Crops Res. 2013, 151, 9–18. [Google Scholar] [CrossRef]
  71. Lollato, R.P.; Edwards, J.T.; Ochsner, T.E. Meteorological limits to winter wheat productivity in the U.S. southern Great Plains. Field Crops Res. 2017, 203, 212–226. [Google Scholar] [CrossRef]
  72. Harries, M.; Flower, K.C.; Renton, M.; Anderson, G.C. Water use efficiency in Western Australian cropping systems. Crop Pasture Sci. 2022, 73, 1097–1117. [Google Scholar] [CrossRef]
  73. Bogunović, I.; Filipović, V. Mulch as a nature-based solution to halt and reverse land degradation in agricultural areas. Curr. Opin. Environ. Sci. Health 2023, 34, 100488. [Google Scholar] [CrossRef]
  74. Krevh, V.; Filipović, L.; Petošić, D.; Mustać, I.; Bogunović, I.; Butorac, J.; Kisić, I.; Defterdarović, J.; Nakić, Z.; Kovač, Z.; et al. Long-term analysis of soil water regime and nitrate dynamics at agricultural experimental site: Field-scale monitoring and numerical modeling using HYDRUS-1D. Agric. Water Manag. 2023, 275, 108039. [Google Scholar] [CrossRef]
  75. Hochman, Z.; Horan, H. Causes of wheat yield gaps and opportunities to advance the water-limited yield frontier in Australia. Field Crops Res. 2018, 228, 20–30. [Google Scholar] [CrossRef]
  76. Angus, J.F.; van Herwaarden, A.F.; Fischer, R.A.; Howe, G.N.; Heenan, D.P. The source of mineral nitrogen for cereals in south-eastern Australia. Aust. J. Agric. Res. 1998, 49, 511–522. [Google Scholar] [CrossRef]
  77. Cameron, K.C.; Di, H.J.; Moir, J.L. Nitrogen losses from the soil-plant system: A review. Ann. Appl. Biol. 2013, 162, 145–173. [Google Scholar] [CrossRef]
  78. Monjardino, M.; Hochman, Z.; Horan, H. Yield potential determines Australian wheat growers’ capacity to close yield gaps while mitigating economic risk. Agron. Sustain. Dev. 2019, 39, 49. [Google Scholar] [CrossRef]
  79. IPCC. Guidelines for National Greenhouse Gas Inventories; Intergovernmental Panel on Climate Change: Geneva, Switzerland, 2006. [Google Scholar]
  80. Siemens, J.; Kaupenjohann, M. Contribution of dissolved organic nitrogen to N leaching from four German agricultural soils. J. Plant Nutr. Soil Sci. 2002, 165, 675–681. [Google Scholar] [CrossRef]
  81. Anderson, G.C.; Fillery, I.R.P.; Dunin, F.X.; Dolling, P.J.; Asseng, S. Nitrogen and water flows under pasture-wheat and lupin-wheat rotations in deep sands in Western Australia 2. Drainage and nitrate leaching. Aust. J. Agric. Res. 1998, 49, 345–361. [Google Scholar] [CrossRef]
  82. Poss, R.; Smith, C.J.; Dunin, F.X.; Angus, J.F. Rate of soil acidification under wheat in a semi-arid environment. Plant Soil 1995, 177, 85–100. [Google Scholar] [CrossRef]
  83. Ridley, A.M.; White, R.E.; Helyar, K.R.; Morrison, G.R.; Heng, L.K.; Fisher, R. Nitrate leaching loss under annual and perennial pastures with and without lime on a duplex (texture contrast) soil in humid southeastern Australia. Eur. J. Soil Sci. 2001, 52, 237–252. [Google Scholar] [CrossRef]
  84. Ridley, A.M.; Mele, P.M.; Beverly, C.R. Legume-based farming in Southern Australia: Developing sustainable systems to meet environmental challenges. Soil Biol. Biochem. 2004, 36, 1213–1221. [Google Scholar] [CrossRef]
Figure 1. Daily values of rainfall and reference crop evapotranspiration (ET0) at the Pygery (a,b) and Yeelanna (c,d) sites during the 2018 (a,c) and 2019 (b,d) wheat growing seasons (May–December).
Sustainability 15 13370 g001
Figure 2. Estimated leaf area index (LAI) of wheat at the (a) Pygery and (b) Yeelanna sites during the 2018 and 2019 seasons.
Sustainability 15 13370 g002
Figure 3. Comparison of measured soil water contents in the 0–30 cm (top) and 0–100 cm (bottom) (profile averaged) with the corresponding simulated values during the 2018 and 2019 wheat growing seasons at the Pygery (a,b) and Yeelanna (c,d) sites on the Eyre Peninsula.
Sustainability 15 13370 g003
Figure 4. Daily rainfall and predicted values of actual evaporation (Es act), actual plant water uptake (Tp act), and drainage (Dr) under wheat crop during the 2018 (top) and 2019 (bottom) growing seasons at the Pygery (a,b) and Yeelanna (c,d) sites on the Eyre Peninsula.
Sustainability 15 13370 g004
Figure 5. Comparison of measured (M) and simulated (S) values of NH4–N (a,b) and NO3–N (c,d) in the soil at wheat harvest time (as indicated) during the 2018 (a,c) and 2019 (b,d) seasons at the Pygery site.
Sustainability 15 13370 g005
Figure 6. Simulated distribution of NH4–N (a,c) and NO3–N (b,d) in the soil at different depths (15, 30, 60, and 90 cm) at the Pygery (a,b) and Yeelanna (c,d) sites.
Sustainability 15 13370 g006
Figure 7. Predicted components of N balance ((NF = fertilizer nitrogen; NMin = N mineralization from organic matter; NV = N volatilization; NR_NH4 = plant uptake of ammonium N; NR_NO3 = plant uptake of nitrate N; NL_NH4 = leaching of ammonium N; NL_NO3 = leaching of nitrate N) during the (a) 2018 and (b) 2019 at Pygery (Py) and Yeelanna (Ye).
Sustainability 15 13370 g007
Figure 8. Daily NH4–N (a,c) and NO3–N (b,d) uptake by wheat at Pygery (a,b) and Yeelanna (c,d) during 2018 and 2019 simulated by HYDRUS-1D.
Sustainability 15 13370 g008
Figure 9. Daily nitrogen volatilization (Nv) (a) and leaching (NL) (b) losses at the Pygery (Py, red line) and Yeelanna (Ye, blue line) sites simulated by HYDRUS-1D during the 2018 and 2019 wheat seasons.
Sustainability 15 13370 g009
Figure 10. Estimated water productivity (kg ha−1 mm−1) for transpiration (Wp_Tp) and evapotranspiration (Wp_ET), and nutrient use efficiency (NUE) (kg kg−1) of wheat at Pygery (Py) and Yeelanna (Ye) during the 2018 and 2019 seasons.
Sustainability 15 13370 g010
Table 1. Wheat sowing, fertilizer details, and wheat yield at the experimental sites.
20182019
Pygery (Py)
VarietyMaceMace
Sowing date19 May12 May
Row spacing (mm)
Plant density (plants m−2)140160
Fertilizers (applied at sowing)
MAP (kg ha−1)55-
Urea (kg ha−1)-40
Urea/ammonium sulfate blend3060
Yield (t ha−1)1.451.6
Yeelanna (Ye)
VarietyEmu RockMace
Sowing date12 May22 May
Row spacing (mm)307305
Plant density (plants m−2)150150
Fertilizers (applied at sowing)
MAP (kg ha−1)66
Urea (kg ha−1)10075
In-season fertilizer
Urea (kg ha−1) and date50 on 16 July100 on 28 June
50 on 17 August100 on 27 July
Yield (t ha−1)5.673.84
Table 2. Physicochemical properties of soils at the experimental sites.
Depth
(cm)
Soil
Texture
SandSiltClayDb
(g cm−3)
OC
(%)
pH
(H2O)
pH
(CaCl2)
CEC
(Cmol (+) kg−1)
%%%
Pygery (Py)
0–15SL64.713.519.81.571.178.57.817.0
15–30SCL58.712.328.91.330.758.78.022.5
30–60SCL47.021.231.81.330.559.38.325.0
60–90CL42.721.236.01.420.349.58.526.2
90–100SC45.019.335.71.420.349.58.524.7
Yeelanna (Ye)
0–15SCL70.48.720.91.452.038.17.726.1
15–30C21.86.371.91.340.708.57.942.0
30–60C22.36.471.21.520.428.68.045.5
60–90C14.310.275.61.640.329.38.347.2
90–100SC51.53.045.51.640.329.38.351.5
S = sand; C = clay; L = loam; Db = bulk density; OC = organic carbon; CEC = cation exchange capacity.
Table 3. Estimated soil hydraulic parameters at Pygery and Yeelanna used in the HYDRUS-1D modeling simulations.
Soil
Texture
Soil Depth (cm)θr
(cm3 cm−3)
θs
(cm3 cm−3)
a
(cm−1)
nKs
(cm d−1)
lDb
(g cm−3)
Pygery (Py)
Loam0–150.050.400.0241.4027.10.51.57
Loam15–300.120.410.0221.3219.10.51.33
Clay loam30–600.20.440.0171.3715.60.51.33
Clay loam60–900.220.450.0171.3514.40.51.42
Cay loam90–1050.240.450.0181.3515.80.51.42
Yeelanna (Ye)
Loam0–150.070.450.0251.4553.40.51.45
Clay15–300.150.460.0231.3117.20.51.34
Clay30–600.190.440.0211.289.40.51.52
Clay60–900.210.490.0191.175.490.51.64
Silt loam90–1050.240.490.0181.1611.10.51.64
θr and θs are the residual and saturated water contents, respectively; Ks is the saturated hydraulic conductivity, Db is the bulk density, and a, n, and l are shape parameters.
Table 4. Estimated values of the root mean square error (RMSE), mean absolute error (MAE), and mean error (ME) between measured and model-predicted water content in the soil for the 0–30 cm and 30–100 cm soil layers at the Pygery and Yeelanna sites during 2018 and 2019.
SiteYearSoil Depth
(cm)
RMSE
(cm3 cm−3)
MAE
(cm3 cm−3)
ME
(cm3 cm−3)
Pygery20180–300.020.01−0.01
30–1000.040.030.02
20190–300.030.03−0.02
30–1000.070.06−0.06
Yeelanna20180–300.060.020.04
30–1000.040.030.03
20190–300.070.07−0.04
30–1000.050.04−0.02
Table 5. Seasonal water balance components (mm) simulated by HYDRUS-1D during the 2018 and 2019 cropping seasons at the Pygery (Py) and Yeelanna (Ye) sites.
SiteYearEsTp actDr∆SRainfall (Season)Rainfall (Annual)
Py201876.695.20.036.4175.6235.3
201998.685.00−2.8183.6201.8
Ye201896.3140.540.854.9333407.6
2019104.3140.690.49.2348.3375.5
Tp act = actual plant water uptake, Es = evaporation, Dr = drainage, ∆S = soil storage/depletion.
Disclaimer/Publisher’s Note: The statements, opinions and data contained in all publications are solely those of the individual author(s) and contributor(s) and not of MDPI and/or the editor(s). MDPI and/or the editor(s) disclaim responsibility for any injury to people or property resulting from any ideas, methods, instructions or products referred to in the content.

