Article

Influence of Blast Furnace Slag on Pore Structure and Transport Characteristics in Low-Calcium Fly-Ash-Based Geopolymer Concrete

Department of Civil Engineering, Sharif University of Technology, Tehran 11155-9161, Iran
*
Authors to whom correspondence should be addressed.
Sustainability 2023, 15(18), 13348; https://doi.org/10.3390/su151813348
Submission received: 8 August 2023 / Revised: 30 August 2023 / Accepted: 3 September 2023 / Published: 6 September 2023
(This article belongs to the Special Issue Advanced Concrete and Construction Materials)

Abstract

:
Alkali-activated fly ash slag (AAFS) has emerged as a novel and environmentally sustainable construction material, garnering substantial attention due to its commendable mechanical attributes and minimal ecological footprint. This investigation delves into the influence of slag incorporation on the strength, pore structure, and transport characteristics of AAFS, encompassing various levels of fly ash replacement with slag. To assess the mechanical properties of AAFS concrete, unconfined compression and ultrasonic pulse velocity tests were conducted. Meanwhile, microstructural and mineralogical alterations were scrutinized through porosity, N2-adsorption/desorption, and SEM/EDX assessments. In addition, transport properties were gauged using electrical surface resistivity, water permeability, and water vapor permeability tests. According to the results, a remarkable refinement in the pore volume was found by increasing the slag content. The volume of the gel pores and surface area increased significantly associated with the increase in tortuosity. Accordingly, Ca inclusion in the cross-linked sodium aluminosilicate hydrate gel remarkably reduced the transport properties.

1. Introduction

In recent decades, global warming has become one of the most challenging issues throughout the world. Approximately 40% of global warming is due to the consumption of construction materials [1]. In particular, concrete as the second most widely used material in the world causes 5–8% of global carbon dioxide (CO2) emissions [2]. Using by-product materials such as slag (SG), fly ash (FA), and silica fume as supplementary cementitious material can help to alleviate the adverse effects of cement [3,4]. Among new methods of green cement production, geopolymer concrete has demonstrated a potential of more than 70% reduction in global warming impact compared to traditional cement-based concrete [5,6,7,8].
In 1979, Davidovits represented a new cement-free concrete named geopolymer (GP). Geopolymer is a kind of inorganic polymer and a product of aluminosilicates reaction with alkali activators [9]. It has the potential to be utilized in a multitude of applications such as structural elements, soil stabilization, and immobilization of heavy metals [10,11,12,13,14]. The geopolymerization process includes three steps: (1) the alkali activator triggers the deconstruction of aluminosilicate source, (2) the alumina/silica-hydroxy polymerization generates geopolymeric gel, and (3) the fresh structure is stabilized [15,16,17].
Fly ash is a coal combustion by-products and is a great source of aluminosilicates. Generally, ambient-cured FA-based geopolymers cannot attain desirable strengths due to their low reactivity. However, heat curing can enhance cross-linked sodium aluminosilicate hydrate gel (N-A-S-H) [18]. For instance, at 75 °C for 24 h of heat curing, the compressive strength improved by about 50% compared to the ambient-cured sample [19]. To overcome the low reactivity of the FA particles in the alkali environment, adding high-CaO materials (such as SG, cement, CaO, and Ca(OH)2) can effectively accelerates the reaction kinetics [20,21,22,23].
Blast furnace slag is a by-product of the iron- and steel-making industry. Owing to the high content of CaO, SG has been studied by many researchers as a partial replacement of the FA in geopolymers. In general, amorphous calcium aluminosilicate hydrate (C-A-S-H) has been identified as a dominant gel in the alkali-activated slag matrix. In FA/SG-based geopolymers with increasing SG content, C-A-S-H becomes a binding gel, and a hybrid gel of C-A-S-H and N-A-S-H (ascribed as N-C-A-S-H) is generated. Accordingly, Ca incorporation in the N-A-S-H structure leads to a well-compacted gel and a drastic increase in the strength of the geopolymer [24,25,26].
The FA/SG-based geopolymers’ durability is highly dependent on the pore network and microstructural properties. The addition of SG to the FA-based geopolymers significantly decreases the porosity and refines the pore volume. The FA/SG-based geopolymers show high acid resistance. However, the greater content of Ca in the gel structure causes higher decalcification and more gypsum formation. It leads to expansion and, consequently, strength loss in the acid environment. Indeed, the high acid resistance of FA/SG-based geopolymers is due to its dense and tortuous pore solution, which causes relatively small penetration depth [27,28,29,30].
Among the concrete characteristics, mass transport through the pore solution is a parameter that depends on pore network topology, such as connectivity and tortuosity [31,32,33]. Water and vapor transport are the key parameters for the long-term durability of porous inorganic materials [34,35,36] since water is the main carrier of erosive ions and species (such as C l , S O 4 2 ,   a n d   C O 2 ) [37,38,39,40]. To measure the mass transport and pore structure along with direct transport measuring, non-destructive methods such as electrical resistivity and pulse velocity can be used to evaluate pore network characteristics and durability [41,42,43,44,45].
According to the available literature, numerous research studies have delved into the chemo-mechanical properties of geopolymers based on fly ash (FA) and slag (SG) [46,47,48,49]. However, there is a noticeable scarcity of publications addressing the transport characteristics of these geopolymers. The results of bulk diffusion tests revealed that all fly ash-based geopolymer concrete (GPC) specimens, regardless of their curing conditions, exhibited significantly high chloride content. Even at a depth of 25 mm beneath the surface, the chloride content exceeded 0.3% of the concrete mass. This observation suggests that low-calcium fly-ash-based GPCs display diminished resistance to chloride diffusion, likely attributable to reduced binding capacity, as well as well-connected pore structures and/or elevated levels of capillary pores [50]. In the case of rice-husk-ash-based geopolymer concrete incorporating a 15% ordinary Portland cement (OPC) replacement, the water absorption rate was notably low at 4.42%, a characteristic observed across all ages of the specimens [51]. This indicates that N-A-S-H possesses larger permeable voids compared to the denser and smaller pore system of C-A-S-H [52]. This distinction underscores the advantageous potential of porous geopolymers with a substantial proportion of interconnected pores for effectively removing heavy metals, which holds promise for their future applications in groundwater decontamination [53].
This study aims to investigate the pore structure and transport properties of FA/SG-based geopolymers, as there is currently no comprehensive research on this topic. The replacement ratios of FA to SG were 0, 10, 20, and 30%. The unconfined compression and ultrasonic pulse velocity tests were performed for evaluation of mechanical properties. Microstructural and mineralogical changes were evaluated by porosity, N2-adsorption/desorption, and SEM/EDX tests. Along with this, transport properties were studied by electrical surface resistivity, water permeability, and water vapor permeability tests.

2. Materials and Preparation

Class F fly ash (FA) and ground granulated blast furnace slag (GGBS) were used as raw materials. Table 1 presents the chemical composition of the FA and GGBS. The X-ray diffraction (XRD) analysis of FA and GGBS is available in the previous study [54]. A combination of sodium hydroxide (NH) and sodium silicate (NS) was selected as an alkali activator. The chemical composition of NS was SiO2 (=29.8 wt%), Na2O (=14.19 wt%), and H2O (=56 wt%), with a modulus (SiO2/Na2O) of 2.1. Ten-molar NH solution was prepared by dissolving 95–98% purified NH pallets in tap water one day before mixing. A polycarboxylate-based superplasticizer was utilized to enhance the concrete workability. Well-graded natural siliceous sand with a fineness modulus of 2.84 was used as fine aggregates. The coarse aggregates were crushed granite with a maximum nominal size of 12 mm. The particle size distribution of aggregates was in the range of ASTM C33-01 [55]. Fine and coarse aggregates were under the saturated surface dry (SSD) condition according to ASTM C128 and ASTM C127, respectively [56,57].
In all mix designs, binder content, water/binder, alkali liquid/binder, coarse aggregate/fine aggregate, and NH solution molarity were 400 kg/m3, 0.32, 0.4, 1.5, and 10 M, respectively. The concrete mix designs were based on the volumetric method. Based on a previous study, the optimum NS/NH solution was selected as 2.5 in this study [58]. Table 2 represents the mixture designs and the labels of the specimens.
Solid materials (binder and aggregate) were first mixed for three minutes to reach a homogenous mixture. NH and NS solutions were blended 30 min before adding. Alkali liquid and superplasticizer were then added to the dry mixture and mixed for another three minutes. Fresh concrete was placed in the 10 × 10 × 10 cm3 cubic molds for unconfined compression and ultrasonic pulse velocity tests, 15 × 15 × 15 cm3 cubic molds for water permeability, and cylindrical molds with a diameter of 10 cm and a height of 20 cm for electrical surface resistivity. Each specimen was prepared by pouring the mixture into three layers along with pounding 25 times. Although AAFS has good potential to cure in the ambient temperature, in this study, the specimens were cured at 70 °C for one day to reach a high degree of geopolymerization. They were then kept in the curing room at 20 ± 2 °C and 60 ± 5 RH for 28 days.

3. Testing Methods

3.1. Mechanical Properties

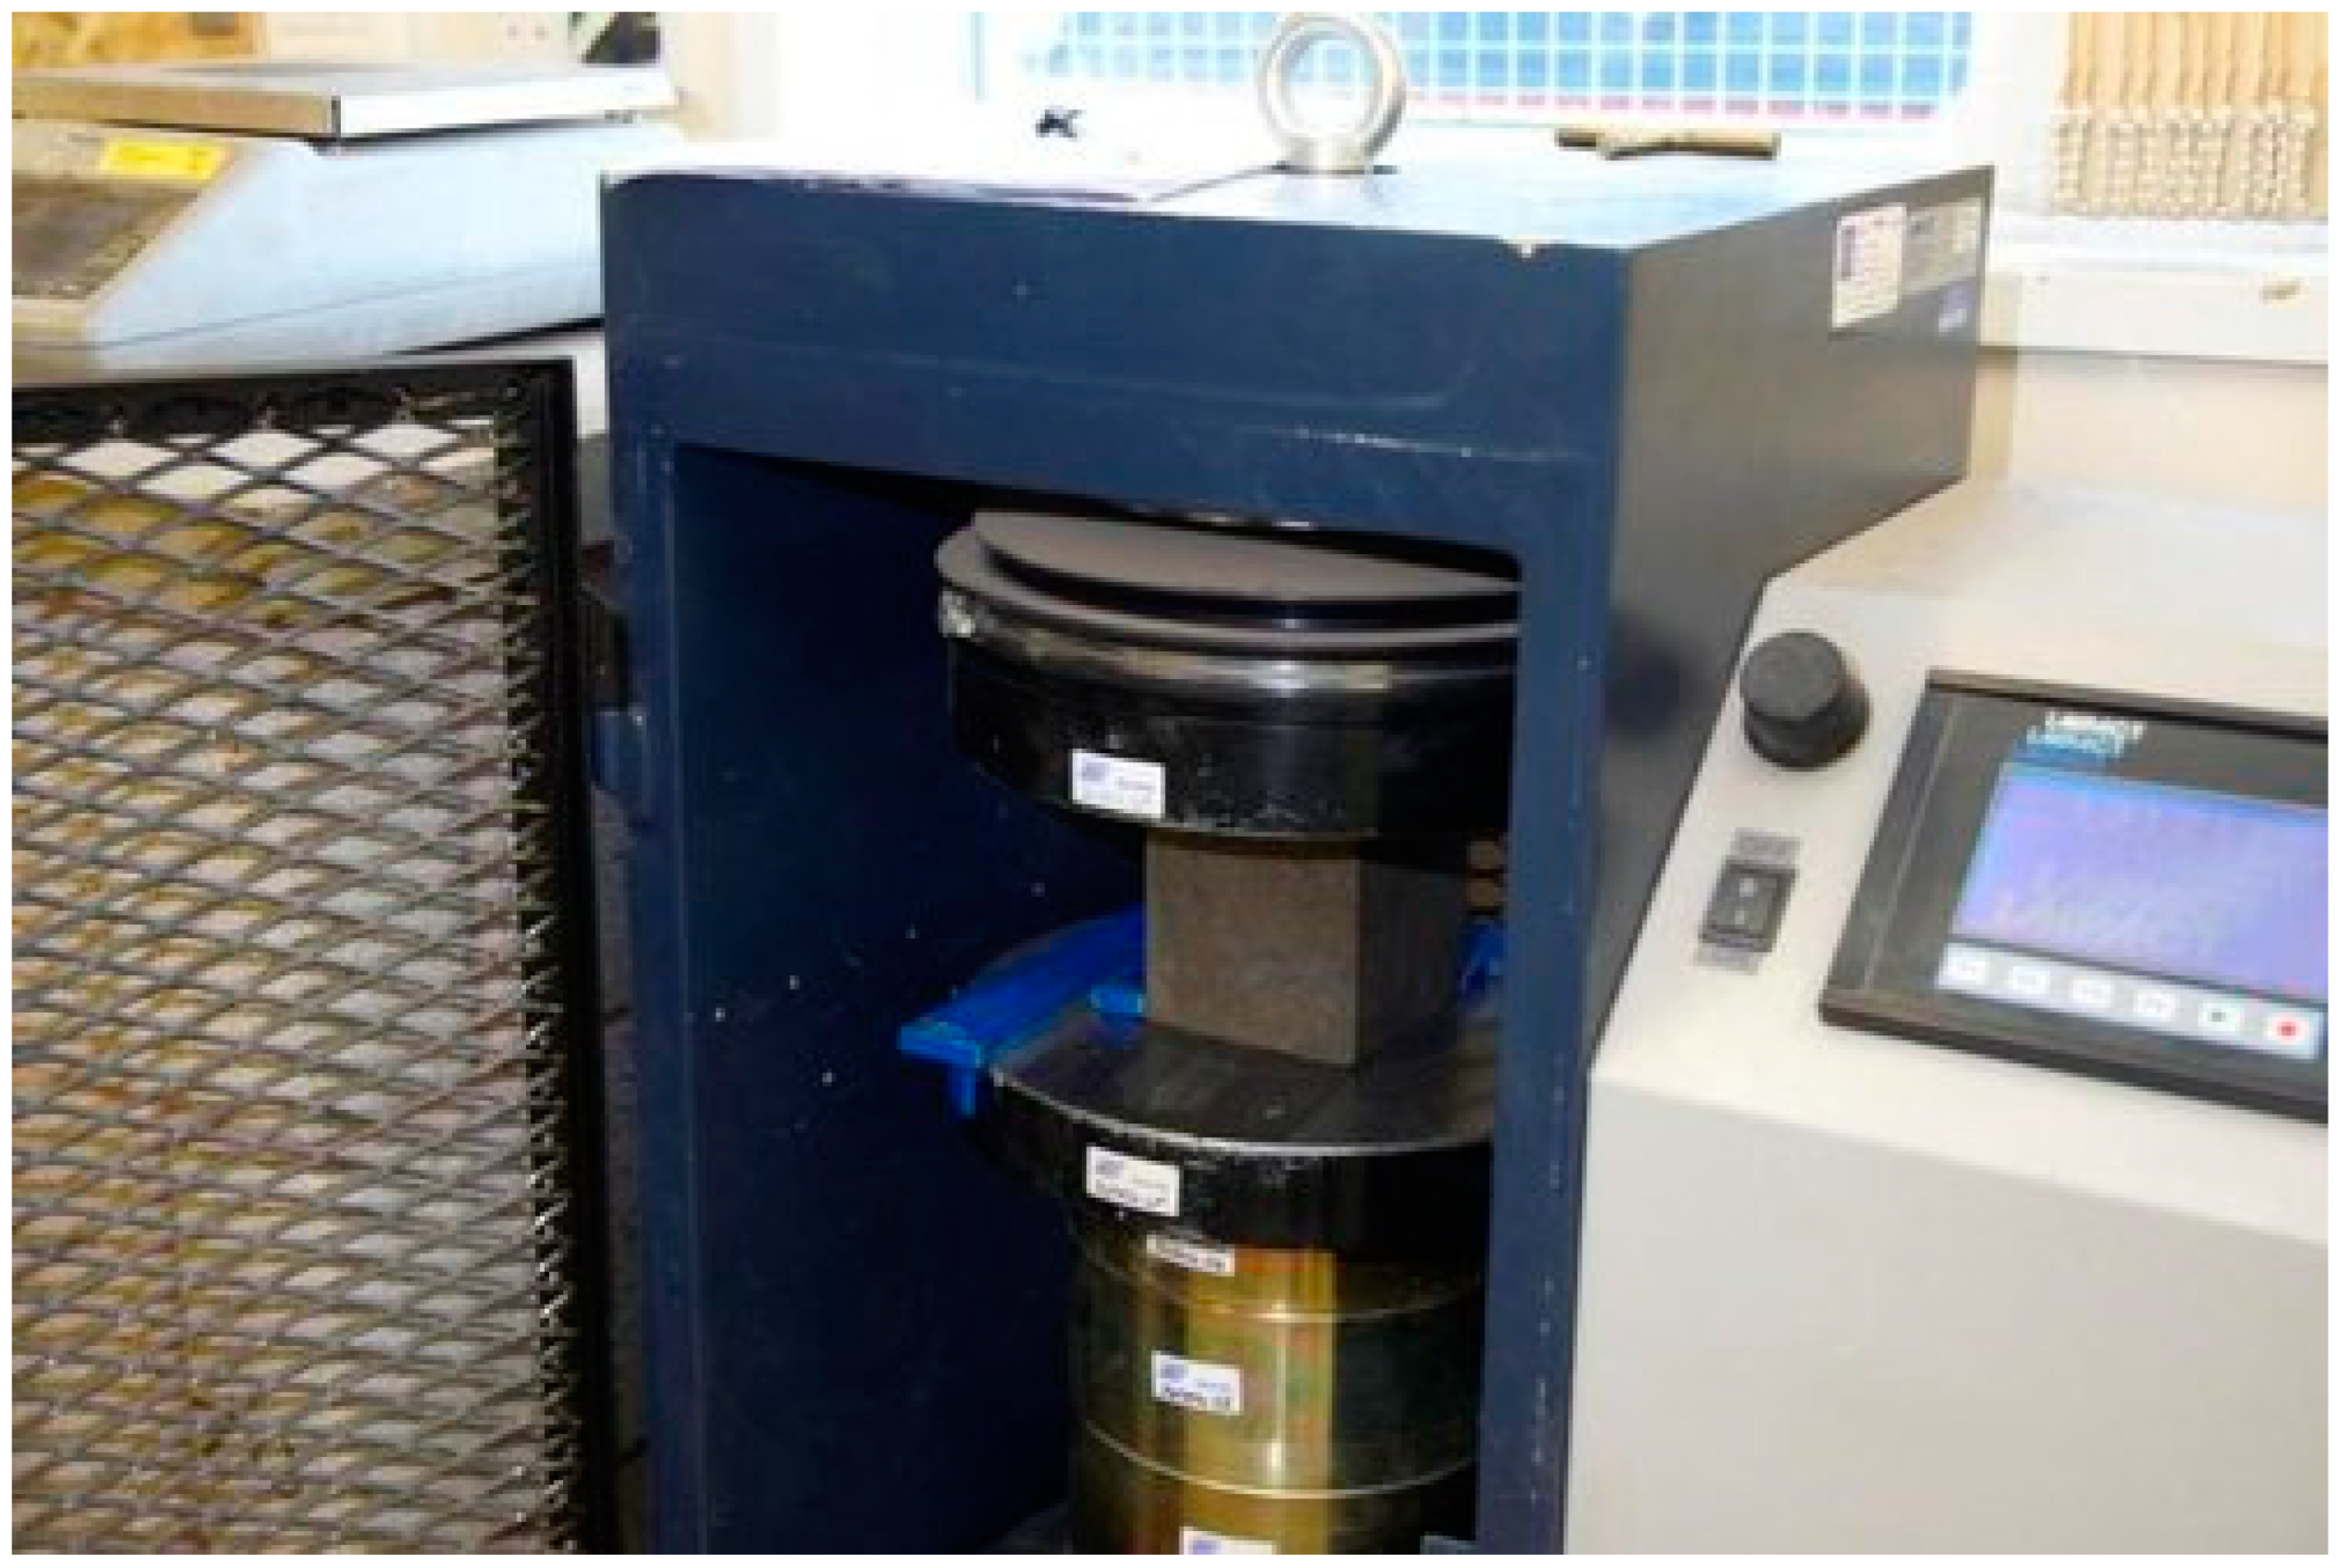
3.1.1. Unconfined Compression Test

The compressive strength was measured according to Figure 1 and BS EN 12390-3 standard [59] by the Dartec universal testing machine (UTM) with 1000 kN capacity.

3.1.2. Ultrasonic Pulse Velocity

The ultrasonic pulse velocity (UPV) test was carried out according to ASTM C597-09 [60]. The instrument consists of a transducer for wave generation, a receiving transducer, and a device for displaying the time it takes to pass the wave across the sample. The probes were lubricated to have a proper contact between the sample and the probes. The time taken by the wave to pass through the specimens was measured, and the ultrasonic pulse velocity (UPV) was calculated as follows:
U P V = L t
where t is the time taken by the wave to transmit over the specimen, and L is the length of the specimen.

3.2. Microstructural and Mineralogical Changes

3.2.1. Porosity

The porosity was measured according to ASTM C642 [61]. The 10 cm × 5 cm discs were used to determine the porosity according to Equation (2) as follows:
P o r o s i t y = W a W d W a W w × 100
where Wa is the weight of the saturated specimens in the air (g), Wd is the weight of the dried specimens (g), and Ww is the weight of saturated specimens in water (g).

3.2.2. Pore size Distribution and Specific Surface Area

Gas adsorption and desorption represent the prevailing techniques for assessing the surface area of powders and determining the size distribution of porous materials. To perform these measurements, we employed the Belsorp mini II surface area and pore size analyzer by Bel Company. Prior to subjecting the specimens to the N2-adsorption/desorption test, they underwent vacuum drying and degassing. The experimental procedure was carried out at a temperature of −195.85 °C, involving the analysis of nitrogen adsorption/desorption isotherms for approximately 2 g of AAFS pastes. It is worth noting that the alkali liquid/binder and water/binder ratios of the AAFS paste samples were meticulously maintained to match those of the respective concrete specimens.

3.2.3. Scanning Electron Microscopy/Energy-Dispersive X-ray Spectroscopy

Scanning electron microscopy (SEM) and energy-dispersive X-ray spectroscopy (EDX) was used to investigate the microstructural and mineralogical characteristics of AAFS mixtures. The pieces were collected from the middle of the specimens. Before testing, the samples were solvent-vacuum dried, followed by polishing the surface and gold coating.

3.3. Transport Properties

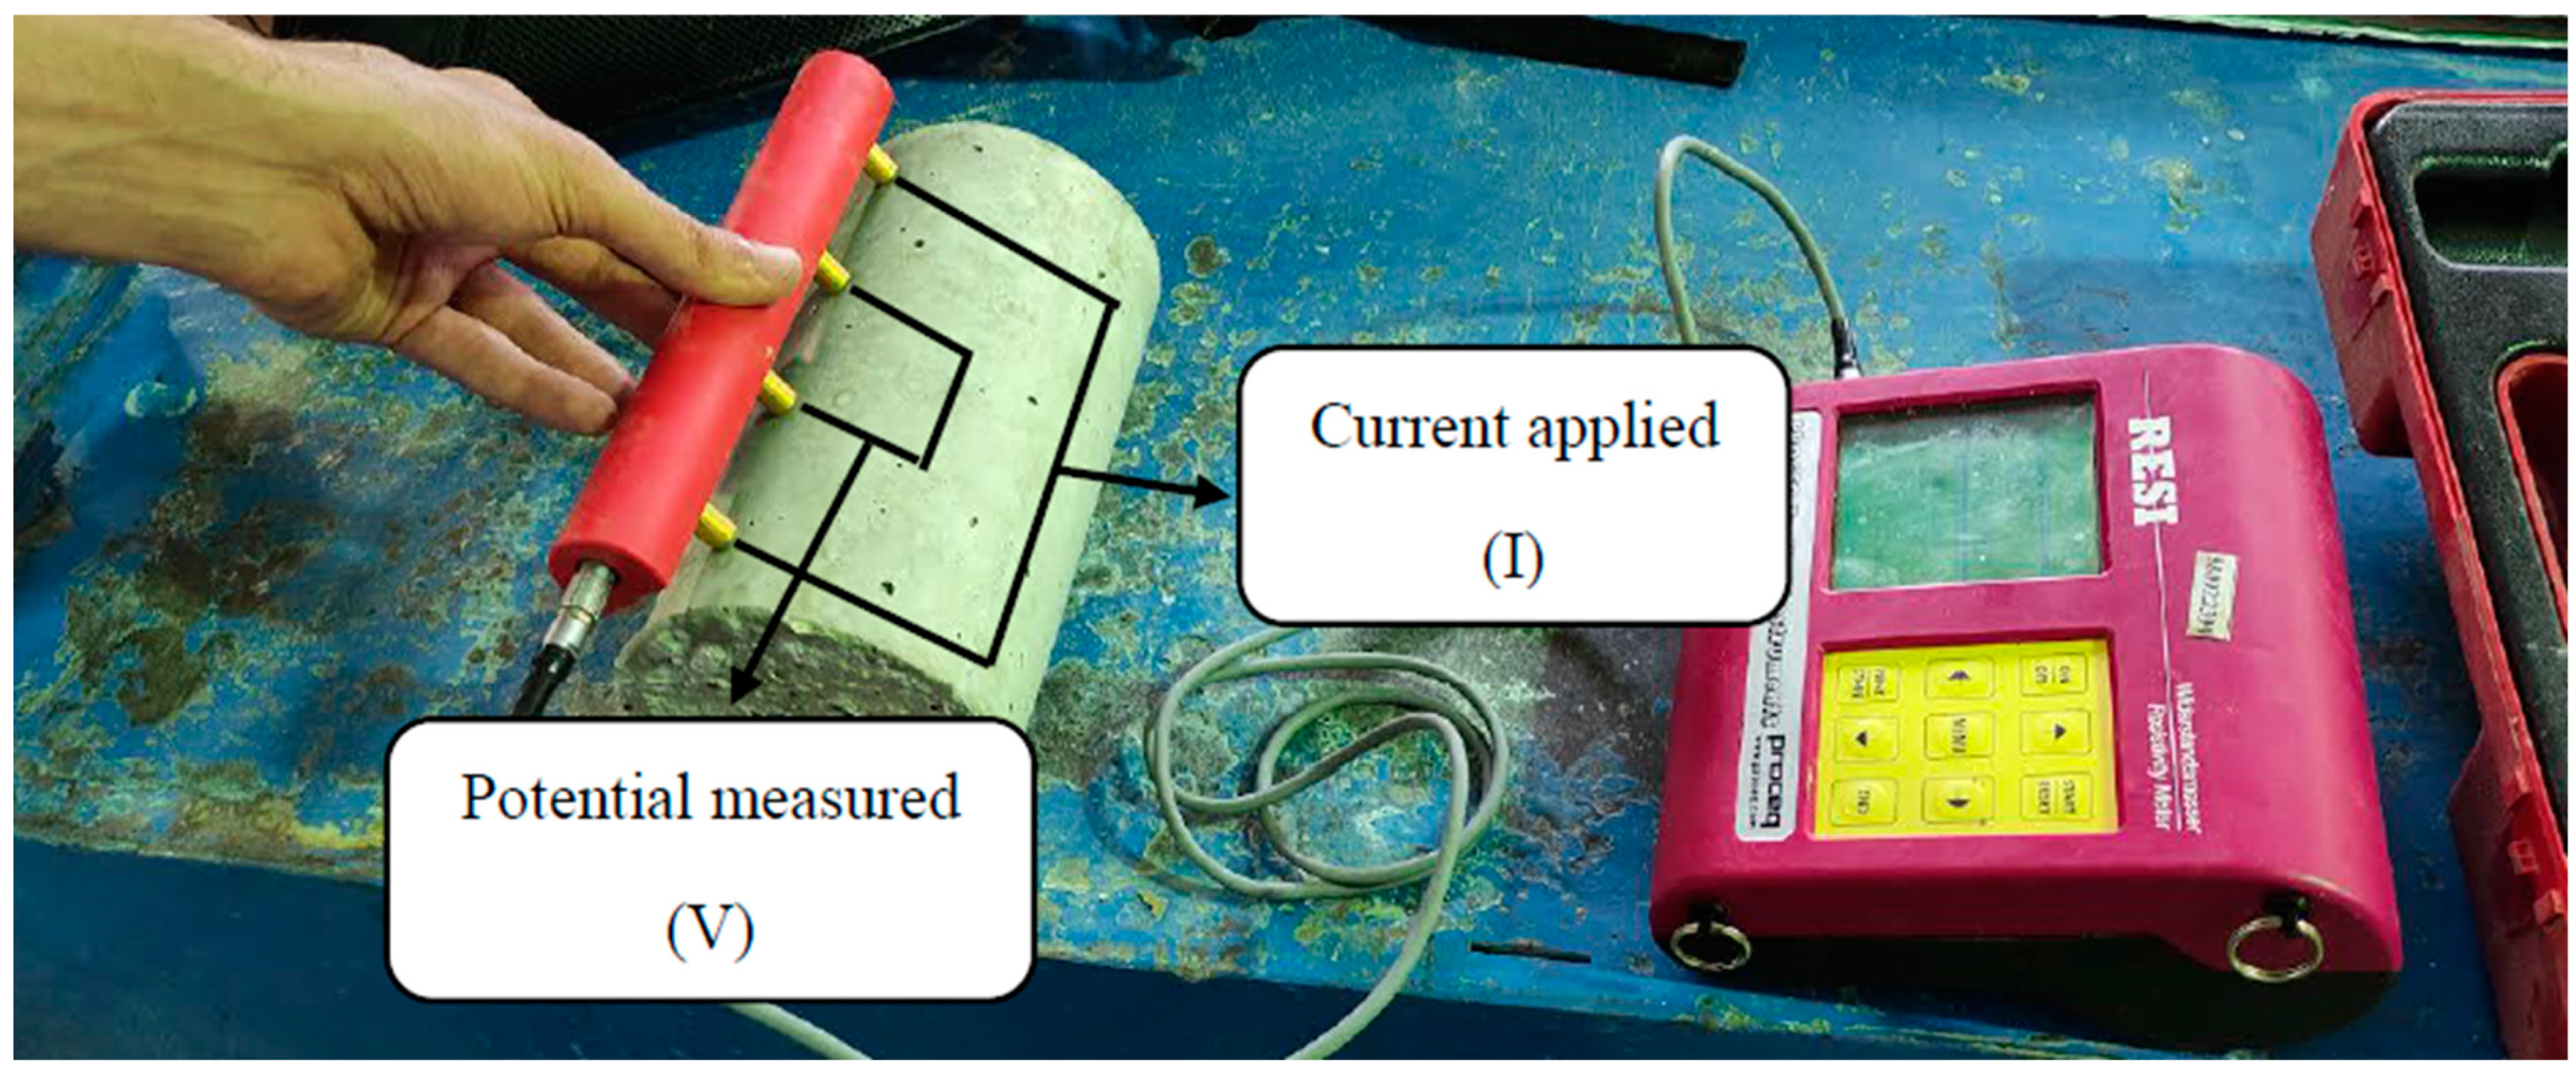
3.3.1. Electrical Surface Resistivity

The electrical surface resistivity was conducted according to AASHTP TP 95-11 [62] at 28 days. The ESR was measured using four pin Wenner probe arrays, as shown in Figure 2. An alternative current potential difference was applied at the outer pins of the Wenner array, leading to current flow in the concrete. The two inner probes measured the resultant potential difference, and the resistivity was calculated using Equation (3) as follows:
ρ = R A L = 2 π a R = 2 π a V I
where ρ is resistivity in kΩ cm, R is resistance in kΩ, A is the surface area of the specimen in c m 2 , L is the element length in cm, and a is the spacing between the probes in cm.

3.3.2. Water Vapor Transmission

The water vapor transmission (WVT) was conducted according to ASTM E96/E96M-16 [63]. In this study, the dry cup method was performed. Figure 3 shows the WVT test apparatus. The silica gel as a desiccant agent filled the dish within 6 mm of the specimen. A 10 cm × 2.5 cm disc was attached to the dish. Furthermore, the specimen in contact with the container was sealed with wax to prevent the water vapor transport from this area. The apparatus was then placed in the humidity chamber. In this study, the humidity was kept at 95 ± 2% to apply a high water vapor gradient. Water vapor transmission was calculated according to Equation (4) as follows:
W V T = G t A
where G is the weight change (g), t is time (hour), G/t is the slope of the straight line ( g h ), and A is the test area (m2).

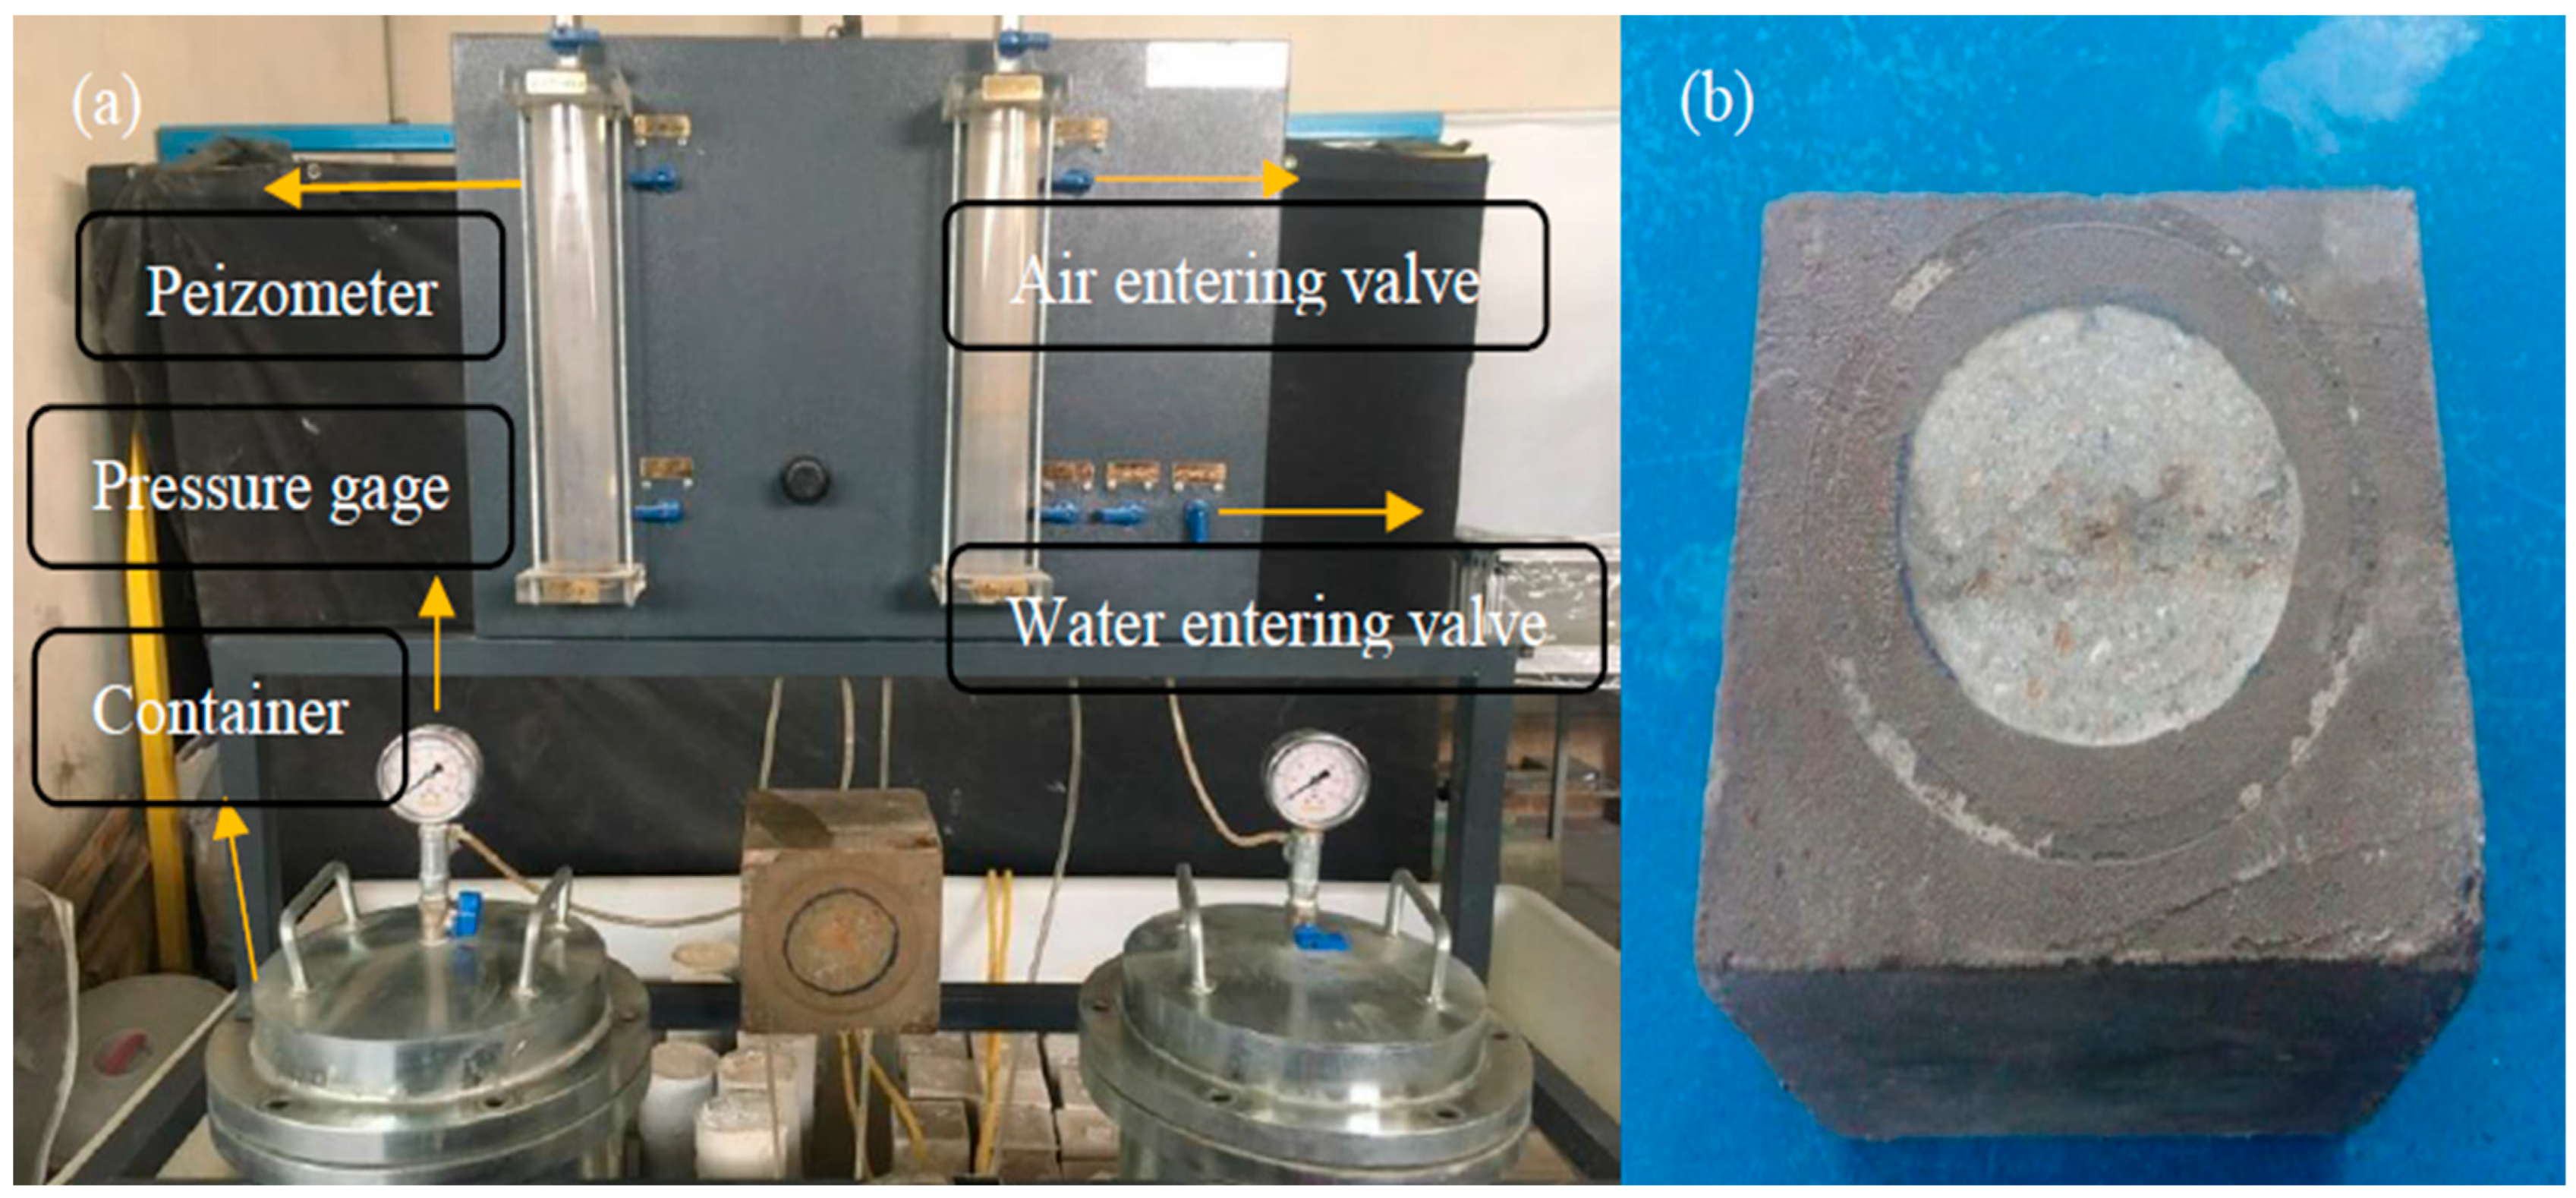
3.3.3. Water Permeability

A water permeability device was used to measure the permeability coefficient of concrete, as can be seen in Figure 4a. The permeability test was carried out on 15 × 15 × 15 cm3 cubic specimens after 28 days of curing. The sides of the specimen were coated and waterproofed to prevent water leakage from sides, as shown in Figure 4b. Water pressure was controlled using an air compressor with an 8-bar capacity. The water pressure was applied to the specimen surface at a 1 bar pressure and gradually increased to 5 bar after 5 min. The water level in the graduated capillary tube was recorded at different time intervals until the flow rate reached a constant value. The flow rate (cm3/h) is determined by dividing the water volume into the specimen over the time interval between the records. The permeability coefficient is calculated using the Darcy law as follows:
K = M × l A × h
where K is the coefficient of permeability (m/s), M is the flow rate (cm3/s), l is the length of the specimen in the direction of water flow, A is the cross-section perpendicular to water flow, and h is the hydraulic head.

4. Results and Discussions

4.1. Mechanical Properties

4.1.1. Unconfined Compressive Strength

Figure 5 shows the compressive strength of AAFS specimens with different levels of slag replacement. Incorporating SG into FA has a significant effect on the compressive strength. The compressive strength of GP10, GP20, and GP30 increased by 32.35, 82.35, and 94.12%, respectively, compared to the GP0. This increase is mainly ascribed to the formation of C-A-S-H gel along with N-A-S-H. Also, Ca ions of SG can be dissolved in the N-A-S-H gel and form a new hybrid N-C-A-S-H gel. These new products lead the AAFS geopolymer to have dense structures [16,54,55]. The most significant improvement in the compressive strength was related to the GP20. This result was in good agreement with previous research [64].

4.1.2. Ultrasonic Pulse Velocity

The ultrasonic pulse velocity (UPV) is a measure of the speed of sound waves through a material, and it can be used to estimate the compressive strength of cement mortar and concrete. As shown in Figure 6, the UPV results for cement mortars blended with silica fume were in the range of 3774 and 4255 m/s. The UPV of GP10, GP20, and GP30 increased by 3.1, 5.2, and 12.8%, respectively, compared to the GP0. The UPV values increased with microstructure densification and increasing the compressive strength [65].
To further investigate the relationship between UPV and compressive strength, the UPV results were plotted versus the compressive strength results, and the relationship between them was calculated. As shown in Figure 7, a good correlation was observed between UPV and compressive strength. The correlation between compressive strength and UPV is obtained by adopting the procedure presented by the ACI228. Variation in the tested cores’ mixture ratios resulted in obtaining different strength–UPV correlations [66,67].
The correlation of the compressive strength and UPV in relation to the effect of the inclusion Ca ions in the N-A-S-H structure is complexly affected by the change in microstructure caused by further densification of the geopolymeric reaction [68]. Therefore, the relationship developed in the Figure 7 is case-specific due to the UPV and the compressive strength of geopolymer concrete. A linear relationship was predicted between the UPV and compressive strength of specimens with varying GGBS content.

4.2. Microstructural and Mineralogical Changes
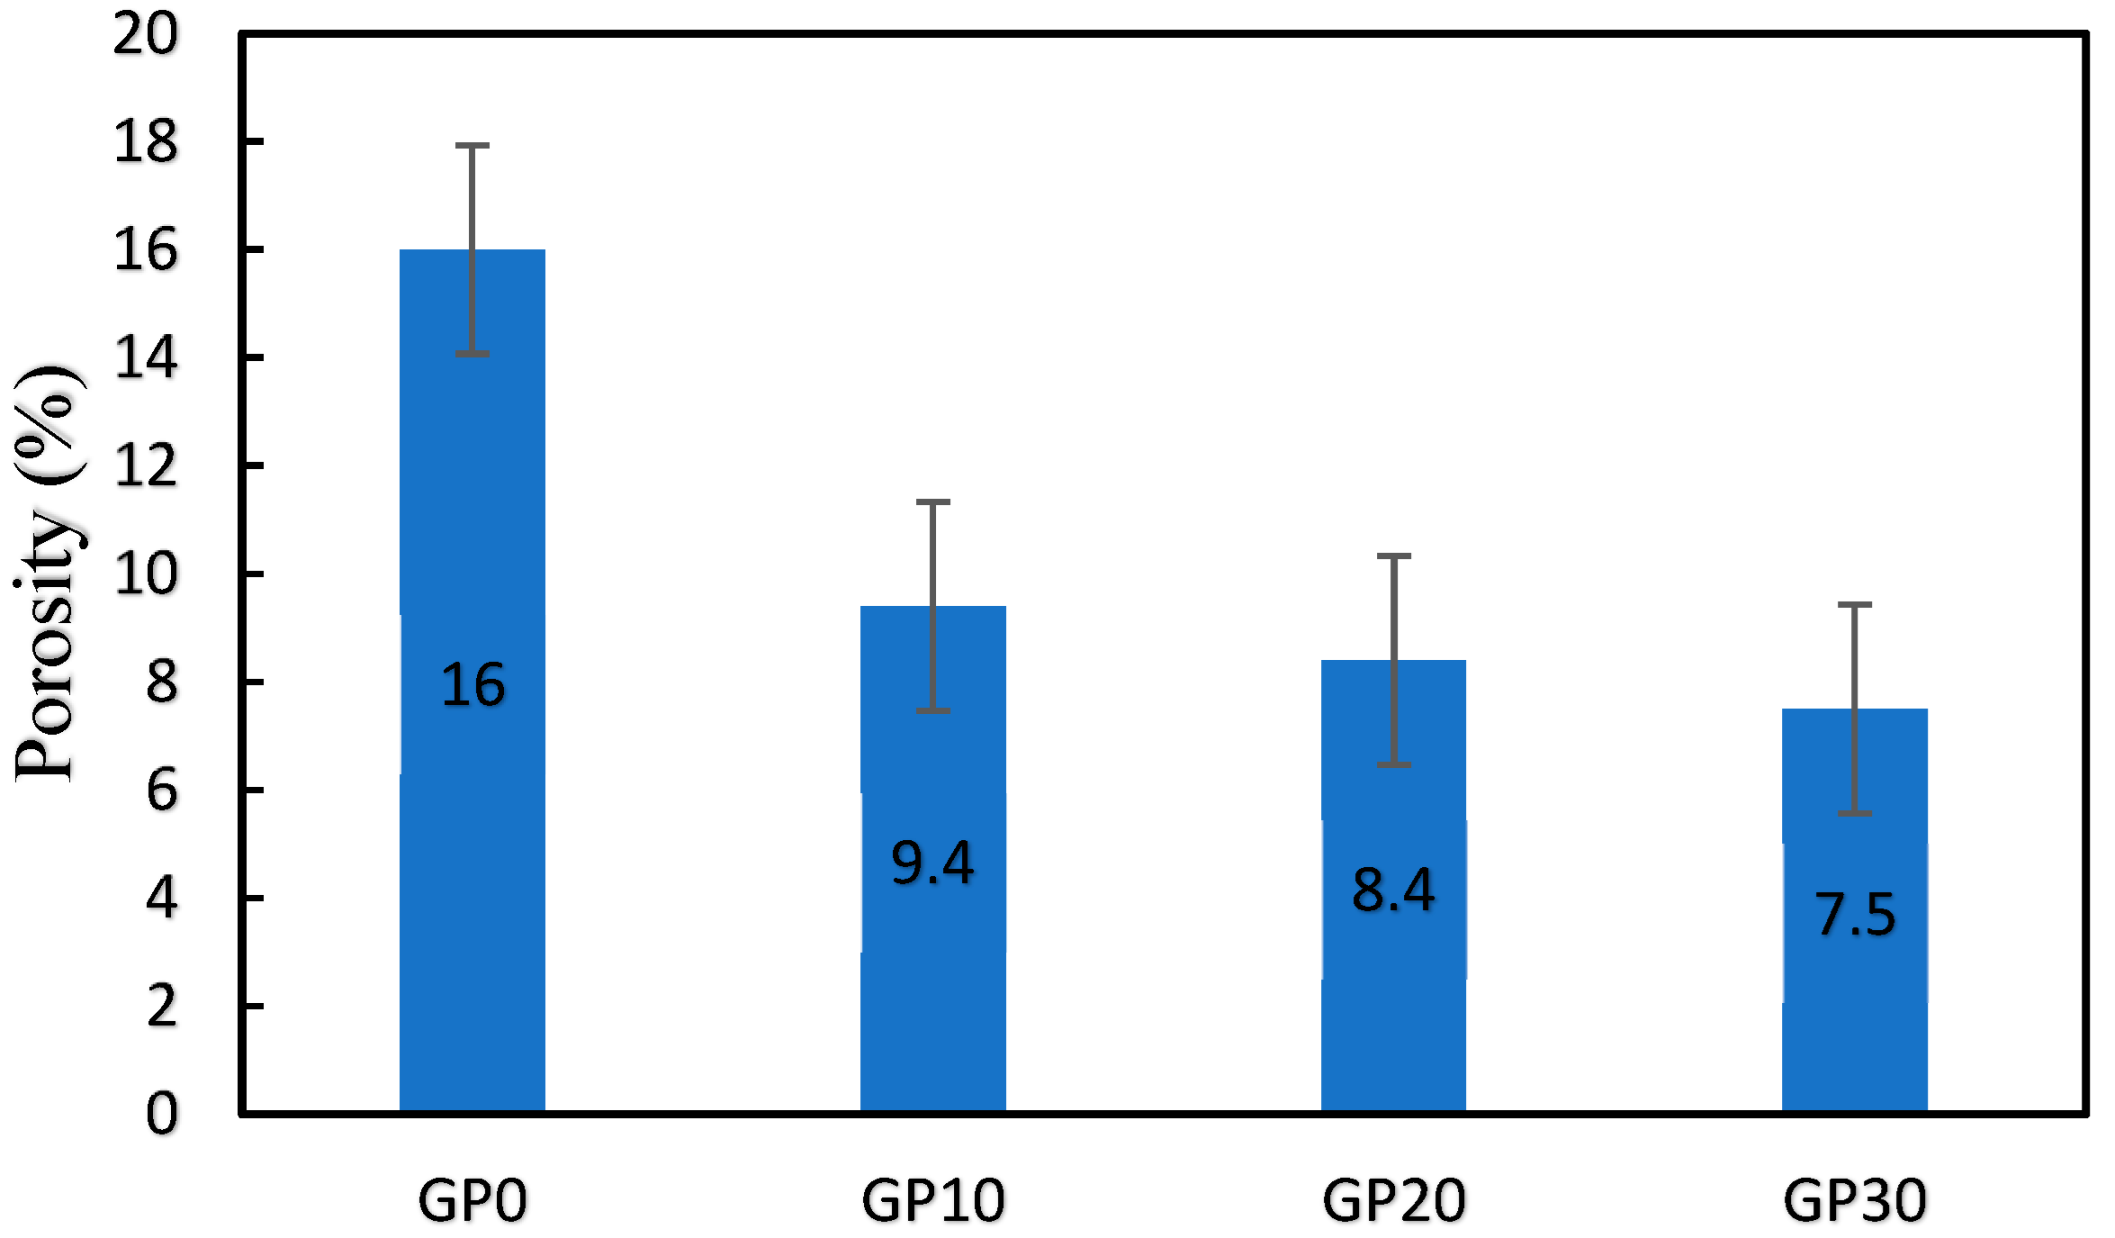
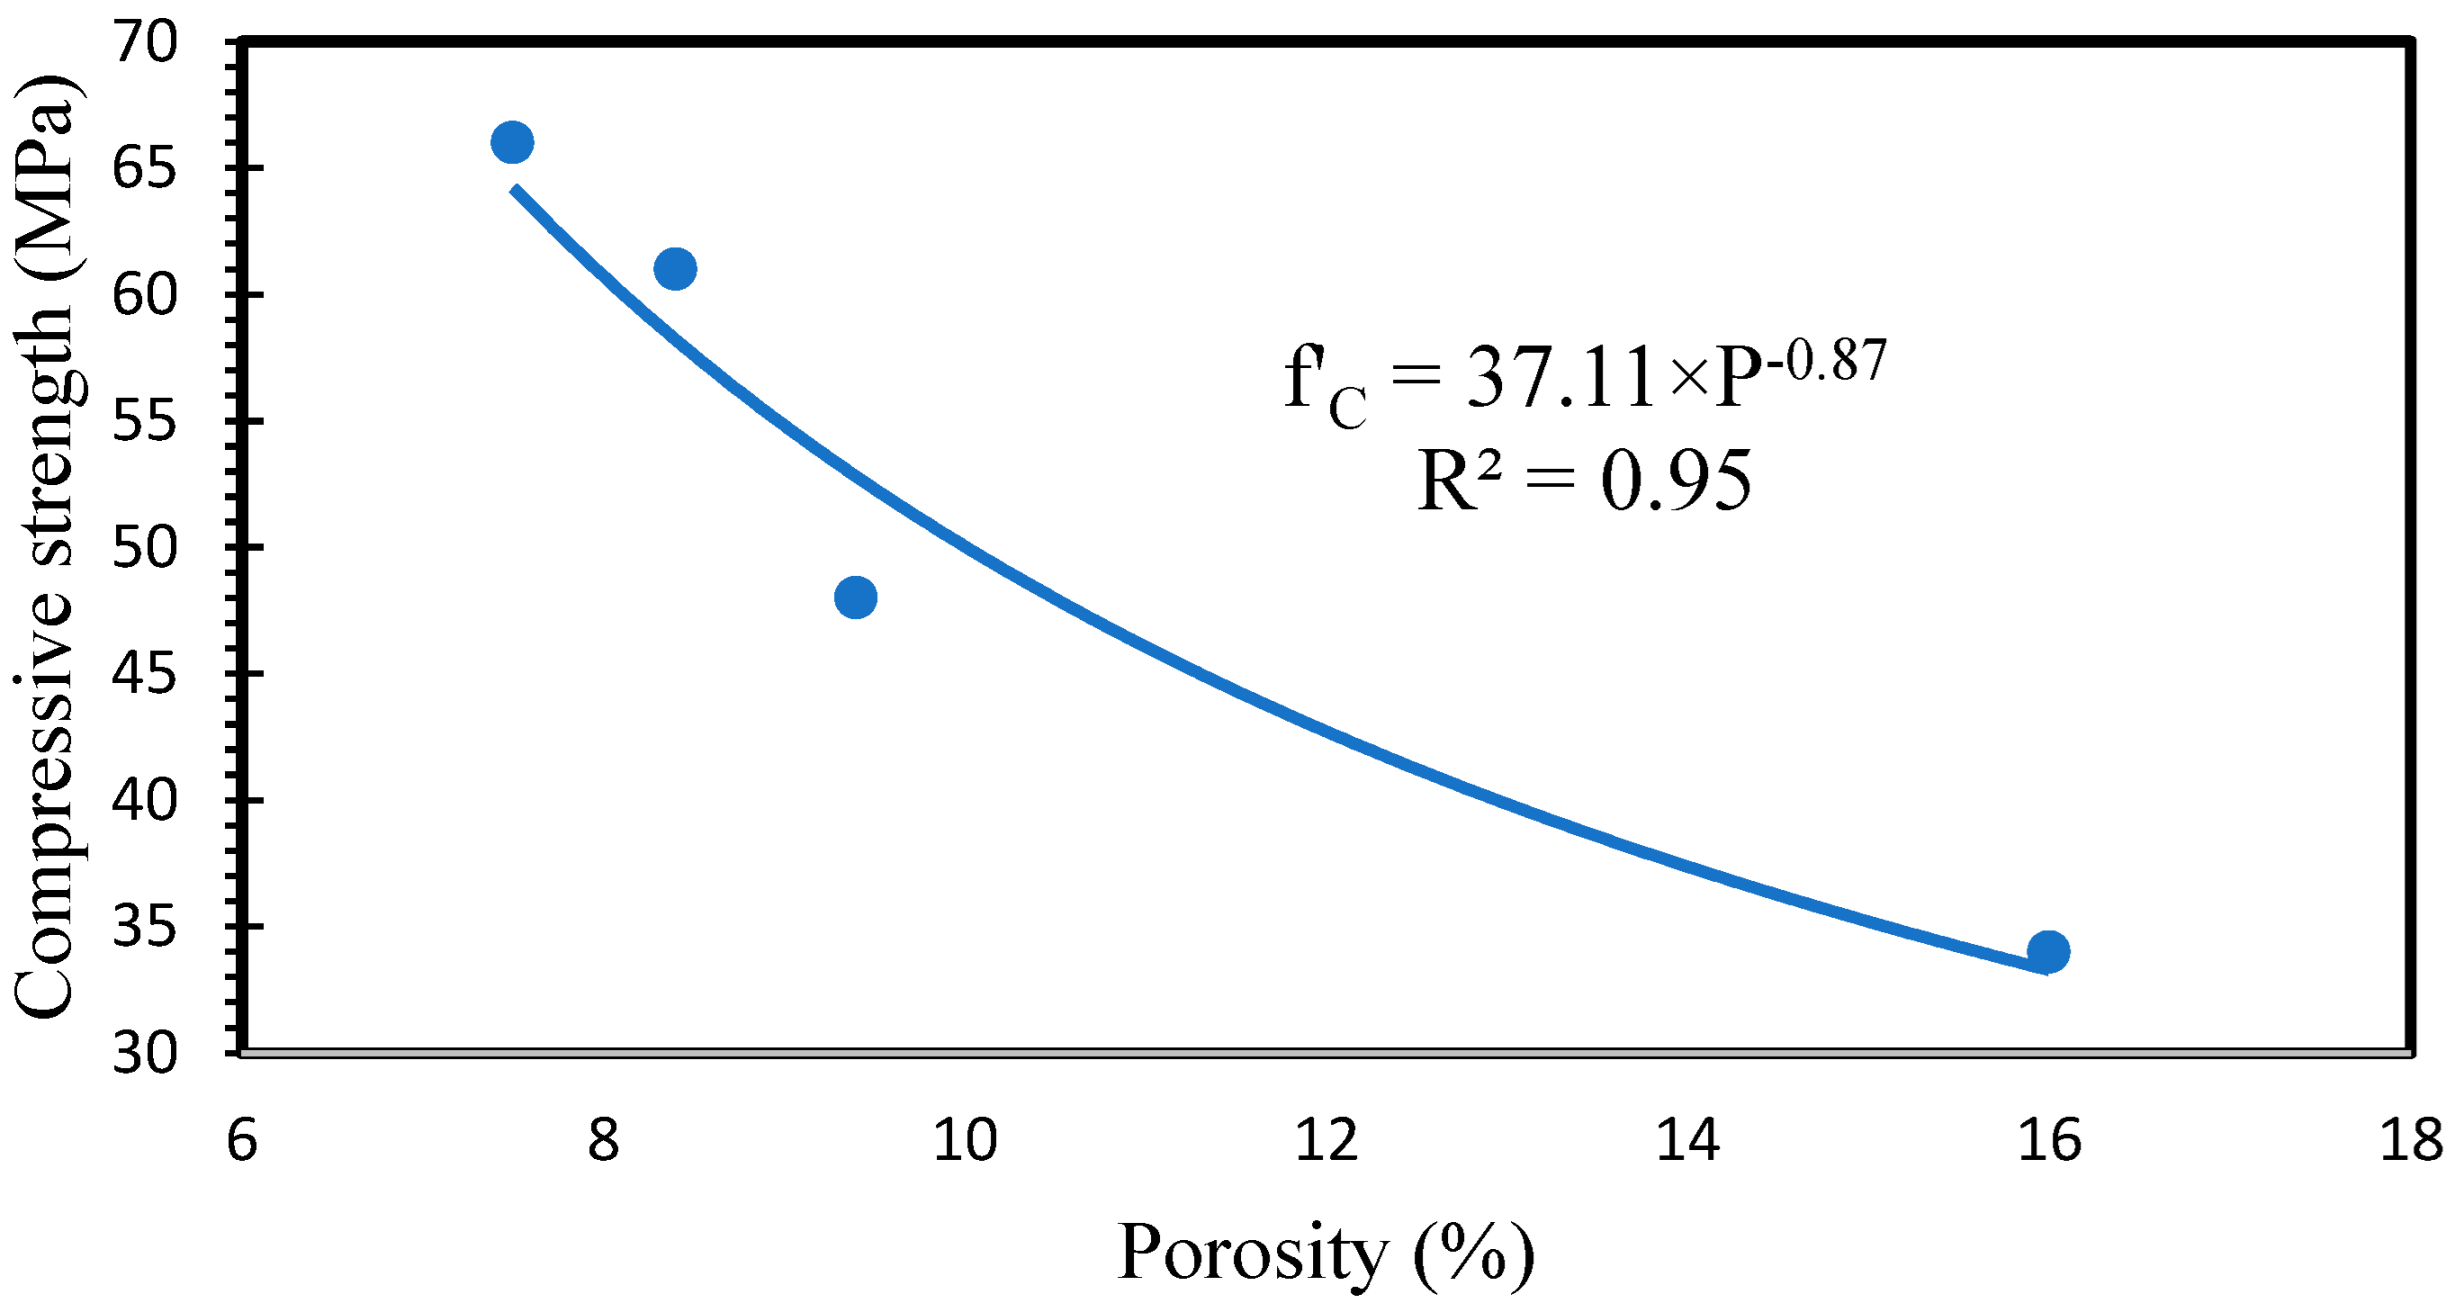
4.2.1. Porosity

The porosity of the specimens and the relationship between porosity and compressive strength are shown in Figure 8. In comparison with GP0, the porosity of GP10, GP20, and GP30 decreased by 20.87%, 29.71%, and 36.95%, respectively. The reduction is related to higher FA dissolution in the presence of SG, which led to higher reaction products, followed by a denser matrix.
It is generally accepted that porosity has a direct relationship with compressive strength. A high value of the correlation was obtained between porosity and compressive strength (R2 = 0.95). Figure 9 shows the relationship between compressive strength and porosity.

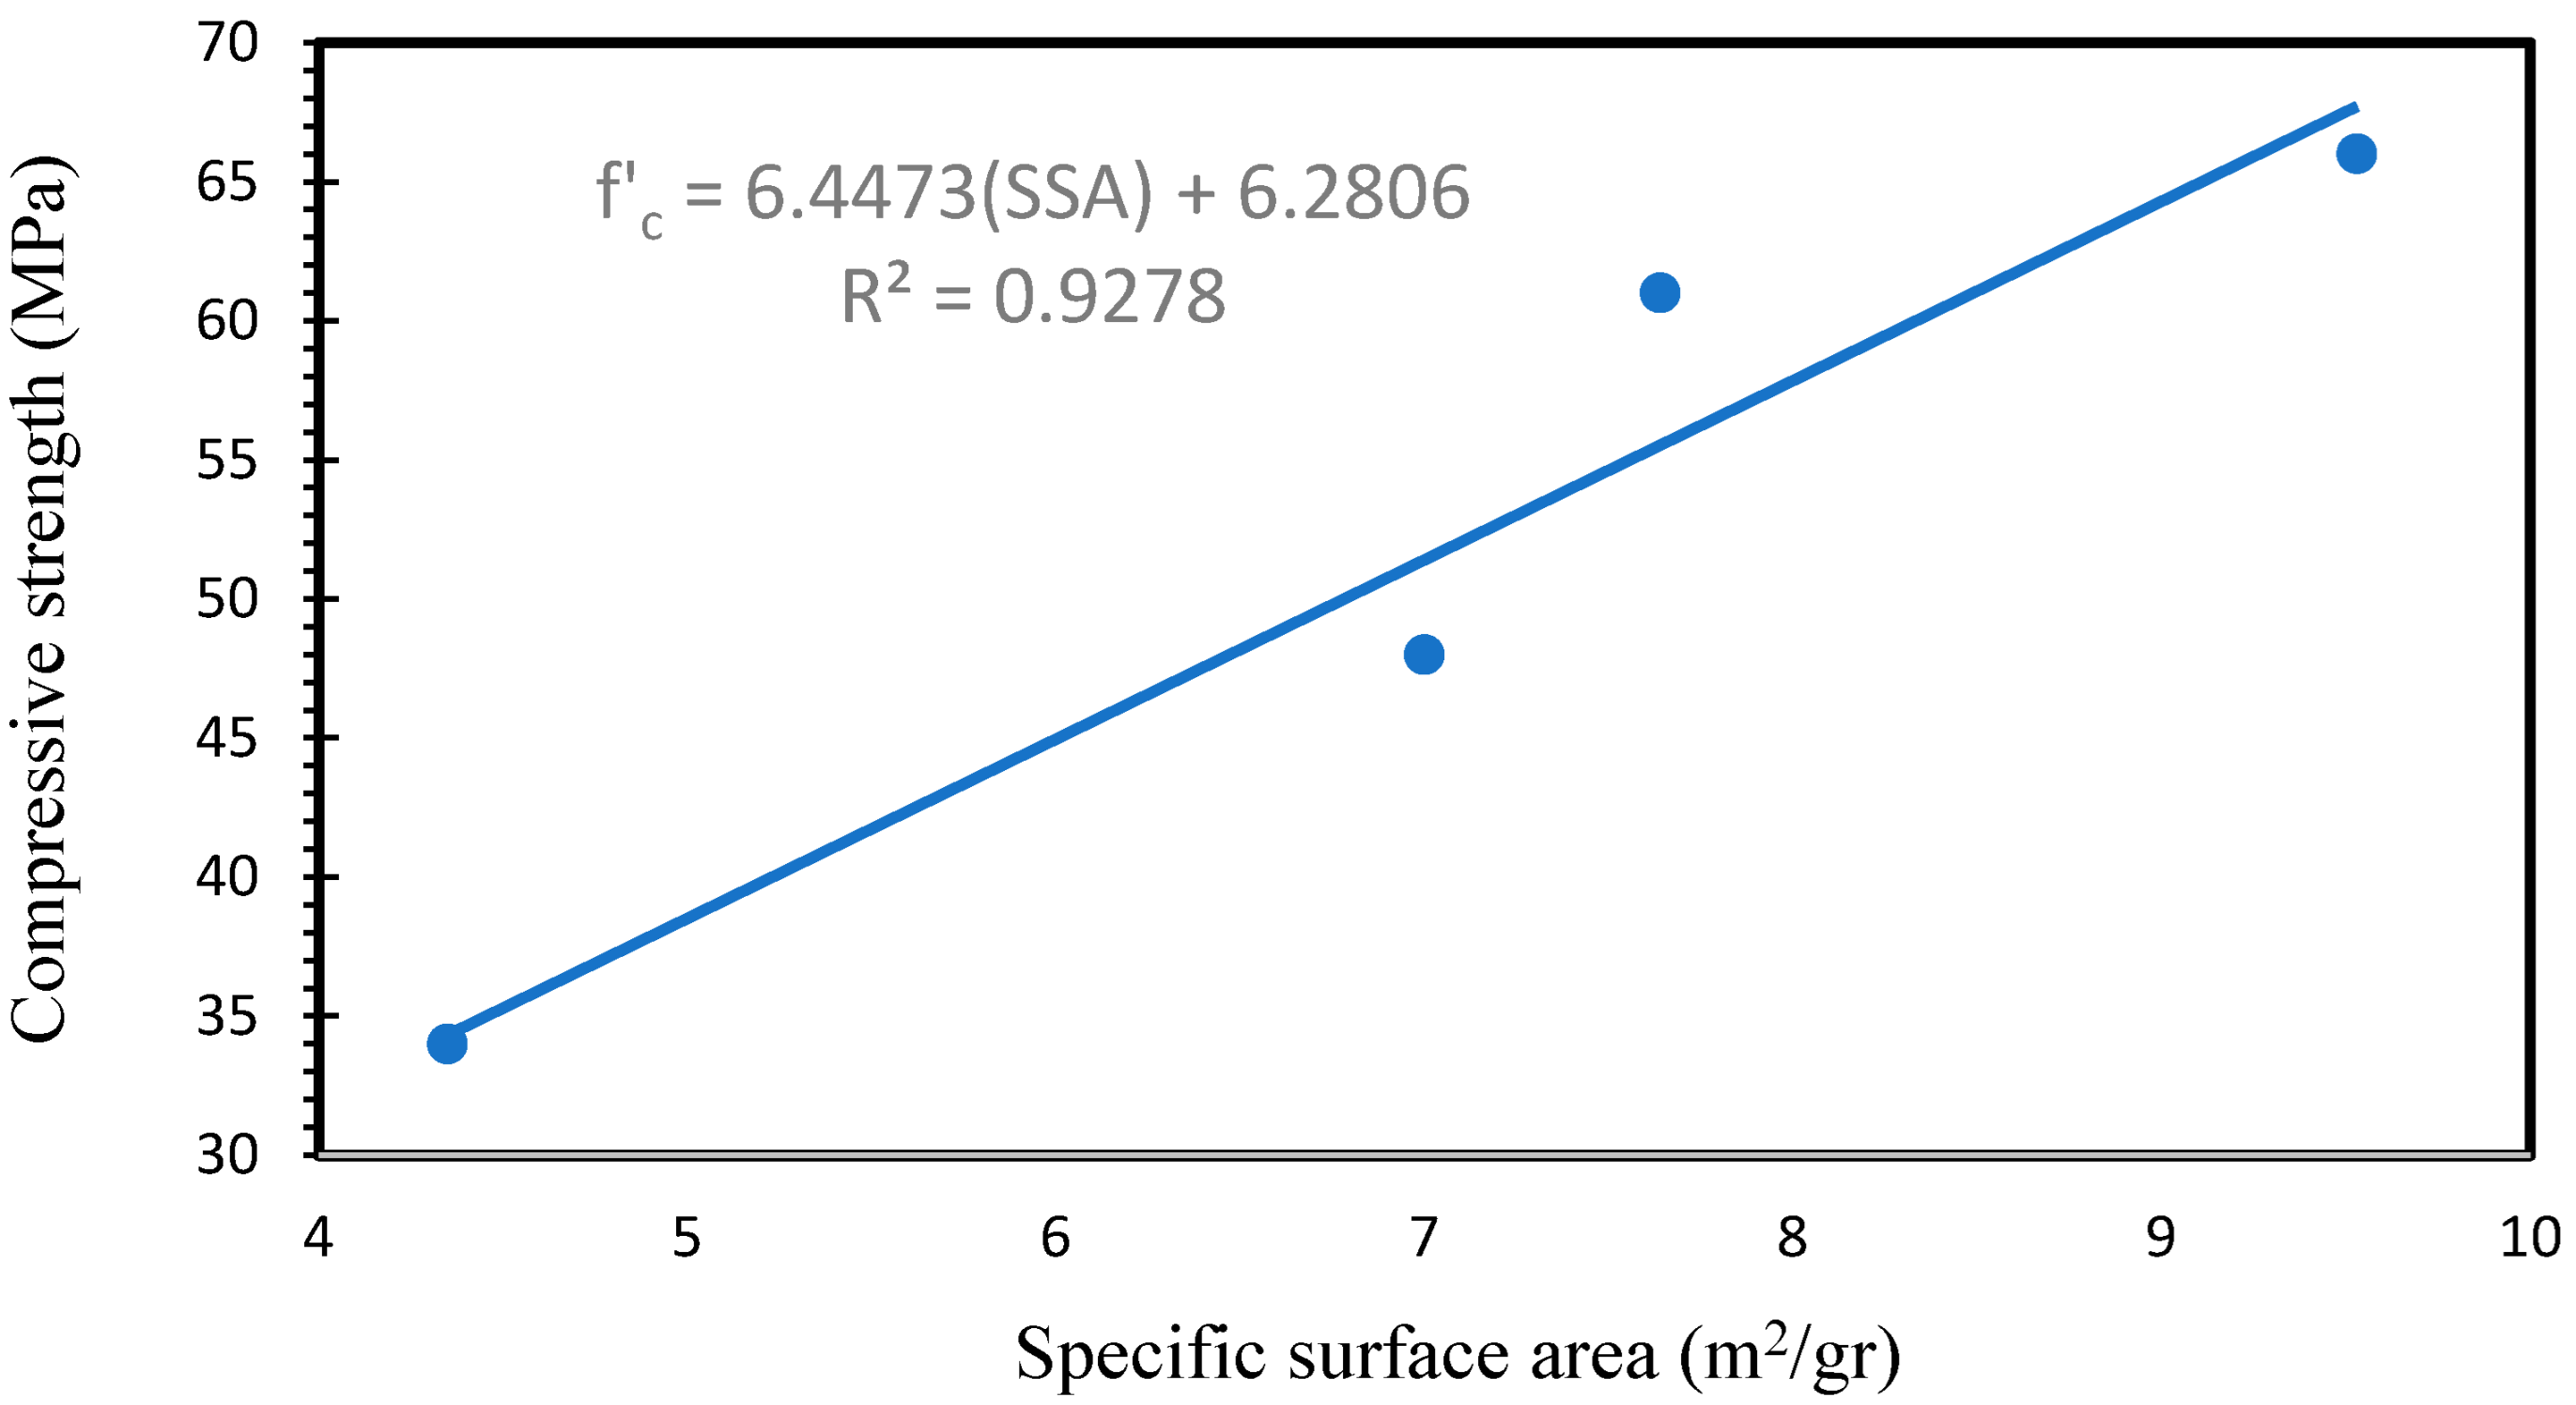
4.2.2. Pore Size Distribution and Surface Area

Figure 10 illustrates the pore size distribution of AAFS specimens. Barett, Joyner, and Halenda’s (BJH) method was used to determine the pore size distribution in the mesopore and small macropore range [69]. This method is based on Kelvin’s equation (see Equation (6)). It describes a relationship between the vapor pressure of a liquid and surface curvature. It can be concluded from this equation that the vapor pressure of the liquid on the convex surface is higher than that of the flat surface. Although the equation assumes the cylindrical pores, it can be useful in the porosimetry of the cement base materials.
ln ( P P 0 ) = 2 γ V M r R T cos θ
where P is the vapor pressure, P 0 is the saturated pressure of the liquid in the plane surface, γ is the liquid surface tension, V M is the molar volume of liquid, θ is the contact angle between the liquid and pore wall, R is the universal gas contact, and T is the thermodynamic temperature.
Aligizaki and Hanif et al. presented a pore size classification for cement-based materials [70]. Specifically, they defined pore sizes ranging from 2.5 to 10 nm as small capillary pores, those within the range of 10 to 50 nm as medium capillary pores, and pores sized between 50 to 10 μm as large capillary pores. In Table 3, the volume fractions of gel pores and capillary pores in the specimens are shown. As illustrated in Table 3 and Figure 10, the overall pore volume remained relatively stable with the inclusion of slag. However, a significant increase in gel pores was notably observed, which is indicative of enhanced pore network refinement. Specifically, the volume fraction of gel pores for GP10, GP20, and GP30 increased by 33.3%, 175%, and 216.7%, respectively, compared to GP0. These findings indicate a transformation of large N-A-S-H capillary pores into finer N-C-A-S-H gel pores. Furthermore, the most pronounced increase in the gel pore volume fraction was observed in GP20, aligning with the compressive strength results, where GP20 exhibited the most substantial strength enhancement.
The specific surface area was determined from the BET adsorption equation (see Equation (7)) suggested by Brunauer et al. [71]:
P V ( P 0 P ) = 1 V m C + C 1 V m C × P P 0
where V is the volume of gas adsorbed at standard temperature and pressure (STP) (273.15 k and atmospheric pressure), P0 is saturated pressure of N2 gas, P is the partial vapor of N2 gas in equilibrium with the surface at 77.4 k, Vm is the volume of N2 adsorbed at STP to make a monolayer on the sample, and C is the dimensionless constant that is related to the enthalpy of adsorption of the N2 gas on the specimen.
The value of the V was measured at four relative pressures (P/P0), approximately ranging from 0.05 to 0.3. The BET equation can be evaluated and plotted by linear regression with P V ( P 0 P ) on the y-axis and P P 0 on the x-axis and a y-intercept of 1 V m C . From the plotted line, the slope was obtained and V m calculated for monolayer adsorption. Finally, the specific surface is calculated by Equation (8) as follows:
S B E T = V m N A s m V
where NA is Avogadro’s constant (6.022 ×   10 231 /mol), Sm is the effective cross-sectional area of the N2 molecule (0.162 mm2), and V is the molar volume of the N2 molecule.
Odler [72] demonstrated a linear relationship between the volume of the hydration products and surface area values. He explained that, in the early ages of hydration, hydration products are more porous. As the hydration proceeds, and the free water in the pore solution is consumed, the pore volume becomes finer, and the pore solution becomes more interwoven. As a result of the hydration progress, more regions are developed in the microstructure, narrowing openings.
Figure 11 shows the specific surface area of AAFS specimens. The surface area of GP10, GP20, and GP30 increased by 60.92, 75.22, and 118.58%, respectively, in comparison with the GP0. Based on the SEM observations and pore structure analysis, adding slag to the GP0 led to more geopolymeric products, which have finer pores, connecting geopolymeric products [68]. Consequently, more regions developed. In the case of the AAFS materials, increasing the SG content in the AAF materials significantly increases the surface area of the AAFS materials. Figure 12 illustrates the relationship between the surface area and the compressive strength of the AAFS specimens. A high correlation was observed between surface area and compressive strength.

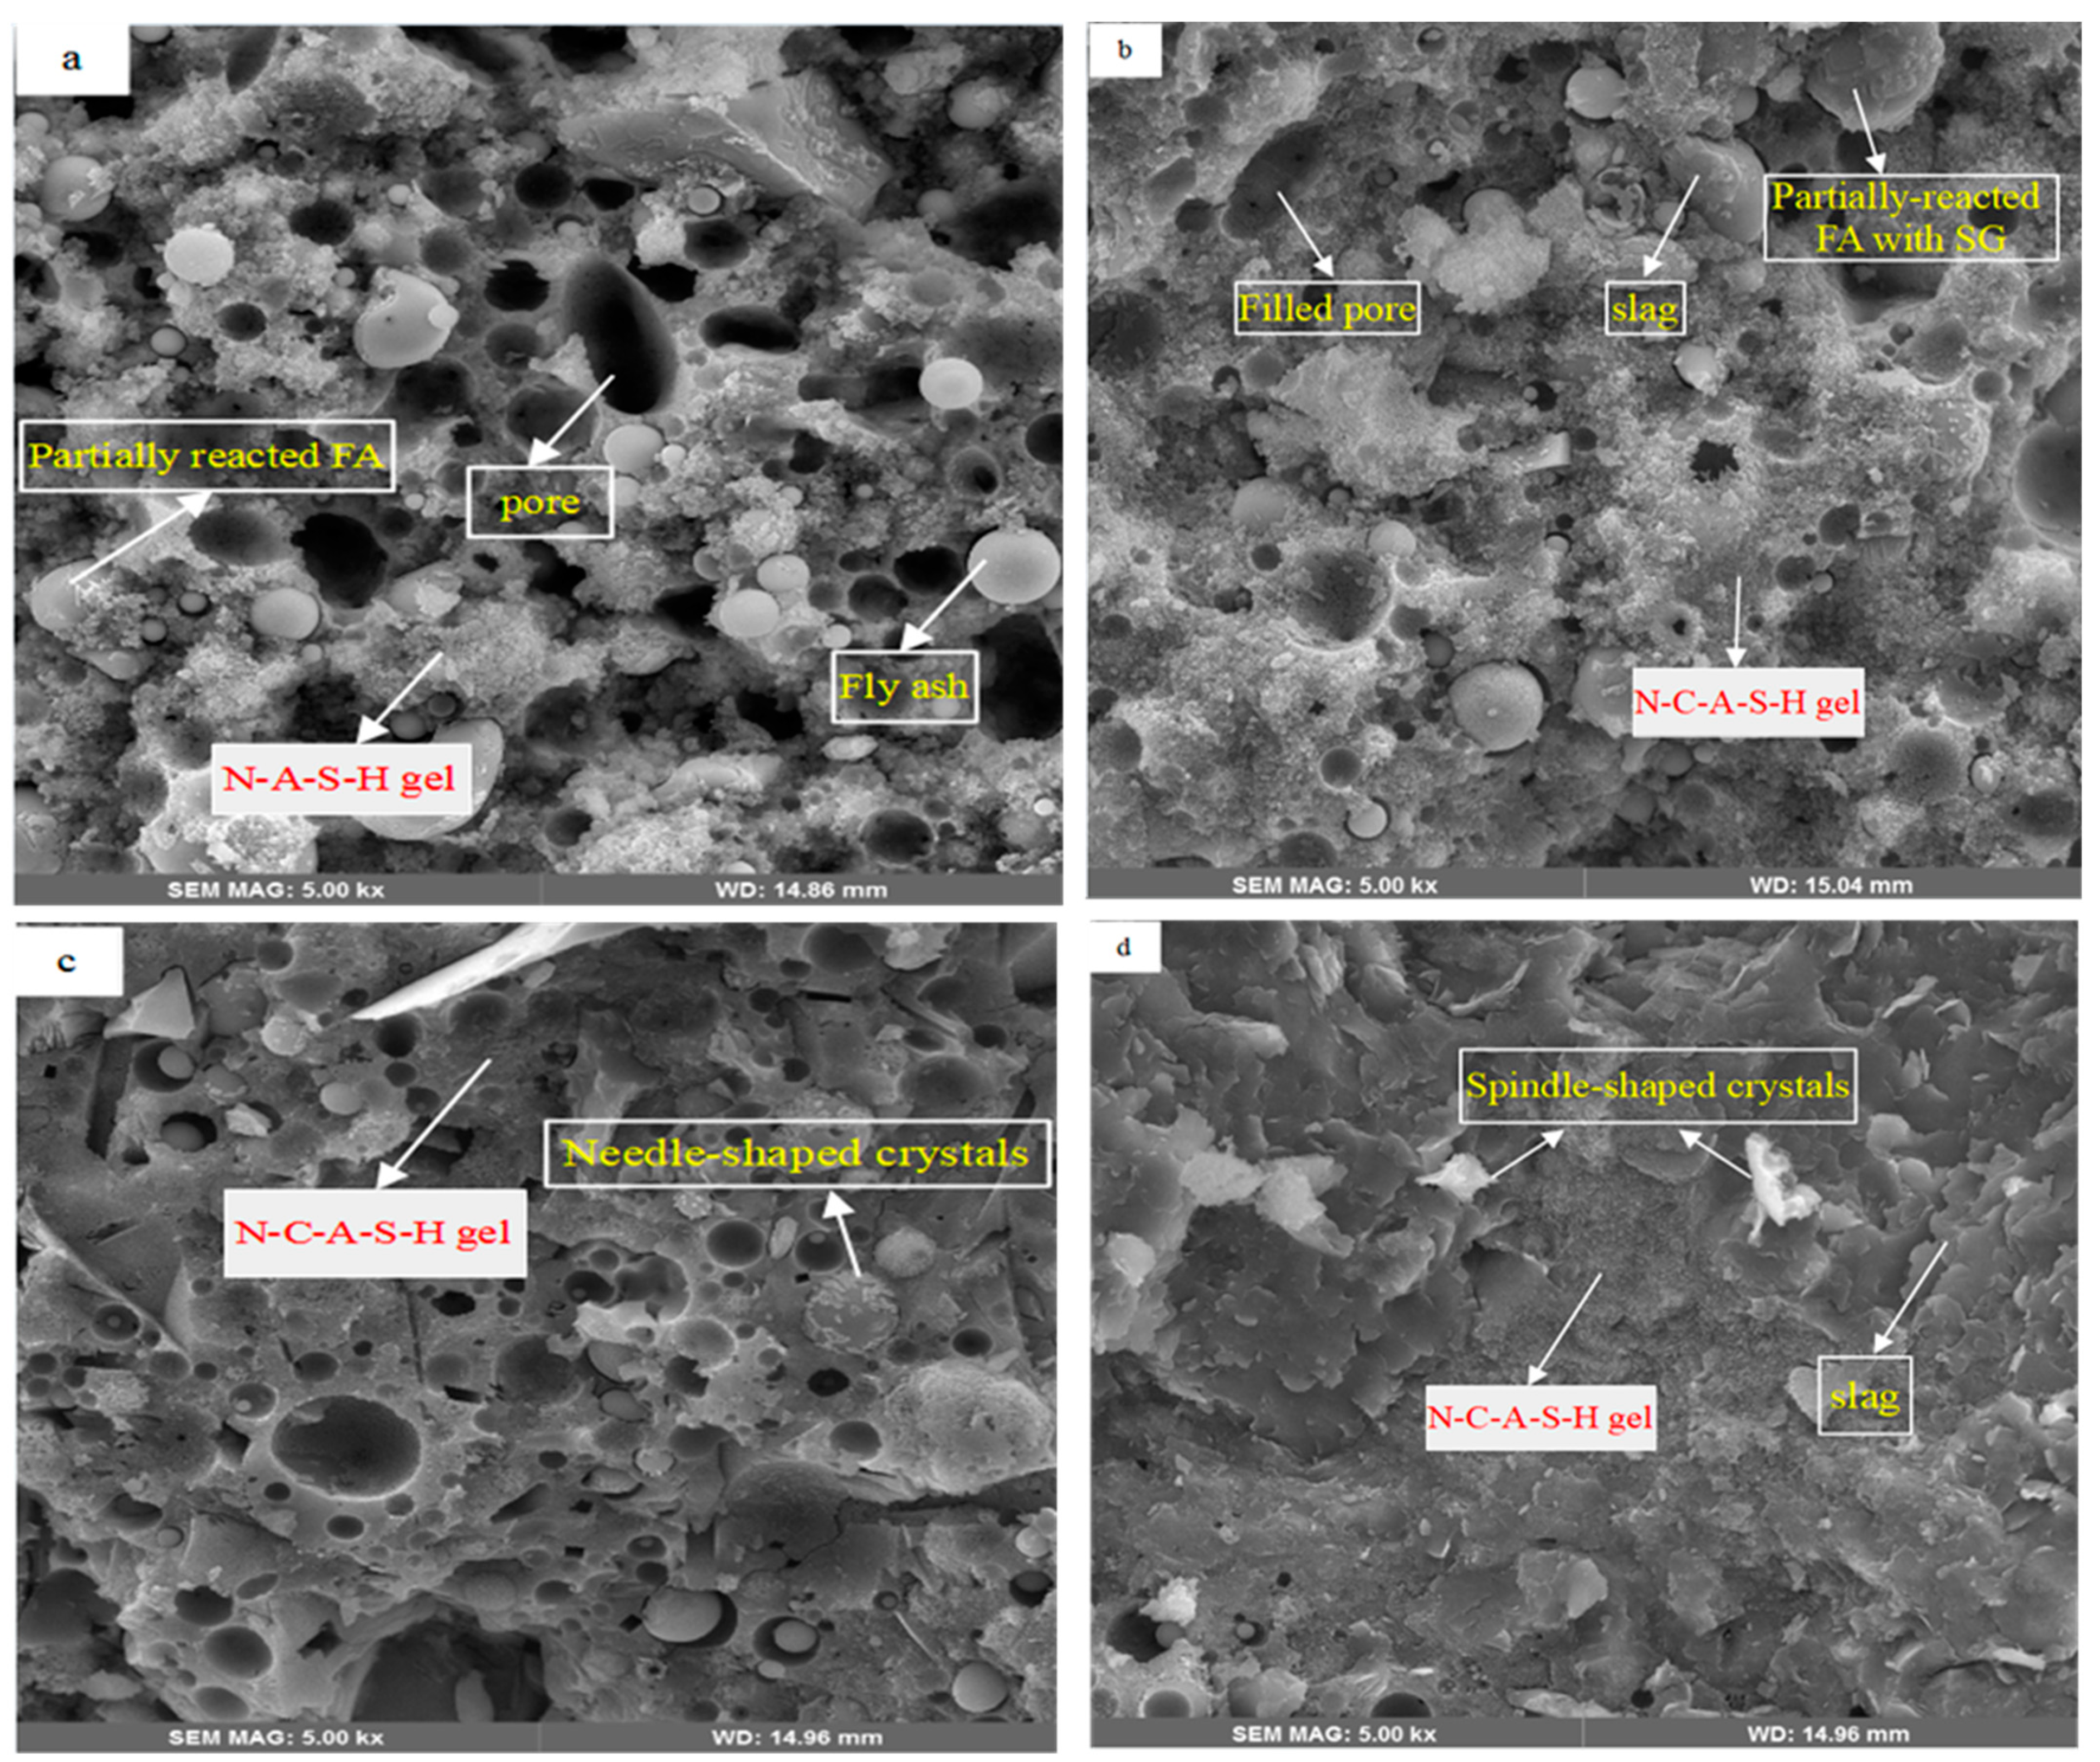
4.2.3. Microstructural Analysis (SEM/EDX)

Figure 13 indicates the SEM images of AAFS specimens. The most conspicuous observation was filling the matrix voids by gel progress and gel densification by Ca inclusion. The specimens gel locations were selected from the high-reactive areas and mostly observed as amorphous phases.
Figure 13a represents a high proportion of un-reacted FA spheres and voids in the matrix. These un-reacted FA can cause low mechanical properties and high transport through the matrix. From Figure 13b–d, irregular-shaped SG components are obvious. When comparing Figure 13a–d, it can be deduced that the un-reacted FA particles were either completely resolved or partially reacted owing to the SG incorporation associated with the high-alkalinity atmosphere, which led to high-geopolymerization products. Also, some filled pores in the GP10 confirmed the SG densification effect in the low contents of SG.
In Figure 13c, many needle-shaped crystals are displayed on the surface of FA spheres, as they have covered FA particles. These needle-shaped crystals have also been reported in previous studies claiming that due to their atomic characteristics, they are types of crystalline aluminosilicate products [73,74]. As shown in, Figure 13d, FA particles were rarely detected, which indicates that they mostly dissolved in the gel. Additionally, some spindle-shaped crystals were found in the GP30, as shown in the previous research [73]. This suggested that these crystals are likely calcium carbonates (CaCO3) and observed in high contents of the SG.
Table 4 represents the mean ratio of the Ca/Si in the 10 points near the specific points shown in Figure 13a–d. The enhancement in the Ca/Si ratio by increasing the SG content confirmed that densification of the geopolymeric gel (N-A-S-H) was due to the Ca inclusion in the atomic structure of the gel.

4.3. Transport Properties

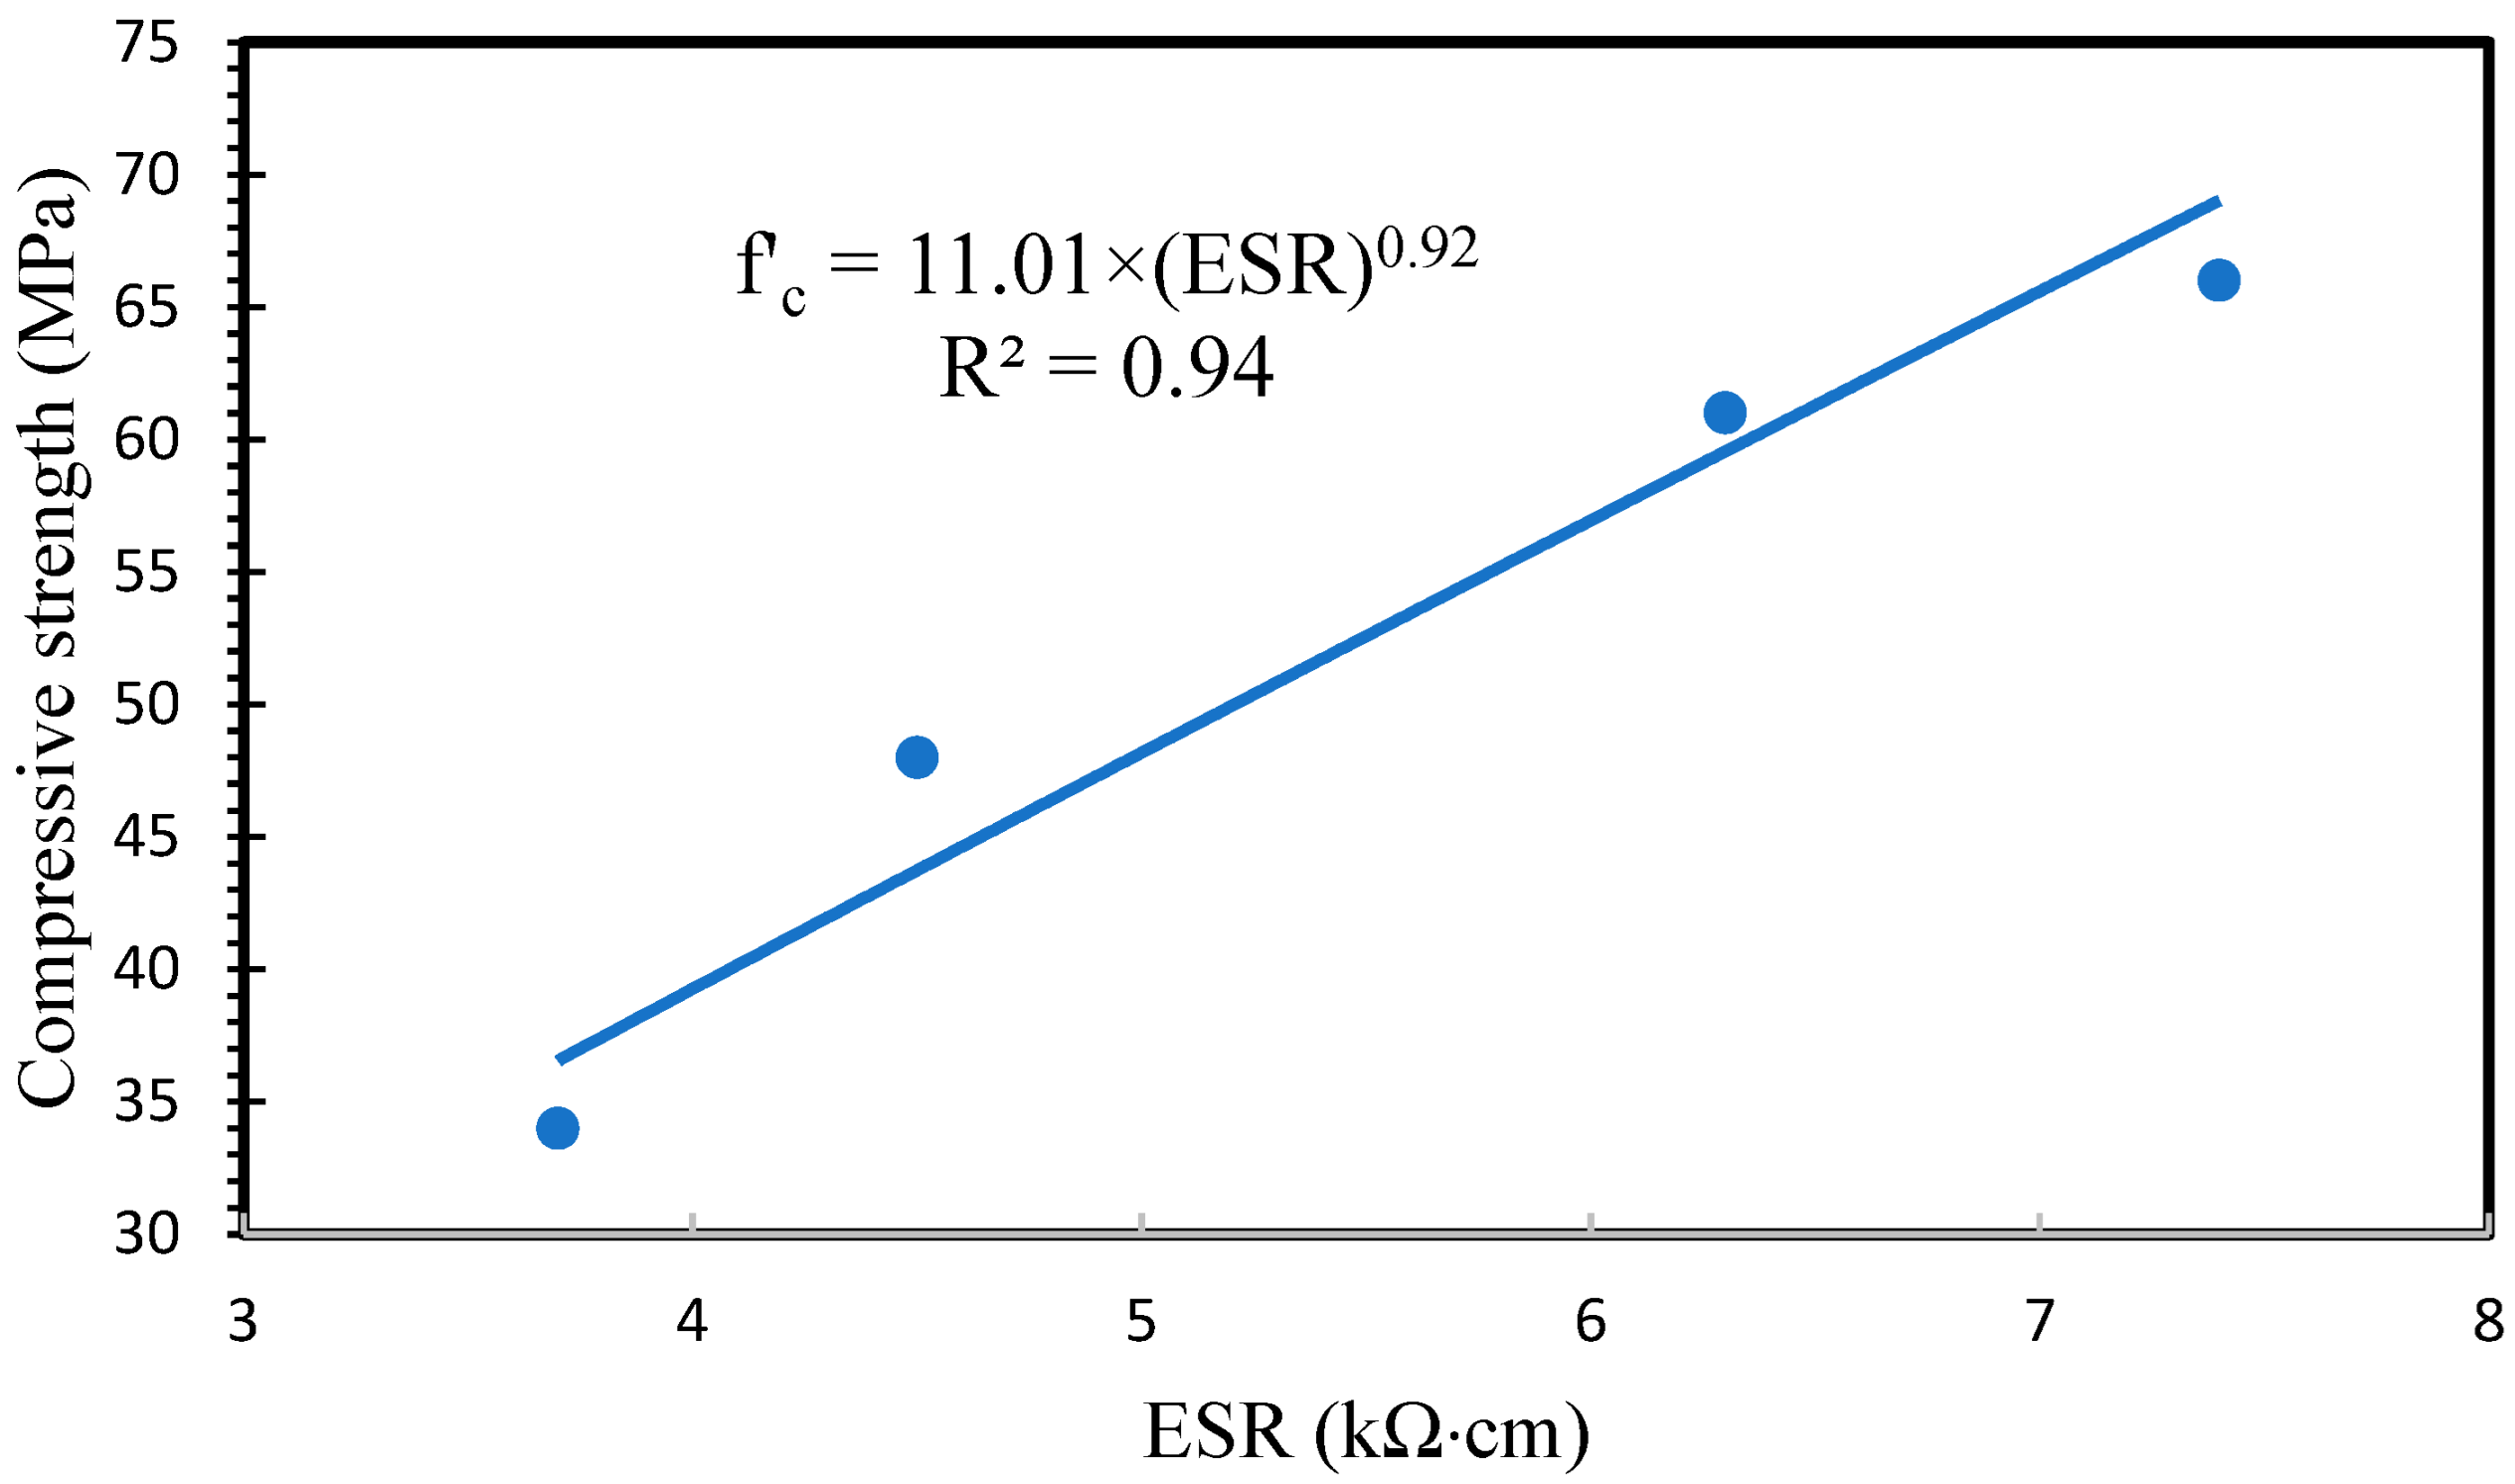
4.3.1. Electrical Surface Resistivity

Figure 14 represents the electrical surface resistivity (ESR) of AAFS specimens. The ESR values ranged between 3.7 and 7.4 kΩ·cm. The results indicated that ESR values were enhanced by increasing the replacement level of the SG. The electrical resistance of GP10, GP20, and GP30 increased by 21.62, 70.27, and 100%, respectively, compared to the GP0. High ESR values indicate that the pore network has low connectivity. In other words, ESR is a beneficial parameter for evaluating material tortuosity.
Regarding the effect of Ca inclusion in the structure of the N-A-S-H gel, the pore structure and tortuosity of the AAFS specimens are shown schematically in Figure 15b. Comparing Figure 15a with Figure 15b exhibits the pore volume refinement and increase in the tortuosity by slag addition.
Additionally, ESR has emerged as a valuable method for assessing chloride ion ingress and rebar corrosion in cement-based materials. A noteworthy reference point is the ESR value of 12 kΩ·cm, which has been established as the corrosion threshold for internal steel reinforcing bars. However, the observed low ESR values in AAFS specimens may be attributed to the presence of ions such as sodium in the pore solution [19]. Therefore, it is recommended to conduct further investigations into ESR and rebar corrosion in alkali-activated materials. Furthermore, Lee et al. demonstrated that the addition of slag resulted in a substantial reduction in chloride ion penetration depth, attributed to the denser and more convoluted matrix of AAFS compared to AAF [28]. The ESR results were plotted versus compressive strengths, and the correlation between them was calculated. As shown in Figure 16, a strong correlation was observed between ESR and compressive strength.

4.3.2. Water Vapor Permeability

Water vapor permeability (WVP) values of the specimens are given in Figure 17. The WVP of GP10, GP20, and GP30 decreased by 20.79, 42.97, and 50%, respectively, compared to the GP0. The WVP values are good qualitative concurrence with compressive strength, water permeability, surface area, and porosity. The decrease in WVP with increasing SG is related to the refinement of pore size distribution to a denser and more tortuous matrix. As can be seen in the section of BET, electrical resistivity, and porosity, higher amounts of Ca in the N-A-S-H gel lead to a finer pore structure and more tortuous structure that does not permit higher water vapor transport through the gel.

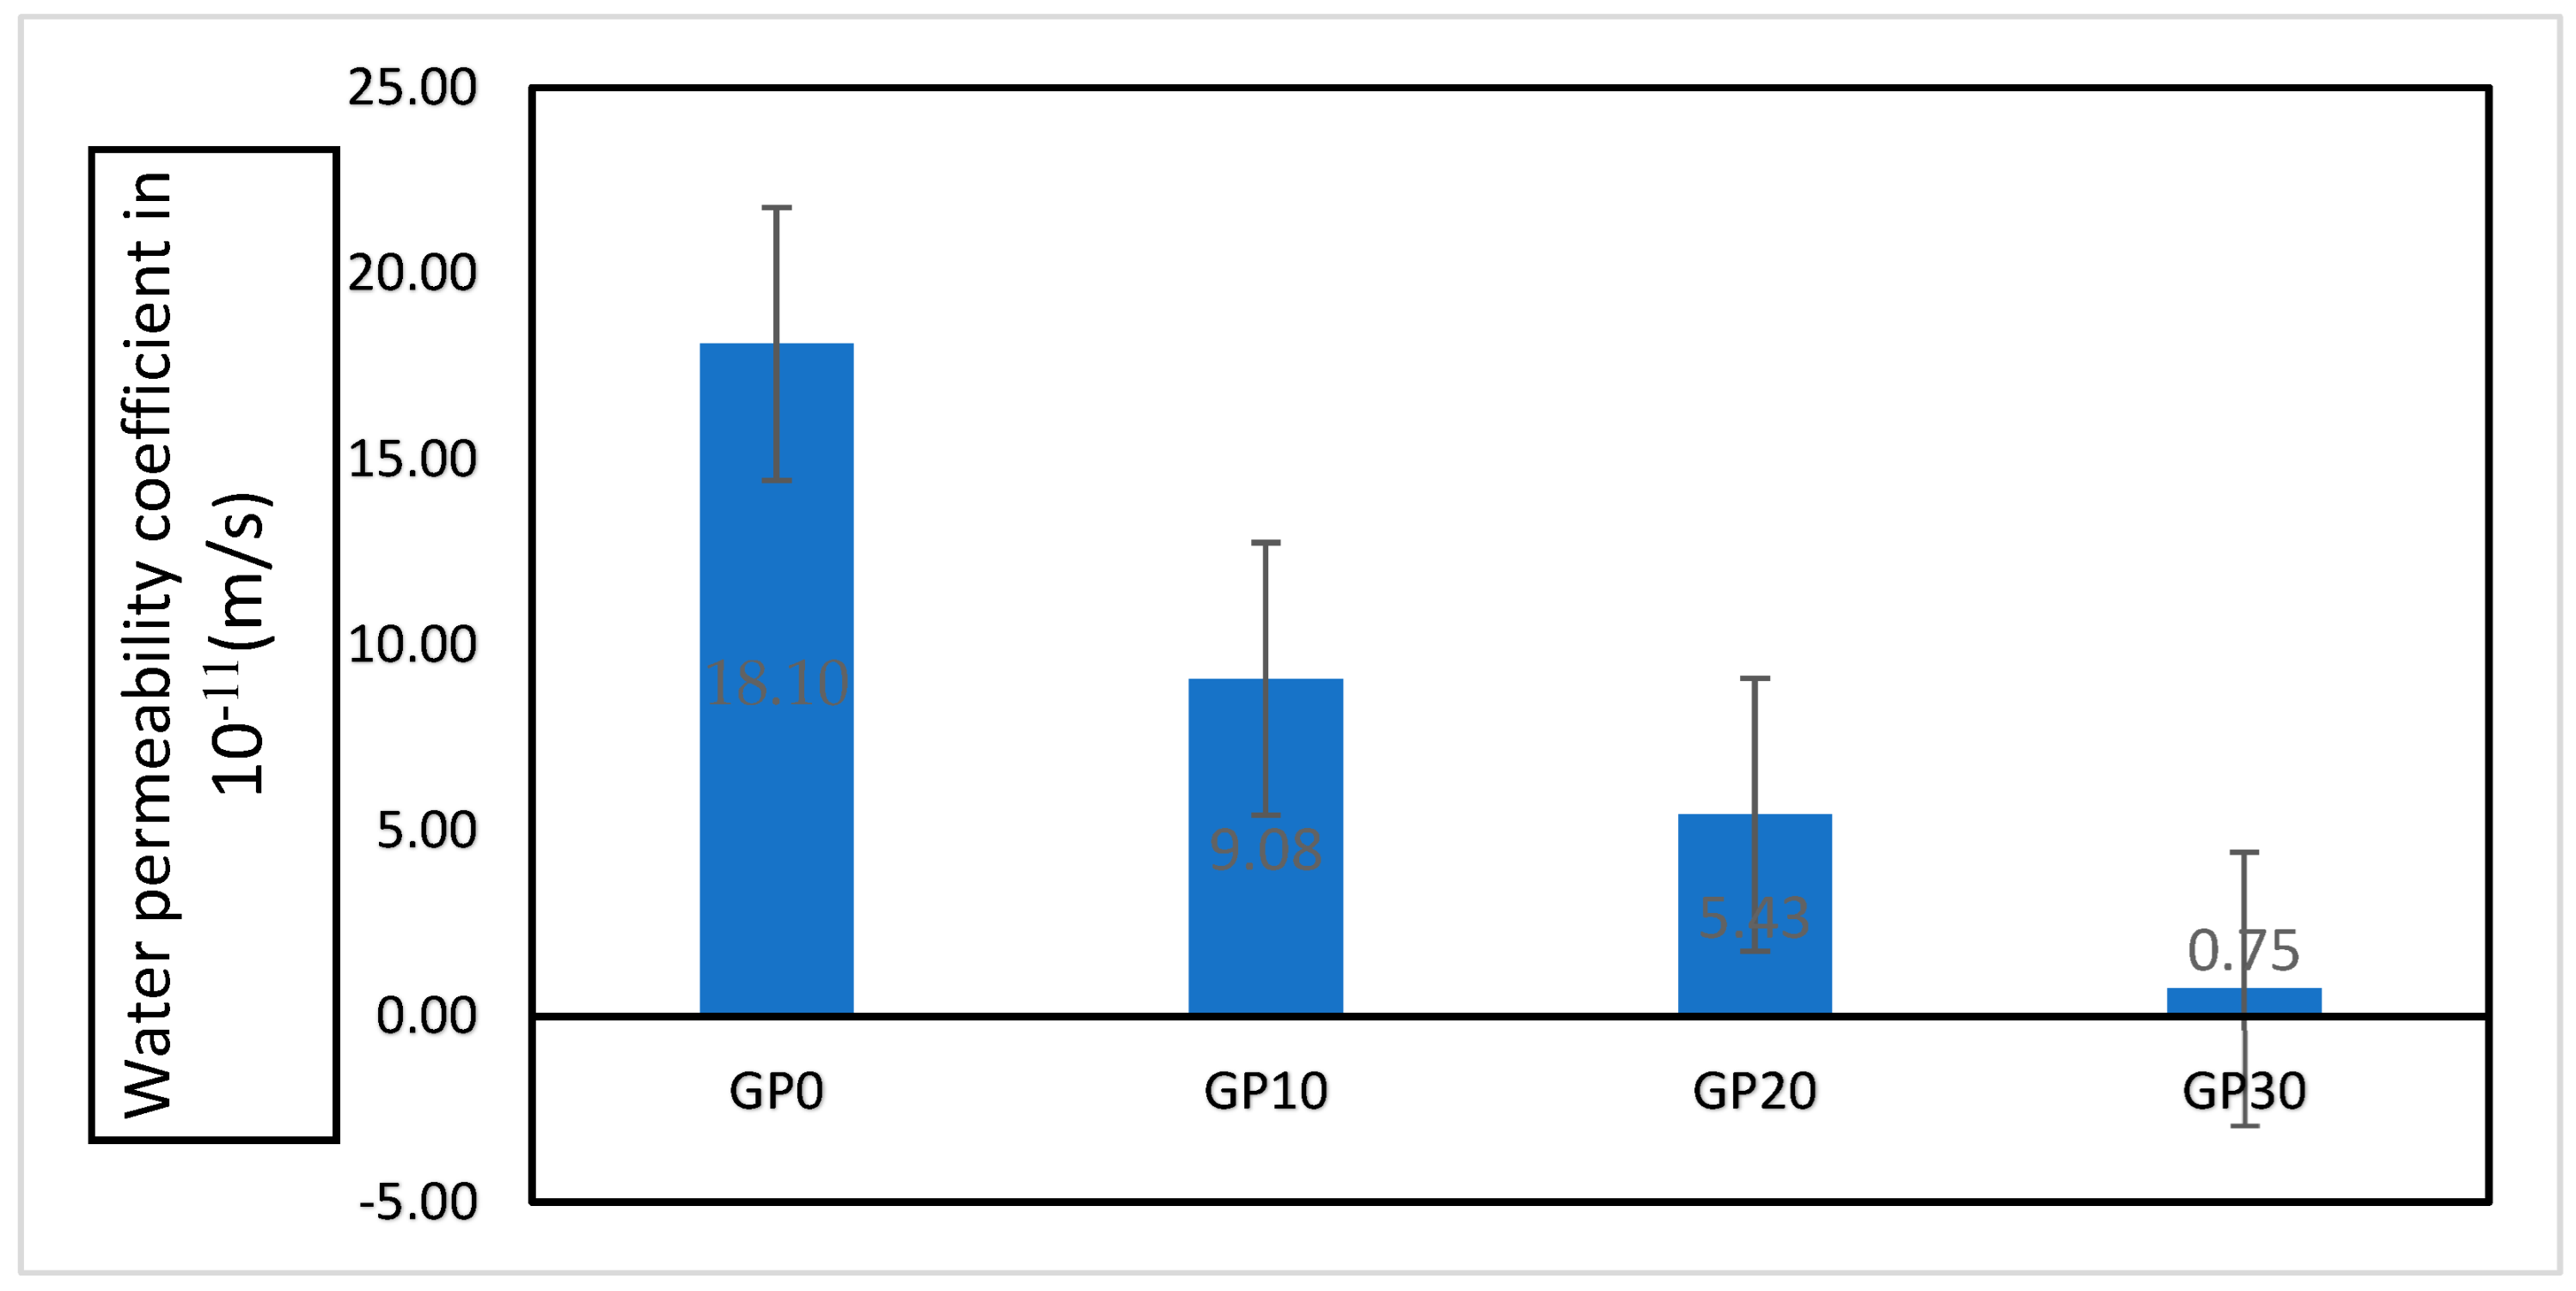
4.3.3. Water Permeability Coefficient

Figure 18 illustrates the water permeability coefficient (WPC) values of the AAFS specimens. Water permeability tests displayed that SG has a considerable influence on the permeability of AAF. The WPC of GP10, GP20, and GP30 decreased by 49.83, 69.89, and 95.88%, respectively, as compared to the GP0. Figure 19 shows the correlation between compressive strength/porosity and WPC. A strong linear correlation was observed between compressive strength–WPC and porosity–WPC. These results can be ascribed to the decrease in porosity and pore connectivity of the AAFS by increasing the SG content.
Rattanachu et al. [75] studied the relationship between compressive strength and permeability of the conventional concretes, and the results are shown in Figure 20. Comparing our results with conventional concretes revealed that the WPC of conventional concretes was quite higher in the low- and medium-strength concretes than in the AAFS concrete. However, in the high strengths (over 55 MPa), the WPC of conventional concrete tended to a constant value; however, in AAFS, it decreased sharply.
As a comparison, the WPC of AAFS is 170.2 and 102.5 times higher than that of conventional concretes at the compressive strength of 34 MPa and 66 MPa, respectively. The WPC of conventional concretes at the compressive strength of 34 MPa is 14.6 times higher than that of 66 MPa. Meanwhile, the WPC of AAFS concretes is 24.3 times higher. These findings confirmed that the N-A-S-H gel is more porous than CSH, and utilization of hybrid N-C-A-S-H gel can be an effective way to modify N-A-S-H gel and, consequently, reduce the water permeability.

5. Conclusions

Based on the experimental results, the following conclusions can be expressed:
  • The compressive strength and UPV values of the AAFS enhanced with the increase in the slag content. The highest increase in the compressive strength appeared in 20% replacement of slag;
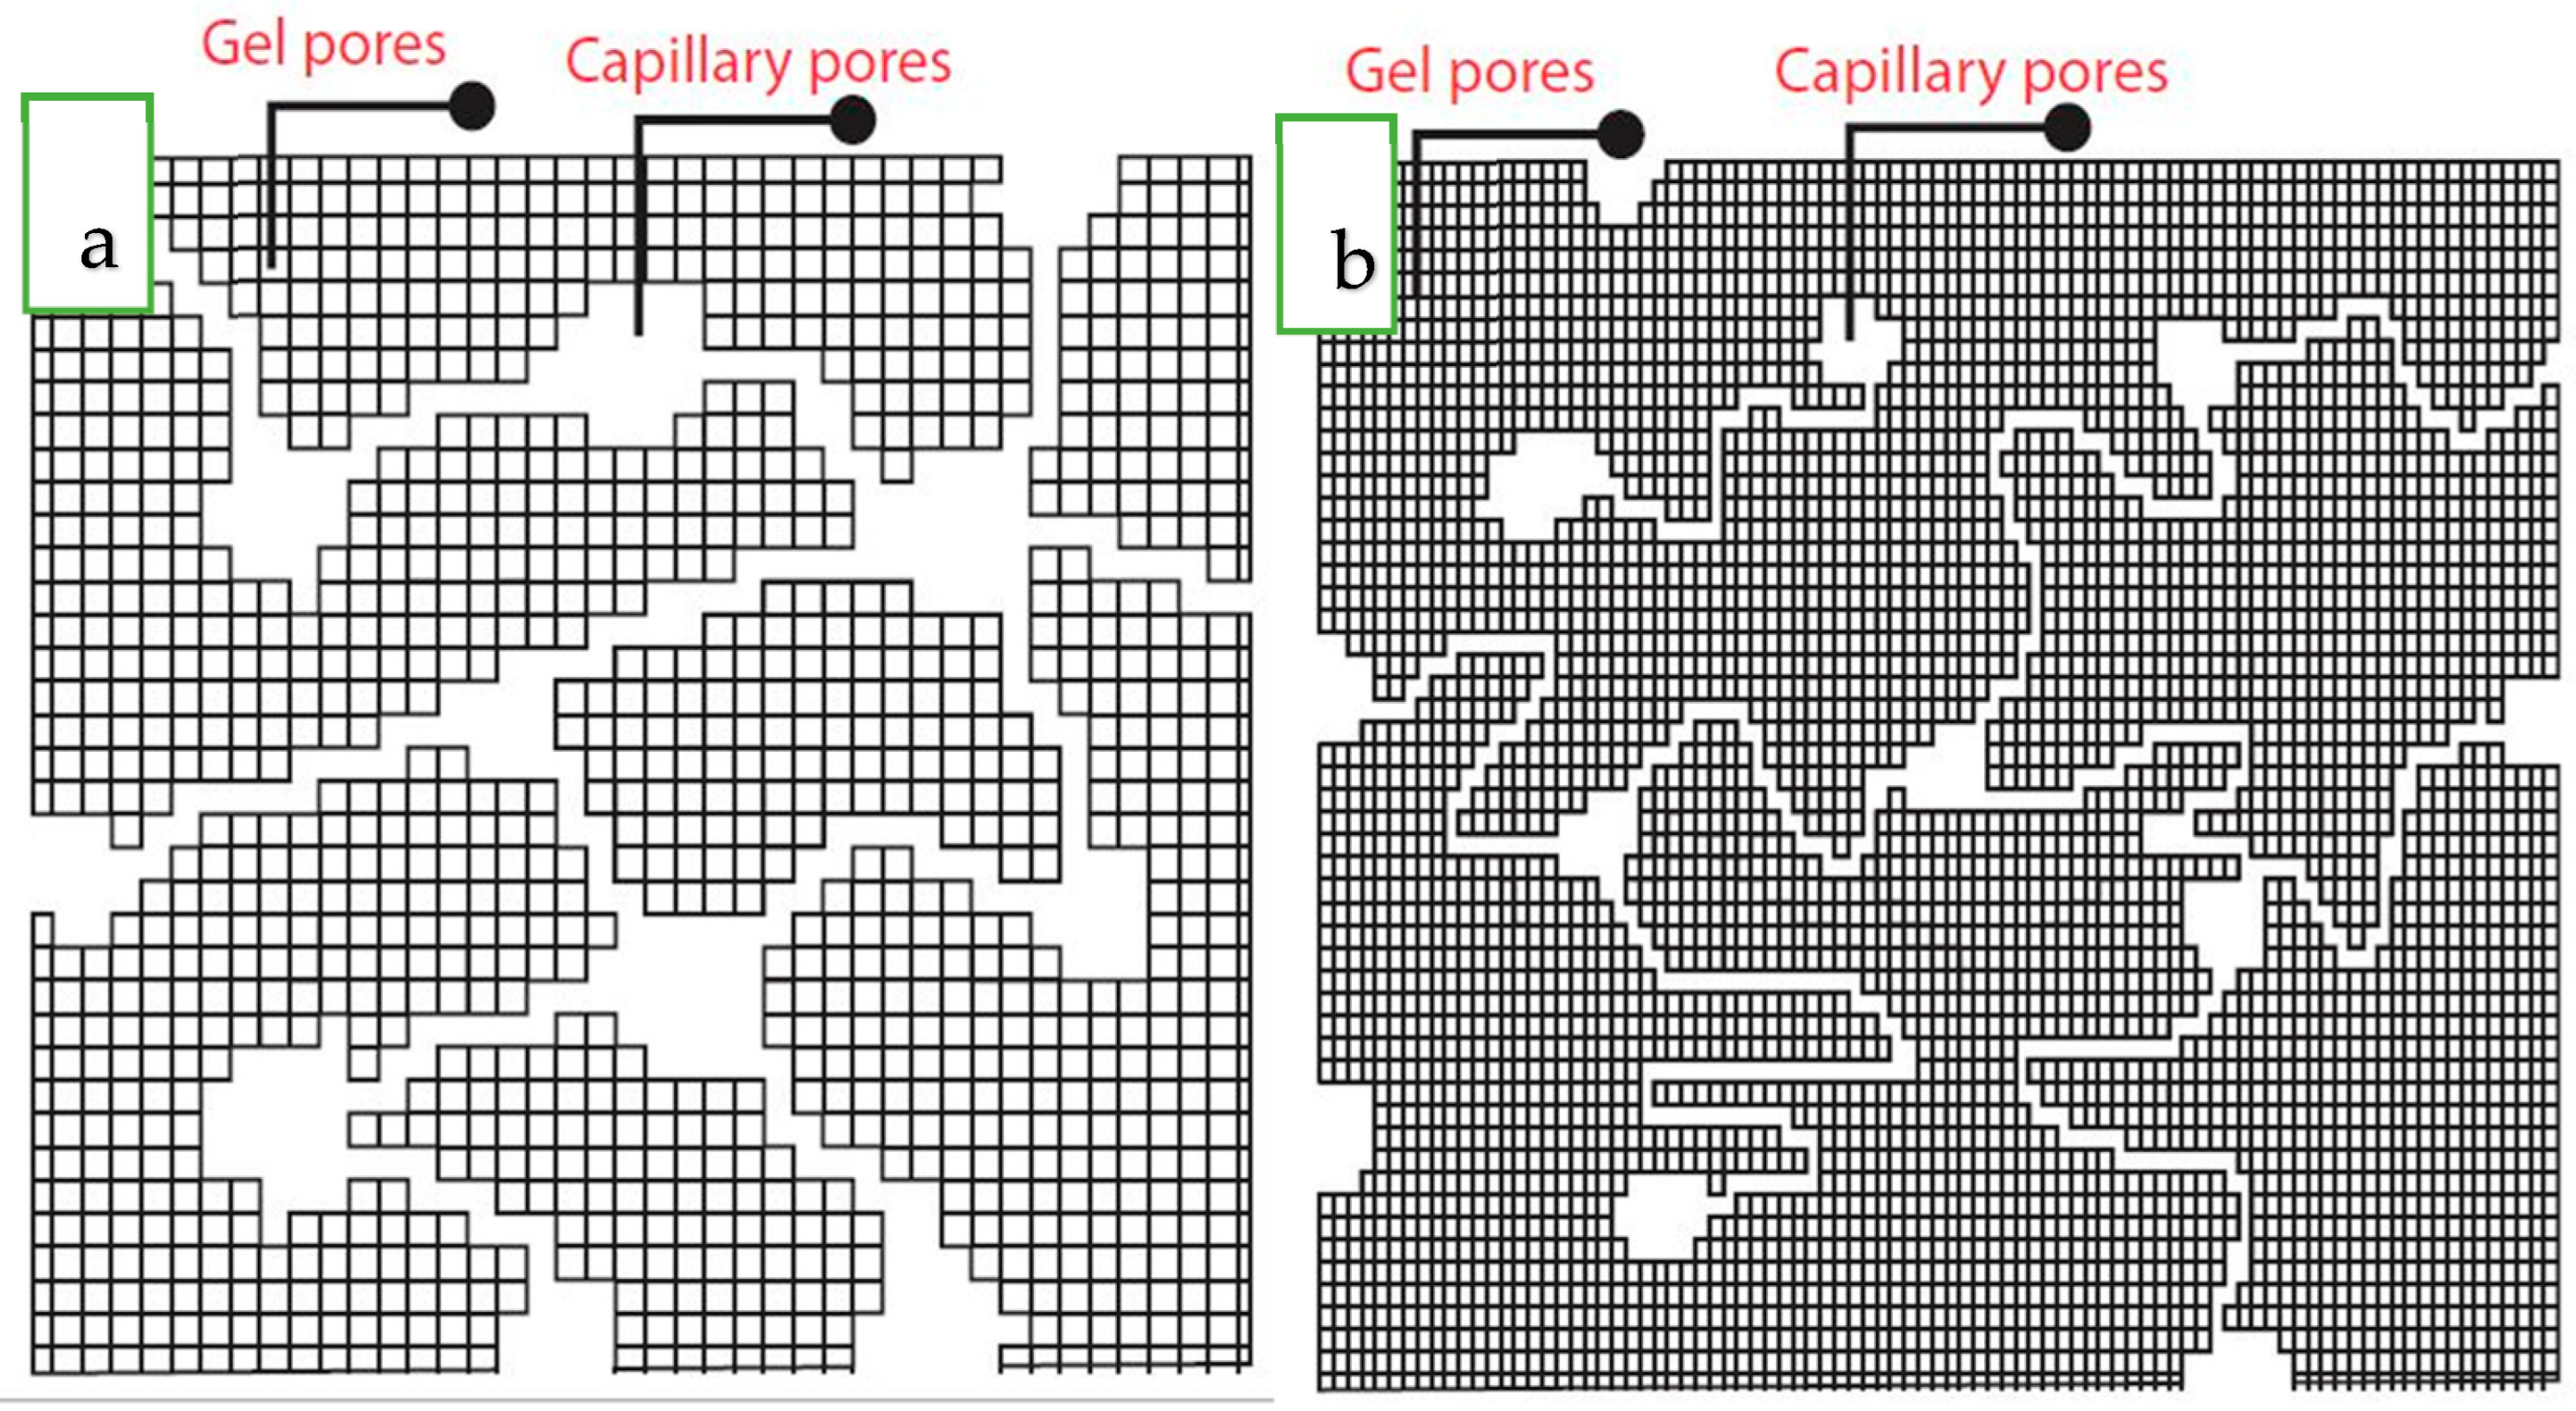
  • By slag inclusion, a remarkable refinement in the pore volume was found, and the volume of the gel pores increased significantly;
  • The increase in the surface area of the AAFS gel indicated that AAFS had quite more geopolymeric products than AAF gel. Additionally, in concurrence with electrical surface resistivity, the surface area showed that the microstructure of the AAFS gel is more tortuous than AAS gel;
  • The SEM/EDX revealed that the increasing Ca ions in the N-A-S-H structure resulted in the highly compacted N-C-A-S-H gel;
  • An increase in slag content up to 30% significantly decreased transport properties, which is related to the microstructural changes, i.e., pore volume refinement;
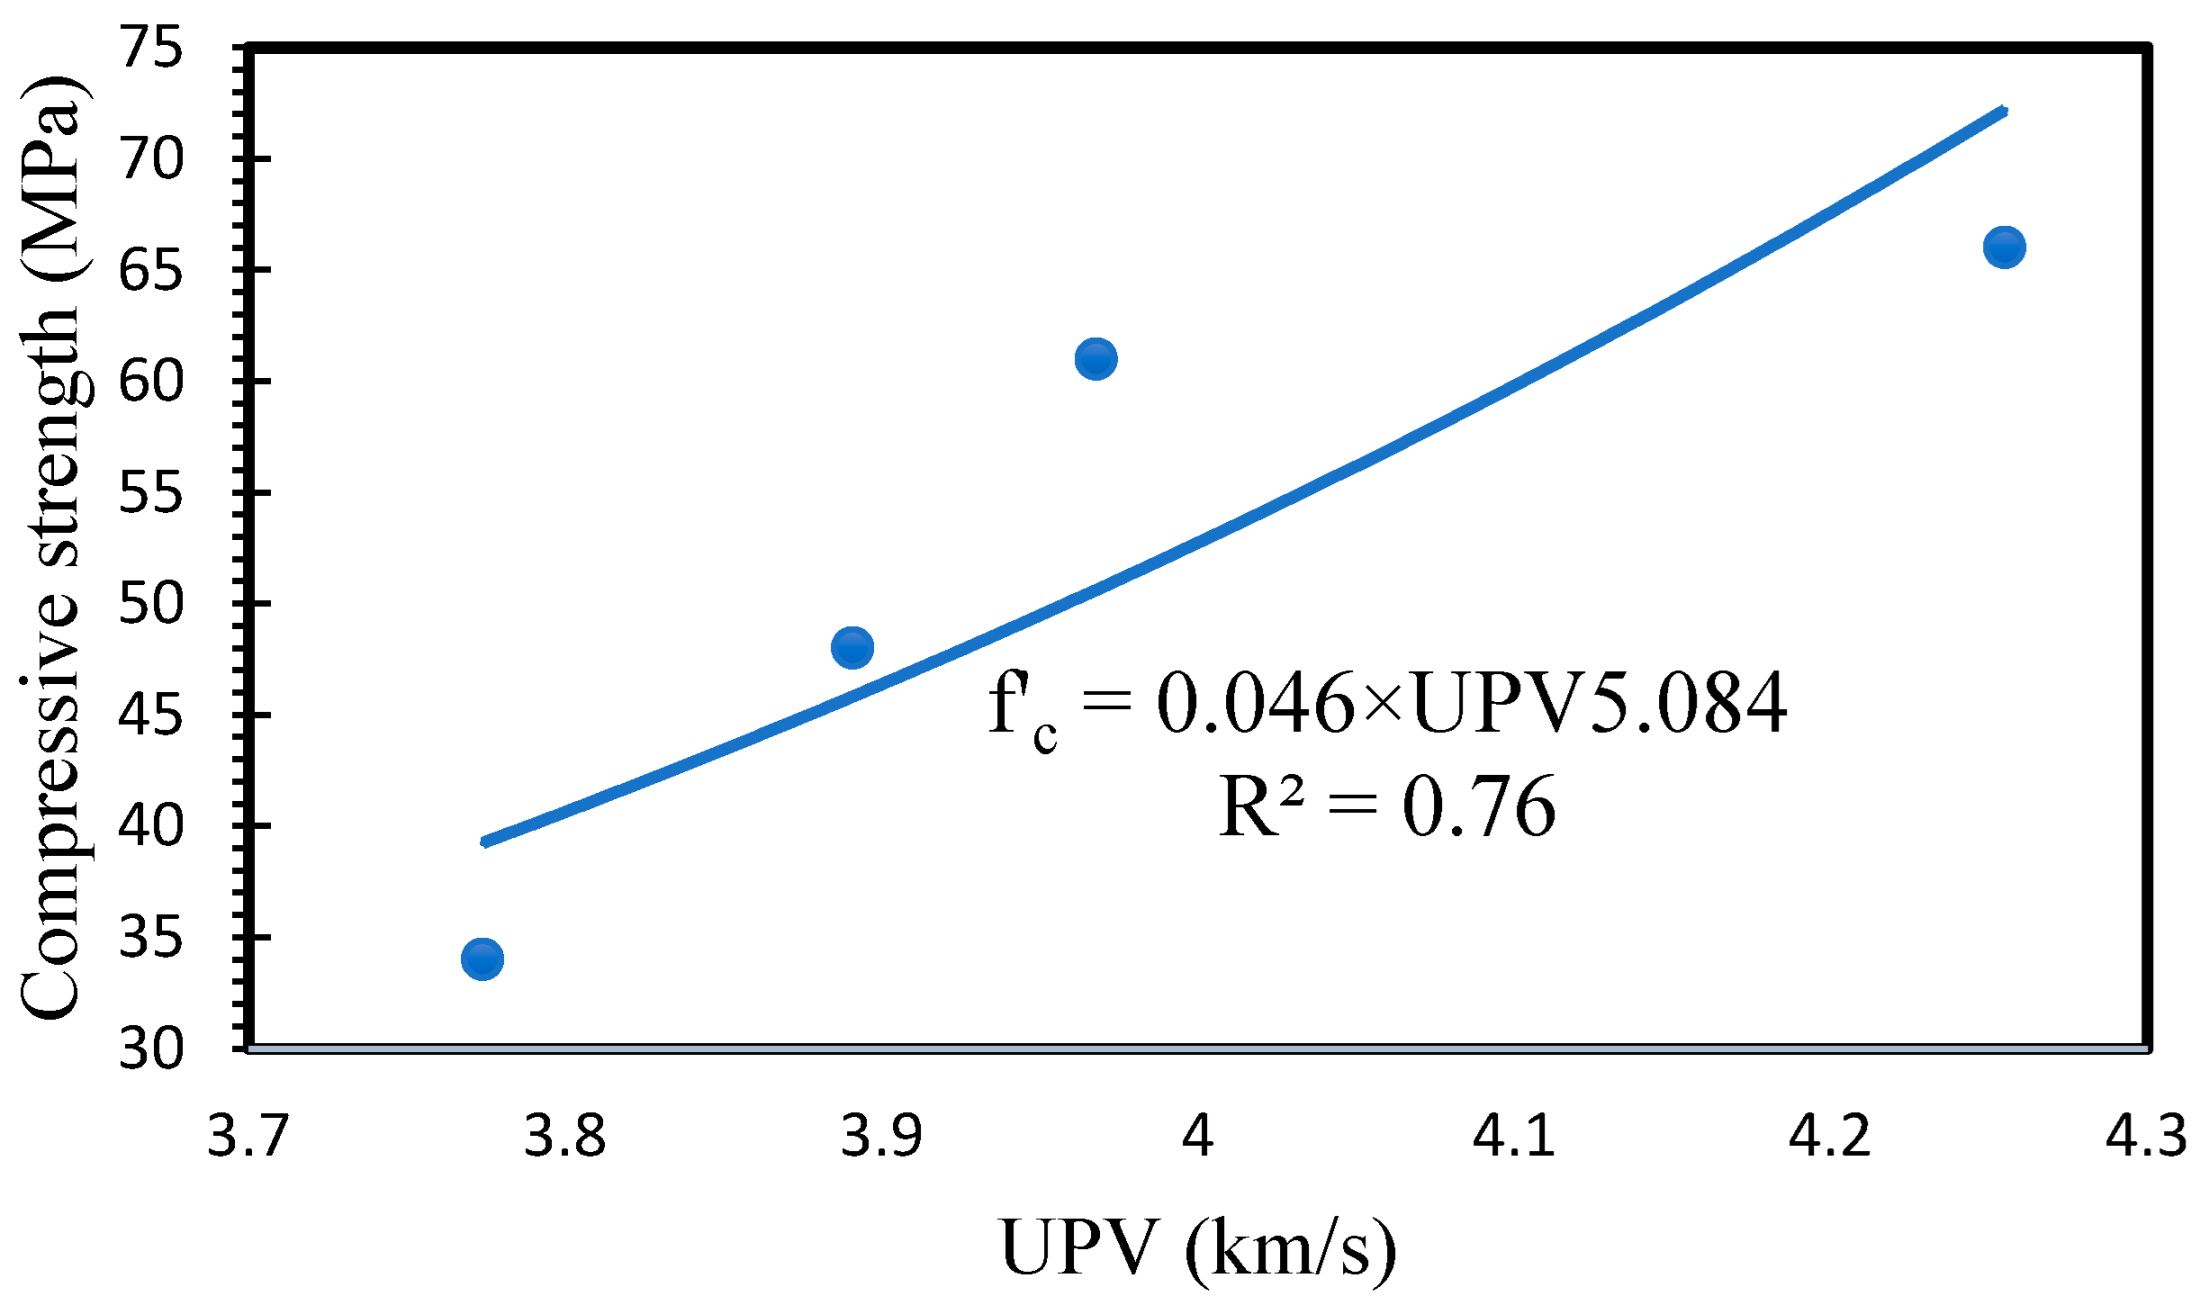
  • The connection between UPV and compressive strength was characterized by an exponential relationship, signifying that minor UPV adjustments could result in significant alterations in compressive strength;
  • SEM images clearly demonstrated that most of the unreacted FA particles were effectively eliminated due to the inclusion of GGBS, which was a result of the gel densification and highly alkaline environment;
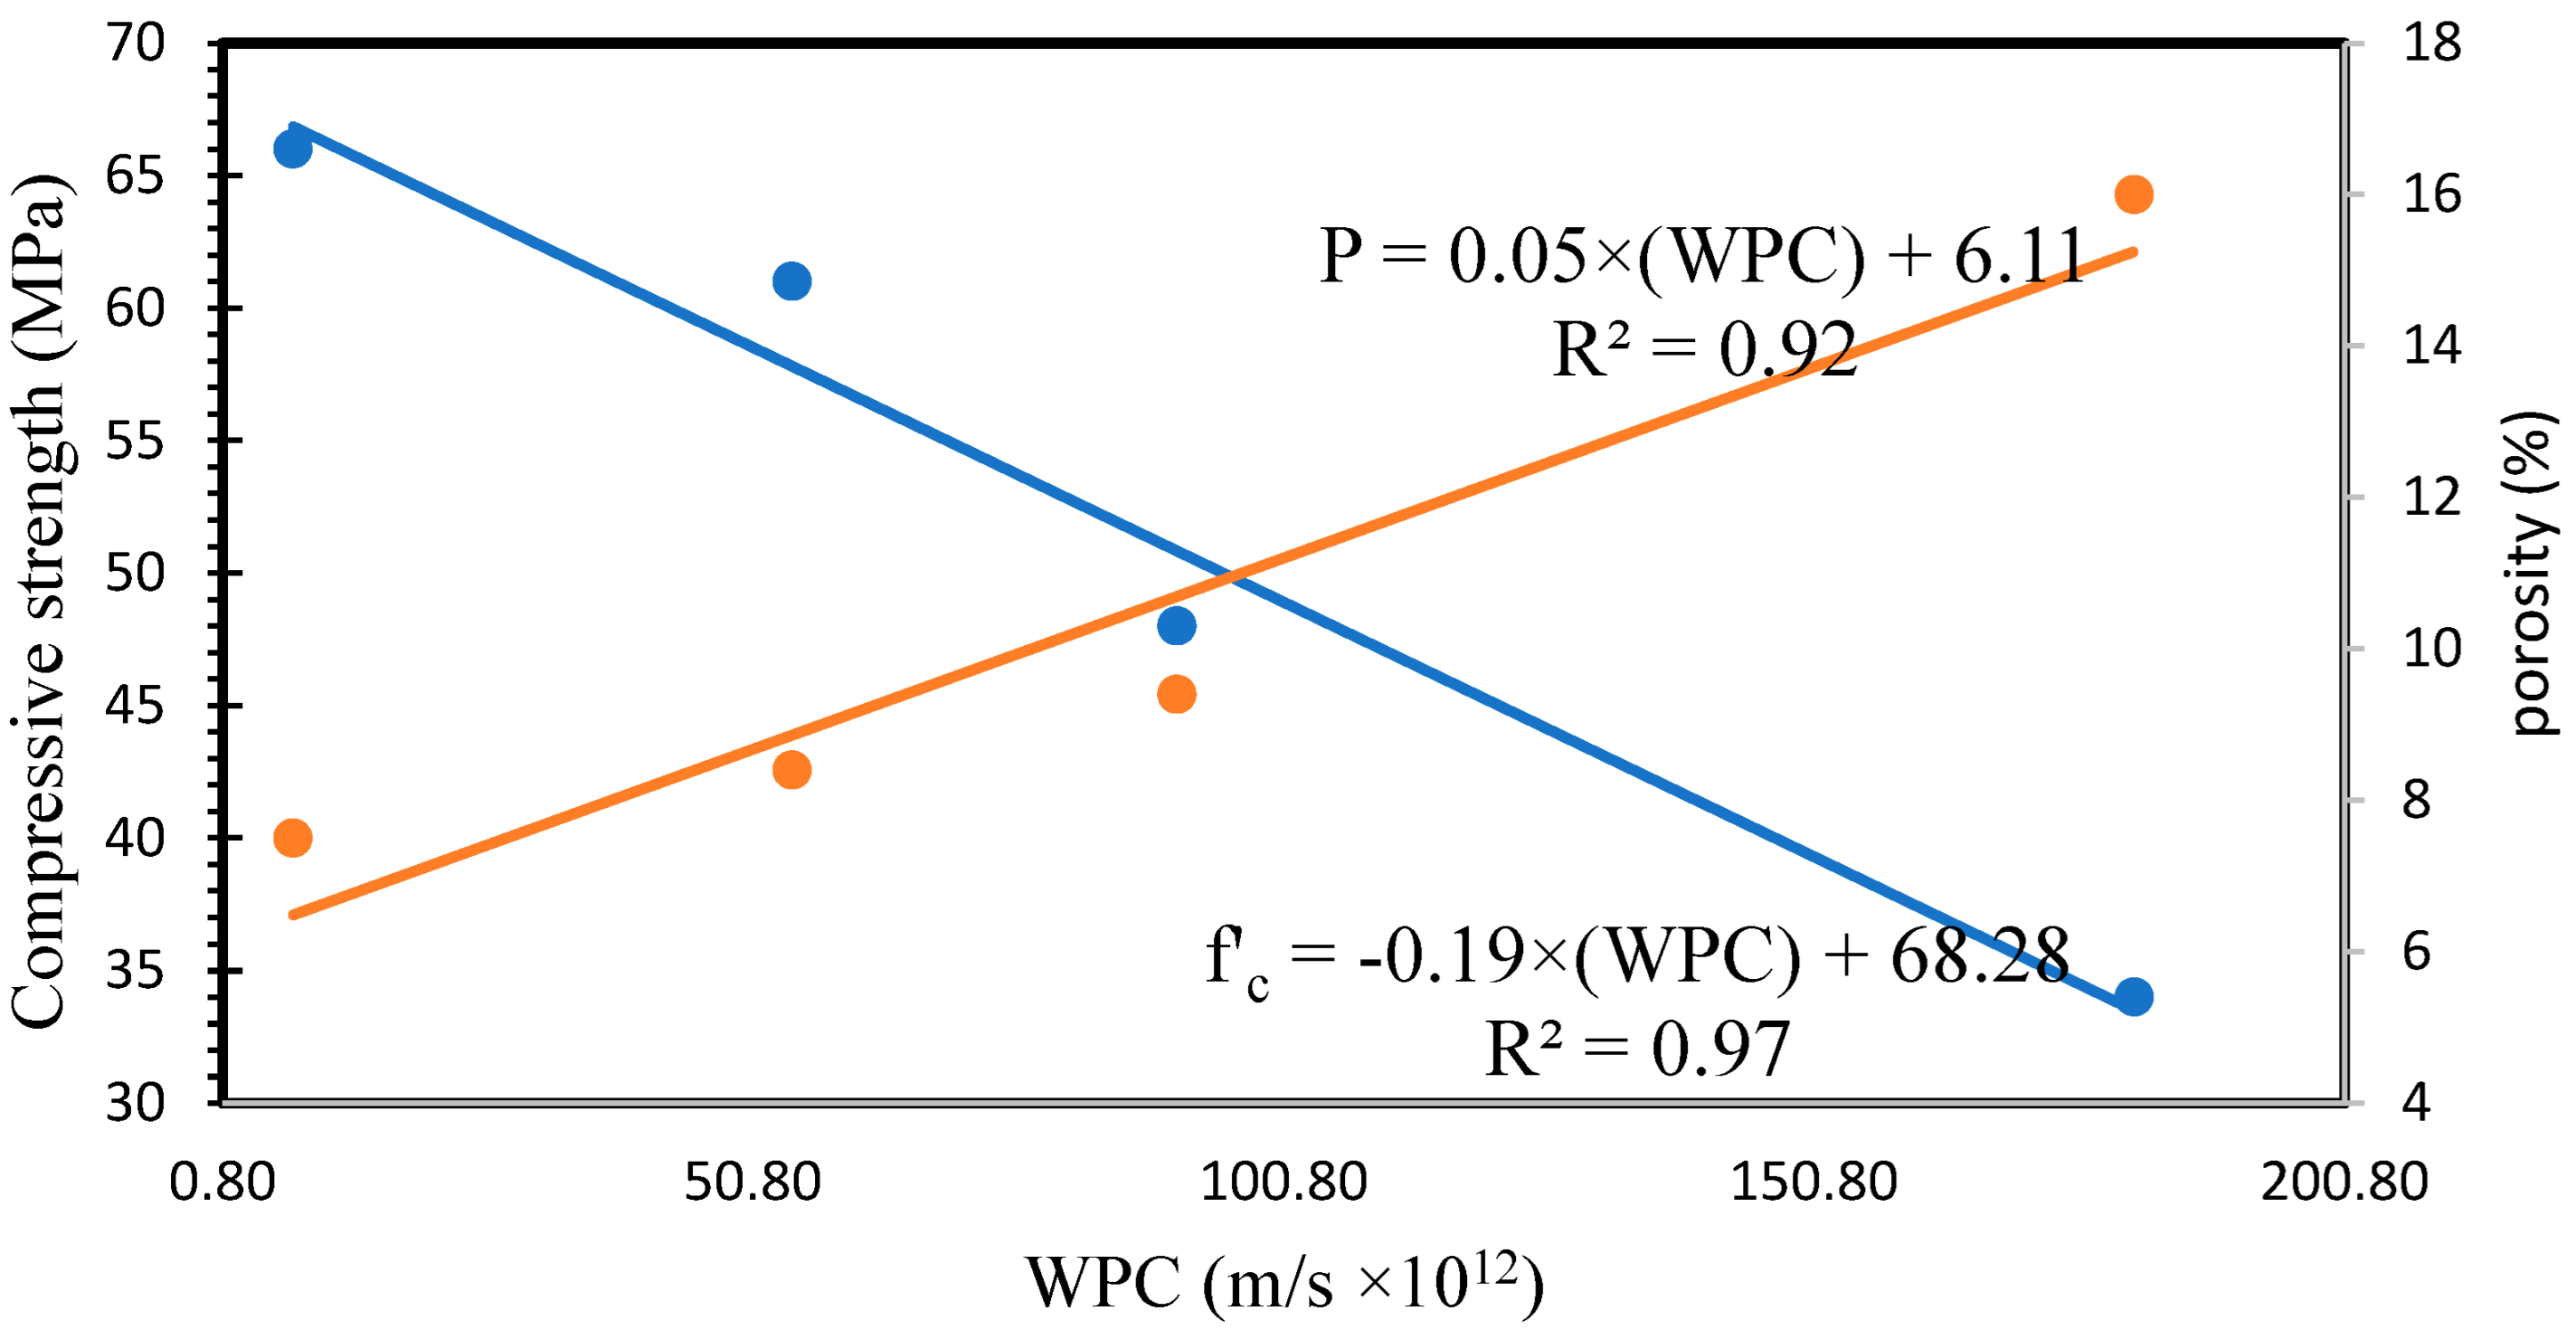
  • In comparison to concrete with a compressive strength of 34 MPa, conventional concrete with a strength of 66 MPa exhibited 14.6 times lower water permeability. However, at equivalent strength levels, AAFS showed 24.3 times lower water permeability, revealing the effect of GGBS on the alteration of pore structure.

Author Contributions

Conceptualization, Z.A. and V.T.; methodology, Z.A. and V.T.; formal analysis, Z.A.; investigation, Z.A. and V.T.; resources, Z.A. and V.T.; data curation, Z.A. and V.T.; writing—original draft preparation, Z.A.; writing—review and editing, Z.A. and V.T.; visualization, Z.A.; supervision, V.T.; project administration, V.T. All authors have read and agreed to the published version of the manuscript.

Funding

There is no external funding for this research.

Institutional Review Board Statement

No applicable.

Informed Consent Statement

No applicable.

Data Availability Statement

No new data were created or analyzed in this study. Data sharing is not applicable to this article.

Conflicts of Interest

The authors declare no conflict of interest.

References

  1. Gursel, A.P.; Masanet, E.; Horvath, A.; Stadel, A. Life-cycle inventory analysis of concrete production: A critical review. Cem. Concr. Compos. 2014, 51, 38–48. [Google Scholar] [CrossRef]
  2. Shariatmadari, N.; Hasanzadehshooiili, H.; Ghadir, P.; Saeidi, F.; Moharami, F. Compressive Strength of Sandy Soils Stabilized with Alkali-Activated Volcanic Ash and Slag. J. Mater. Civ. Eng. 2021, 33, 04021295. [Google Scholar] [CrossRef]
  3. Ahmadi, M.; Hakimi, B.; Mazaheri, A.; Kioumarsi, M. Potential Use of Water Treatment Sludge as Partial Replacement for Clay in Eco-Friendly Fired Clay Bricks. Sustainability 2023, 15, 9389. [Google Scholar] [CrossRef]
  4. Sattarifard, A.R.; Ahmadi, M.; Dalvand, A.; Sattarifard, A.R. Fresh and hardened-state properties of hybrid fiber–reinforced high-strength self-compacting cementitious composites. Constr. Build. Mater. 2022, 318, 125874. [Google Scholar] [CrossRef]
  5. Tang, W.; Pignatta, G.; Sepasgozar, S.M.E. Life-cycle assessment of fly ash and cenosphere-based geopolymer material. Sustainability 2021, 13, 11167. [Google Scholar] [CrossRef]
  6. Rabie, M.; Irshidat, M.R.; Al-Nuaimi, N. Ambient and Heat-Cured Geopolymer Composites: Mix Design Optimization and Life Cycle Assessment. Sustainability 2022, 14, 4942. [Google Scholar] [CrossRef]
  7. Imtiaz, L.; Kashif-Ur-rehman, S.; Alaloul, W.S.; Nazir, K.; Javed, M.F.; Aslam, F.; Musarat, M.A. Life cycle impact assessment of recycled aggregate concrete, geopolymer concrete, and recycled aggregate-based geopolymer concrete. Sustainability 2021, 13, 13515. [Google Scholar] [CrossRef]
  8. Bazli, M.; Ashrafi, H.; Rajabipour, A.; Kutay, C. 3D printing for remote housing: Benefits and challenges. Autom. Constr. 2023, 148, 104772. [Google Scholar] [CrossRef]
  9. Davidovits, J. Geopolymers: Inorganic polymeric new materials. J. Therm. Anal. 1991, 37, 1633–1656. [Google Scholar] [CrossRef]
  10. Razeghi, H.R.; Ghadir, P.; Javadi, A.A. Mechanical Strength of Saline Sandy Soils Stabilized with Alkali-Activated Cements. Sustainability 2022, 14, 13669. [Google Scholar] [CrossRef]
  11. Nouri, H.; Ghadir, P.; Fatehi, H.; Shariatmadari, N.; Saberian, M. Effects of Protein-Based Biopolymer on Geotechnical Properties of Salt-Affected Sandy Soil. Geotech. Geol. Eng. 2022, 40, 5739–5753. [Google Scholar] [CrossRef]
  12. Komaei, A.; Noorzad, A.; Ghadir, P. Stabilization and solidification of arsenic contaminated silty sand using alkaline activated slag. J. Environ. Manag. 2023, 344, 118395. [Google Scholar] [CrossRef] [PubMed]
  13. Ghadir, P.; Ranjbar, N. Clayey soil stabilization using geopolymer and Portland cement. Constr. Build. Mater. 2018, 188, 361–371. [Google Scholar] [CrossRef]
  14. Miraki, H.; Shariatmadari, N.; Ghadir, P.; Jahandari, S.; Tao, Z.; Siddique, R. Clayey soil stabilization using alkali-activated volcanic ash and slag. J. Rock Mech. Geotech. Eng. 2022, 14, 576–591. [Google Scholar] [CrossRef]
  15. Yao, X.; Zhang, Z.; Zhu, H.; Chen, Y. Geopolymerization process of alkali-metakaolinite characterized by isothermal calorimetry. Thermochim. Acta 2009, 493, 49–54. [Google Scholar] [CrossRef]
  16. Zhu, X.; Yan, D.; Fang, H.; Chen, S.; Ye, H. Early-stage geopolymerization revealed by 27Al and 29Si nuclear magnetic resonance spectroscopy based on vacuum dehydration. Constr. Build. Mater. 2021, 266, 121114. [Google Scholar] [CrossRef]
  17. Park, S.; Pour-Ghaz, M. What is the role of water in the geopolymerization of metakaolin? Constr. Build. Mater. 2018, 182, 360–370. [Google Scholar] [CrossRef]
  18. Atiş, C.D.; Görür, E.B.; Karahan, O.; Bilim, C.; Ilkentapar, S.; Luga, E. Very high strength (120 MPa) class F fly ash geopolymer mortar activated at different NaOH amount, heat curing temperature and heat curing duration. Constr. Build. Mater. 2015, 96, 673–678. [Google Scholar] [CrossRef]
  19. Noushini, A.; Castel, A. The effect of heat-curing on transport properties of low-calcium fly ash-based geopolymer concrete. Constr. Build. Mater. 2016, 112, 464–477. [Google Scholar] [CrossRef]
  20. Puligilla, S.; Mondal, P. Role of slag in microstructural development and hardening of fly ash-slag geopolymer. Cem. Concr. Res. 2013, 43, 70–80. [Google Scholar] [CrossRef]
  21. Singh, B.; Rahman, M.R.; Paswan, R.; Bhattacharyya, S.K. Effect of activator concentration on the strength, ITZ and drying shrinkage of fly ash/slag geopolymer concrete. Constr. Build. Mater. 2016, 118, 171–179. [Google Scholar] [CrossRef]
  22. Nath, P.; Sarker, P.K. Effect of GGBFS on setting, workability and early strength properties of fly ash geopolymer concrete cured in ambient condition. Constr. Build. Mater. 2014, 66, 163–171. [Google Scholar] [CrossRef]
  23. Aliabdo, A.A.; Abd Elmoaty, A.E.M.; Salem, H.A. Effect of cement addition, solution resting time and curing characteristics on fly ash based geopolymer concrete performance. Constr. Build. Mater. 2016, 123, 581–593. [Google Scholar] [CrossRef]
  24. Rafeet, A.; Vinai, R.; Soutsos, M.; Sha, W. Effects of slag substitution on physical and mechanical properties of fly ash-based alkali activated binders (AABs). Cem. Concr. Res. 2019, 122, 118–135. [Google Scholar] [CrossRef]
  25. Ismail, I.; Bernal, S.A.; Provis, J.L.; San Nicolas, R.; Hamdan, S.; Van Deventer, J.S.J. Modification of phase evolution in alkali-activated blast furnace slag by the incorporation of fly ash. Cem. Concr. Compos. 2014, 45, 125–135. [Google Scholar] [CrossRef]
  26. Karimpour, H.; Mazloom, M. Pseudo-strain hardening and mechanical properties of green cementitious composites containing polypropylene fibers. Struct. Eng. Mech. 2022, 81, 575–589. [Google Scholar]
  27. Zhang, W.; Yao, X.; Yang, T.; Zhang, Z. The degradation mechanisms of alkali-activated fly ash/slag blend cements exposed to sulphuric acid. Constr. Build. Mater. 2018, 186, 1177–1187. [Google Scholar] [CrossRef]
  28. Lee, N.K.; Lee, H.K. Influence of the slag content on the chloride and sulfuric acid resistances of alkali-activated fly ash/slag paste. Cem. Concr. Compos. 2016, 72, 168–179. [Google Scholar] [CrossRef]
  29. Ren, J.; Zhang, L.; Nicolas, R.S. Degradation process of alkali-activated slag/fly ash and Portland cement-based pastes exposed to phosphoric acid. Constr. Build. Mater. 2020, 232, 117209. [Google Scholar] [CrossRef]
  30. Komljenović, M.; Baščarević, Z.; Marjanović, N.; Nikolić, V. External sulfate attack on alkali-activated slag. Constr. Build. Mater. 2013, 49, 31–39. [Google Scholar] [CrossRef]
  31. Yio, M.H.N.; Wong, H.S.; Buenfeld, N.R. 3D pore structure and mass transport properties of blended cementitious materials. Cem. Concr. Res. 2019, 117, 23–37. [Google Scholar] [CrossRef]
  32. Shafikhani, M.; Chidiac, S.E. A holistic model for cement paste and concrete chloride diffusion coefficient. Cem. Concr. Res. 2020, 133, 106049. [Google Scholar] [CrossRef]
  33. Wilson, W.; Gonthier, J.N.; Georget, F.; Scrivener, K. Tortuosity as a Key Parameter of Chloride Diffusion in LC3 Systems. In Calcined Clays for Sustainable Concrete; RILEM Bookseries; Springer: Singapore, 2020; Volume 25. [Google Scholar]
  34. Addassi, M.; Johannesson, B. Reactive mass transport in concrete including for gaseous constituents using a two-phase moisture transport approach. Constr. Build. Mater. 2020, 232, 117148. [Google Scholar] [CrossRef]
  35. Bai, Y.; Wang, Y.; Xi, Y. Modeling the effect of temperature gradient on moisture and ionic transport in concrete. Cem. Concr. Compos. 2020, 106, 103454. [Google Scholar] [CrossRef]
  36. Casnedi, L.; Cappai, M.; Cincotti, A.; Delogu, F.; Pia, G. Porosity effects on water vapour permeability in earthen materials: Experimental evidence and modelling description. J. Build. Eng. 2020, 27, 100987. [Google Scholar] [CrossRef]
  37. Zhang, P.; Cong, Y.; Vogel, M.; Liu, Z.; Müller, H.S.; Zhu, Y.; Zhao, T. Steel reinforcement corrosion in concrete under combined actions: The role of freeze-thaw cycles, chloride ingress, and surface impregnation. Constr. Build. Mater. 2017, 148, 113–121. [Google Scholar] [CrossRef]
  38. Sola, E.; Ožbolt, J.; Balabanić, G.; Mir, Z.M. Experimental and numerical study of accelerated corrosion of steel reinforcement in concrete: Transport of corrosion products. Cem. Concr. Res. 2019, 120, 119–131. [Google Scholar] [CrossRef]
  39. Samadi, P.; Ghodrati, A.; Ghadir, P.; Javadi, A.A. Effect of Seawater on the Mechanical Strength of Geopolymer/Cement Stabilized Sandy Soils. In Proceedings of the TMIC 2022 Slope Stability Conference (TMIC 2022); Atlantis Press: Amsterdam, The Netherlands, 2023. [Google Scholar]
  40. Kazemi, H.; Yekrangnia, M.; Shakiba, M.; Bazli, M.; Vatani Oskouei, A. Bond-slip behaviour between GFRP/steel bars and seawater concrete after exposure to environmental conditions. Eng. Struct. 2022, 268, 114796. [Google Scholar] [CrossRef]
  41. Cardoso, R. Porosity and tortuosity influence on geophysical properties of an artificially cemented sand. Eng. Geol. 2016, 211, 198–207. [Google Scholar] [CrossRef]
  42. Ghasemalizadeh, S.; Toufigh, V. Durability of Rammed Earth Materials. Int. J. Geomech. 2020, 20, 04020201. [Google Scholar] [CrossRef]
  43. Ghassemi, P.; Toufigh, V. Durability of epoxy polymer and ordinary cement concrete in aggressive environments. Constr. Build. Mater. 2020, 234, 117887. [Google Scholar] [CrossRef]
  44. Sepehrinezhad, A.; Toufigh, V. The evaluation of distributed damage in concrete based on sinusoidal modeling of the ultrasonic response. Ultrasonics 2018, 89, 195–205. [Google Scholar] [CrossRef] [PubMed]
  45. Heidarnezhad, F.; Toufigh, V.; Ghaemian, M. Analyzing and predicting permeability coefficient of roller-compacted concrete (RCC). J. Test. Eval. 2021, 49, 20180718. [Google Scholar] [CrossRef]
  46. Nofalah, M.-H.; Ghadir, P.; Hasanzadehshooiili, H.; Aminpour, M.; Javadi, A.A.; Nazem, M. Effects of Binder Proportion and Curing Condition on the Mechanical Characteristics of Volcanic Ash- and Slag-Based Geopolymer Mortars; Machine Learning Integrated Experimental Study. Constr. Build. Mater. 2023, 395, 132330. Available online: https://linkinghub.elsevier.com/retrieve/pii/S0950061823020469 (accessed on 1 September 2023). [CrossRef]
  47. Ghadir, P.; Razeghi, H.R. Effects of sodium chloride on the mechanical strength of alkali activated volcanic ash and slag pastes under room and elevated temperatures. Constr. Build. Mater. 2022, 344, 128113. [Google Scholar] [CrossRef]
  48. Matalkah, F.; Ababneh, A.; Aqel, R. Effects of nanomaterials on mechanical properties, durability characteristics and microstructural features of alkali-activated binders: A comprehensive review. Constr. Build. Mater. 2022, 336, 127545. [Google Scholar] [CrossRef]
  49. Razeghi, H.R.; Geranghadr, A.; Safaee, F.; Ghadir, P.; Javadi, A.A. Effect of CO2 exposure on the mechanical strength of geopolymer-stabilized sandy soils. J. Rock Mech. Geotech. Eng. 2023, in press. [CrossRef]
  50. Noushini, A.; Castel, A.; Aldred, J.; Rawal, A. Chloride diffusion resistance and chloride binding capacity of fly ash-based geopolymer concrete. Cem. Concr. Compos. 2020, 105, 103290. [Google Scholar] [CrossRef]
  51. Saloni; Parveen; Lim, Y.Y.; Pham, T.M. Influence of Portland cement on performance of fine rice husk ash geopolymer concrete: Strength and permeability properties. Constr. Build. Mater. 2021, 300, 124321. [Google Scholar] [CrossRef]
  52. Mohamed, O.A.; Al Khattab, R. Fresh Properties and Sulfuric Acid Resistance of Sustainable Mortar Using Alkali-Activated GGBS/Fly Ash Binder. Polymers 2022, 14, 591. [Google Scholar] [CrossRef]
  53. Zhang, X.; Zhang, X.; Li, X.; Liu, Y.; Yu, H.; Ma, M. Porous geopolymer with controllable interconnected pores—A viable permeable reactive barrier filler for lead pollutant removal. Chemosphere 2022, 307, 136128. [Google Scholar] [CrossRef] [PubMed]
  54. Toufigh, V.; Karamian, M.H.; Ghasemalizadeh, S. Study of stress–strain and volume change behavior of fly ash-GBFS based geopolymer rammed earth. Bull. Eng. Geol. Environ. 2021, 80, 6749–6767. [Google Scholar] [CrossRef]
  55. ASTM C33/C33M-18; Standard Specification for Concrete Aggregates. ASTM International: West Conshohocken, PA, USA, 2020.
  56. ASTM C128; Standard Test Method for Specific Gravity and Absorption of Fine Aggregate. ASTM International: West Conshohocken, PA, USA, 1998.
  57. ASTM C127; Standard Test Method for Density, Relative Density (Specific Gravity), and Absorption. ASTM International: West Conshohocken, PA, USA, 2015.
  58. Ding, Y.; Dai, J.G.; Shi, C.J. Mechanical properties of alkali-activated concrete: A state-of-the-art review. Constr. Build. Mater. 2016, 127, 68–79. [Google Scholar] [CrossRef]
  59. BS EN 12390-3; Testing Hardened Concrete, Part 3: Compressive Strength of Test Specimens. BSI: London, UK, 2019.
  60. ASTM C597; Standard Test Method for Pulse Velocity Through Concrete. The American Society for Testing and Materials: West Conshohocken, PA, USA, 2016.
  61. ASTM C642; Standard Test Method for Density, Absorption, and Voids in Hardened Concrete. ASTM International: West Conshohocken, PA, USA, 2006.
  62. AASHTO T 358; Standard Method of Test for Surface Resistivity Indication of Concrete’s Ability to Resist Chloride Ion Penetration. The American Association of State Highway and Transportation Officials: Washington, DC, USA, 2019.
  63. ASTM E96/E96M-16; Standard Test Methods for Water Vapor Transmission of Materials, ASTM International. ASTM International: West Conshohocken, PA, USA, 2016.
  64. Fang, G.; Ho, W.K.; Tu, W.; Zhang, M. Workability and mechanical properties of alkali-activated fly ash-slag concrete cured at ambient temperature. Constr. Build. Mater. 2018, 172, 476–487. [Google Scholar] [CrossRef]
  65. Rahmati, M.; Toufigh, V. Evaluation of geopolymer concrete at high temperatures: An experimental study using machine learning. J. Clean. Prod. 2022, 372, 133608. [Google Scholar] [CrossRef]
  66. Mata, R.; Ruiz, R.O.; Nuñez, E. Correlation between compressive strength of concrete and ultrasonic pulse velocity: A case of study and a new correlation method. Constr. Build. Mater. 2023, 369, 130569. [Google Scholar] [CrossRef]
  67. Rahmati, M.; Toufigh, V.; Keyvan, K. Monitoring of crack healing in geopolymer concrete using a nonlinear ultrasound approach in phase-space domain. Ultrasonics 2023, 134, 107095. [Google Scholar] [CrossRef]
  68. Mehta, A.; Siddique, R.; Ozbakkaloglu, T.; Shaikh, F.U.A.; Belarbi, R. Fly ash and ground granulated blast furnace slag-based alkali-activated concrete: Mechanical, transport and microstructural properties. Constr. Build. Mater. 2020, 257, 119548. [Google Scholar] [CrossRef]
  69. Barrett, E.P.; Joyner, L.G.; Halenda, P.P. The Determination of Pore Volume and Area Distributions in Porous Substances. I. Computations from Nitrogen Isotherms. J. Am. Chem. Soc. 1951, 73, 373–380. [Google Scholar] [CrossRef]
  70. Hanif, A.; Parthasarathy, P.; Ma, H.; Fan, T.; Li, Z. Properties improvement of fly ash cenosphere modified cement pastes using nano silica. Cem. Concr. Compos. 2017, 81, 35–48. [Google Scholar] [CrossRef]
  71. Brunauer, S.; Emmett, P.H.; Teller, E. Adsorption of Gases in Multimolecular Layers. J. Am. Chem. Soc. 1938, 60, 309–319. [Google Scholar] [CrossRef]
  72. Odler, I. Reply to the discussion by H.M. Jennings and J.J. Thomas of the paper “The BET-specific surface area of hydrated Portland cement and related materials.”. Cem. Concr. Res. 2004, 34, 1961. [Google Scholar] [CrossRef]
  73. Yazdi, M.A.; Liebscher, M.; Hempel, S.; Yang, J.; Mechtcherine, V. Correlation of microstructural and mechanical properties of geopolymers produced from fly ash and slag at room temperature. Constr. Build. Mater. 2018, 191, 330–341. [Google Scholar] [CrossRef]
  74. Jang, J.G.; Lee, H.K. Effect of fly ash characteristics on delayed high-strength development of geopolymers. Constr. Build. Mater. 2016, 102, 260–269. [Google Scholar] [CrossRef]
  75. Rattanachu, P.; Tangchirapat, W.; Jaturapitakkul, C. Water Permeability and Sulfate Resistance of Eco-Friendly High-Strength Concrete Composed of Ground Bagasse Ash and Recycled Concrete Aggregate. J. Mater. Civ. Eng. 2019, 31. [Google Scholar] [CrossRef]
Figure 1. Compressive strength apparatus.
Sustainability 15 13348 g001
Figure 2. ESR test equipment.
Sustainability 15 13348 g002
Figure 3. Water vapor transmission test apparatus.
Sustainability 15 13348 g003
Figure 4. (a) Water permeability apparatus and (b) coated sample for water permeability test.
Sustainability 15 13348 g004
Figure 5. Compressive strength of the specimens (MPa).
Sustainability 15 13348 g005
Figure 6. UPV of the specimens (Km/s).
Sustainability 15 13348 g006
Figure 7. Relationship between UPV and compressive strength.
Sustainability 15 13348 g007
Figure 8. The porosity of the samples (%).
Sustainability 15 13348 g008
Figure 9. Relationship between porosity and compressive strength.
Sustainability 15 13348 g009
Figure 10. Pore size distribution of samples.
Sustainability 15 13348 g010
Figure 11. Specific surface area of the specimens (m2/gr).
Sustainability 15 13348 g011
Figure 12. Relationship between specific surface area and compressive strength.
Sustainability 15 13348 g012
Figure 13. SEM images of samples having (a) 0% of SG, (b) 10% of SG, (c) 20% of SG, and (d) 30% of SG.
Sustainability 15 13348 g013
Figure 14. ESR values of the specimens.
Sustainability 15 13348 g014
Figure 15. Schematically pore structure of (a) AAF and (b) AAFS.
Sustainability 15 13348 g015
Figure 16. Relationship between ESR and compressive strength values.
Sustainability 15 13348 g016
Figure 17. Water vapor permeability (gr/mm2·hour−1).
Sustainability 15 13348 g017
Figure 18. Water permeability coefficient (m/s).
Sustainability 15 13348 g018
Figure 19. Relationship between compressive strength/porosity and WPC.
Sustainability 15 13348 g019
Figure 20. Relationship proposed for conventional concretes.
Sustainability 15 13348 g020
Table 1. Chemical composition (wt%) of the SG and FA.
ElementCaOSiO2Al2O3Fe2O3MgOSO3K2ONa2O
GGBS 38.2335.4313.280.768.742.40.530.43
FA 4.357.329.511.7-0.2--
Table 2. Mix design (kg/m3).
LabelFAGGBSNH SolutionNS SolutionSandGravelExtra WaterSuperplasticizer
GP0400045.71114.29722.761084.1533.094
GP03604045.71114.29722.761084.1533.094
GP03208045.71114.29722.761084.1533.094
GP028012045.71114.29722.761084.1533.094
Table 3. Volume fraction of gel and capillary pores (%).
SpecimenGel PoresCapillary Pores
GP01288
GP101684
GP203367
GP303862
Table 4. Ca/Si ratio analyzed via EDX analysis.
SpecimensCa/Si
GP00.08
GP100.14
GP200.27
GP300.41
Disclaimer/Publisher’s Note: The statements, opinions and data contained in all publications are solely those of the individual author(s) and contributor(s) and not of MDPI and/or the editor(s). MDPI and/or the editor(s) disclaim responsibility for any injury to people or property resulting from any ideas, methods, instructions or products referred to in the content.

