Article

Research on Community Fitness Spaces under the Guidance of the National Fitness Program

School of Urban Design, Wuhan University, Wuhan 430072, China
*
Author to whom correspondence should be addressed.
Sustainability 2023, 15(17), 13273; https://doi.org/10.3390/su151713273
Submission received: 10 July 2023 / Revised: 3 August 2023 / Accepted: 28 August 2023 / Published: 4 September 2023

Abstract

:
In the context of sub-health caused by the sedentary lifestyle, sports for health, as an effective way to promote sustainable urban development, has attracted the attention of the government and residents. The proposal of policies represented by the National Fitness Program has facilitated the rapid development of community fitness spaces, which constitute an indispensable part of the Chinese outdoor fitness system. Despite this, many of these spaces still remain unused in reality due to unscientific planning, design, and management. To address this issue, we conducted a study in Liaocheng, Shandong Province, focusing on communities with fitness spaces. Through PSPL, questionnaire surveys and data analysis using software such as Urban Quadrant and SPSS 26, five factors impacting the utilization rates and satisfaction levels of these spaces were identified. And based on MLR, the number of rest facilities was verified as the most important factor and should be considered carefully. By providing insight into the utilization of community fitness spaces, our study can serve as a valuable reference for future planning or renovation of these spaces.

1. Introduction

Non-communicable diseases (NCDs) are considered one of the two defining challenges of the 21st century, posing significant threats to health and sustainable development [1]. According to the World Health Organization, 68 percent of global mortality is closely associated with NCDs [2]. In China, this percentage is even higher and still shows a significant upward trend [3]. Especially in first- and second-tier cities, the increasing prevalence of diseases such as dyslipidemia and fatty livers has seriously affected residents’ daily lives. And these diseases, originally targeting an older age group, have started to affect youngsters in recent years [4].
Physical inactivity is one of the major causes of the rising morbidity of NCDs and accounts for approximately two million deaths per year [5]. Thankfully, this situation can be effectively alleviated by creating attractive fitness spaces and encouraging residents to exercise [6]. Consequently, the Chinese government issued a series of policies on exercise and health. A national plan called the National Fitness Program was first proposed in 1995, aiming to encourage more people to participate in physical exercise by improving the construction of public sports facilities [7]. Then in 2016, “15-min fitness circle” was pointed out in the 13th Five-Year Plan to guarantee that public sports services were fully provided to all inhabitants [4].
The promotion of these policies has led to an upsurge in the construction of outdoor fitness venues (parks, residential squares, and plazas). As a component of urban fitness systems as well as green infrastructure, these spaces play a key role in making cities healthy, resilient, and sustainable [8].
Different from Europe and the United States, where residents’ outdoor exercise is mainly concentrated in urban public spaces such as city parks and fitness trails, China has developed a unique multi-level urban fitness system due to its large population and consumption patterns. It includes outdoor fitness spaces with a wide range of offerings, such as parks and trails, as well as small-scale fitness spaces that cater specifically to the interior of blocks or units. The community fitness space falls into the latter category.
Community fitness space refers to squares or open spaces where free fitness facilities are placed within communities [9]. Since 1977, the Chinese government has invested CNY 1.05 billion in the construction of fitness facilities through sports lottery funds [10]. As a result, a large number of community fitness spaces have emerged across the country. Due to their proximity to home, low cost, simple equipment operation, and flexible use, these spaces have become the preferred choice for many residents to engage in outdoor fitness activities, especially for the elderly [11,12]. However, their utilization is not ideal due to a lack of scientific planning. In some communities, fitness facilities are even left completely unused and merely serve as tools for drying clothes [13]. Therefore, it is crucial to explore the factors that affect the use of such fitness spaces and provide references for their future planning, design, and management.
By reviewing international research on outdoor fitness spaces, we found that as early as 2004, Cavnar et al. established RFET, an evaluation system for fitness spaces [14], to investigate the influence of built-environment factors on residents’ physical activities. In recent years, international research in this area has gradually matured, employing a variety of methods, both qualitative and quantitative [15,16,17]. Some scholars have even begun to focus on specific groups, such as adolescents and the elderly [18,19,20].
However, due to the differences in outdoor fitness systems between China and other countries, current international scholars still primarily focus on public outdoor fitness spaces such as urban parks, with very little attention devoted to small-scale fitness spaces. Although the relationship between built environment factors such as environmental quality [21,22], size of the site [23,24], service facilities [15,25], and users’ fitness behaviors has been examined in these public fitness spaces, their effects in the community fitness spaces still require further evidence, given the differences in spatial scale, scope of supply, and target users.
In China, from the proposal of the “National Fitness Program” to the construction of the “15-min Fitness Circle” [26], the government has gradually strengthened its support for community fitness spaces in recent years. Consequently, an increasing number of Chinese scholars have shifted their research focus to this localized type of fitness space. For instance, in 2019, Chen Yujuan et al. found that road network density and urban population density were the main factors affecting the distribution of community sports facilities [27]. In 2020, Wei Wei et al. explored the factors affecting the overall satisfaction of community sports facilities from perspectives such as spatial layout, function configuration, and service management [28]. According to the above research, accessibility [29], population density [27], land development degree [30], and other external factors have a certain effect on the distribution and usage of community fitness spaces.
Currently, most studies by Chinese scholars remain at the urban scale, analyzing the distribution of community fitness spaces and exploring factors from the perspective of whole-city planning. However, in addition to these external factors, ensuring the interior quality of the fitness venues is the final step to realizing their efficient operation. Few studies have focused on this point and identified the internal built-environment factors at micro and medium scales. To address this research gap, this study was conducted inside each community fitness space, exploring the influencing factors based on the characteristics of the space itself. As a supplement to the existing research, this work will make the evaluation system of community fitness spaces more comprehensive, thereby better guiding their future design and management.

2. Materials and Methods

2.1. Research Area

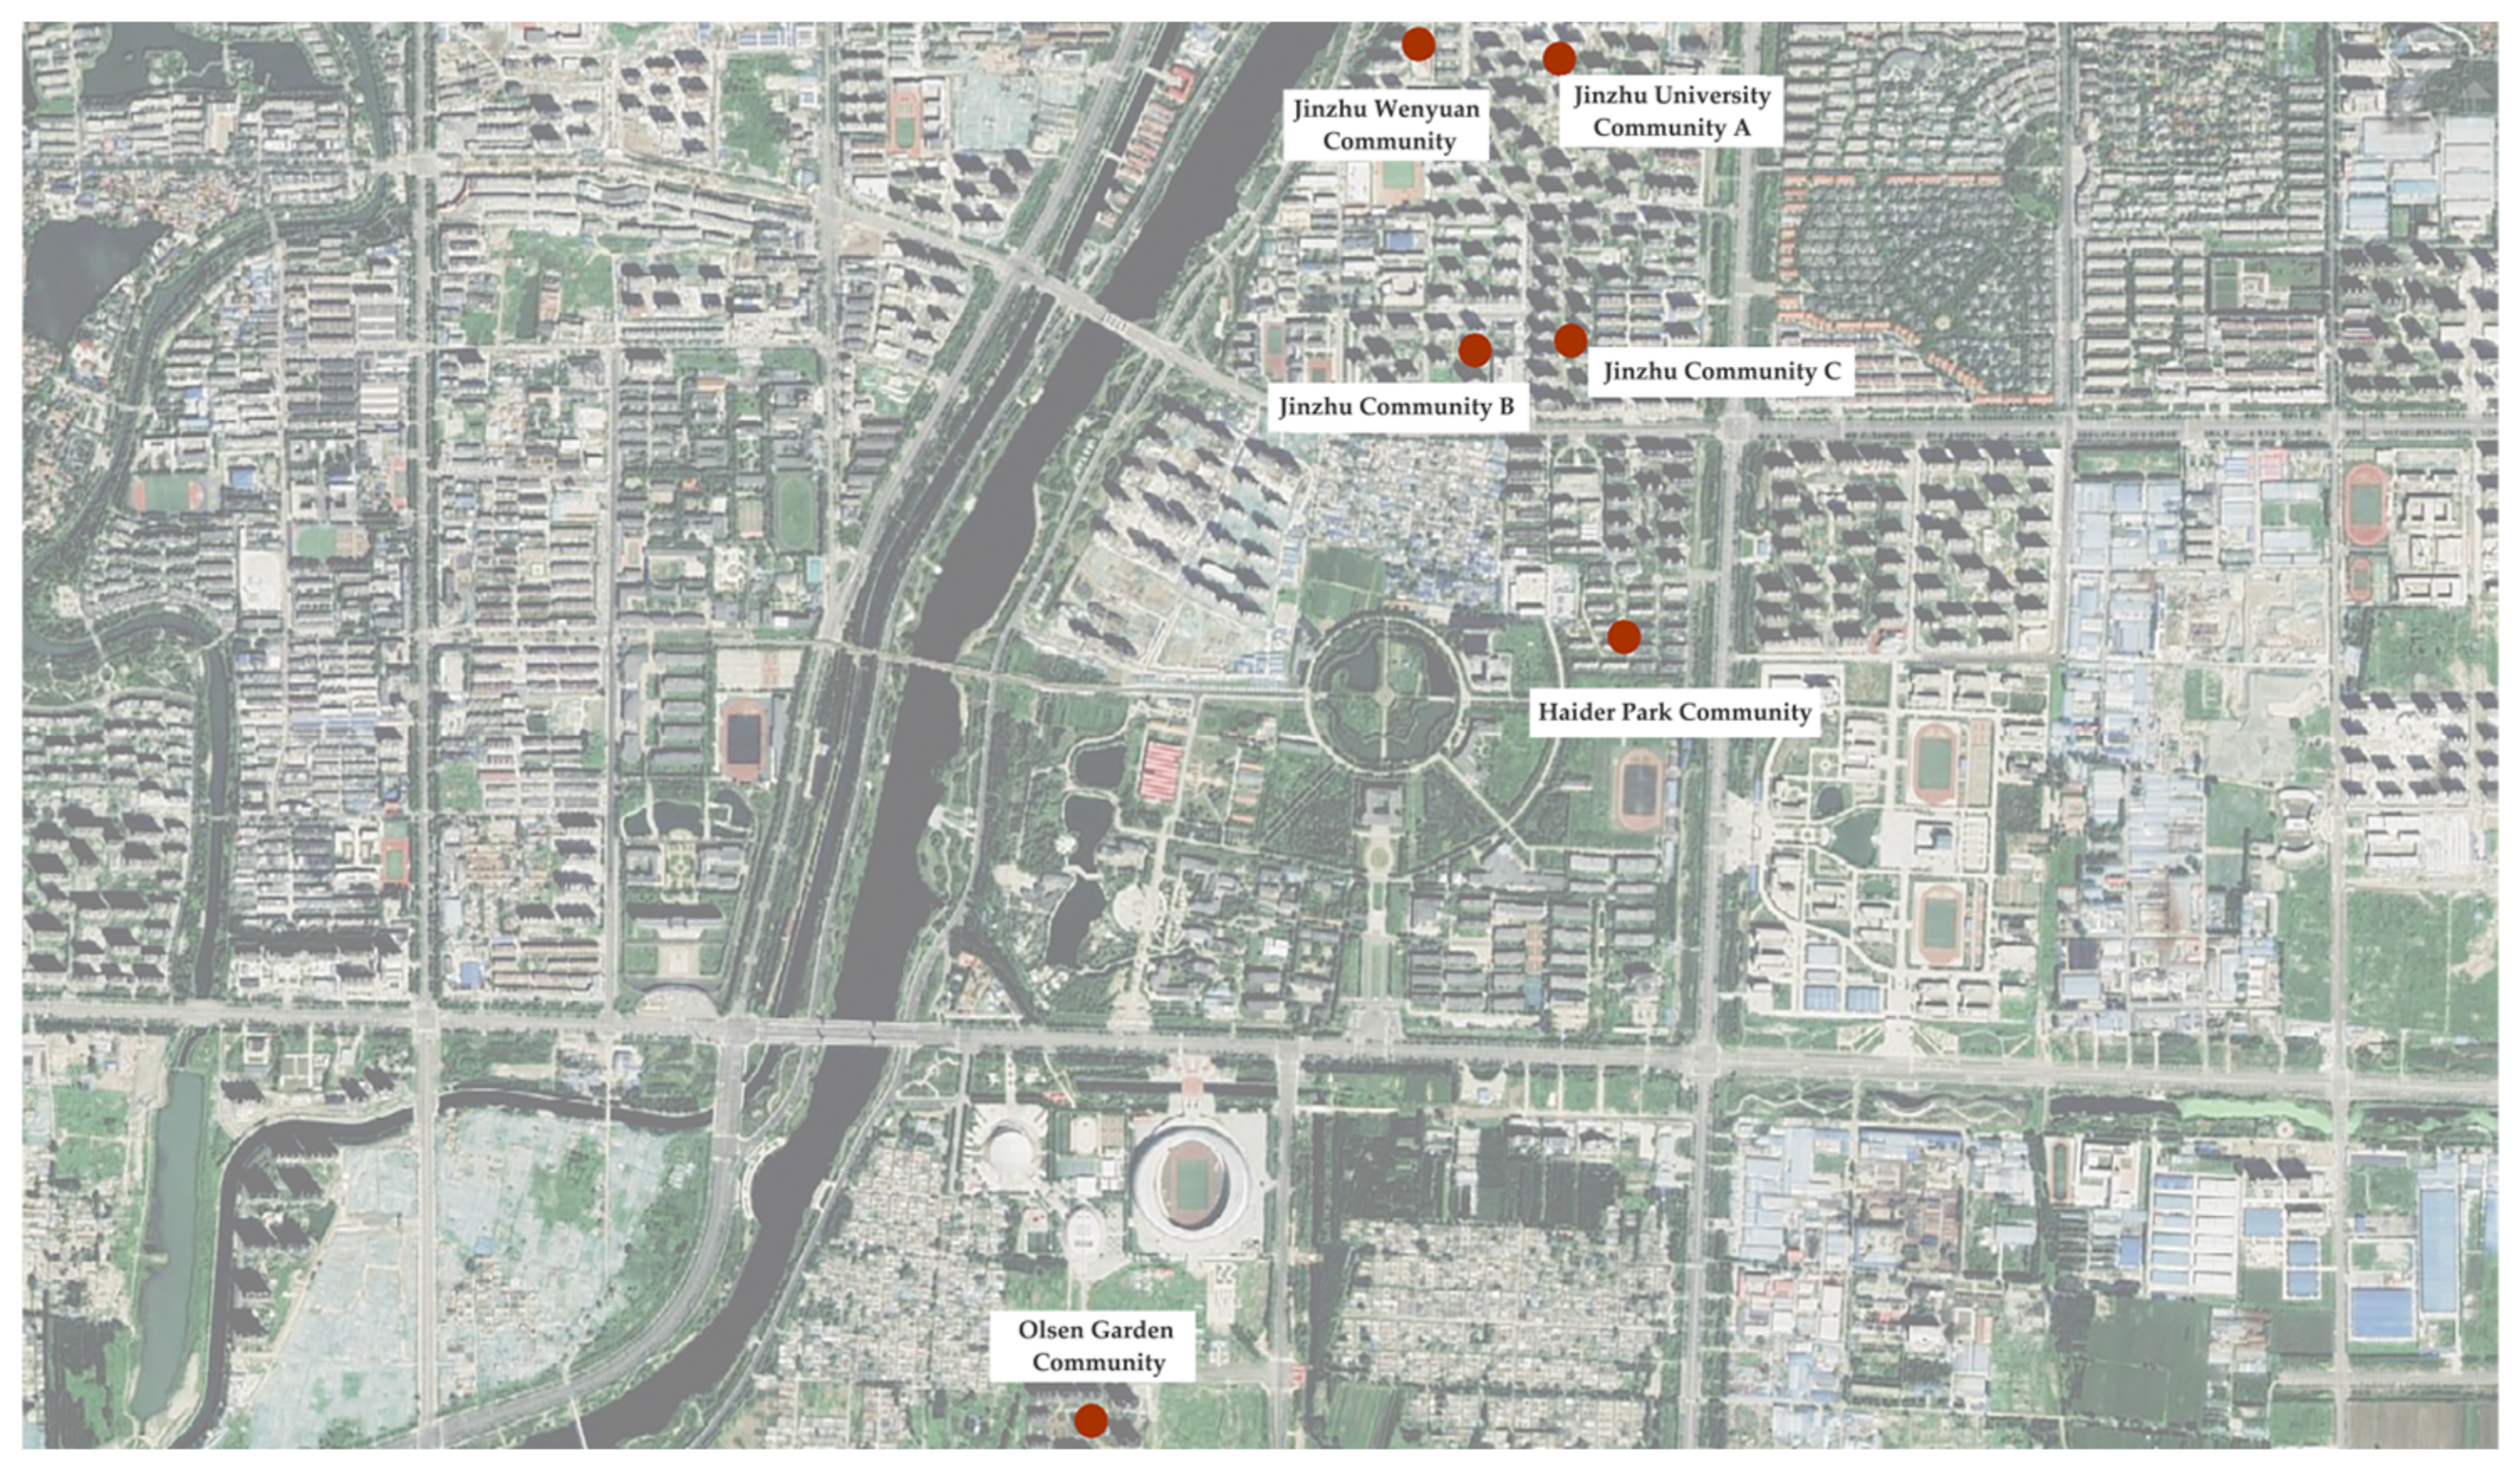
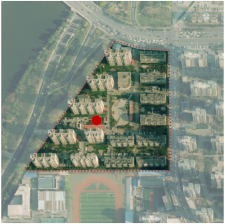
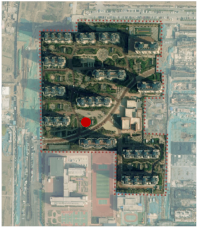
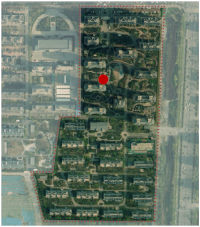
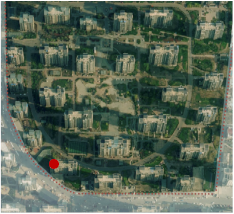
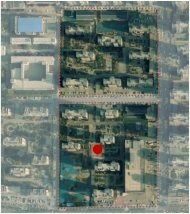
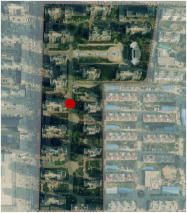
In this study, six communities were selected in Dongchangfu District of Liaocheng City, Shandong Province, which are equipped with community fitness spaces, as the samples. Figure 1 shows the distribution of these samples and their respective geographical locations.
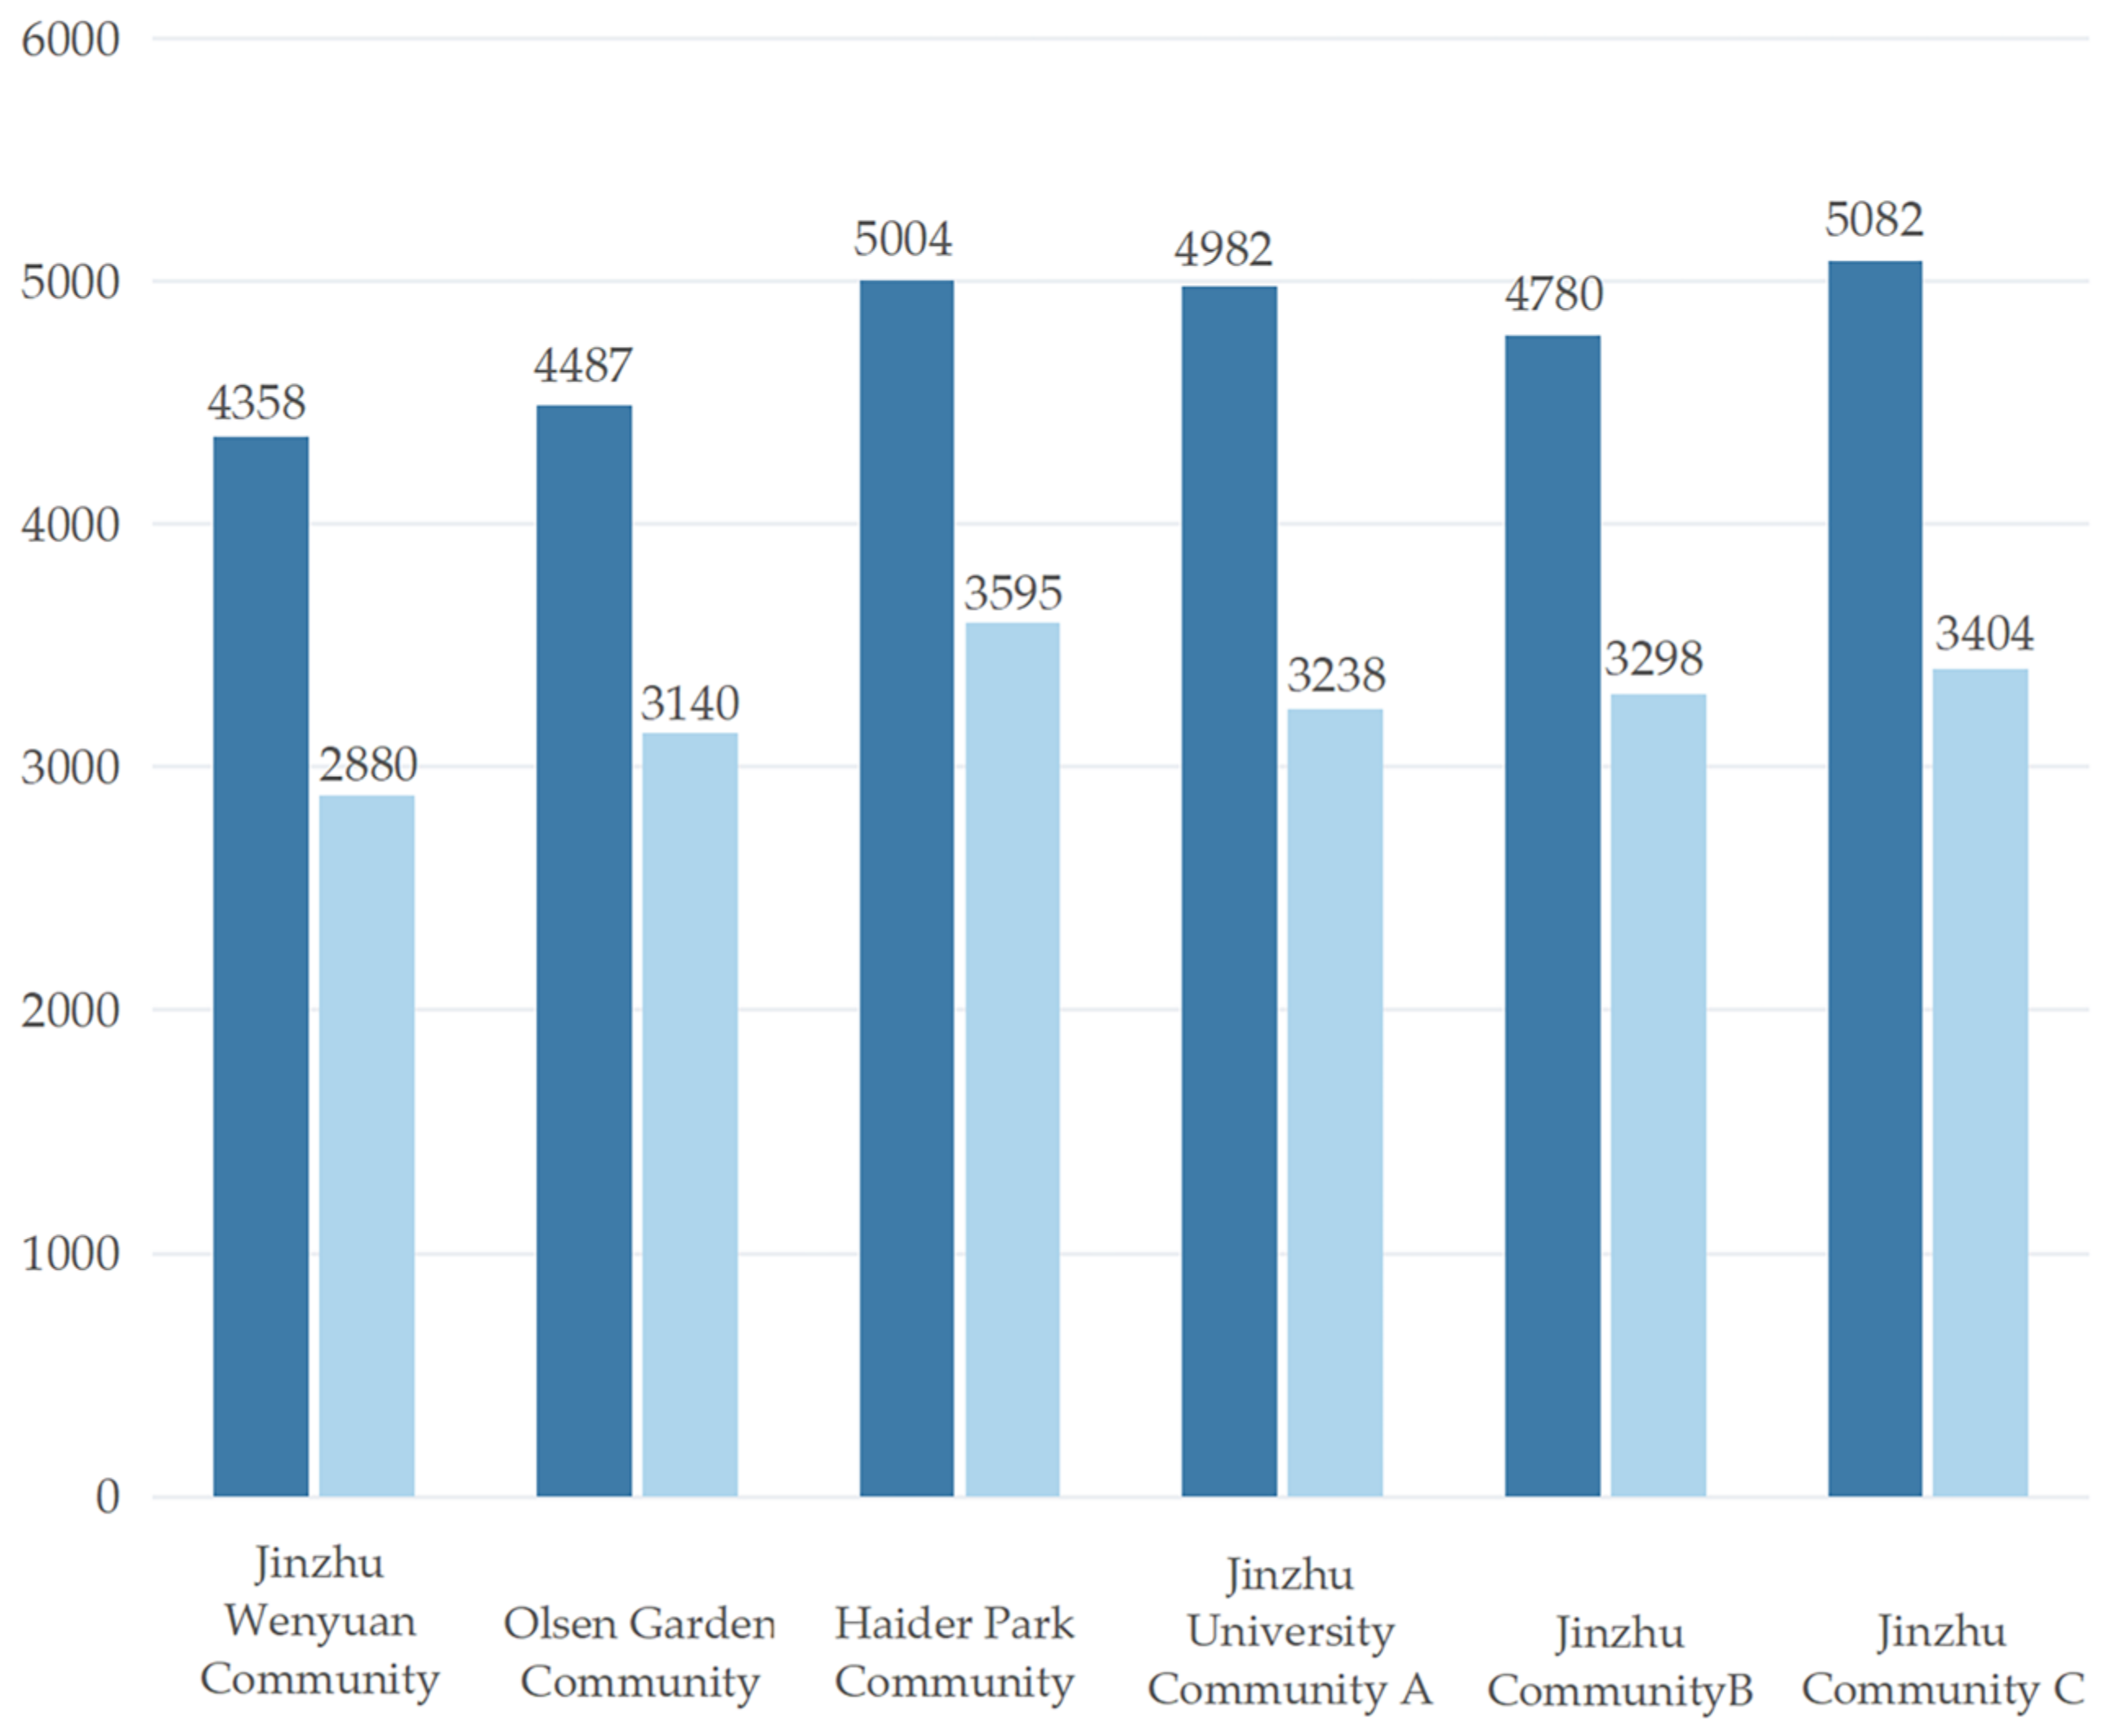
To minimize the influence of non-research factors, the selection of samples followed three principles: (a) these samples need to be newly built communities (completed after 2010), consisting of medium- or high-rise commercial housing districts with high occupancy rates (shown in Table 1); (b) the selected samples should be similar in size and number of residents (shown in Figure 2); and (c) the planning of community fitness spaces in these samples is considered typical, making the results representative and applicable to this type of community.

2.2. Data Sources

Based on previous studies, this research selected the built environment factors that may influence the utilization of community fitness spaces. On the one hand, it includes the validated external factors at the urban scale, such as the accessibility of the fitness spaces [29]. On the other hand, as demonstrated in recent studies on other types of public fitness spaces such as parks, internal factors, including space scale [23,24], facility quality [15], greening [31], and distribution of service facilities [15,25], also impact the use of these spaces. By combining these two aspects, this study considered space accessibility, physical environment (lighting, ventilation, etc.), space sanitary condition, comfort level of fitness facilities, fun of fitness facilities, extent of damage to fitness facilities, size of the fitness space, visible green index (refers to the proportion of the green landscape in the human view), and on-site rest facilities as independent variables. Utilization rates and satisfaction levels were chosen as dependent variables to explore the relationships among these factors.

2.2.1. Acquisition of Independent Variables

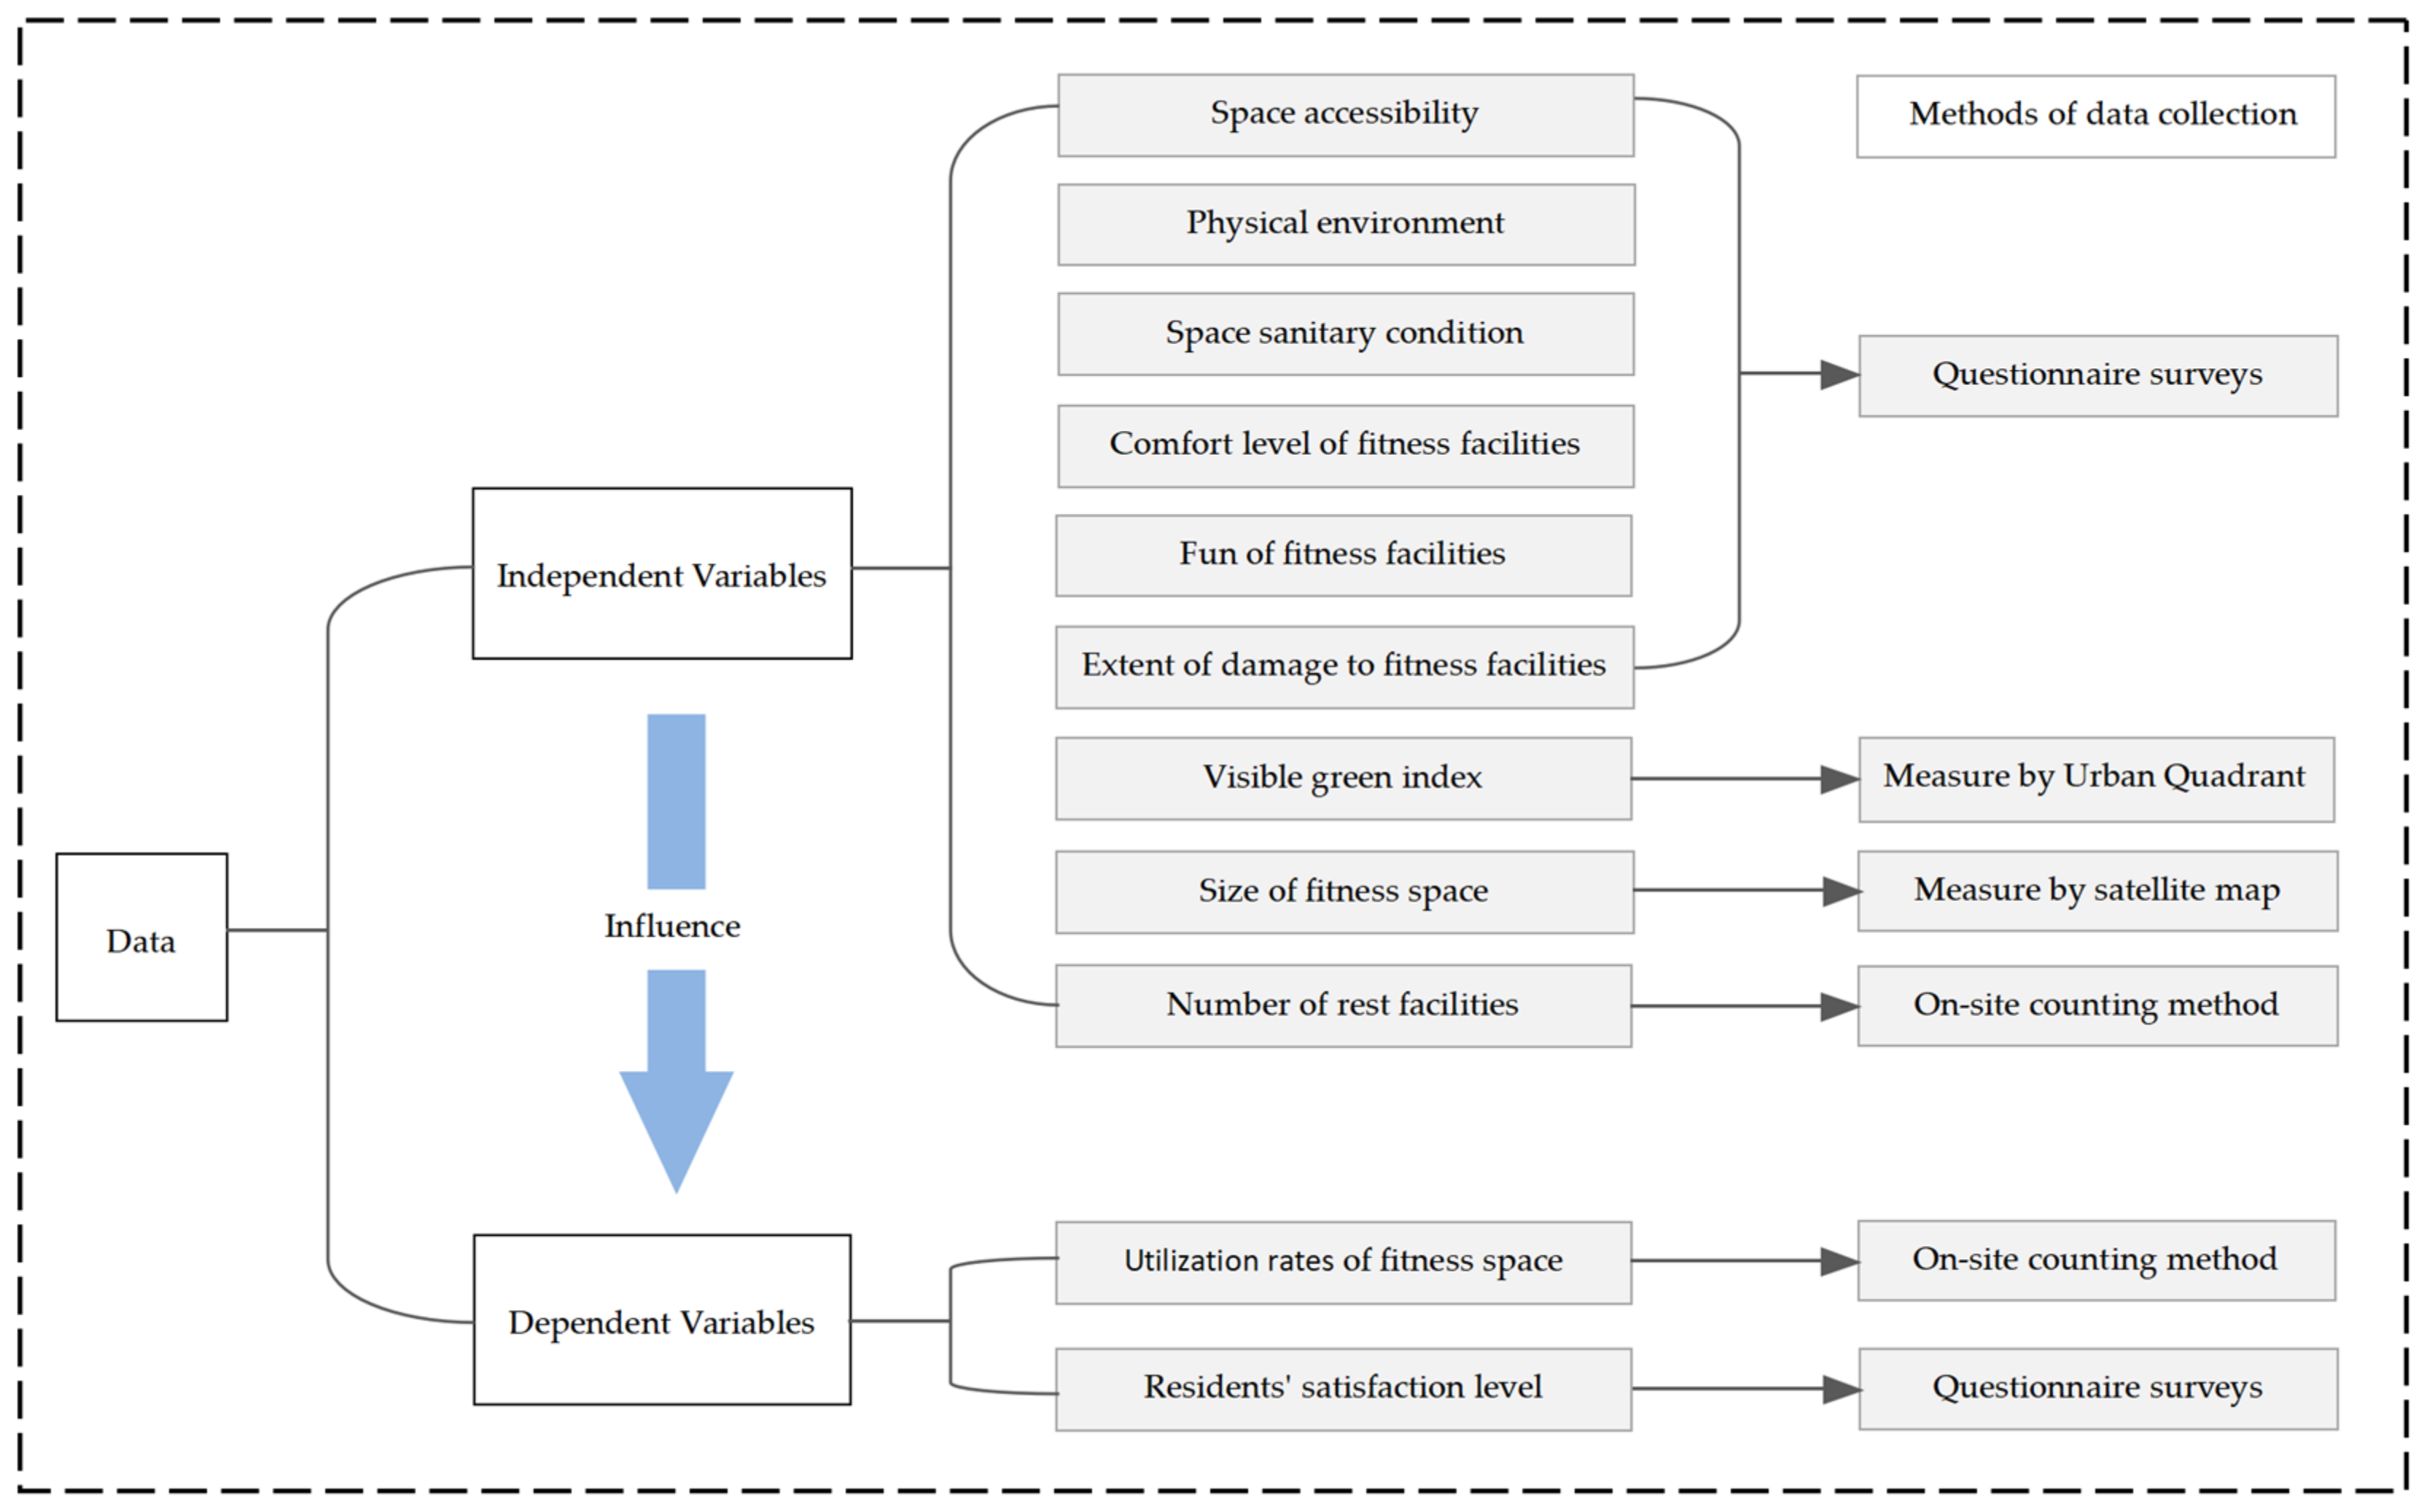
The acquisition of independent variables was mainly performed through the following three methods (shown in Figure 3):
  • Questionnaire surveys
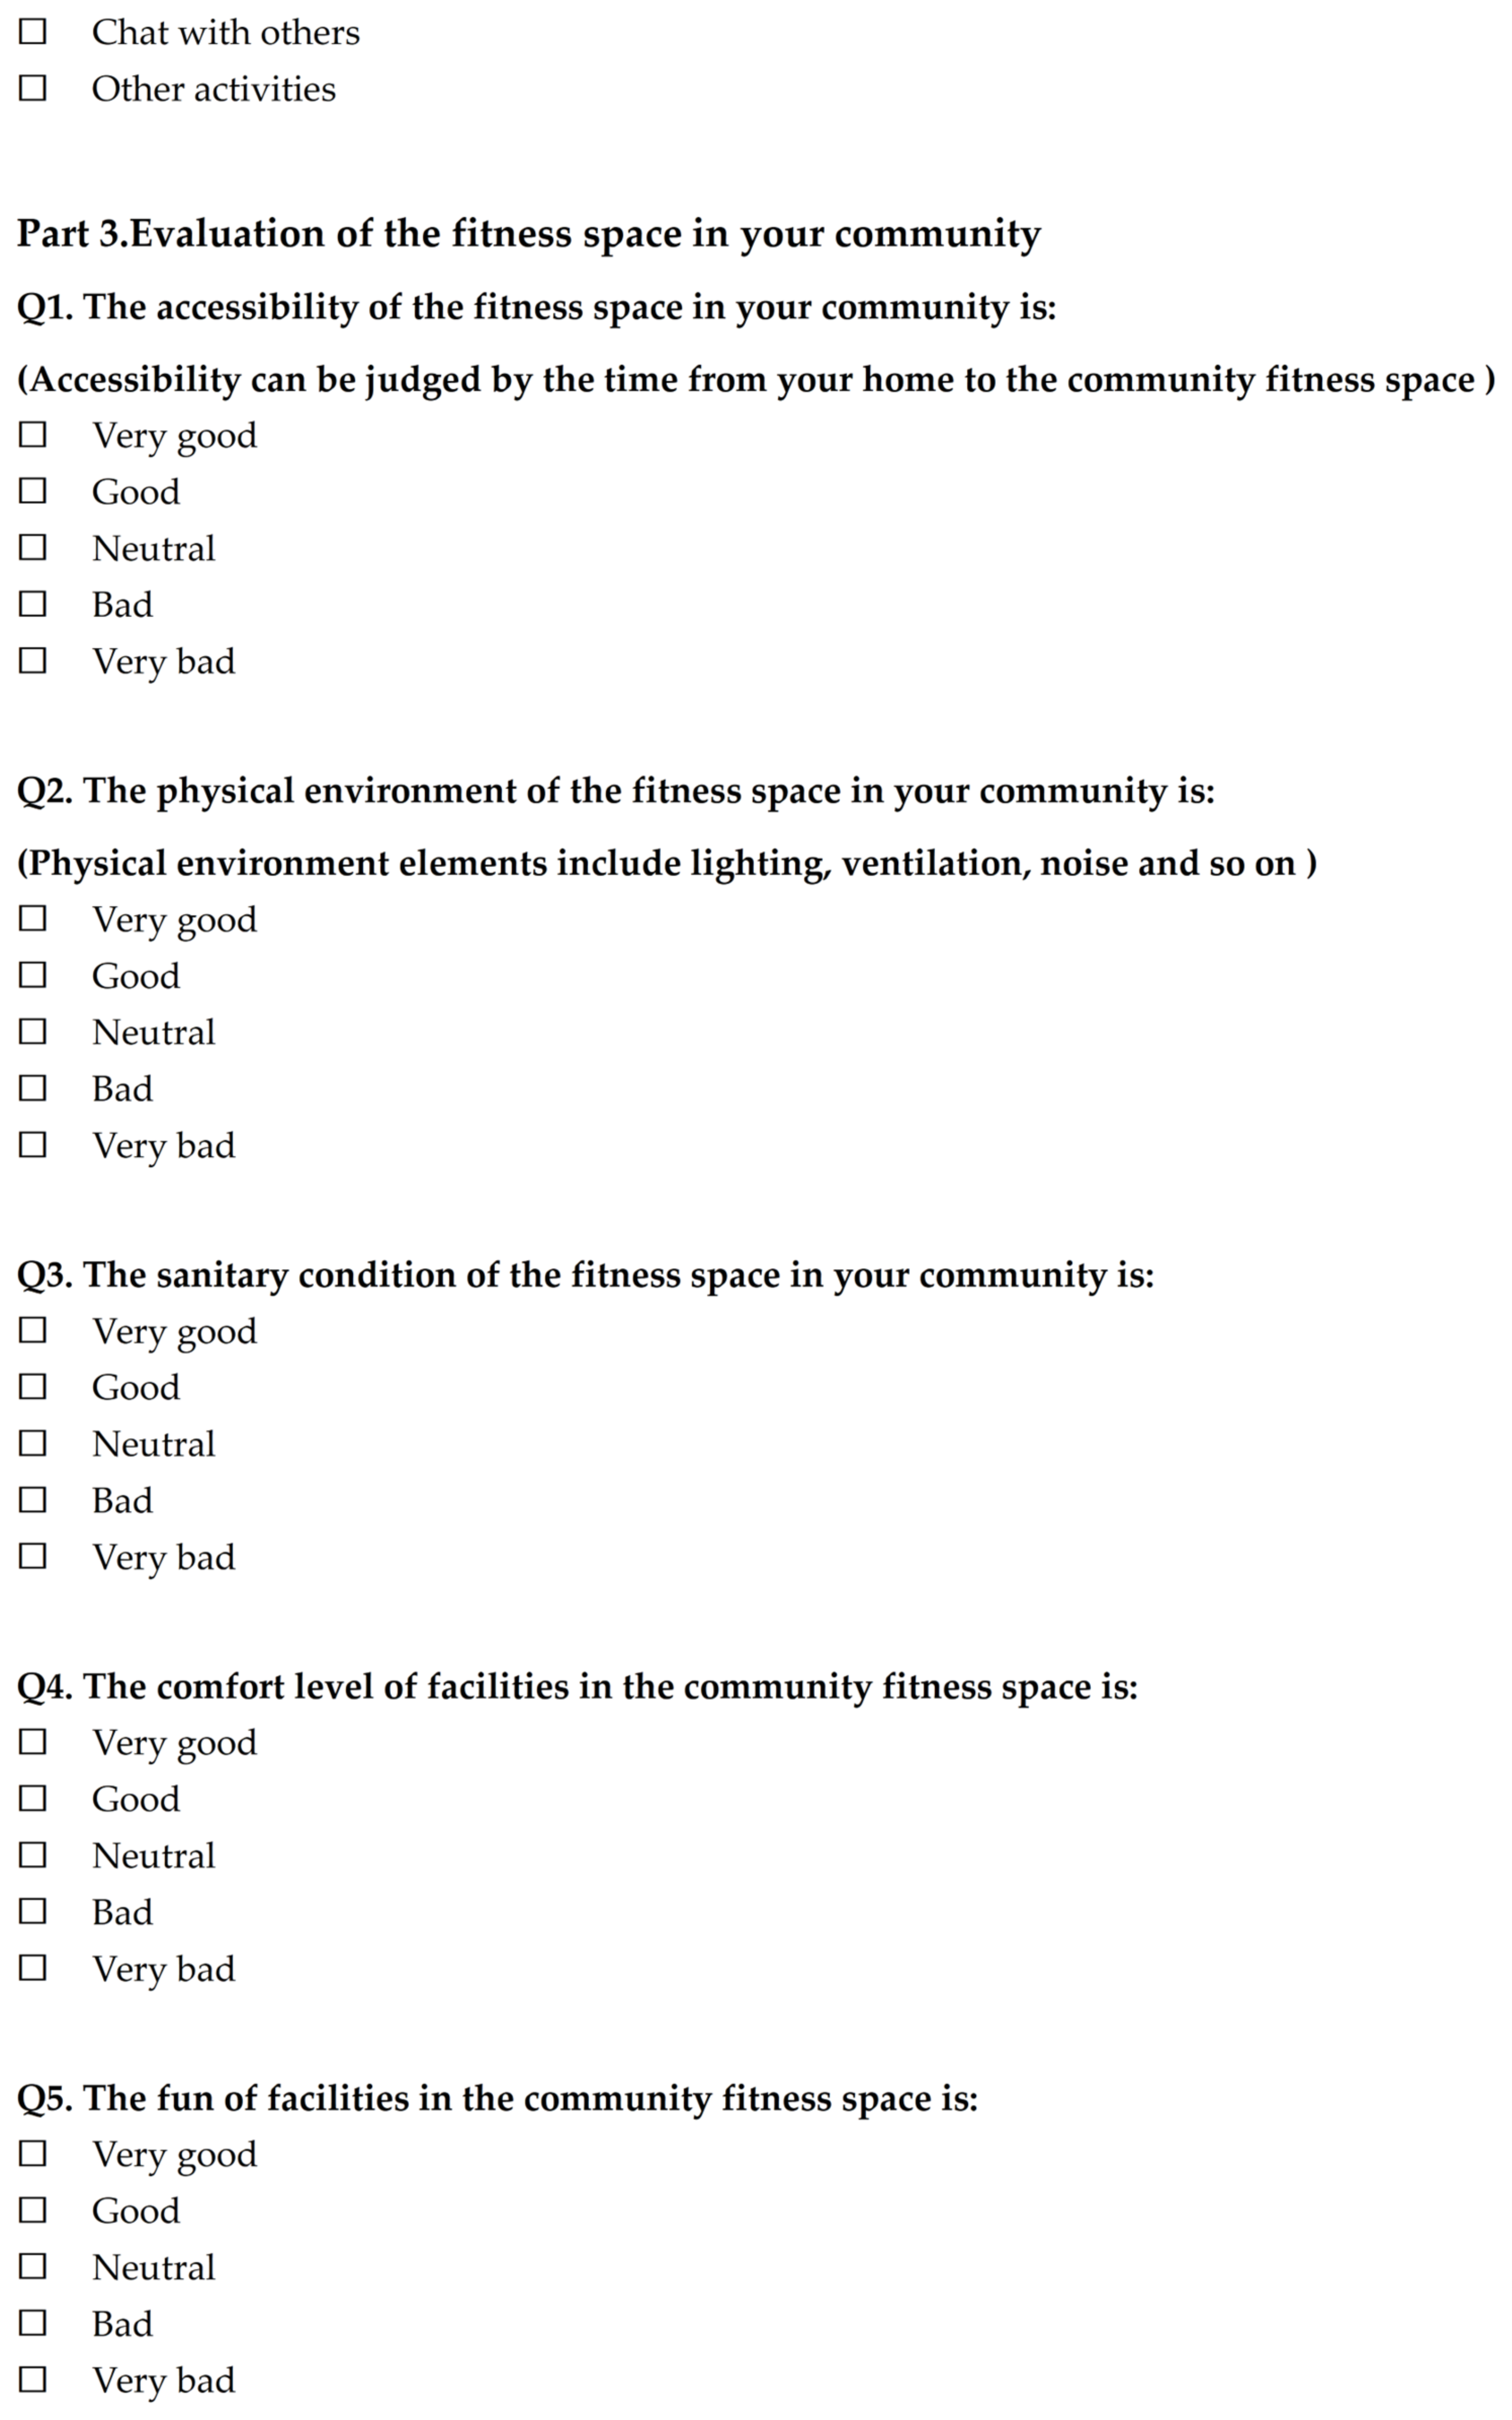
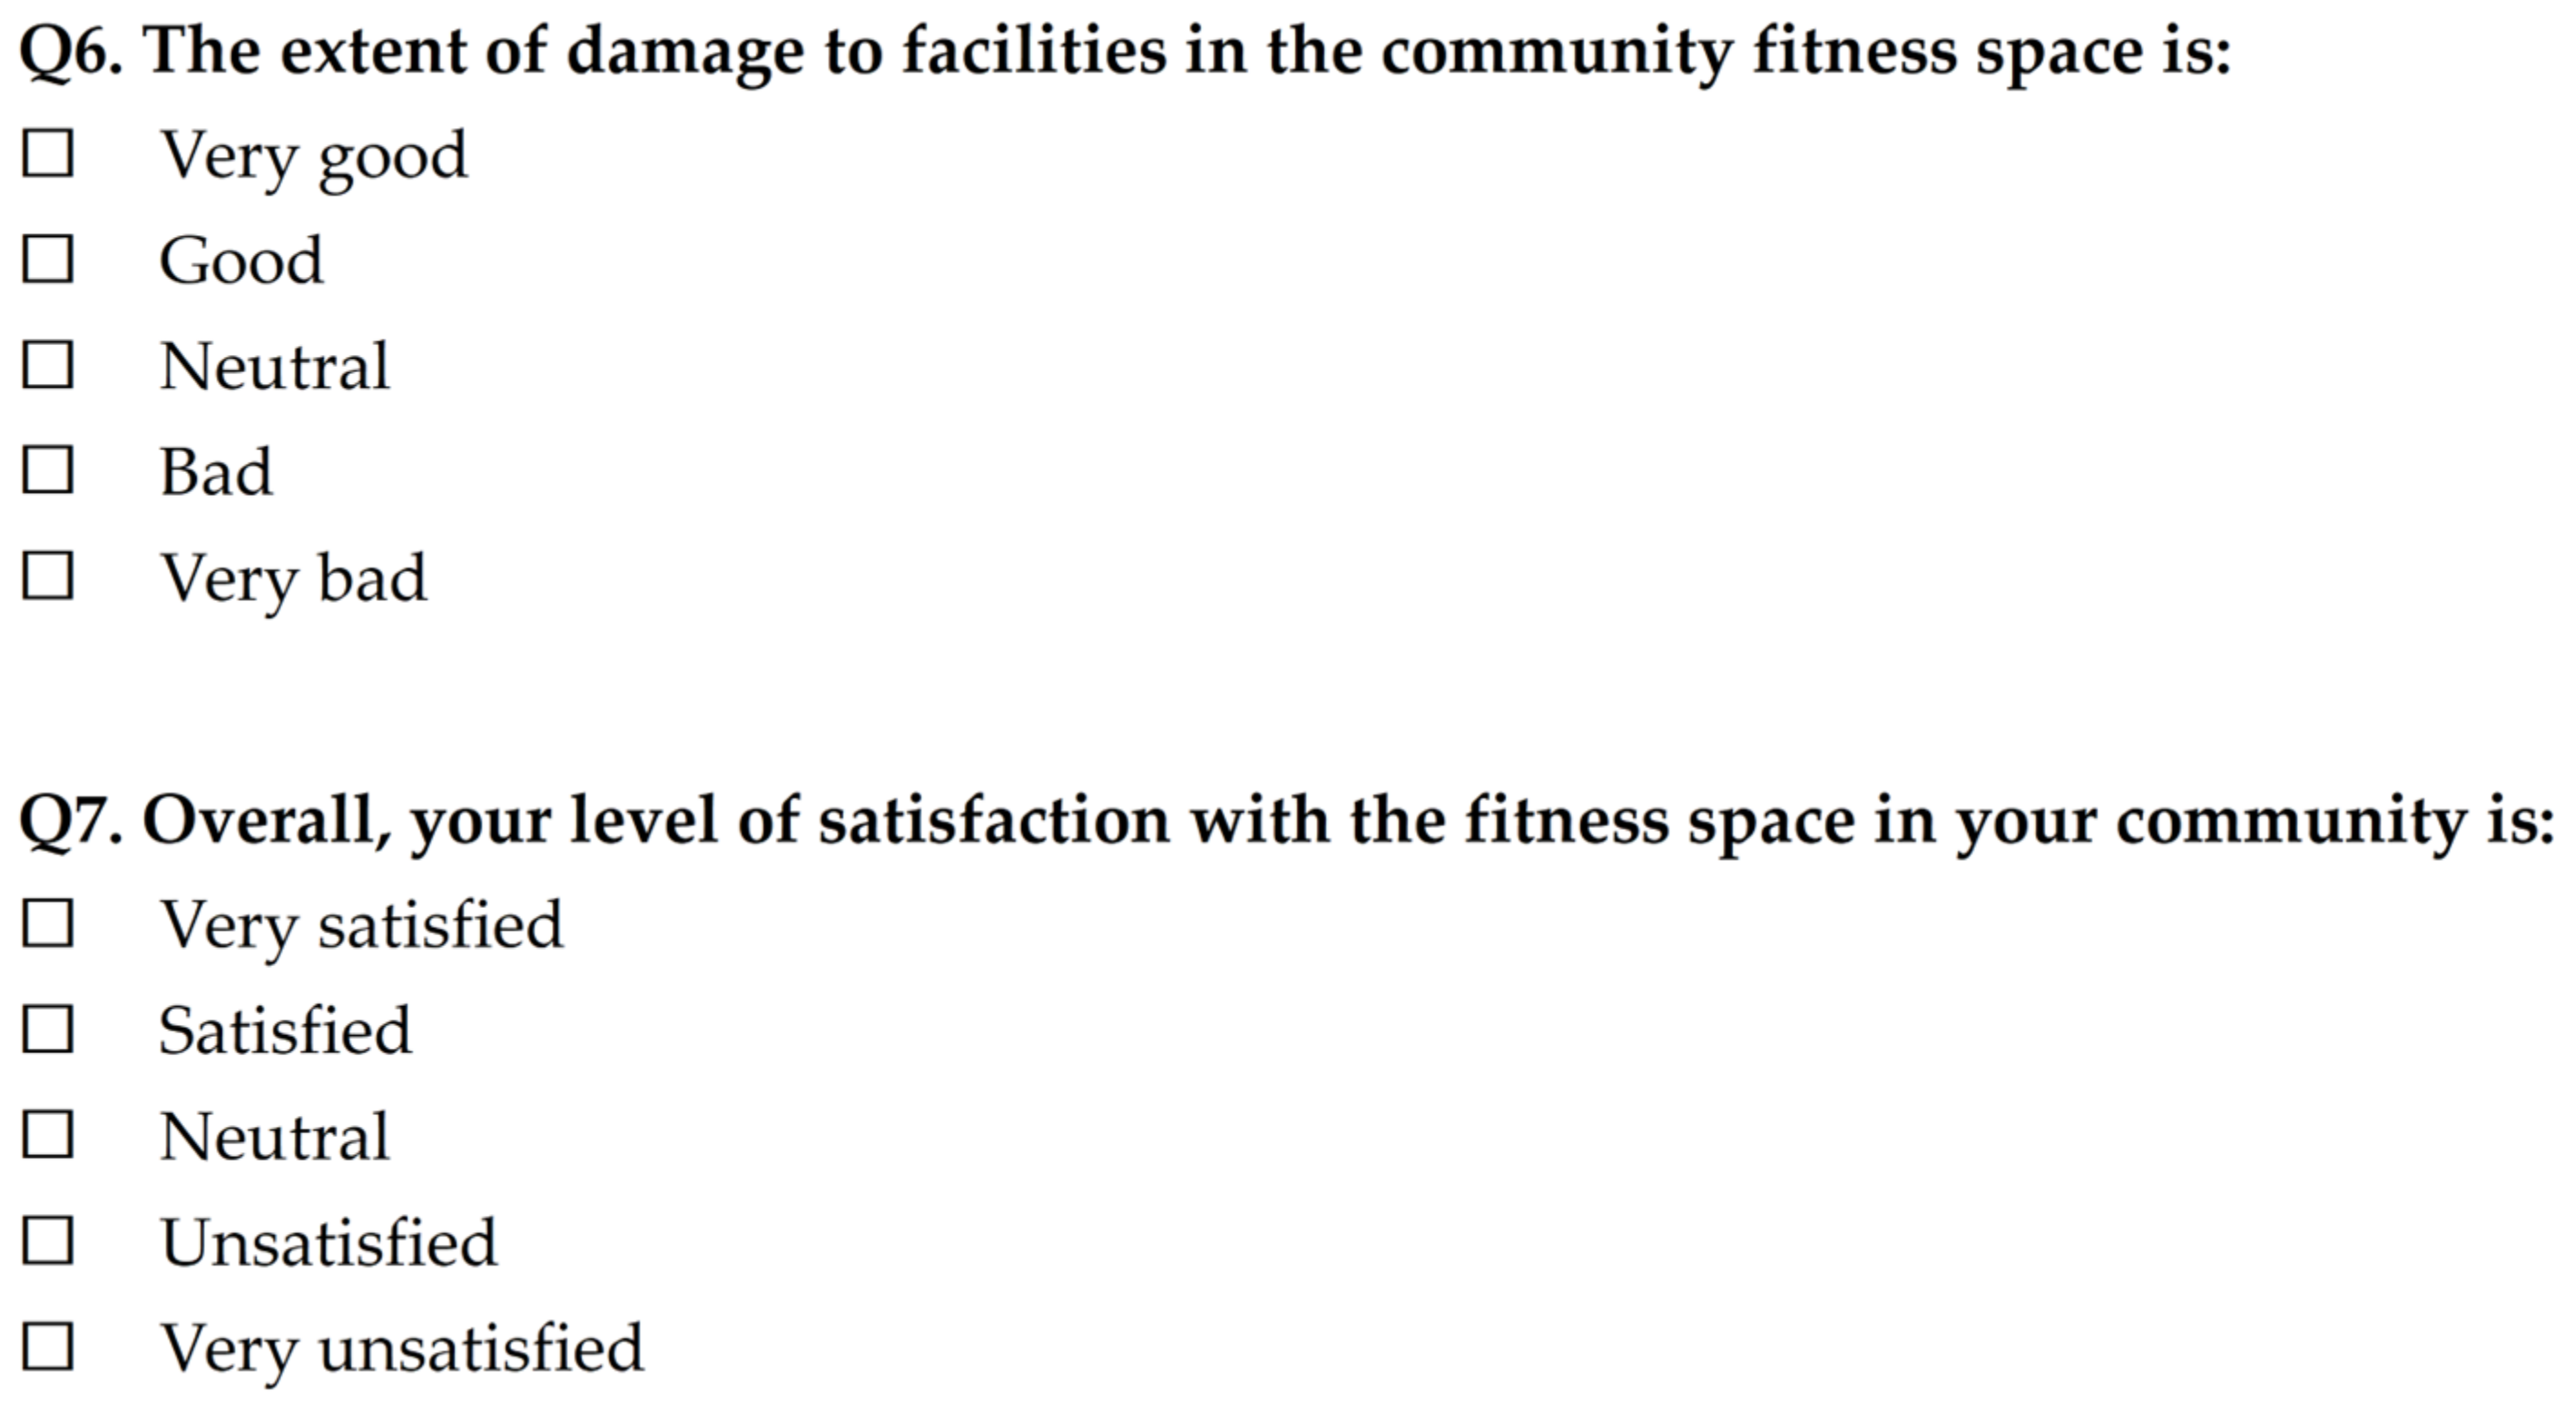
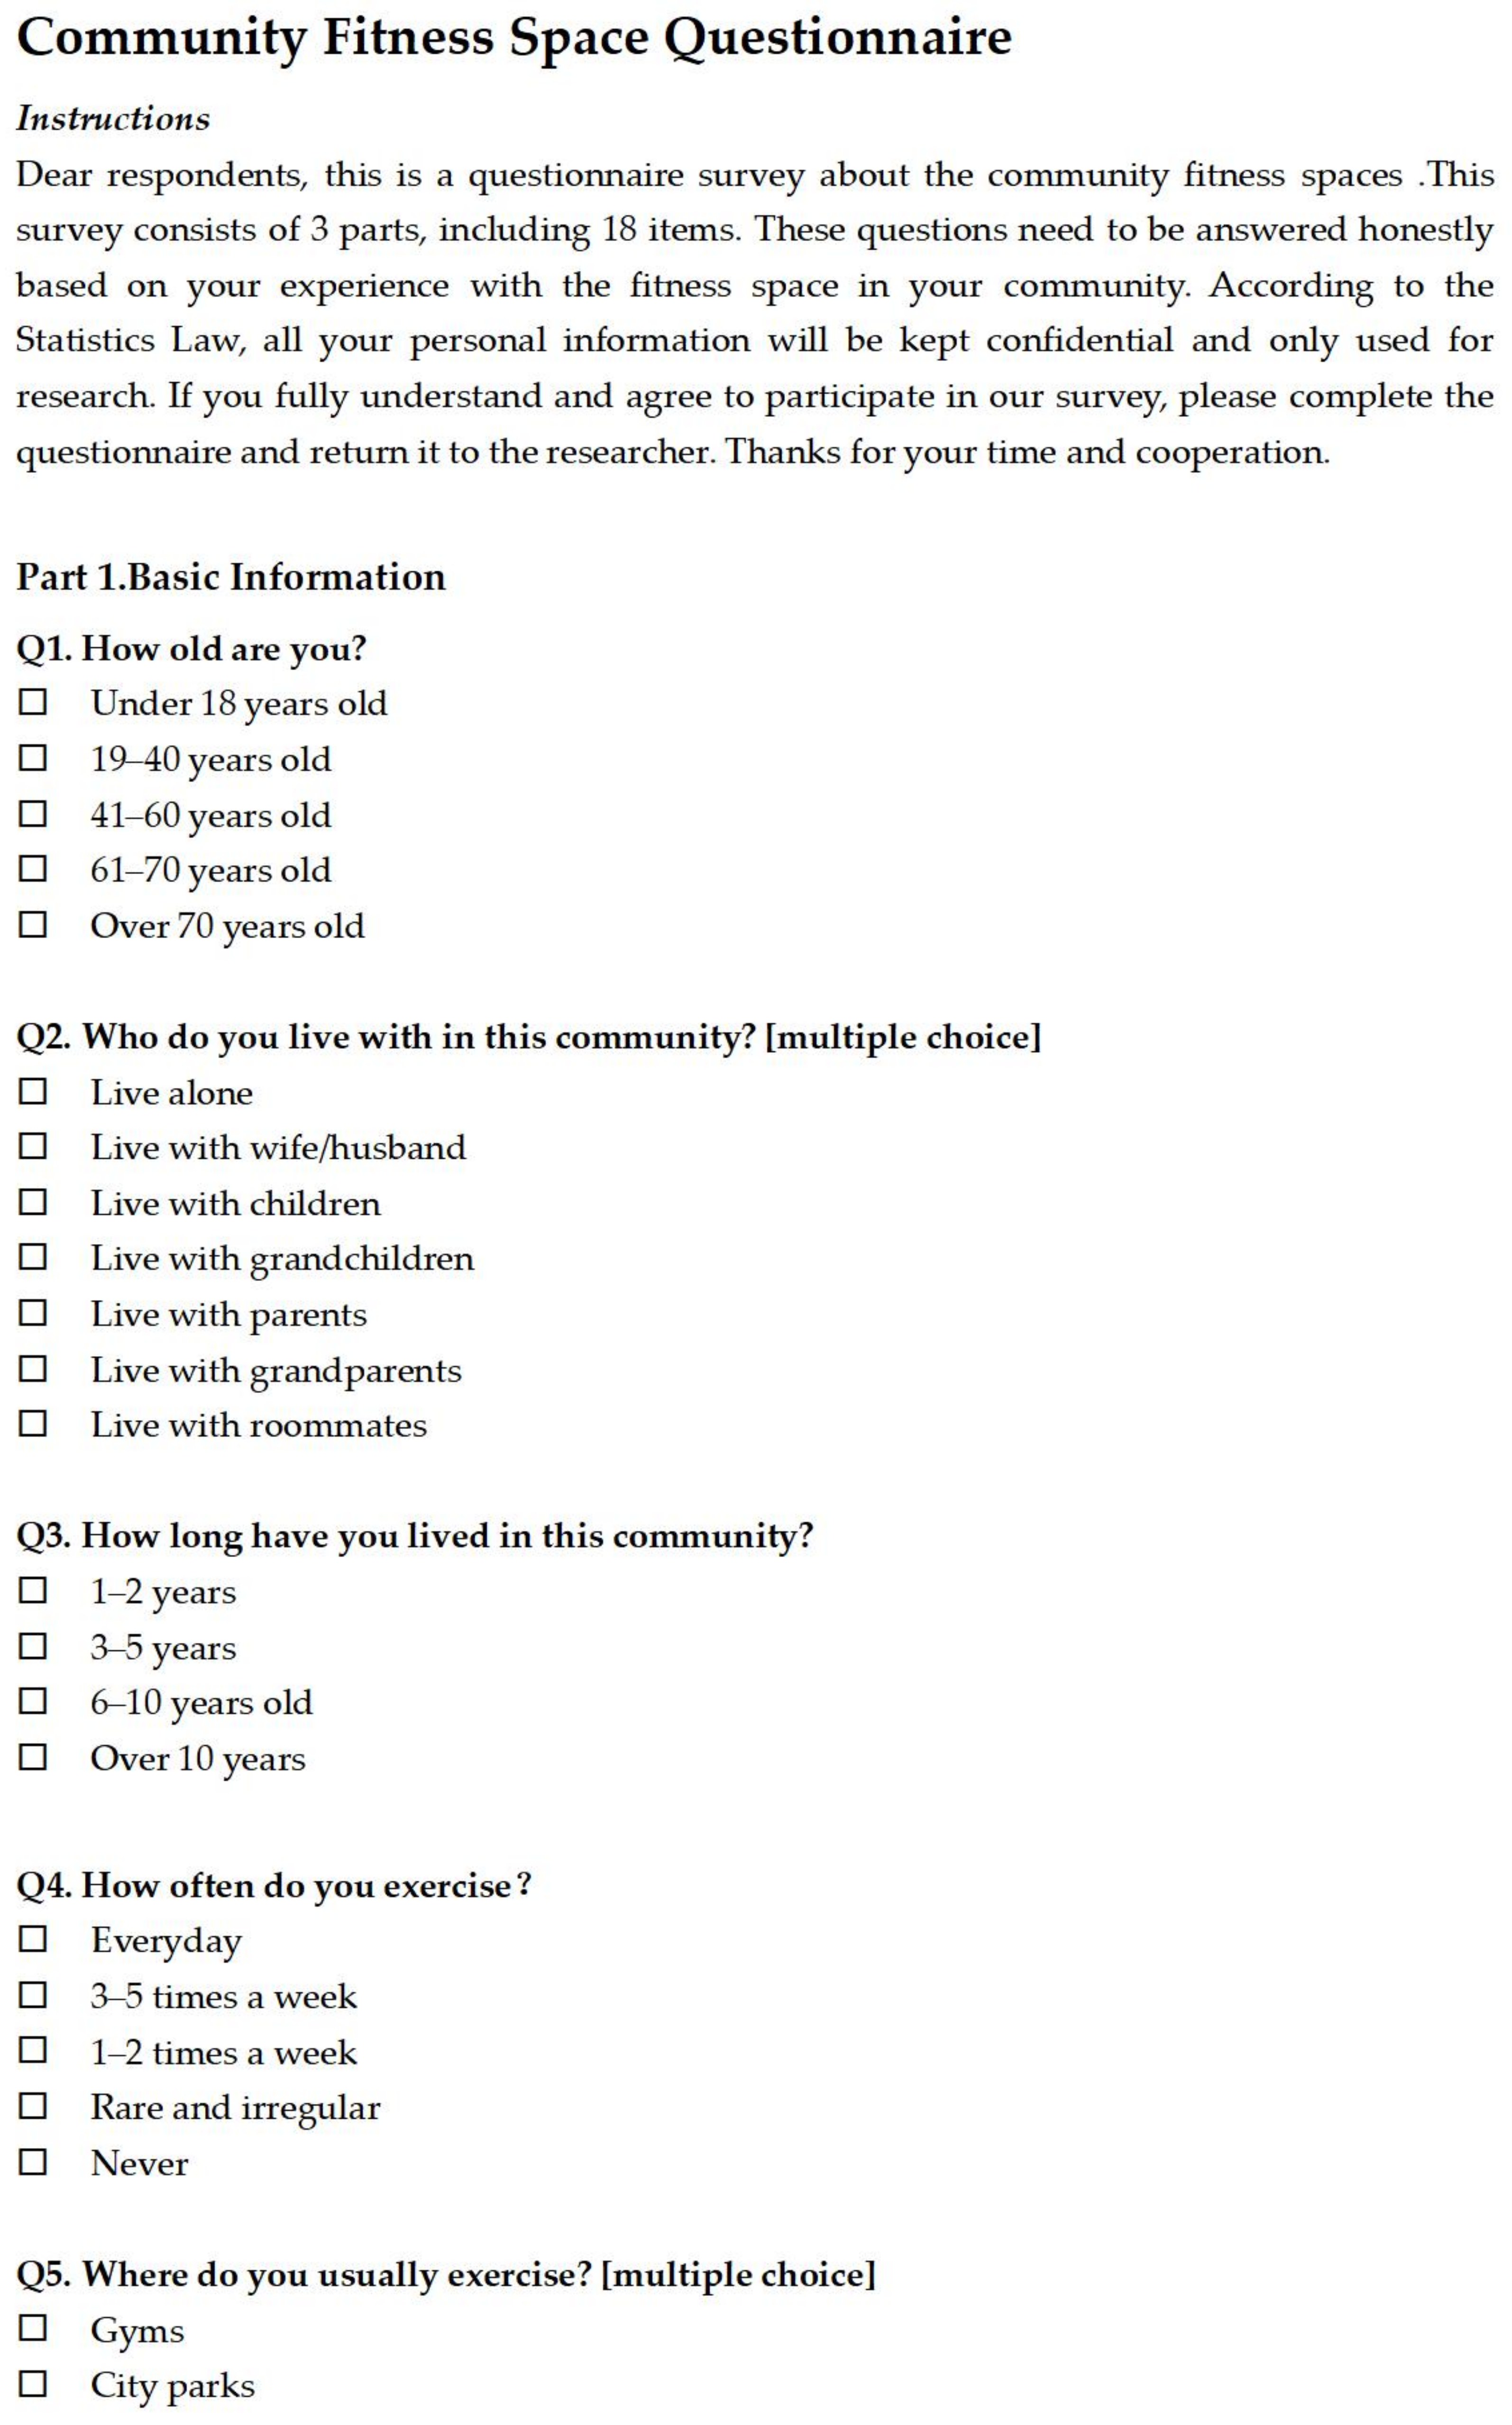
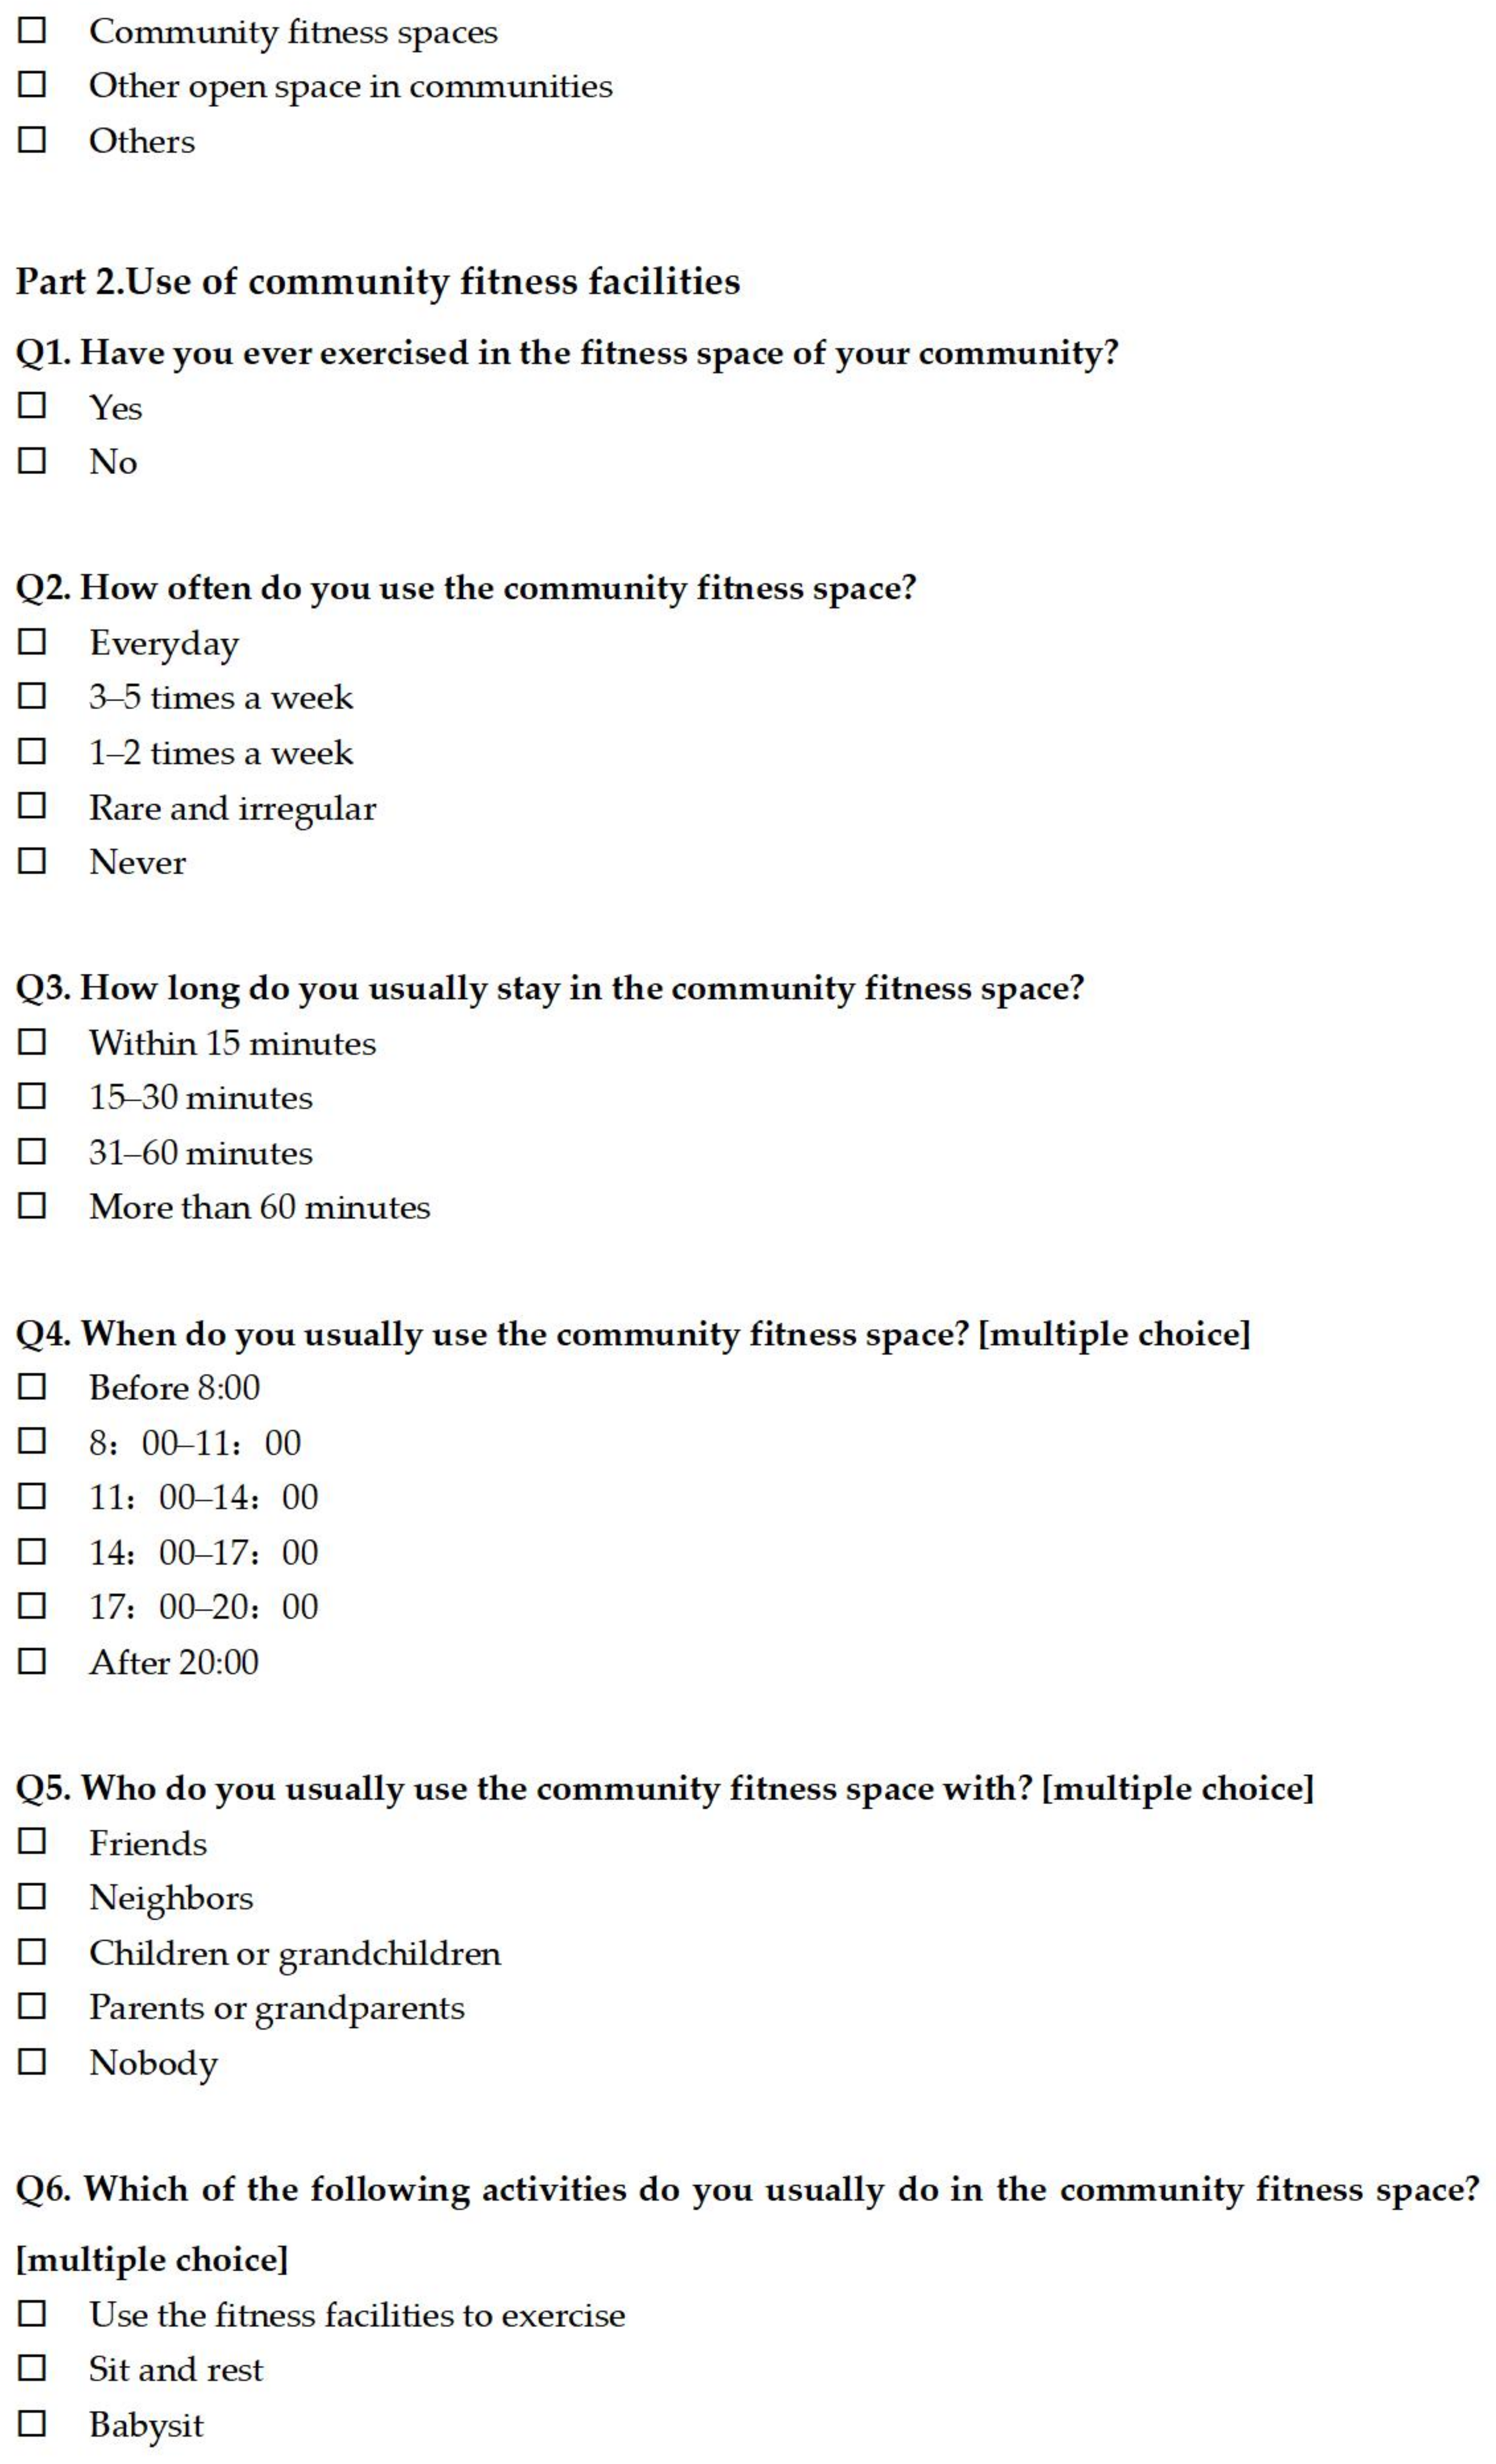
Part of the data was collected by distributing a certain number of questionnaires to residents of the sample communities. As shown in Figure A1, the questionnaire consisted of three parts: Part 1 was basic information about the respondents, comprising 5 items; Part 2 was 6 questions about respondents’ use of community fitness facilities; and Part 3 was an evaluation of fitness spaces in respondents’ communities. By quantifying the five options in Part 3 into scores using the 5-point Likert scale (ranging from 5 to 1), these results were used as follow-up data for further analysis.
For a comprehensive coverage of users in sample communities, questionnaire surveys were conducted both online and offline. Offline surveys refer to distributing questionnaires to the users of each community fitness space on the spot, while online distribution of electronic questionnaires was conducted in WeChat groups containing only households from each sample community. In the process, informed consent was obtained from all the involved respondents. Finally, 65 questionnaires were distributed to each sample, and 291 valid questionnaires were collected.
Table 2 shows respondents’ characteristics for each sample, including age, lifestyle, length of residence in sample communities, frequency, and place of exercise. It can be seen that respondents’ frequency of exercise was basically similar among these sample communities, which means the usage difference caused by residents’ own fitness level was minimal and can be ignored in this study.
  • Urban Quadrant
To quantify the greenery of the community fitness space, an on-site survey applet named Urban Quadrant was used. This applet functions as a community observation tool based on mobile Internet and computer vision [32], and it can automatically calculate the number of people, motor vehicles, visible green index, and other indicators in the pictures taken by users during their research. Since its creation in 2018 [33], Urban Quadrant has been widely used to assess how much greenery people perceive in areas such as streets and communities by measuring the proportion of greenery that is visible to people [34,35,36].
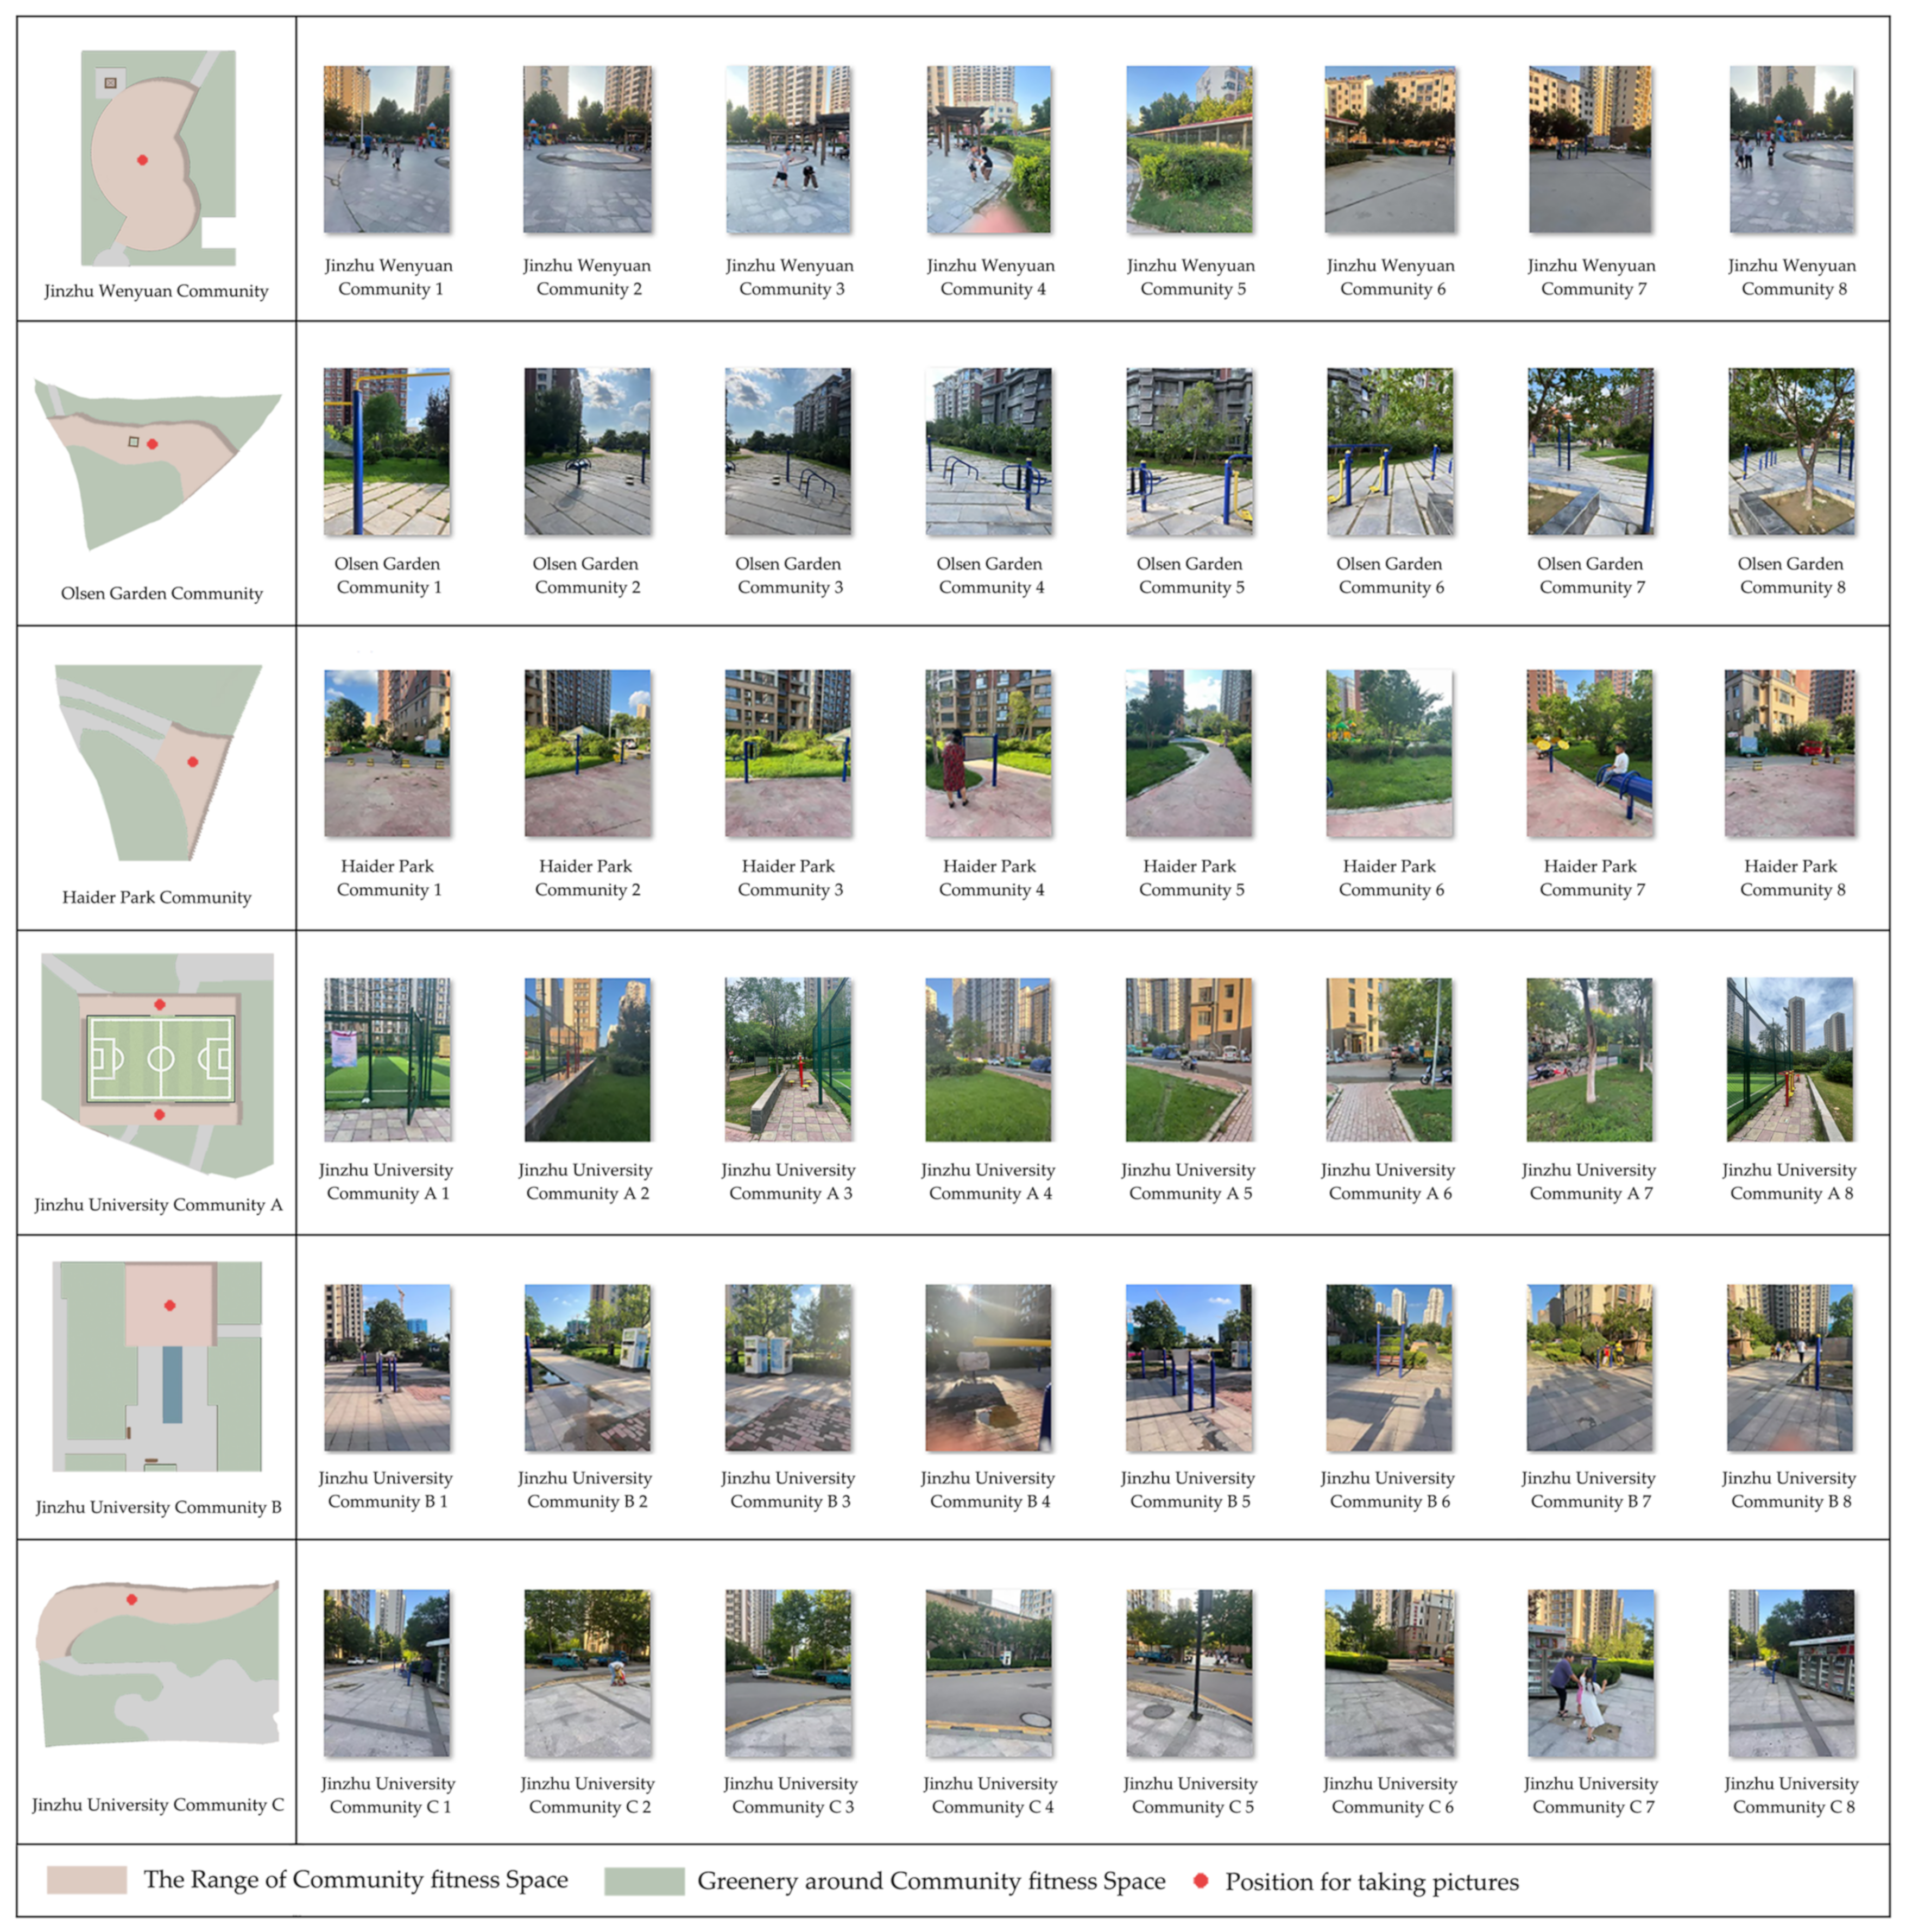
To effectively visualize the amount of greenery in the view of users during their exercise, this research chose the center of each community fitness space as a photographic point and took 8 photos of the surrounding greenery from there at the height of human perspective (1.7 m) (see Figure 4). By acquiring the green ratio of each photo and calculating the average value of them using this applet, the visible green index of each sample was represented.
  • PSPL survey
Public space and public life (PSPL) survey was proposed by Jan Gehl [37]. The on-site observation and counting method is the most important method to determine the usage of the space. In this study, we recorded the number of rest facilities and their users inside the fitness spaces using this method.

2.2.2. Acquisition of Dependent Variables

The dependent variables in this study include utilization rates and satisfaction levels. Utilization rates were acquired by the PSPL method. Considering the users’ visitation patterns may vary at different times of the day and differ between weekdays and weekends [38,39], the collection of utilization was conducted on two weekdays and a weekend, including five time slots. The number of users of each community fitness space on these days was recorded and summed to represent the utilization rate (Table 3). Since the observation was completed in the public domain, informed consent from subjects was unnecessary [40].
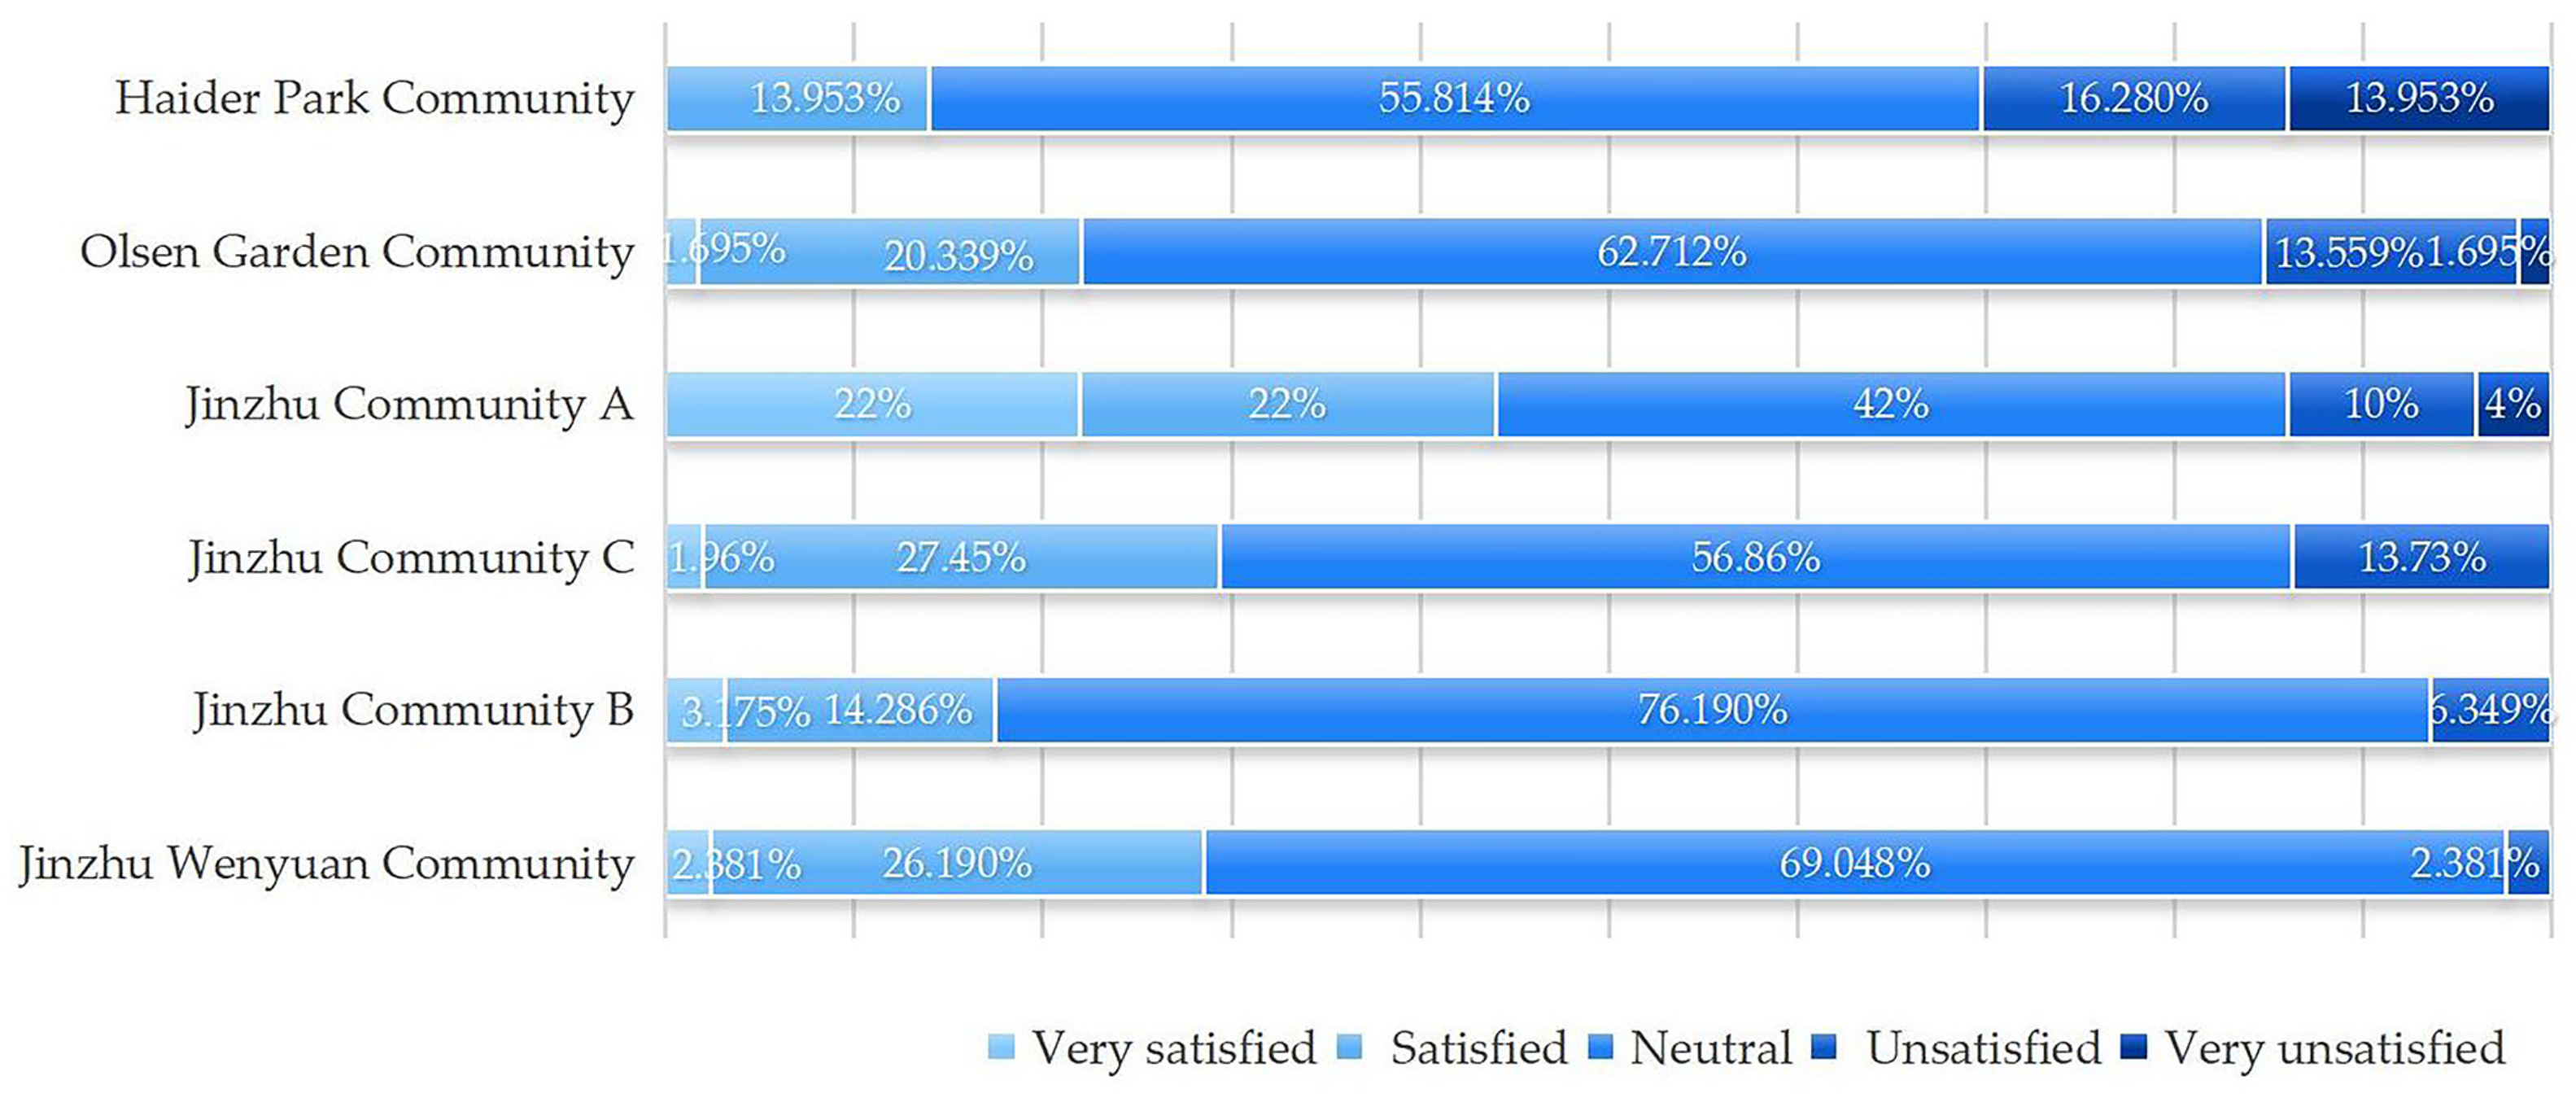
Satisfaction levels were determined by asking the respondents how satisfied they were with the fitness space in the community they lived in. The answers were quantified and averaged to represent the satisfaction level of each sample. The average satisfaction levels of six sample communities are visualized in Figure 5.

2.3. Methodology

Regarding the follow-up data processing, a quantitative analysis method was adopted to identify the factors that impact the use of community fitness spaces and calculate their influence degrees using SPSS 26. Firstly, the reliability and validity of the questionnaire data were analyzed. After passing the test, factor analysis was carried out on this data to screen for factors. Then, the newly obtained factors were subjected to correlation analysis together with the size of the fitness space, visible green index, and rest facilities on site. The factors related to utilization rates and satisfaction levels were derived. Finally, their degrees of influence were determined, and the factors with the greatest influence were selected through multiple linear regression analysis.

3. Results

3.1. Reliability and Validity Tests of Questionnaires

To verify the quality of the questionnaire results, this study initially used SPSS software to test the reliability and validity of the questionnaire scale.
The Cronbach’s alpha coefficient scale was calculated to assess the reliability of the questionnaire scale [41,42]. After calculation, the Cronbach’s alpha coefficient was found to be 0.702, and the Cronbach’s alpha coefficient based on standardized items was 0.733, both higher than the standard value (Table 4). These results indicate that the data obtained from the questionnaire exhibited good internal consistency and could be used for further analysis.
The validity test primarily employed principal component analysis and the maximum variance rotation method to extract the common factors of each index set in the questionnaire. Additionally, the study conducted the KMO test and the Bartlett spherical test for variables. The KMO value was calculated as 0.754, and the significance of the Bartlett sphericity test was determined to be 0.000 (Table 5). These results confirmed that the scale data demonstrated good structural validity, allowing for continued factor analysis.

3.2. Factor Analysis

Once the above tests met the required standard, the study proceeded with exploratory factor analysis using the principal component analysis method on the six potential influencing factors obtained from the questionnaire. The results indicated that the six indicators could be summarized into four principal components, with a total variance contribution rate of 87.475% (Table 6), surpassing the standard. This outcome aligned with the previous hypothesis.
The indicators with factor loads greater than 0.5 were filtered from the rotated component matrix and extracted as four new potential variables named space maintenance, physical environment, fitness facility quality, and space accessibility according to their properties (Table 7).

3.3. Correlation Analysis

The four indicators obtained through factor analysis, along with the non-questionnaire data, including the size of the fitness space, the visible green index, and the number of rest facilities on site, were considered independent variables for the subsequent verification and analysis. Pearson correlation analysis was initially employed to explore the linear relationship between the utilization rates and satisfaction levels of community fitness spaces and the seven independent variables, respectively. The results revealed that the utilization rates and satisfaction levels of community fitness spaces showed a significant correlation with five factors: Physical environment, fitness facility quality, visible green index, size of the fitness space, and rest facilities on site (p < 0.05). Except for the negative correlation between the visible green index and utilization rates, the other independent and dependent variables demonstrated a positive correlation. No significant correlation was found between the utilization rates and satisfaction levels with space maintenance and accessibility (p > 0.05) (Table 8).

3.4. Multiple Linear Regression Analysis

To determine the degree of influence of each factor and rank them, this study employed the five factors obtained previously, including the physical environment, fitness facility quality, visible green index, size of the fitness space, and rest facilities on site, as independent variables and the utilization rates and satisfaction levels of the fitness space as dependent variables for multiple linear regression analysis. The results were as follows:
Firstly, the utilization rate was used as the dependent variable for regression. In the analysis results (see Table 9), the R2 value was 0.777, the Durbin–Watson result was 1.691, and the VIF value was close to 1, indicating an ideal model. By comparing the standardized regression coefficients of the five factors (see Table 10), it can be concluded that the variables’ degree of influence on the utilization rate is as follows: Rest facilities on site (0.804) > visible green index (−0.275) > size of fitness space (0.144) > physical environment (0.082) > fitness facility quality (0.062). Apart from the negative correlation between the visible green index and the utilization rate of fitness space, the other factors exhibited a positive correlation with the utilization rate.
A multiple linear regression model was established again, this time with satisfaction levels as the dependent variable. The analysis resulted in an R2 value of 0.291, a Durbin–Watson result of 1.785, and a VIF value close to 1, indicating a certain explanatory effect of the model (see Table 11). Through computational analysis, it was determined that the degree of influence of each independent variable on satisfaction level followed this order: Rest facilities on site (0.245) > size of fitness space (0.233) > visible green index (0.158) > physical environment (0.136) > fitness facility quality (0.133). Each variable showed a positive correlation with the satisfaction level (see Table 12).
Through multiple linear regression analysis, it is evident that the number of rest facilities on site, the visible green index, and the size of fitness space have a significant impact on the utilization rates and satisfaction levels of community fitness spaces. These factors should be considered key factors in the future planning and design of these fitness sites.

4. Discussion

With the rise of the national fitness craze, community fitness spaces have become an indispensable part of the urban fitness system. They should be planned and designed, taking full consideration of urban residents’ needs and spatial preferences [43].
This study started from this perspective, screened out 11 built environment elements that may be related to the use of community fitness spaces based on existing research [15,21,23], took six communities with similar external situations and the same residential type as research samples, used questionnaires and the on-site observation data as the data basis, collected objective indicators with the help of software, and conducted a quantitative analysis using SPSS 26. The degree of correlation between internal built environment elements and utilization rates and satisfaction levels of community fitness spaces was verified. The major discoveries of this research are summarized as follows:

4.1. Five Influencing Factors

The results show that the utilization rates and satisfaction levels of community fitness spaces are related to five factors: Physical environment, fitness facility quality, visible green index, size of fitness space, and rest facilities on site. This finding is basically consistent with the results of the investigation by Li and Zhang [43].

4.2. Space Accessibility: Not a Relevant Factor

There is no significant correlation between space accessibility and the utilization rates or satisfaction levels of community fitness spaces, which is slightly inconsistent with previous studies on these spaces from an urban macro-scale perspective [29]. One possible explanation for this result is that, when researching at the scale of the whole city or region, factors such as arrival distance, transportation mode, and travel cost have a noticeable impact on residents’ fitness willingness. However, when the scale is narrowed down to the inner community level, the distinctions in these factors between samples become negligible. Moreover, as a part of the “15-min fitness circle”, the community fitness space itself has the characteristic of being adjacent to residential areas. The time from a resident’s home to the fitness space is generally within 5 min. The accessibility between different samples is too close, making it difficult to observe its effect on the utilization rates and satisfaction levels of community fitness spaces.

4.3. Rest Facilities: The Most Influential Factor

Rest facilities have the greatest impact on these two dependent variables, in line with prior studies on city parks [25]. By observing and recording the behavior of users during the collection of utilization rates in the samples, it has been found that the users of community fitness spaces are mainly the elderly. On the one hand, the physical strength of the elderly is limited, and the presence of rest facilities can help them recover during fitness activities [24]. On the other hand, according to previous studies [44], social interaction accounts for 31% of the reasons the elderly use community fitness spaces, which is even more than the motivation for fitness itself (25%). Activities such as chatting with neighbors or friends and babysitting often require the availability of these resting facilities. Therefore, community fitness spaces with adequate and complete facilities are often more attractive to community residents, especially the elderly.

4.4. The Size of Fitness Space: Strong Correlation with Satisfaction Levels

The impact of the size of the fitness space on satisfaction levels is second only to that of the rest facilities on site. As proven by existing studies, spacious venues can provide users with a better fitness experience than crowded ones [23]. Additionally, through on-site research, a common phenomenon was observed: larger sites tend to accommodate more types of activities, which in turn provide users with a richer experience. For example, in Jinzhu Wenyuan Community, fitness facilities, children’s game facilities, pavilions, and other landscape ornaments are placed together in the community fitness space, allowing various activities such as fitness, games, communication, and leisure to take place and interact with each other here. This makes the community fitness space a vibrant center for residents to gather and engage in activities.

4.5. Greenery: Positive or Negative?

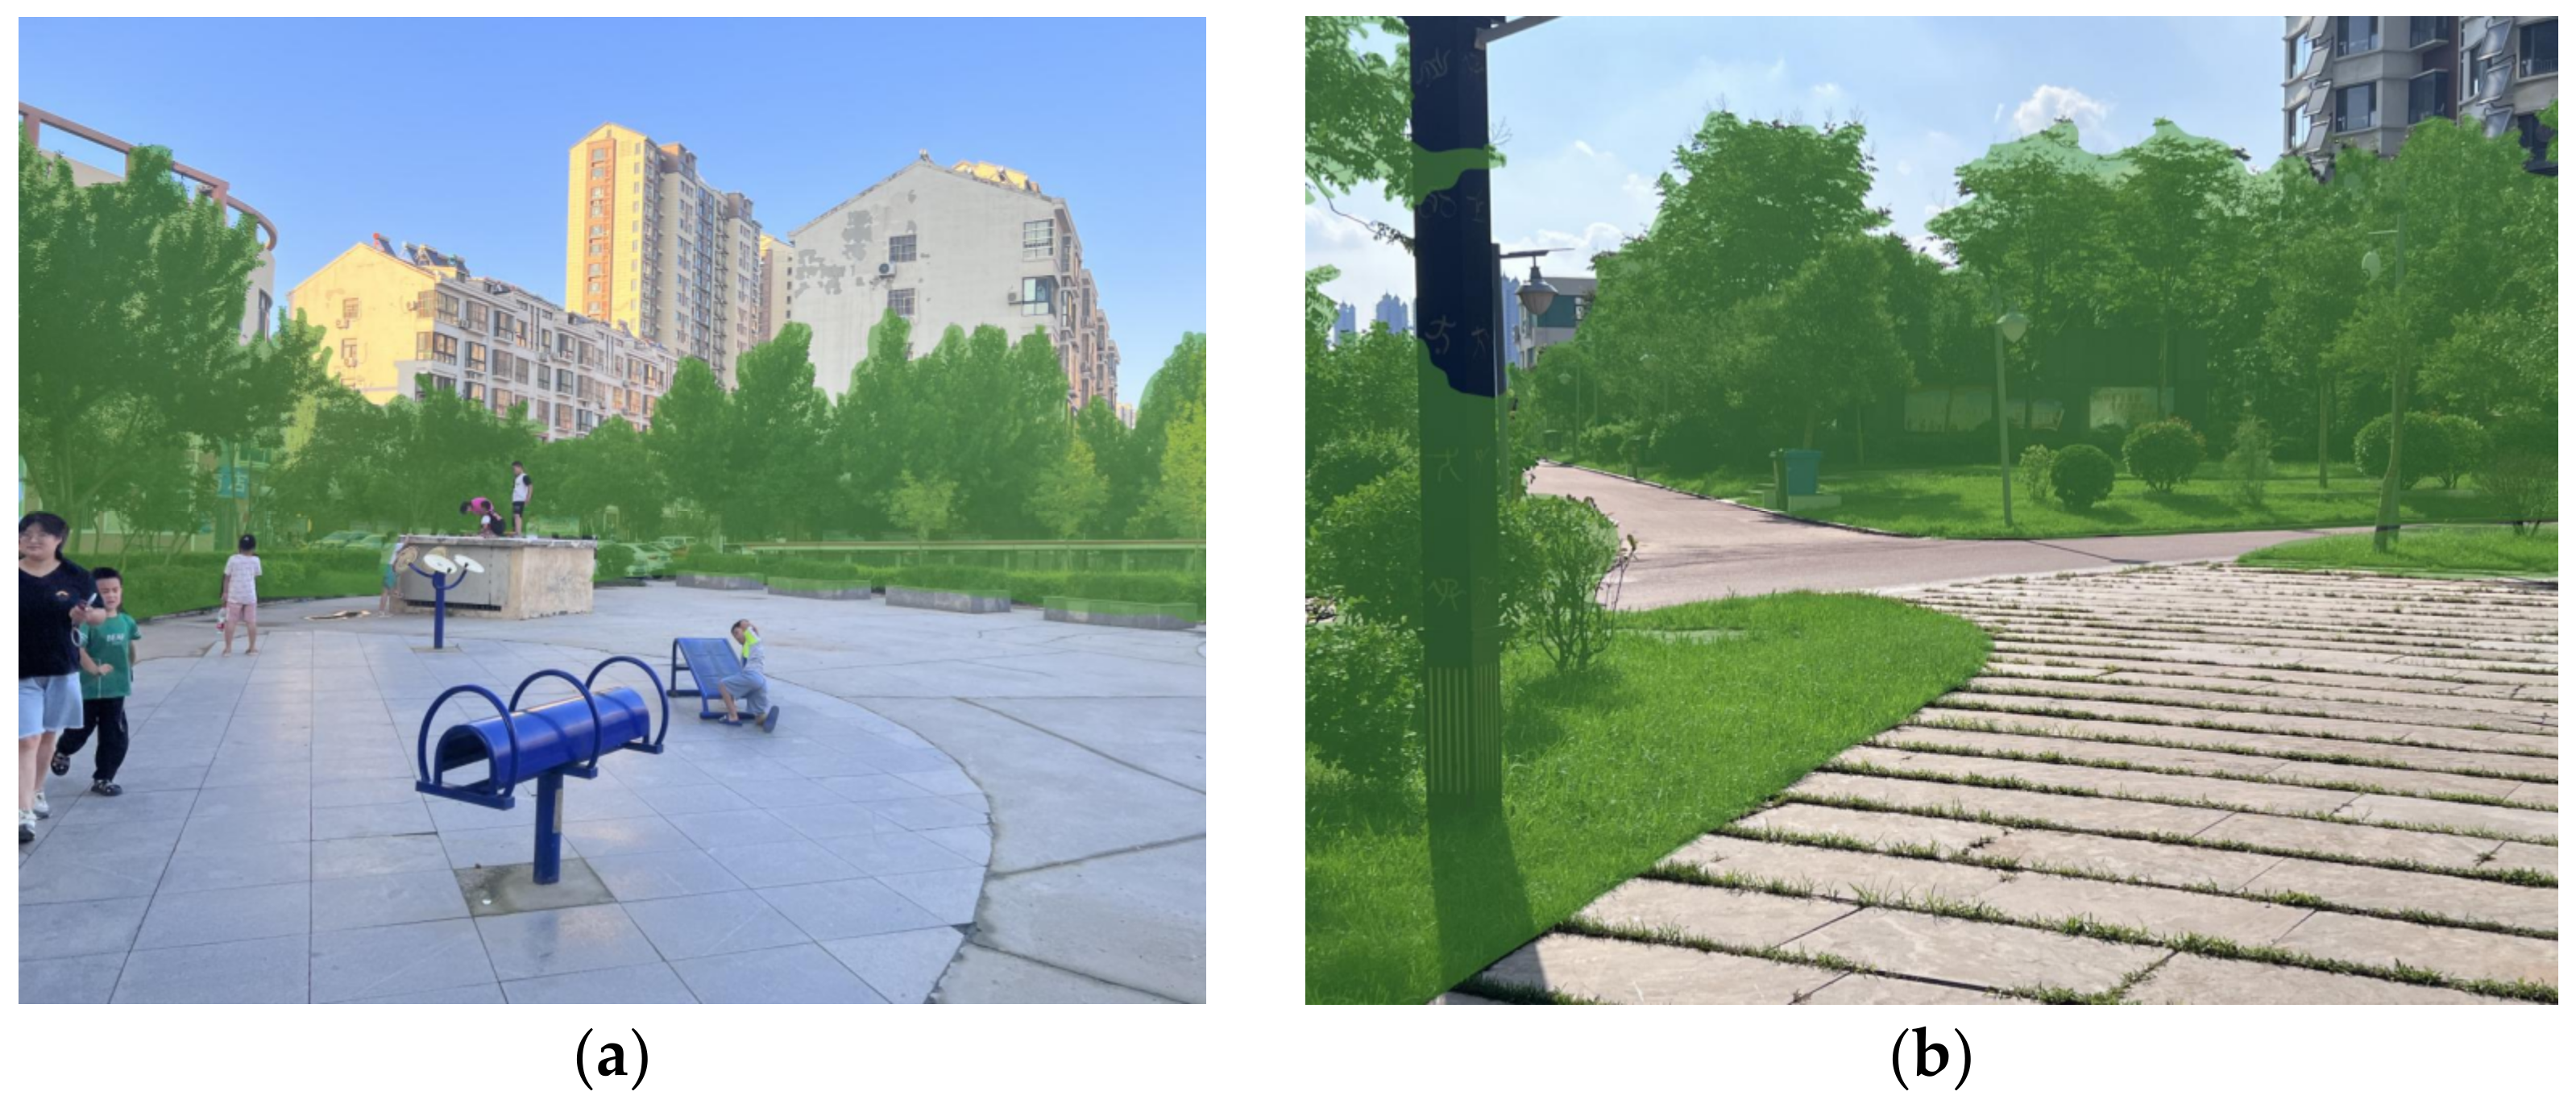
The correlation between the visible green index and residents’ satisfaction levels with community fitness spaces is positive. The effect of greenery on improving the satisfaction of various types of outdoor spaces has been verified in many existing studies [45,46]. Usually, a higher rate of greenery can help provide shade and reduce noise, making residents’ fitness experiences more comfortable (Figure 6a). This contributes to an increase in residents’ satisfaction with community fitness spaces.
However, the correlation between the visible green index and utilization rates is negative, which is contrary to most studies on open spaces [45,46]. Through on-site investigation, a possible reason was found: the excessive and dense vegetation may obstruct the visibility of fitness venues in the community, potentially reducing the utilization rate of community fitness spaces (Figure 6b).
In addition, as an important index to measure the sustainability of open space, the value of greenery is not equivalent to that of the visible green index. The latter one, as a value representing the visual aspect of green plants, cannot describe the other sensory characteristics of greenery. For instance, its influence on improving air quality, cooling, and noise reduction has been ignored. Therefore, the relationship between greenery and the usage or satisfaction of spaces cannot be presented solely by the visible green index.

5. Conclusions

Based on these findings, the following aspects should be emphasized in the planning and design of future community fitness spaces:
  • The inclusion of rest facilities should be fully considered in the design of the fitness space, aiming to provide an adequate number and variety of rest areas. In cases where the available area for fitness space is limited, utilizing the edges of flower beds or tree ponds to set up rest facilities can help ensure an adequate number of resting spaces. Additionally, the presence of plants can offer shade from the sun and protection from rain, enhancing the overall comfort of the fitness space.
  • The visible green index should be controlled at a suitable value in the design of community fitness spaces, and vegetation of different types, forms, and permeabilities could be carefully considered to separate and enclose space. As mentioned in previous studies, when the visible green index is controlled at 25% to 35%, it is most conducive to residents’ stays and activities in the fitness venue [47].
  • The area of the fitness venues should be sufficient to meet the per capita indicator requirements. Additionally, try to make full use of the space so that it can undertake as many activities as possible.
  • Improving the quality of the physical environment of community fitness spaces is important, including full consideration of the orientation of the site and the distance between the site and high-rise buildings during the site selection stage, as well as choosing plants that can provide shade in summer or setting pools to locally regulate the temperature in these spaces.
  • Regularly checking the quality of community fitness facilities is necessary, especially those in communities with earlier construction years. Timely repairs or replacement of old and broken facilities can help ensure their comfort and safety.
By examining the associations between the aforementioned built environment factors and the utilization of community fitness spaces, this study has made a certain contribution to the quantitative exploration of these spaces at micro and medium scales, but it also has the following limitations:
(a)
Although some objective indicators were introduced to measure and quantify the built environment, there were still some factors, such as the quality of fitness facilities, that were difficult to obtain by this method. These data were still collected using questionnaires. Despite the reliability and validity of questionnaires having been verified, the questionnaire data were still prone to deviation from reality based on users’ subjective impressions.
(b)
To reduce the interference of other variables, the samples selected in the current experiment were in the same city and region, and the time of recording the utilization rates was also concentrated in the same season (summer). However, when the location and season change, whether the factors impacting the utilization rates and satisfaction levels of community fitness spaces will also change still needs to be verified by subsequent experiments.
(c)
The measurement of greenery in this study only stays at the visual level, and its health effects on other aspects such as temperature and air quality have not been reflected. In the future, with the growth of cities, pollution, and poor air quality, residents’ demand for green space will increase. At that time, more significant than its aesthetic effect was its sustainable regulatory impact on its surroundings, even the whole city. Considering this, a more comprehensive and scientific method to measure greenery is needed, incorporating qualitative and quantitative indices on the availability of greenery. In addition, the surface area of green spaces in relation to air quality should also be taken into account at different times of the day, seasons, and periods.
With the vigorous implementation of the “National Fitness Program”, it is believed that in the future, community fitness spaces will occupy an increasingly important position in the urban fitness system. To make their role in improving residents’ health and achieving urban sustainability more fully realized, more comprehensive and in-depth studies are needed in the future, such as exploring the needs and usage of community fitness spaces by users of different ages and occupations and making the planning or renovation of future community fitness spaces more targeted based on the age and occupational structure of the corresponding community. In addition, future research should also pay more attention to comparative studies between different regions, such as the difference in distribution and demand for community fitness spaces between the north and south cities, or between urban and rural areas in the same region. By recording, comparing, and analyzing the fitness spaces of different cities on the same day, the influence of regional factors on fitness spaces can be explored to make the evaluation system of this type of space more comprehensive.
Author Contributions

Conceptualization, K.L. and X.Z.; methodology, K.L. and X.Z.; software, K.L.; validation, K.L. and X.Z.; formal analysis, K.L.; investigation, K.L.; resources X.Z.; data curation, K.L.; writing—original draft preparation, K.L.; writing—review and editing, X.Z. and D.X.; visualization, K.L.; supervision, X.Z.; project administration, K.L.; funding acquisition, X.Z. All authors have read and agreed to the published version of the manuscript.

Funding

The study was supported by “the National Science Foundation of China” (Grant No. 41671442): Human Behavior Patterns Analysis and Space Optimization based on the Big Trace Space-time Data.

Institutional Review Board Statement

Not applicable.

Informed Consent Statement

Informed consent was obtained from all subjects involved in the study.

Data Availability Statement

Not applicable.

Conflicts of Interest

The authors declare no conflict of interest.

Appendix A

Figure A1. Content of the questionnaire.
Sustainability 15 13273 g0a1aSustainability 15 13273 g0a1bSustainability 15 13273 g0a1cSustainability 15 13273 g0a1d

References

  1. The Global Climate & Health Alliance. NCDs & Climate Change: Shared Opportunities for Action. Available online: https://ncdalliance.org/sites/default/files/resource_files/NCDs_%26_ClimateChange_EN.pdf (accessed on 31 March 2016).
  2. World Health Organization. Global Health Estimates 2014 Summary Tables: Deaths by Cause, Age and Sex. Available online: http://www.who.int/healthinfo/global_burden_disease/estimates/en/index1.html (accessed on 4 August 2014).
  3. Zhou, M.G.; Wang, H.D.; Zeng, X.Y.; Yin, P.; Zhu, J.; Chen, W.; Li, X.; Wang, L.; Wang, L.; Liu, Y.; et al. Mortality, Morbidity, and Risk Factors in China and Its Provinces, 1990–2017: A Systematic Analysis for the Global Burden of Disease Study 2017. Lancet 2019, 394, 1145–1158. [Google Scholar] [CrossRef] [PubMed]
  4. Wu, X.Y.; Qin, X.R.; Zhou, H.X. Use of Community Spaces for Sports and Fitness—A Case Study of Urban Inhabitants in Shenzhen City, China. Int. Rev. Spat. Plan. Sustain. Dev. 2018, 6, 49–62. [Google Scholar] [CrossRef] [PubMed]
  5. WHO. Physical inactivity a leading cause of disease and disability, warns WHO. J. Adv. Nurs. 2002, 39, 518. [Google Scholar]
  6. Scottish Government. Equally Well: Report of the Ministerial Task Force on Health Inequalities. Available online: https://www.gov.scot/publications/equally-well-report-ministerial-task-force-health-inequalities/ (accessed on 18 June 2008).
  7. The State Council The People’s Republic of China. China to Implement National Fitness Program. Available online: https://english.www.gov.cn/policies/latest_releases/2016/06/23/content_281475378214258.htm (accessed on 23 June 2016).
  8. Wang, J.X.; Foley, K. Assessing the performance of urban open space for achieving sustainable and resilient cities: A pilot study of two urban parks in Dublin, Ireland. Urban For. Urban Green. 2021, 62, 127180. [Google Scholar] [CrossRef]
  9. Standardization Administration of China. Public Sports Facilities—Configuration and Management of Outdoor Fitness Equipment. Available online: http://c.gb688.cn/bzgk/gb/showGb?type=online&hcno=13F830A02FBF389D601C58AF7FD01CF5 (accessed on 7 September 2017).
  10. Zhao, J. Exploring the development of small sports in small towns in China from community fitness facilities in the United States, Germany and Japan. Dev. Small Cities Towns 2003, 9, 88. [Google Scholar]
  11. Rao, C.K. Study on the Present Situation and the Developing Counter measures of Sports Facilities in Urban Community—A Case Study on the Western Residential Area of Hangzhou City. China Sport Sci. Technol. 2007, 1, 16–20. [Google Scholar]
  12. Ma, L.; Lv, Y.; Ren, Q.; Zhang, X. The Selection of Environmental Factors Related to Physical Fitness of Some Inhabitants in Xi’an. J. Environ. Health 2008, 25, 266. [Google Scholar]
  13. Meng, Q.; Duan, J.Z. Analysis on the Problems and Countermeasures of Community Elderly Fitness Facilities Design under the Background of “Combination of Medical and Nursing”. Soc. Welf. 2021, 7, 26–29. [Google Scholar]
  14. Cavnar, M.M.; Kirtland, K.A.; Evans, M.H.; Wilson, D.K.; Williams, J.E.; Mixon, G.M.; Henderson, K.A. Evaluating the Quality of Recreation Facilities: Development of an Assessment Tool. J. Park Recreat. Adm. 2004, 22, 96–114. [Google Scholar]
  15. Linde, V.H.; Ariane, G.; Jelle, V.C.; Veitch, J.; De Bourdeaudhuij, I.; Van Dyck, D.; Clarys, P.; Van De Weghe, N.; Deforche, B. Park characteristics preferred for adolescent park visitation and physical activity: A choice-based conjoint analysis using manipulated photographs. Landsc. Urban Plan. 2018, 178, 144–155. [Google Scholar]
  16. Zhai, Y.J.; Li, D.Y.; Wang, D.; Shi, C. Seniors’ Physical Activity in Neighborhood Parks and Park Design Characteristics. Front. Public Health 2020, 8, 322. [Google Scholar] [CrossRef] [PubMed]
  17. Jenny, V.; Jo, S.; Gavin, A.; Timperio, A.; Sahlqvist, S. Understanding the impact of the installation of outdoor fitness equipment and a multi-sports court on park visitation and park-based physical activity: A natural experiment. Health Place 2021, 71, 102662. [Google Scholar]
  18. Kligerman, M.; Sallis, J.F.; Ryan, S.; Frank, L.D.; Nader, P.R. Association of Neighborhood Design and Recreation Environment Variables with Physical Activity and Body Mass Index in Adolescents. Am. J. Health Place 2007, 21, 274–277. [Google Scholar] [CrossRef] [PubMed]
  19. Wang, J.J.; Wang, M.; Patrick, W.C.; Ainsworth, B.E.; He, G.; Gao, Y. Physical activity as a mediator of the associations between perceived environments and body mass index in Chinese adolescents. Health Place 2018, 54, 37–42. [Google Scholar] [CrossRef] [PubMed]
  20. Levy, S.L.; Chen, L.; Loukaitou-Sideris, A. Older Adults’ Needs and Preferences for Open Space and Physical Activity in and Near Parks: A Systematic Review. J. Aging Phys. Act. 2017, 26, 682–696. [Google Scholar] [CrossRef]
  21. Copeland, J.L.; Currie, C.; Walker, A.; Mason, E.; Willoughby, T.N.; Amson, A. Fitness Equipment in Public Parks: Frequency of Use and Community Perceptions in a Small Urban Centre. J. Phys. Act. Health 2017, 14, 344–352. [Google Scholar] [CrossRef] [PubMed]
  22. Nadja, K.; Roland, K. Physical activity patterns in two differently characterised urban parks under conditions of summer heat. Environ. Sci. Policy 2020, 107, 56–65. [Google Scholar]
  23. Kaczynski, A.T.; Potwarka, L.R.; Saelens, B.E. Association of Park Size, Distance, and Features with Physical Activity in Neighborhood Parks. Am. J. Public Health 2008, 98, 1451–1456. [Google Scholar] [CrossRef] [PubMed]
  24. Duan, Y.P.; Petra, W.; Zhang, R.; Wulff, H.; Brehm, W. Physical activity areas in urban parks and their use by the elderly from two cities in China and Germany. Landsc. Urban Plan. 2018, 178, 261–269. [Google Scholar] [CrossRef]
  25. Chow, H.W. Outdoor fitness equipment in parks: A qualitative study from older adults’ perception. BMC Public Health 2013, 13, 1216. [Google Scholar] [CrossRef]
  26. General Administration of Sport of China. Beijing “15 Minutes Exercise Circle” to Solve the “Fitness Where to Go”. Available online: https://www.sport.gov.cn/n20001280/n20001265/n20067611/c24451910/content.html (accessed on 6 July 2022).
  27. Chen, Y.J.; Lu, T.H.; Pang, J. Reseach of urban community sports facilities service level evaluation: Take Xihu District, Hangzhou City as an example. J. Zhejiang Univ. Technol. 2019, 18, 304–309. [Google Scholar]
  28. Wei, W.; Deng, L. Configuration and Optimization of Community Sports Facilities from the Perspective of ‘Homo urbanicus’: A Case Study of the Downtown Area of Wuhan. Shanghai Urban Plan. Rev. 2020, 4, 76–83. [Google Scholar]
  29. Feng, Y.; Xu, T.; Gan, W.; Bai, G. Optimization Strategy and Aging Evaluation of Outdoor Sports Space in Old Community: Taking Seven Communities in Wuhan as an Example. Huazhong Archit. 2022, 40, 13–20. [Google Scholar] [CrossRef]
  30. Song, J.; Wang, J.J. Urban Sports Space Demand and Planning Design under The Background of National Fitness. Beijing Plan. Rev. 2020, 2, 114–119. [Google Scholar]
  31. Peng, S.; Zhou, B. Nonlinear Analysis of Fitness Space Satisfaction in Zongjiaolukang Park, Lhasa. Mod. Urban Res. 2020, 2, 30–36. [Google Scholar]
  32. Cui, B.S.; Mao, M.R.; Zhang, Y.J. Research and Application of Intelligent Toolbox for Community Planning—A Case Study of Responsible Planner Work in Chaoyang District, Beijing. Beijing Plan. Rev. 2020, S1, 136–142. [Google Scholar]
  33. Wang, T.; Mao, M.R.; Cui, B.S. Cat’s Eye—An Intelligent Investigation Tool for Urban Planning and Design. Landsc. Archit. Front. 2019, 7, 112–120. [Google Scholar]
  34. Lai, Z.H.; Wang, W.; Tu, S.S. Research on Research and Analysis Method of Public Space in Old Community Based on Multivariate Data. Archit. Cult. 2019, 7, 187–189. [Google Scholar]
  35. Sheng, Q.; Hu, Y.X.; Song, Y. Impacts of Spatial Morphology and Greening Factors on Social Gathering of Hutong Residents in Summer. Landsc. Archit. 2019, 26, 23–28. [Google Scholar]
  36. Li, Y.; Huang, J.X. Evaluation of Green View Perception of Walking Environment in Historical Blocks Based on Green View Attenuation Curve: A Case Study of Tongwen Area, Zhongshan Road of Xiamen. Landsc. Archit. 2020, 27, 110–115. [Google Scholar] [CrossRef]
  37. Gehl, J.; Gemzoe, L. On-site counting method, Map marking method, Tracking record method and other tools. In Public Space Public Life; The Danish Architectural Press: Copenhagen, Denmark, 1996; p. 59. [Google Scholar]
  38. Chow, H.W.; Mowen, A.J.; Wu, G.l. Who Is Using Outdoor Fitness Equipment and How? The Case of Xihu Park. Int. J. Environ. Res. Public Health 2017, 14, 448. [Google Scholar] [CrossRef] [PubMed]
  39. Chow, H.W.; Wu, D.R. Outdoor Fitness Equipment Usage Behaviors in Natural Settings. Int. J. Environ. Res. Public Health 2019, 16, 391. [Google Scholar] [CrossRef] [PubMed]
  40. Office for Human Research Protections, U.S. Department of Health & Human Services. Basic HHS Policy for Protection of Human Research. Available online: https://www.hhs.gov/ohrp/regulations-and-policy/regulations/common-rule/index.html (accessed on 30 January 2017).
  41. Xiaohua, J.; Zhuozhi, S.; Nannan, Z.; Hongxiu, L.; Haiyan, X. Analysis of the reliability and validity of the questionnaire. Mod. Prev. Med. 2010, 37, 429–431. [Google Scholar]
  42. Weng, Z.L.; Ye, B.J. Evaluating Test Reliability: From Coefficient Alpha to Internal Consistency Reliability. Acta Psychol. Sin. 2011, 43, 821–829. [Google Scholar]
  43. Li, L.L.; Zhang, C.N. Research on The Designing Elements of Daily Outdoor Leisure Sport Space: An Empirical Study Based on SEM. Archit. J. 2015, 13, 202–207. [Google Scholar]
  44. Huang, W.; Lu, Q.S.; Wu, J.F. Community Outdoor Fitness Space Design Research to Meet the Social Needs of Senior Users. Archit. Cult. 2020, 3, 162–164. [Google Scholar]
  45. Hua, J.Y.; Cai, M.; Shi, Y.; Ren, C.; Xie, J.; Chung, L.C.H.; Lu, Y.; Chen, L.; Yu, Z.; Webster, C. Investigating pedestrian-level greenery in urban forms in a high-density city for urban planning. Sustain. Cities Soc. 2022, 80, 103755. [Google Scholar] [CrossRef]
  46. Hoong, C.T.; Tze, K.F.; Song, X.P.; Belcher, R.N.; Siman, K.; Chan, I.Z.W.; Koh, L.P. Increasing contribution of urban greenery to residential real estate valuation over time. Sustain. Cities Soc. 2023, 96, 104689. [Google Scholar]
  47. Orihara, K. A study on the evaluation method of green landscape for good landscape formation. Res. Q. 2003, 142, 4–13. [Google Scholar]
Figure 1. Distribution of sample communities.
Sustainability 15 13273 g001
Figure 2. Number of inhabitants and practitioners in sample communities.
Sustainability 15 13273 g002
Figure 3. Research indicators and their acquisition methods.
Sustainability 15 13273 g003
Figure 4. Photos recorded by Urban Quadrant.
Sustainability 15 13273 g004
Figure 5. Satisfaction levels of sample communities.
Sustainability 15 13273 g005
Figure 6. (a) Reasonable visible green index; (b) the greenery blocks the site.
Sustainability 15 13273 g006
Table 1. Basic information of sample communities.
Community NameJinzhu Wenyuan CommunityOlsen Garden CommunityHaider Park Community
Completion time201220162015
Building typeMulti-storey buildingHigh-rise buildingMulti-storey building
Satellite imageSustainability 15 13273 i001Sustainability 15 13273 i002Sustainability 15 13273 i003
Community nameJinzhu University Community AJinzhu Community BJinzhu Community C
Completion time201320132014
Building typeHigh-rise buildingHigh-rise buildingHigh-rise building
Satellite imageSustainability 15 13273 i004Sustainability 15 13273 i005Sustainability 15 13273 i006
Red dots represent the location of community fitness spaces in each sample.
Table 2. General information of respondents.
Characteristics of RespondentsJinzhu Wenyuan CommunityOlsen Garden CommunityHaider Park CommunityJinzhu University Community AJinzhu University Community BJinzhu University Community C
AgeUnder 18 years old11.90%8.47%11.63%14.00%12.70%13.73%
19–40 years old21.43%37.29%27.91%30.00%33.33%27.45%
41–60 years old38.10%35.59%46.51%34.00%34.92%39.22%
61–70 years old23.81%16.95%11.63%18.00%17.46%17.65%
Over 70 years old4.76%1.69%2.33%4.00%1.59%1.96%
LifestyleLive alone0.00%1.69%2.33%4.00%4.76%0.00%
Live with wife/husband57.14%45.76%51.16%40.00%52.38%54.90%
Live with children33.33%35.59%30.23%44.00%28.57%27.45%
Live with grandchildren11.90%13.56%11.63%14.00%14.29%13.73%
(multiple choice)Live with parents23.81%16.95%18.60%30.00%28.57%25.49%
Live with grandparents11.90%8.47%11.63%20.00%12.70%17.65%
Live with roommates0.00%0.00%0.00%0.00%0.00%0.00%
Length of residence1–2 years4.76%6.78%2.33%26.00%23.81%5.88%
3–5 years88.10%91.53%67.44%44.00%44.44%54.90%
6–10 years4.76%1.69%30.23%30.00%31.75%39.22%
Over 10 years2.38%0.00%0.00%0.00%0.00%0.00%
Frequency of exerciseEveryday23.81%20.34%20.93%26.00%23.81%27.45%
3–5 times a week23.81%22.03%23.26%24.00%17.46%23.53%
1–2 times a week21.43%20.34%18.60%12.00%23.81%17.65%
Rare and irregular30.95%37.29%34.88%36.00%30.16%31.37%
Never0.00%0.00%2.33%2.00%4.76%0.00%
Where to exerciseGyms23.81%13.56%20.93%18.00%23.81%31.37%
City parks30.95%27.12%30.23%30.00%33.33%25.49%
(multiple choice)Community fitness spaces45.24%38.98%30.23%44.00%34.92%35.29%
Other open space in communities16.67%30.51%23.26%30.00%20.63%25.49%
Others23.81%25.42%20.93%24.00%14.29%21.57%
Table 3. Utilization rates of sample communities.
Jinzhu Wenyuan CommunityOlsen Garden CommunityHaider Park CommunityJinzhu University Community AJinzhu Community BJinzhu Community C
Weekday1 8:30–9:30954865
Weekday1 10:30–11:30734747
Weekday1 14:30–15:30721864
Weekday1 16:30–17:3015671197
Weekday1 18:30–19:301935586
Weekday2 8:30–9:30764559
Weekday2 10:30–11:30632758
Weekday2 14:30–15:30410720
Weekday2 16:30–17:3012541276
Weekday2 18:30–19:3020891194
Weekend 8:30–9:30857859
Weekend 10:30–11:3010581077
Weekend 14:30–15:30415765
Weekend 16:30–17:30199119105
Weekend 18:30–19:3021118997
Total number16873791249889
Table 4. Reliability statistics.
Cronbach’s AlphaCronbach’s Alpha Based on Standardized ItemsN of Items
0.7020.7336
Table 5. Result of KMO and Bartlett’s test.
KMO and Bartlett’s Test
Kaiser-Meyer-Olkin Measure of Sampling Adequacy0.754
Bartlett’s Test of SphericityApprox. Chi-Square476.412
df15
Sig.0.000
Table 6. Explanation table of the total variance.
ComponentInitial EigenvaluesExtraction Sums of Squared LoadingsRotation Sums of Squared Loadings
Total% of VarianceCumulative %Total% of VarianceCumulative %Total% of VarianceCumulative %
12.76746.11246.1122.76746.11246.1121.66627.76927.769
21.04017.32763.4391.04017.32763.4391.44624.10351.872
30.75412.57176.0100.75412.57176.0101.08918.14470.016
40.68811.46587.4750.68811.46587.4751.04817.45987.475
50.4116.85694.330
60.3405.670100.000
Extraction Method: Principal Component Analysis.
Table 7. Results of factor analysis.
Component
1234
Space sanitary condition0.841
Extent of damage to fitness facilities0.861
Physical environment 0.674
Fun of fitness facilities 0.930
Comfort level of fitness facilities 0.956
Space accessibility 0.986
Extraction method: Principal Component Analysis. Rotation Method: Oblimin with Kaiser Normalization. Rotation converged in 5 iterations.
Table 8. Result of correlation analysis.
Space MaintenancePhysical EnvironmentFitness Facility QualitySpace AccessibilityVisible Green IndexRest Facilities on SiteSize of Fitness SpaceUtilization RateSatisfaction Level
Space maintenance1
Physical environment−0.0031
Fitness facility quality−0.001−0.0031
Space accessibility−0.0030.004−0.0011
Visible green index0.0200.141 *0.055−0.0481
Rest facilities on site−0.0170.156 **0.1030.0530.0601
Size of fitness space0.0110.141 *0.062−0.0130.613 **0.311 **1
Utilization rate−0.0010.189 **0.138 *0.029−0.123 **0.852 **0.241 **1
satisfaction level0.1090.223 **0.180 **0.0140.337 **0.359 **0.424 **0.622 **1
* p < 0.05. ** p < 0.01.
Table 9. R2 values, regression coefficients, and check for multicollinearity (use the utilization rates as the dependent variable).
ModelRAdjusted R²Std. Error of the EstimateDurbin-Waston
10.846 a0.7770.77414.5941.691
a Predictors: (Constant), physical environment, fitness facility quality, visible green index, rest facilities, size of fitness space.
Table 10. Results of multiple linear regression analysis (dependent variable: utilization rates).
VariablesUnstandardized
Coefficients
Standardized CoefficientstSig.Collinearity Statistics
BStd.ErrorBetaToleranceVIF
Constant76.4652.956 25.8660.000
Physical environment2.5060.8470.0822.9600.0030.9571.044
Fitness facility quality1.8910.8320.0622.2720.0240.9861.014
Visible green index−0.7120.091−0.275−7.8280.0000.5991.669
Rest facilities4.9020.1790.80427.3530.0000.8531.173
Size of fitness space0.0080.0020.1443.9300.0000.5491.823
Table 11. R2 values, regression coefficients, and check for multicollinearity (use the satisfaction levels as the dependent variable).
ModelRAdjusted R²Std. Error of the EstimateDurbin-Waston
10.539 a0.2910.2790.1901.785
a Predictors: (Constant), physical environment, fitness facility quality, visible green index, rest facilities, size of fitness space.
Table 12. Results of multiple linear regression analysis (dependent variable:satisfaction levels).
VariablesUnstandardized
Coefficients
Standardized CoefficientstSig.Collinearity Statistics
BStd.ErrorBetaToleranceVIF
Constant2.8160.039 72.9760.000
Physical environment0.0300.0110.1362.7330.0070.9541.048
Fitness facility quality0.0300.0110.1332.7260.0070.9871.013
Visible green index0.0030.0010.1582.5300.0120.5991.670
Rest facilities0.0110.0020.2454.6580.0000.8521.174
Size of fitness space0.0010.0000.2233.4130.0010.5491.823
Disclaimer/Publisher’s Note: The statements, opinions and data contained in all publications are solely those of the individual author(s) and contributor(s) and not of MDPI and/or the editor(s). MDPI and/or the editor(s) disclaim responsibility for any injury to people or property resulting from any ideas, methods, instructions or products referred to in the content.