Abstract
Harnessing empirical analysis, this paper investigates the relationship between innovation-driven industrial agglomeration (IDIA) and economic growth (GEG) in the context of the Yellow River Basin in China. The study employs a non-radial and non-angular SBM ML model to comprehensively evaluate GEG levels. Leveraging panel data spanning from 2008 to 2020 across 30 provinces and cities, the analysis systematically explores the influence of IDIA on GEG. The research uncovers a significant positive connection between IDIA and GEG, with a noteworthy impact observed particularly in underdeveloped regions, areas in intermediate stages of industrialization, and industries characterized by heightened pollution levels. Importantly, the study reveals that green technology adoption (GTA) acts as a critical mediator between IDIA and GEG, particularly within the context of dirty manufacturing firms that are transitioning from mid-level industrialization. These findings provide valuable insights for policymakers and industry stakeholders, enabling them to devise targeted strategies for driving green technology adoption and fostering sustainable economic growth. While this study contributes significantly to our understanding, it is important to acknowledge its limitations, including the specific geographical focus on the Yellow River Basin and the potential complexities inherent in assessing the intricate relationship between industrial agglomeration and economic growth. Future research avenues could extend to broader geographical contexts and delve into more nuanced mechanisms underlying the observed connections.
1. Introduction:
The World Environmental Conference emphasized the importance of environmental management through the establishment of goals for reducing carbon emissions [1]. The manufacturing sector’s commitment to green development contributes significantly to the advancement of environmental sustainability and progress, particularly in the context of developing nations [2,3]. Throughout history, the manufacturing sector has been associated with substantial investments, pollution, energy consumption, and limited efficiency, particularly in developing countries [4]. Greening of the manufacturing sector has become a crucial strategy for the country’s development in the next ten years [5,6,7,8]. In addition, China’s Made in China 2025 strategy seeks to support the local manufacturing sector’s development through innovation and environmental responsibility [9], aligning with the goals of carbon peaking and carbon neutrality [10]. This is also related to the way China’s manufacturing landscape is steadily changing in favor of high-tech businesses, industrial parks, and other options.
Industrial agglomeration, regarded as a crucial strategy for stimulating regional economic growth, represents a unique model of economic organization in the contemporary era [11,12]. This phenomenon involves the significant concentration of similar or identical industries within a specific geographic area, accompanied by the continuous interaction and utilization of production factors. Spatial concentration in a specific area has been observed as a significant driving force for regional and green economic development [13,14]. For instance, in America, the San Francisco area and the Great Lakes region account for 65% of the country’s GDP. Roughly 30% of China’s total area is composed of the Yangtze River Delta and Pearl River Delta regions, exhibiting the effective resource allocation made possible by industrial agglomeration [15]. Industrial agglomeration also contributed to China’s regional growth, as shown in the nation’s 169 national-level high-tech industrial clusters that cover only 0.1 percent of the territorial area and generate approximately 13 percent of the national GDP in 2021 [15]. While industrial agglomeration promotes economic growth, it is important to understand that the concentration of production elements may put a strain on the environment. Despite the claims of some academics, industrial agglomeration does not necessarily result in knowledge spillovers, technical advances, or increased resource use efficiency [16,17]. Additionally, it raises both production volume and population density, potentially resulting in higher raw material consumption and increased pollution levels [18]. Therefore, balancing industrial agglomeration and environmental protection is a significant challenge for sustainable and inclusive economic growth. The existing literature has explored the impact of industrial agglomeration on local environmental contamination [7,17]. However, these studies often overlook the spatial spillover effects and lack in-depth analysis of the underlying mechanisms. To address this gap, our study utilizes panel data from Chinese cities and employs an active spatial Durbin model to quantitatively examine IDIA’s influence on GEG, and also investigate the green technology adoption (GTA) mediation role between IDIA and GEG.
This research contributes in the following ways: Firstly, it integrates the concepts of IDIA and GEG, shedding light on the potential role of agglomerated industries in driving environmentally sustainable economic development. By focusing on the specific case of the Yellow River Basin, the study contributes to our understanding of how IDIA can effectively promote GEG in a regional context. Secondly, the paper conducts a thorough empirical analysis to find IDIA’s influence on GEG in the Yellow River Basin. By employing quantitative methods and analyzing relevant empirical indicators, the study provides empirical evidence to support the relationship between IDIA, GTA, and GEG. Thirdly, while previous research primarily relied on provincial-level panel data [7,17], our study utilizes urban-level data to provide more detailed and accurate findings, considering regional disparities for economic development, resource endowment, and industrial structure, within the same province. Lastly, the paper concludes with policy implications for sustainable regional development. The policy recommendations derived from the research findings can guide regional development strategies in the case of the Yellow River Basin and the related.
The remainder of this research report is divided into the following sections: Section 2 offers an overview of the relevant literature. In Section 3, we detail the establishment of the econometric model, indicator selection, and data origins. Section 4 presents the empirical results and associated observations. Section 5 and Section 6, which presents policy recommendations based on the findings, summarizes the primary conclusions.
2. Literature Review
2.1. Industrial Agglomeration
An industrial agglomeration, commonly referred to as an industrial agglomeration district, embodies a concentration of businesses engaged in manufacturing similar or related categories of goods within a specific geographical area [19]. Marshall (1890) pointed out that such districts constitute locations where small and medium-sized businesses actively participate, amalgamating social trends rooted in historical and natural variables. This phenomenon is underpinned by diverse elements, including the evolution of regional specialization, the establishment of a labor market tailored to specific industrial expertise, the reinforcement of connections between upstream and downstream enterprises, and the facilitation of technological advancement [20]. Ellison and Glaeser [21] proposed a core-edge model, suggesting that industrial agglomeration emerges from a combination of centripetal and centrifugal forces, encompassing local market effects and price index effects.
Researchers have presented two perspectives concerning the external effects of industrial agglomeration in industrial realms: the Marshall–Arrow–Romer (MAR) externalities, which underscore the influence of industrial specialization, and the Jacobs externalities, which emphasize the effects of industrial diversification. Marshall [22] highlighted the increasing benefits businesses gain from agglomeration economies, such as access to a local talent pool, supplier networks, and knowledge spillovers, leading to the emergence of MAR externalities that reduce communication costs between firms. On the other hand, Jacobs (1969) argued that knowledge spillovers between complementary industries, rather than similar ones, can enhance economic efficiency and promote innovation [23]. As industrial agglomeration scales up, more enterprises gravitate towards the area, resulting in heightened specialization, collaboration, and core product production. Furthermore, the expansion of the agglomeration area augments the supply of production factors, reduces average production costs, attracts labor, and enhances industrial competitiveness. This outcome is often juxtaposed with the creation of a reservoir [24]. Notably, the benefits of economic agglomeration are not universally advantageous; several scholars have cautioned that optimal agglomeration effects necessitate a certain scale, exceeding which can diminish the overall advantages of the agglomeration [25,26], which suggested that the optimal effects of agglomeration require a certain scale; surpassing the local capacity can reduce the overall advantages of the agglomeration zone. Thus, our study underscores the integration of innovation into industrialization for sustainable economic growth [27]. Wu and Lin [28] explored the nexus between the market environment and industrial agglomeration in China’s context, emphasizing the market’s pivotal role in resource allocation, component flow, and the magnitude of foreign direct investment.
2.2. Green Economic Growth
In Growth limits, Meadows, Meadows [29] presented the idea of “green economic growth,”. This concept advocates for a “green revolution,” emphasizing that rapid expansion could be impeded by pollution and resource limitations. This perspective underscores the potential unsustainability of uncontrolled economic growth and underscores the importance of preserving resources and the environment [29,30,31]. Within the framework of green economic growth, the goal is to achieve increased output while simultaneously minimizing resource consumption and pollution emissions [32]. The achievement of green economic growth involves a variety of factors in the Chinese context, including industrial development [17], the role of the Internet [33], economic openness [34], financial development [35,36], fiscal spending [37], and renewable energy [38]. These factors collectively contribute to shaping the landscape of green economic growth in China, where the emphasis is on balanced economic advancement that aligns with ecological preservation and sustainable resource utilization. Technological progress, in particular, plays a crucial role as a driver of green economic growth [39]. The impact of research and development (R&D) investment on long-term green economic growth is significant by [34]. Investment in technological innovation enables pollution reduction [40] and reduces the erratic nature of green economic growth [36]. Ali, Alharthi [41] discovered that clean technology innovation can promote green growth by fostering a good interaction between the economy and the environment. The key literature related to these aspects is organized in Table 1.

Table 1.
GEG factors.
Since the inception of the green economy concept in the 1980s, extensive research has been conducted by scholars worldwide, focusing on resource conservation and environmental enhancement. Integrating economic, social, and environmental benefits and acknowledging their interdependence is essential to fully grasp the value of resources and the environment. Honesty and optimization should underscore the primary goals of economic development. Moreover, various forms of innovation, including investment, production processes, circulation, sales, and consumption, contribute to “green” economic development [42]. Based on these considerations, this research article posits that the significance of green economic growth (GEG) extends beyond a mere concept; it signifies an idea. The intensive production mode represents an economically driven approach aimed at augmenting efficiency and effectiveness through environmental innovation. Recognizing the interplay between the economy, society, and environment within the confines of finite resources, this developmental approach seeks the harmonization of the economy and the environment. It aspires to align industries and resources, foster the integration of environmental and health protection goals, and promote the amalgamation of economic and ecological values.
In the Chinese context, the selection of variables, such as innovation-based industrial agglomeration (independent), green economic growth (dependent), and green technology adoption (mediating), stems from their interconnected role in sustainable development. China’s dynamic industrial landscape and emphasis on innovation-driven clusters make the agglomeration variable pertinent. Green economic growth underscores the nation’s commitment to balancing economic progress with environmental concerns. Green technology adoption as a mediating variable recognizes the pivotal role of technology in achieving both economic and ecological goals. This variable choice aligns with the findings in Table 2, offering a comprehensive understanding of factors driving green economic growth in China.
Table 2.
Variable description.
The concept of “green” encompasses ideals like health, justice, cleanliness, sustainability, and vitality. Achieving green manufacturing and a green economy need fusing environmental values with economic ones [16]. The green idea embraces every facet of economic activity and includes standardized and optimized economic, social, and environmental benefits. Economic efficiency is a requirement for “green” development and is an essential precondition for environmentally responsible growth. This comprises gaining economic advantages from green innovation, incorporating green ideas into how the economy runs, optimizing the industrial structure, and encouraging new areas of economic growth. The industrial and service sectors in China are integrated, and modernization, innovation, and strategic development in high-tech and developing industries all help to boost technical innovation and management [43].
2.3. Green Technology Adoption
The manufacturing sector, being the largest natural resource consumer and pollutant emitter, is under scrutiny due to its role in environmental degradation. The manufacturing sector of China is crucial for the growth of the country, and it contributes 30.38% to the GDP and adds 83.65% to the industrial value [44]. The manufacturing sector of China depends on high investments, resource inputs and consumption, and intense greenhouse gas emissions. It used 2.45 billion tons of coal in 2014, accounting for 57.55% of total coal and 82.88% of the energy consumption of the industry [44]. All this greatly damages the environment by producing 56.67% of the CO2 emissions of the total industry [45]. For sustainable transition, China as a country needs to improve the performance of the manufacturing sector. Since 1990, China, to reduce carbon emissions, has aimed at energy conservation and efficiency and introduced preventive laws [45]. In order to reduce energy intensity in the economy, China being a signatory of the Paris climate change agreement, the manufacturing sector needs a sustainable transition. To achieve a sustainable transition, China launched the ‘Made in China 2025’ initiative to enhance innovation-based economic performance and green development. Hence, most of the countries are gearing up to adopt green manufacturing technologies with ambitious goals of net zero emissions.
The manufacturing industry, which is crucial for generating jobs, eradicating poverty, and improving living standards, among other economic and social objectives, is intricately connected to the advancement of a sustainable green economy [46]. The manufacturing sector in China, dubbed the “world’s factory,” has a large impact on both the Chinese and global economy, contributing 32% to the GDP and making up 12% of all exports [47,48]. Scholars have widely acknowledged the substantial influence of the manufacturing industry on economic growth and environmental pollution [49,50,51]. Within the realm of modern manufacturing, agglomeration serves as a crucial organizational structure [52]. To aid the shift to a green economy, the Chinese government is actively encouraging agglomeration development in the manufacturing sector [53]. One major reason for manufacturing firms to adopt green technologies is the issue of industrial pollution.
Industrial activities in China have resulted in severe pollution, leading to significant environmental and societal consequences. This has prompted manufacturing firms to seek sustainable solutions and adopt green technologies to mitigate their environmental impact. Studies have highlighted the urgency of addressing industrial pollution in China.
For instance, Zhang, Song [54] emphasize the economic burden caused by pollution-related health issues and reduced labor productivity. Wu, Li [55] review soil heavy metal pollution in China, and Fan, Wang [56] looked into how China’s finance and manufacturing co-agglomeration affected environmental pollution directly and discovered that both improved industrial structure and credit scale expansion helped to safeguard the environment. Furthermore, the study by Zhang, Zhang [57] highlights the contamination of water bodies due to industrial activities, affecting aquatic ecosystems and public health. These adverse effects on the environment and society emphasize the need for manufacturing firms to adopt green technologies as a means of reducing pollution and promoting sustainability.
2.4. Innovation-Based Industrial Agglomeration and Green Economic Growth
The emergence of innovative industry agglomeration has increasingly become a defining characteristic of the new economic era [58], as industrial structure adjustments and agglomeration development have taken place [59]. The industrial agglomeration has increased in popularity among industrial development and economic activities in recent years [60]. Sharing of the labor pool, the use of specialized supply chains, and knowledge spillovers are the three fundamental forces behind agglomeration [61]. Economists have extensively studied the concept of agglomeration economies, focusing on their causes and impacts [18,62]. Given the significance of this new form of agglomeration, it is essential to investigate whether it can effectively facilitate GEG and the upgrading of the manufacturing industry. Can innovation-driven industrial agglomerations (IDIA) support green growth (GEG) at the national level? How is the manufacturing sector’s transition to sustainability impacted by the concentration of high-tech industries? The responses to these questions offer useful information for developing global economic and environmental policies, as well as for national and regional industrial development strategies. They serve as practical guidance and decision-making references for achieving a greener and more sustainable future. Comprehending the correlation between high-tech industrial agglomeration and the environmentally conscious transformation of the manufacturing sector holds significance. It sheds light on the potential of agglomeration to drive sustainable practices and identifies strategies to maximize its positive impacts.
Understanding the connection between industrial agglomeration and regional economic growth, particularly in the setting of open economies, has received considerable attention from academics [63]. The research background in this area can be characterized by three key aspects. Firstly, initial discussions within the academic community focused on the connection between industrial growth and the quantitative expansion of regional economies. For instance, Tao, Wang [64] explored the effects of knowledge transfer and urban industrial agglomeration diversification on regional economic growth from the angle of externality theory. They found that specialization and knowledge spillovers generated by industrial agglomeration significantly enhanced regional economic growth. Similarly, Refs. [16,48] researchers discovered that industrial spatial agglomeration has the potential to elevate labor productivity, bolstering regional economic advancement through the dissemination of knowledge and technology. Secondly, researchers gradually shifted their focus from examining the influence of industrial agglomeration on regional quantity growth to investigating its impact on regional productivity [65]. However, studies on industrial agglomerating rarely incorporate IDIA’s impact on GEG in the context of the China Yellow River basin. Thirdly, researchers are focusing on the connection between industrial agglomeration, energy, and the environment because of the growing concern over resource consumption and pollution. They have started evaluating and researching the idea of IDIA’s impact on GEG. For instance, Wang, Yao [66], stated that the efficiency of the green economy being impacted by the interplay of positive and negative externalities leads to scale and crowding effects within multi-center agglomerations of urban industries. In summary, research on the impact of innovation-driven industrial agglomeration (IDIA) on green economic growth (GEG) aligns with the actuality of regional consequences resulting from industrial concentration in developing nations or less developed areas.
2.5. Mediating Role of Green Technology Adoption
The harmful greenhouse gas (GHG) emissions from industry have become a huge threat to the environmental ecology of China. China has started taking measures to reduce GHG emissions due to heavy industrialization [67]. China, through its Made in China 2025 mission, encourages firms to use sustainable production techniques, among various other measures, to meet this challenge. The adoption of environmentally friendly technologies or green technologies is one way to meet environmental goals. The adoption of green technology has a strong relationship with the momentum of technological change [68] because this cumulative procedure flourishes based on existing knowledge and provides a kick start for future advancements [69]. Green technology adoption (GTA) can mitigate the environment’s pollution, save resources, and handle issues of waste and recycling [70]. In addition, GTA is also an alternative way to resolve issues of resource wastage and environmental pollution. Nonetheless, a higher level of interchangeability exists between conventional and green technologies. The dirty industry users are not willing to adopt GT without external pressure through government regulation [71]. Being the second largest and largest developing economy in the world, China is now facing huge environmental pollution due to rapid economic development in the country. The largest challenge is to curtail environmental pollution without slowing down economic growth. After the implementation of the PRC environment protection law in 1979 on a trial basis, effective and sound environmental regulation is being practiced in the country. So, the desired change is only possible through the adoption of green technology for sustainable environmental and economic growth while incorporating IDIA and GEG in the Chinese economy.
A bunch of previous studies [67,72,73,74,75,76,77,78,79,80,81,82,83,84,85,86,87] documented green technology and its significance. For instance, Wang, Cho [87] mentioned that their new model of strict regulation would convince more firms to adopt environmental regulation, and they also observed that several firms willing to adopt environmental regulations should also be considered. In another study, Bian, Zhang [86] studied environmental concerns along with manufacturer and consumer subsidies and said that there was an increase in emission and production but lower abatement.
Moreover, Yin, Zhang [84] discussed the metrics linked to the capacities of green technology innovation and their influencing elements, as well as the manner in which the competitiveness of multi-agent cooperation is strengthened in China for green manufacturing. Perruchas, Consoli [82] found that a country will diversify green technologies more if it already possesses relevant competencies and that the level of green technology is more significant than the level of a country’s development. The study’s subsequent conclusions note that specialization develops over time and leans more toward advanced green technology. Lisi, Zhu [81] demonstrated that there is a positive correlation between customer learning and environmentally conscious suppliers with green production and innovation. However, the influence of fluctuations in green technology on this relationship is moderated differently. Guo, Nowakowska-Grunt [80] in their work, try to make a differentiation by stating that developed countries are generating higher levels of pollution and emissions in comparison to less developed ones, primarily due to their extensive reliance on industrial production. Finally, several others, like Appiah [88], discussed greenhouse gas emissions, ecological footprint CO2, and economic growth. The previous studies about green technology either discussed the way GT affects emissions GT affects emissions [89,90] or, alternatively, the impact of Green Technology (GT) and regulations pertaining to the environment on the mitigation of emissions [91].
In the context of the Yellow River Basin in China, the current study considered the mediating function of green technology adoption (GTA) between innovation-based industrial agglomeration (IDIA) and green economic growth (GEG). The use of technology that lowers pollution and resource consumption is referred to as GTA. Industrial agglomeration in the region has historically been driven by traditional manufacturing practices, leading to environmental degradation and resource depletion. However, the urgent need to address environmental and economic challenges has necessitated a new direction for industrial agglomeration, one that can meet both objectives simultaneously. By introducing GTA as a mediator, the study recognizes that simply promoting industrial agglomeration without considering environmental sustainability can exacerbate environmental issues. GTA acts as a catalyst for transforming traditional industries into cleaner and more resource-efficient sectors, thereby mitigating the negative environmental impacts associated with industrial agglomeration. Green technologies encompass a wide range of innovations, including clean energy sources, eco-friendly production processes, and waste reduction measures. By adopting green technologies, industrial agglomeration in the Yellow River Basin can effectively mitigate environmental degradation while promoting sustainable economic growth.
3. Methods
Incorporating the mediating role of green technology adoption (GTA) from the subsequent three aspects, environmental regulatory measures, technological progress, and enhancement of industrial structure, the paper discusses the effects of innovation-based industrial agglomeration (IDIA) on green economic growth (GEG). It acknowledges that, in many situations, the impact of industrial agglomeration on GEG is not fully and immediately obvious but may instead be mediated by various factors. Figure 1 displays the conceptual framework and variable order.
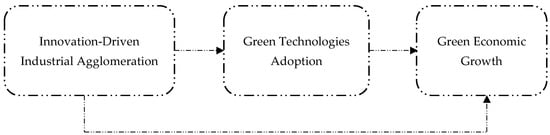
Figure 1.
Conceptual framework: role of innovation-driven industrial agglomeration in promoting green economic growth.
3.1. Research Hypotheses and Theoretical Analysis
3.1.1. Impact of Industrialization Agglomerations Driven by Innovation on Green Economic Growth
Nonetheless, the Herfindahl index, Gini index, and Ellison–Glaeser index solely offer a global measure of element agglomeration and are, therefore, inappropriate for this study since they do not sufficiently describe the degree of agglomeration within particular regions. For China’s economic development objectives and sustainable development, the effect of innovation-driven industrial agglomeration (IDIA) on green economic growth (GEG) is a topic of great importance. By easing the exchange of materials and energy with the surrounding environment, industrial agglomeration, which is characterized by the spatial concentration of businesses, has the potential to increase regional green development capacity and efficiency. Different industrial agglomeration theories shed light on its potential impacts on GEG.
As important industrial agglomeration areas, China’s National Economic and Technological Development Zones must contend with issues including high energy consumption and pollution. Thorough empirical research at the city level is required to determine the precise relationship between industrial agglomeration and green development in China. Researchers are inclined to explore the correlation between researchers due to the connection between IDIA and GEG. Recent studies indicate that the evolution of industrial frameworks and economic shifts is significantly reliant on the innovative sector. In light of the aforementioned discussion, we came up with the following theory.
H1.
Innovation-Driven Industrialization Positively Contributes to Green Economic Growth in the Context of China’s Yellow River Basin.
3.1.2. Green Technology Adoption Mediates the Relationship between Innovation-Driven Industrial Agglomeration and Green Economic Growth
The mediating role of GTA between IDIA and GEG is a critical aspect to consider in understanding the relationship between these factors. IDIA, marked by the clustering of advanced and technology-driven sectors within a specific area, holds significant importance in propelling economic advancement and facilitating the shift towards an environmentally conscious economy. This form of industrial concentration facilitates the sharing of ideas, dissemination of technology, and interchange of skilled individuals, all of which are pivotal in fostering innovation and facilitating the eco-friendly evolution of the manufacturing sector [92,93]. GTA refers to the integration and utilization of environmentally friendly technologies and practices within industrial processes. It encompasses measures such as resource efficiency, waste reduction, clean energy adoption, and circular economy principles. The adoption of green technologies allows businesses to reduce their environmental footprint, enhance resource utilization efficiency, and mitigate the negative impacts of industrial activities on the environment [94,95].
The mediating role of GTA suggests that the positive effects of IDIA on GEG are channeled through the adoption and implementation of green technologies by firms within agglomerated regions. In other words, industrial agglomeration stimulates the exchange of knowledge, facilitates technology diffusion, and fosters an environment conducive to innovation and the development of green technologies. As a result, firms located within these agglomerated regions are more likely to adopt and implement green technologies in their operations [94,96]. By adopting green technologies, businesses can improve their resource efficiency, reduce pollution, minimize waste generation, and develop environmentally friendly products. These practices not only contribute to the overall sustainability and environmental performance of firms but also drive green economic growth at the regional and national levels. GTA enables businesses to achieve cost savings, gain a competitive edge in the market, and access new opportunities arising from the growing demand for sustainable products and services [94]. Therefore, the mediating role of GTA highlights the importance of incorporating environmentally friendly practices and technologies within the context of innovation-driven industrial agglomeration. It highlights that the favorable influence of industrial clustering on the growth of a sustainable economy stems from the integration and application of environmentally friendly technologies by companies situated in these clustered areas. By leveraging the benefits of innovation-driven industrial agglomeration and embracing green technology adoption, regions can foster sustainable economic development while mitigating environmental challenges. When GTA is adopted by firms in an IDIA, the positive effects of innovation on GEG are amplified. This is because GTA can help to reduce the environmental impact of industrial production, while also improving the efficiency of production processes. Several studies have found that GTA can mediate the relationship between IDIA and GEG. Therefore, we posit the following hypothesis.
H2.
Green technology adoption positively mediates the relationship between innovation-driven industrial agglomeration and green economic growth.
3.2. Model for Measuring, Choosing Variables, and Defining Data
Building an equationl to examine the direct impact IDIA has, the researchers formulated the following econometric model 1 used by [97]:
Among these variables, LnGegit represents the level of green economic growth in the manufacturing industry; Hlqit represents the level of innovation-driven industrial agglomeration level in the Yellow River basin. Various control factors were selected to ensure consistency with prior research findings, encompassing aspects such as industrial-scale structure (Sca), urbanization rate (Urban), environmental regulations (Er), government concentration (Gover), economic development level (Lngdp), and the extent of openness (Trade). To account for unobserved components, the model also has a random disturbance term, which acts as a random disturbance item.
When examining the mediating role of green technology adoption (LnGTA) between the IDIA of the manufacturing industry, Model (2) was presented.
3.3. Factors Affecting the Study
3.3.1. Innovation-Driven Industrial Aggregation in the Manufacturing Sector Is an Explanatory Variable
In this study, the level of agglomeration of the IDIA at the provincial level was assessed. Various indicators such as location entropy, HHI index, Theil index, and industrial concentration have been employed by scholars to gauge the extent of industrial clustering [98,99]. Location entropy is one of these indicators that is frequently employed since it can correctly represent the complete industrial cluster across various geographic areas while reducing the effects of scale. To ascertain the level of agglomeration across China’s 30 provinces, municipalities, and autonomous areas, the location entropy approach was used in this study. A higher number denotes better scale advantages together with a higher level of agglomeration in the regional IDIA.
The specific measurement formula employed was
In the equation, is a proxy for the IDIA, and denote the overall employment within each province and the count of industry-specific jobs within each province, respectively, while hp and p refer to the total national employment and the count of jobs in the innovative industry at the national level, respectively.
3.3.2. Explained Variable: Green Economic Growth
At the given time, there is no standardized evaluation method for assessing the impact of IDIA on GEG. Two common approaches are used to assess GEG: one involves constructing comprehensive evaluation indicators [100], while the other utilizes green total factor productivity [101,102]. In this research, we employed non-radial and non-angular measurements to apply the directional distance function of the SBM method. We utilized the Malmquist–Luenberger (ML) productivity index, which amalgamates the green total factor productivity across 21 notable manufacturing sectors [103], and we were able to quantify the efficiency or extent of GEG. The ML index is particularly effective in capturing the dynamic changes in GEG when accounting for non-green output within the model. Thus, we followed the measurement method suggested by [103], where the expression for the SBM_ML index between the periods t and t + 1 is . The following formula represents a calculation for a productivity index known as , which is used to evaluate changes in productivity over two consecutive time periods, t and t + 1. The productivity index considers various factors represented by the vectors and which correspond to specific inputs, expected outputs, unexpected outputs, and direction vectors, respectively. Breaking down the formula, the numerator of the expression represents the potential change in productivity from time t to time t + 1 based on the inputs, expected outputs, unexpected outputs, and direction vectors for the later time period. The denominator represents the initial productivity level at time t based on the inputs, expected outputs, unexpected outputs, and direction vectors. Similarly, the second part of the expression in the numerator represents the potential change in productivity from time t + 1 to t + 2. The last part in the denominator represents the initial productivity level at time t + 1. The entire formula essentially calculates the ratio of potential productivity changes between time periods t and t + 1, and between time periods t + 1 and t + 2, while considering the specified input, output, and direction vectors. This ratio provides insights into the directional change in productivity over the two consecutive time periods:
Equation (4)
Within Equation (4), D represents the production unit DMU, while the letters x, y, d, and g symbolize the production inputs, anticipated outputs, unforeseen outputs, and direction vectors, respectively. The production input variables considered in this study include capital, labor, energy, and science and technology. The net value of fixed assets in the manufacturing industry, adjusted using the fixed asset investment price index, serves as a proxy for the capital input. The size of the firms in the manufacturing sector is measured by their employment of workers. In the industrial sector, energy inputs are calculated using total energy consumption. R&D expenditures for manufacturing technology innovation are used as a barometer for expenditures on innovative science and technology. The R&D investment in manufacturing technology innovation is computed as follows based on the data provided for this paper: manufacturing output sales value divided by total industrial output value, multiplied by industrial enterprises’ R&D spending, and divided by 10,000,000,000 yuan. Both the desired product and by-product are regarded as output elements. Due to the discontinuation of publishing the complete production value for the manufacturing sector after 2012, the projected output is computed using the total sales value instead. Ten thousand tons of sulfur dioxide (SO2) emissions are used as a proxy indicator for environmental pollution in the manufacturing sector to determine the negative impact. The manufacturing sector’s SO2 emissions are specifically calculated by dividing the 10,000 tons of standard coal by the industrial sulfur dioxide emission, multiplied by the manufacturing sector’s sales output value by the total industrial output value.
3.3.3. Mediating Variable: Green Technology Adoption
In the existing literature, green technology adoption is commonly measured using either R&D expenditure or invention patents. The number of patents is often preferred due to its ease of accessibility, abundance of information, and comparability. Considering the availability of data, technological innovation in this study is quantified by taking the logarithm of patent grants.
3.4. Control Variables
In this study, a thorough set of control variables was considered, covering a variety of factors like industry, city, government, environment, economics, and international commerce. The selected control variables encompassed industrial-scale structure (Sca), urbanization rate (Urban), environmental regulation (Er), financial concentration (Gover), level of economic development (Lngdp), and degree of global trade openness (Trade).
3.5. Data Descriptions
This work used a panel data research design with 30 Chinese provinces, municipalities, and autonomous regions to guarantee data availability and continuity. The study’s temporal scope extended from 2008 to 2020. Data sources for the study encompassed the China Statistical Yearbook, the China Statistical Yearbook on Innovation-based Technology Industry, the China Industry Statistical Yearbook, the China Population and Employment Statistics Yearbook, and the China Statistical Yearbook on Science and Technology, as well as the statistical yearbooks of specific provinces and municipalities. Table 2 and Table 3 provide comprehensive descriptions and statistical summaries of the variables considered in the analysis.
Table 3.
Summary statistics.
4. Results
4.1. Examining Benchmark Linear Regression Results and Mediating Role of Green Technology Adoption Innovation
The outcomes of both the linear OLS (ordinary least squares) regression and the mediating effect of the GTA are displayed in Table 4. Model (1) depicts how IDIA affects GEG in the manufacturing sector. Model (2) illustrates how IDIA affected GTA. Finally, Model (3) displays the benchmark regression findings after accounting for GTA.
Table 4.
Innovation-driven industrial agglomeration, green technology adoption, and green economic growth.
To ensure the reliability of the findings, this study used robust standard errors in the regression analysis and considered both individual and time-fixed effects. The association between green economic growth (GEG) and an innovation-driven industrial agglomeration (Lnindust) was investigated using panel regression analysis. As shown in Table 4, mediation variables were also added to a benchmark regression to evaluate the mediation impact. Model (1) in Table 4 explicitly looks at how the degree of green economic growth is affected by the basic explanatory parameters of innovation-driven industrial agglomeration. The results validate the positive correlation by demonstrating that a rise in the extent of an innovation-driven industrial agglomeration contributes to the growth of the green economy. The procedural analysis of the study is presented in Figure 2.
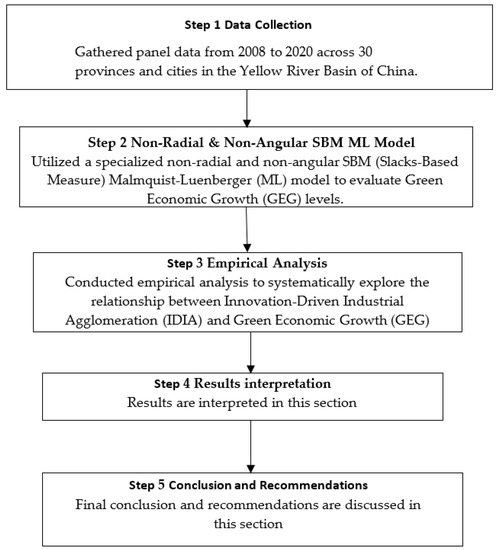
Figure 2.
Procedure of analysis for innovation-driven industrial agglomeration (IDIA) and green economic growth (GEG) relationship.
The coefficient related to industrial agglomeration demonstrates statistical significance at the 1% level, aligning with the anticipated outcomes outlined in the model construction section. The regression outcomes for models (1) and (3) depicted in Table 4 illustrate that, subsequent to integrating the reference regression and the mediation variable regression for green technology adoption, the coefficients pertaining to innovation-driven industrial agglomeration and green technology adoption continue to be highly significant positive factors at the 1% level. Additionally, at the 1% level, the regression coefficient for agglomeration on the adoption of green technologies is also noticeably favorable. This suggests that innovation-driven industrial agglomeration facilitates the adoption of green practices in the manufacturing industry through green technology adoption, acting as a mediator between innovation-driven industrial agglomeration and green economic growth.
4.2. Regional Heterogeneity Analysis
Owing to variations in factor resources and labor conditions across different regions, there exists regional diversity in the influence of innovation-driven industrial agglomeration on green economic growth. To account for this, an additional regional regression analysis is conducted. China is classified into three regions as per the National Bureau of Statistics’ classification criteria: the eastern, central, and western regions. Table 5 provides a breakdown of the regression results by region. The eastern region houses the most economically advanced part of China, boasting major cities such as Beijing, Tianjin, Shanghai, Nanjing, Guangzhou, and Shenzhen. Situated between the eastern coastal and western inland areas, the central region, with provinces like Shanxi, Henan, Anhui, Hubei, Jiangxi, and Hunan, functions as a bridge and has been historically marked by diverse industrial development, currently occupying an intermediate industrialization stage.
Table 5.
Region heterogeneity.
In Table 5, the results presented in Models 4 to 6 correspond to developed regions, Models 7 to 8 represent middle-developed regions, and Models 9 to 12 pertain to underdeveloped regions. This categorization sheds light on the varying effects of innovation-driven industrial agglomerations across different stages of economic development. The reason behind this distinction could be attributed to the observation that the concentration of innovation-driven industrial agglomerations has likely peaked in China’s economically prosperous regions. Consequently, further advancements in the extent of innovation-driven industrial agglomeration may not significantly impact the degree of green economic growth in these areas. This finding contradicts initial expectations. Interestingly, regions classified as economically underdeveloped or in the middle stages of modernization exhibit lower levels of industrial agglomeration driven by innovation. However, the influence of such agglomeration on the growth of the green economy is more pronounced in these regions. Specifically, the agglomeration coefficient for high-tech sectors in the middle stage of industrialization is 0.513 (as indicated in Table 5, column 7). Conversely, in economically underdeveloped regions, the agglomeration coefficient is 0.244 (Table 5, column 10), suggesting a slightly weaker promotion effect compared to the middle stage of industrialization. This discrepancy can be attributed to the relatively limited high-tech development in underdeveloped regions, which includes constraints related to the market system, infrastructure, and production equipment. Additionally, the absence of robust infrastructure support and reduced net revenue from agglomeration contribute to the reduced extent of high-tech industrial clustering in economically disadvantaged regions.
The primarily inland western region is distinguished by complicated geology, a meager transportation network, and economic underdevelopment. The examination of regional heterogeneity in Table 5 indicates the direct impacts of industrial agglomerations generated by innovation on the expansion of the green economy. It reveals that the agglomeration coefficient of the innovation-driven industrial agglomeration has a large beneficial effect throughout the middle stage of industrialization. However, the agglomeration coefficient of the innovation-driven industrial agglomeration is not significant in developed areas, suggesting that the concentration of innovation-driven industries substantially fosters the environmentally conscious evolution of the manufacturing sector primarily within regions at the intermediate stage of industrialization or those that are less developed.
The local heterogeneity study is revealed in Table 5, considering the indirect effects of adopting green technologies on green economic growth and the modernization of the industrial sector. A captivating discovery from the regression outcomes is the coefficient associated with the indirect effect of green technology adoption and the agglomeration coefficient of regional industrial agglomerations driven by regional innovation in the middle stage of industrialization have the opposite sign. This suggests a different effect from past industrialization levels. According to the test rules, the test results in Table 5 demonstrate the intermediary effect.
The adoption of green technologies acts as a bridge between industrial agglomerations driven by innovation and the green economic expansion of the manufacturing sector during the intermediate stage of industrialization. This suggests that the uptake of green technologies is crucial in mediating the effects of innovation-driven industrial agglomeration on the development of a green economy and the modernization of the manufacturing sector at this particular stage. This result has several explanations. To begin with, regions situated in the intermediate phase of industrialization tend to exhibit higher levels of development, well-established infrastructure, and regional strengths, creating an ideal environment for high-tech enterprises to flourish and expand quickly. Second, the high-tech industry has great innovation skills that support the development of green transformation and modernization of the manufacturing industry due to its capital- and technology-intensive nature.
4.3. Industry Pollution Variability
To analyze the variety of industrial pollution, more study is required. Based on changing pollution levels, this study divides manufacturing sector sample data into light pollution and heavy pollution businesses. Differences in pollution levels among different industries could influence how innovation-driven industry agglomeration impacts green economic growth. Analyzing at the national level might mask industry-specific traits, underscoring the significance of a more diverse examination of industrial pollution. Table 6 illustrates the direct consequences of innovation-driven industrial agglomeration on the environmentally friendly transformation and enhancement of the manufacturing sector, considering geographical variations. The findings show a statistically significant positive coefficient for the concentration of industrial agglomerations caused by innovation in highly polluting industries. This implies that a crucial element in promoting the environmentally conscious evolution of the manufacturing sector is the clustering of innovative industries in regions with high pollution levels.
Table 6.
Industrial pollution heterogeneity.
The manufacturing sector, which is notorious for its high levels of investment, pollution, energy consumption, and inefficiency, is now embracing green transformation as a crucial component of the country’s development plan. Dirty industries are in urgent need of transformation, and the presence of innovative industry with its strong high-level green technology adoption capability and spillover effects in talent, knowledge, and technology contributes to this transformation. The manufacturing industry’s green transformation and modernization are also explored in Table 6, along with the industrial pollution variability in indirect consequences of innovative industry. In the regression findings, there is an inverse relationship between the agglomeration coefficient of innovative industries and the product of the indirect effect coefficient of technological innovation in heavily polluting sectors. According to the intermediary effect test, green technology adoption serves as a mediator between innovation-driven industrial agglomeration and dirty industries’ green transformation. This implies that green technology adoption partially mediates the influence of innovation-driven industrial agglomeration on GEG through upgrading the manufacturing industry in these sectors. Dirty industries face the urgent need to transition from inefficient resource-based development to efficient growth driven by green technological progress.
This motivation increased R&D and investment in green innovation, thereby positively influencing the manufacturing industry’s green transformation. Robustness tests were performed, including the Winsorize method to handle outliers and non-randomness of the explained variables, for results confirmation. Robustness tests provide additional evidence supporting the validity of the study’s findings (see Table 7).
Table 7.
Robustness test.
5. Discussions
In pursuit of sustainable development, reduced environmental impact, and optimized economic gains, nations are increasingly prioritizing the adoption of green technology as a means to conserve resources and energy [104]. The role of green technological innovation is pivotal in enhancing the effective utilization and allocation of natural resources, the integration of raw material efficiency, and energy consumption within the manufacturing process, resulting in the creation of energy-efficient products [104]. Through optimizing resource allocation, the development of eco-friendly products, and the enhancement of raw material efficiency and energy utilization, green innovation contributes significantly to the sustainable management of natural resources. The overarching objective is to enhance energy utilization efficiency, transition toward knowledge-based natural resource management, and improve the overall efficiency of resource utilization and output. This notion finds support in prior research conducted by Nchofoung, Fotio [105] and Moslehpour, Aldeehani [106] However, despite these assertions, empirical investigations into the tangible impact of green technology adoption on resource consumption efficiency remain scarce, leaving the link between green technology adoption and efficient natural resource utilization predominantly theoretical. Amidst China’s notable 6.7% GDP growth rate in 2016, which marked substantial progress and consolidation, the country’s economy achieved a prominent global ranking with a contribution of over 30% to global economic growth [107]. Nonetheless, China continues to exhibit heightened levels of natural resource consumption compared to developed nations, and persistent pollution levels pose enduring challenges to the nation’s long-term economic sustainability [108]. Consequently, this study delves into Chinese data spanning 2001 to 2015 to scrutinize the efficiency of natural resource utilization during the nation’s rapid economic expansion. The study strives to reconcile energy conservation and emission reduction objectives with the overarching goals of the “2016 Paris Agreement,” thereby advancing the cause of sustainable development.
The global economy is experiencing rapid growth in low-carbon practices, as supported by studies conducted by Xing, Huang [109], Li, Wang [110], Yang, Hao [111], and Bonsu [112]. But, China’s current use of natural resources is characterized by low overall utilization, an inefficient style of use, and outmoded usage practices. Investments in resources and energy are unduly dependent on economic growth, which results in enormous waste and pollution. It is frequently forgotten how resource exploitation, excessive development, and environmental degradation are connected.
Additionally, insufficient comprehensive policy analysis and limited exchange of information hinder the efficacy of natural resource management and decision making, especially within inter-departmental contexts. Therefore, there is a need for more research and quantitative analysis to address these concerns and improve natural resource consumption efficiency. Global green growth is faced with both opportunities and problems as a new phase of industrial and technological transition emerges. The adoption of science and technology is essential for improving the effectiveness of natural resource use. Research and development efforts, both domestically and internationally, are concentrating on the adoption of green technologies, which address the objectives of economic low-carbon development and environmental protection. Numerous scholars, including Chen, Bai [113], Du, Feng [114], Li, Xu [115] and Shi, Wei [116] have looked into the connection between company innovation in green energy technologies and industrial agglomeration. Due to geographical effects and knowledge spillovers, their findings imply that such an agglomeration not only fosters innovation within the local area but also has a favorable influence on nearby regions.
6. Conclusions
The Chinese government has made concerted efforts to enhance green industrial agglomeration as part of its broader goal to promote environmentally sustainable economic growth. These endeavors encompass a range of approaches, including policy implementation, regulatory frameworks, and strategic planning. Initiatives such as the State Environmental Protection Administration, the Cleaner Production Promotion Act, and the National Development and Reform Commission exemplify China’s commitment to creating an ecosystem conducive to green industrial agglomerations. These efforts also acknowledge the critical impact of industrial agglomeration on green economic growth. By fostering innovation-driven industrial clusters that prioritize resource efficiency and environmental preservation, the government aims to bolster economic advancement while minimizing negative ecological consequences. This approach not only enhances industrial competitiveness but also contributes to the overall goal of achieving sustainable and balanced economic growth. Furthermore, collaborations between the public and private sectors play a crucial role in driving the impact of industrial agglomeration on green economic growth. These collaborations, which align economic incentives with sustainability objectives, create a framework where industries thrive within the boundaries of environmental responsibility. By striking this equilibrium, China aims to cultivate an environment where industrial agglomeration acts as a catalyst for both economic prosperity and ecological well-being, paving the way for a more harmonious and sustainable future.
6.1. Theoretical Implications
Conducting an empirical analysis with panel data encompassing 30 Chinese provinces and cities spanning the years 2008 to 2020, the study aimed to ascertain the impact of innovation-driven industrial agglomeration on the enhancement of green economic growth through the transformation of the manufacturing sector. With a particular emphasis on the adoption of green technologies, the study’s main objective was to investigate the precise transmission mechanism between innovation-driven industrial agglomeration and green economic growth.
The empirical data present several important conclusions. First, innovation-driven industrial agglomeration contributes to the development of China’s manufacturing sector and green economic growth. However, the impact is found to be heterogeneous across regions and industries. In particular, in regions that are in the middle of industrialization or that are economically underdeveloped, innovation-driven industry agglomeration significantly promotes green economic growth through the transformation of the manufacturing industry, while it has no effect in economically developed regions. Similar to this, the innovation-driven industrial agglomeration makes a significant contribution to the green economic expansion of substantially polluting businesses but has little impact on the growth of slightly polluting companies.
Secondly, the study identifies green technology adoption as an important intermediary factor in the relationship between the agglomeration of innovation-driven industrial agglomeration and the promotion of green economic growth via the advancement of the manufacturing industry. GTA as an intermediary is found to vary across regions and industries, indicating regional and industry heterogeneity. For instance, in less developed areas, green technology adoption plays a significant mediating role between innovation-driven industrial agglomeration and green economic growth, while this mediating effect is not observed in developed areas. Similarly, in heavy pollution industries, green technology adoption serves as a substantial mediator between innovation-driven industrial agglomeration and green economic growth, while it is not as influential in light pollution industries. These findings are consistent with previous studies conducted by Chen, Huang [117], Guo, Tong [18], Li, Chen [118], and Zeng, Li [119], highlighting the complex interplay between innovation-driven industrial agglomeration, green technology adoption, and the green economic growth through the upgrading of China’s manufacturing industry.
6.2. Policy Implications
This study offers evidence for the inherent motivation of innovation-driven industrial agglomeration in fostering green economic growth by modernizing the manufacturing industry. The following recommendations for public policy are made in light of the research findings: First and foremost, it is crucial to strengthen support for innovation-driven industries and promote the concentration of enterprises that are driven by innovation by creating industrial parks. According to research, the clustering of enterprises focused on innovation can greatly speed up the green transformation and modernization of the industry. Innovation-driven enterprises, however, are under extreme pressure to survive in the current economic depression brought on by the epidemic and have restricted access to finance. Therefore, financial laws should be put into place, funding guarantees should be made available, and high-tech industries should pay as little in taxes and levies as possible. Second, a tailored strategy should be used to develop plans for encouraging innovation-driven industrial agglomerations that support green economic growth by upgrading the manufacturing sector. This approach should combine regional resource advantages with variations in industry pollution levels.
Additionally, legislative assistance for the modernization and upgrade of highly polluting businesses, as well as the growth of innovation-driven agglomerations, needs to be increased. The third goal is to educate industrial businesses working in economically underprivileged areas and polluting industries about the implementation of green technologies. Manufacturing enterprises need to transition from an ineffective growth model relying on resource inputs to an efficient growth strategy propelled by advancements in green technology and innovation. This shift is essential to facilitate the transformation of the manufacturing sector from a conventional high-pollution production approach to an environmentally friendly production mode. Therefore, both innovation-driven and manufacturing firms must adopt an innovative mindset and pursue green transformation while adopting green technologies for the ongoing transformation of the industrial structure. These recommendations align with previous studies conducted by Vrontis, Tardivo [120], Vrontis, Tardivo [120], Liu, Gao [121], and Aritenang [122], which emphasize the importance of policy measures to support innovation-driven industries, regional development strategies, and the adoption of green technology in driving the green transformation of the manufacturing industry.
6.3. Prospects for Future Research
Multiple methods exist for evaluating the adoption of green technology, each carrying its own strengths and weaknesses. This study focuses on evaluating green technology adoption (GTA), but there is room to incorporate macro aspects related to procedural and sustainable solutions for the economic growth of China. These macro factors include the effects of policy and regulations, research and development (R&D) budget allocations for sustainable innovation, and support for innovation-driven startups. Future research could explore these specific macro dimensions mentioned in the last line. However, due to limitations in the data source, which is restricted to provincial statistical yearbooks, further refinement of the data and additional analysis are not feasible.
Therefore, rather than focusing on differences across cities, this research uses a comparative analysis based on regional variances. There are still several topics that demand more study. For example, this study solely examines electricity usage as an energy input to evaluate the efficacy of green development, omitting coal consumption due to limitations in data availability. In addition, investigating the effects of industrial agglomeration on green development from the standpoint of spatial correlation among cities may offer insightful information for cities hoping to make the transition to a green economy in the future.
Author Contributions
All authors contributed to the study’s conception and design. Material preparation, data collection, and analysis were performed by R.F. The first draft of the manuscript was also written by R.F., and all authors commented on previous versions of the manuscript. X.Q. improved the manuscript and helped in data analysis interpretation. All authors have read and agreed to the published version of the manuscript.
Funding
This research is sponsored by Shaanxi Provincial Social Science Fund Project: Measurement of the Effect of Shaanxi Province’s Digital Economy Empowering High-Quality Development of Manufacturing Industry, Long-Term Mechanism and Implementation Path Grant number (2021D054) and National Statistical Science Research Project in 2022: Effect Measurement and Realization Path of Digital Economy Enabling High Quality Development of Manufacturing Industry (2022LY061). The corresponding author, Ran Feng, received this research support.
Data Availability Statement
Not applicable.
Acknowledgments
We extend our heartfelt gratitude to all those who contributed to the realization of this research endeavor. Your invaluable insights, guidance, and unwavering support have been instrumental in shaping the outcomes of this study. We also acknowledge the institutions and individuals who generously provided resources and expertise, enabling us to navigate the challenges and achieve meaningful results. This research would not have been possible without your collective efforts, and we express our sincerest appreciation for your contributions.
Conflicts of Interest
The authors, Ran Feng and Xiao Qu, declare that they have no financial interests that could be perceived as influencing the outcome of this work. Furthermore, they affirm that there are no non-financial interests that might affect the interpretation or presentation of the content provided in this manuscript.
References
- Chen, J.; Gao, M.; Cheng, S.; Hou, W.; Song, M.; Liu, X.; Liu, Y.; Shan, Y. County-level CO2 emissions and sequestration in China during 1997–2017. Sci. Data 2020, 7, 391. [Google Scholar] [CrossRef] [PubMed]
- Bengtsson, M.; Alfredsson, E.; Cohen, M.; Lorek, S.; Schroeder, P. Transforming systems of consumption and production for achieving the sustainable development goals: Moving beyond efficiency. Sustain. Sci. 2018, 13, 1533–1547. [Google Scholar] [CrossRef] [PubMed]
- Parikh, J.; Shukla, V. Urbanization, energy use and greenhouse effects in economic development: Results from a cross-national study of developing countries. Glob. Environ. Chang. 1995, 5, 87–103. [Google Scholar] [CrossRef]
- Li, Z.; Shao, S.; Shi, X.; Sun, Y.; Zhang, X. Structural transformation of manufacturing, natural resource dependence, and carbon emissions reduction: Evidence of a threshold effect from China. J. Clean. Prod. 2019, 206, 920–927. [Google Scholar] [CrossRef]
- Yadav, G.; Luthra, S.; Huisingh, D.; Mangla, S.K.; Narkhede, B.E.; Liu, Y. Development of a lean manufacturing framework to enhance its adoption within manufacturing companies in developing economies. J. Clean. Prod. 2020, 245, 118726. [Google Scholar] [CrossRef]
- Gu, B.; Chen, F.; Zhang, K. The policy effect of green finance in promoting industrial transformation and upgrading efficiency in China: Analysis from the perspective of government regulation and public environmental demands. Environ. Sci. Pollut. Res. 2021, 28, 47474–47491. [Google Scholar] [CrossRef]
- Gao, J.; Qiao, W.; Ji, Q.; Yu, C.; Sun, J.; Ma, Z. Intensive-use-oriented identification and optimization of industrial land readjustment during transformation and development: A case study of Huai’an, China. Habitat Int. 2021, 118, 102451. [Google Scholar] [CrossRef]
- Lema, R.; Fu, X.; Rabellotti, R. Green windows of opportunity: Latecomer development in the age of transformation toward sustainability. Ind. Corp. Chang. 2020, 29, 1193–1209. [Google Scholar] [CrossRef]
- Liu, X.; Chen, S. Has environmental regulation facilitated the green transformation of the marine industry? Mar. Policy 2022, 144, 105238. [Google Scholar] [CrossRef]
- Li, Q.; Liu, S.; Yang, M.; Xu, F. The effects of China’s sustainable development policy for resource-based cities on local industrial transformation. Resour. Policy 2021, 71, 101940. [Google Scholar] [CrossRef]
- Ren, Y.; Tian, Y.; Zhang, C. Investigating the mechanisms among industrial agglomeration, environmental pollution and sustainable industrial efficiency: A case study in China. Environ. Dev. Sustain. 2022, 24, 12467–12493. [Google Scholar] [CrossRef]
- Zhang, H.; Zhang, J.; Song, J. Analysis of the threshold effect of agricultural industrial agglomeration and industrial structure upgrading on sustainable agricultural development in China. J. Clean. Prod. 2022, 341, 130818. [Google Scholar] [CrossRef]
- Xie, W.; Li, X. Can industrial agglomeration facilitate green development? Evidence from China. Front. Environ. Sci. 2021, 9, 745465. [Google Scholar] [CrossRef]
- Otsuka, A.; Goto, M.; Sueyoshi, T. Industrial agglomeration effects in Japan: Productive efficiency, market access, and public fiscal transfer. Pap. Reg. Sci. 2010, 89, 819–840. [Google Scholar] [CrossRef]
- Tanaka, K.; Managi, S. Industrial agglomeration effect for energy efficiency in Japanese production plants. Energy Policy 2021, 156, 112442. [Google Scholar] [CrossRef]
- Yuan, H.; Feng, Y.; Lee, C.-C.; Cen, Y. How does manufacturing agglomeration affect green economic efficiency? Energy Econ. 2020, 92, 104944. [Google Scholar] [CrossRef]
- Liu, K.; Xue, Y.; Chen, Z.; Miao, Y.; Shi, J. Economic spatial structure of China’s urban agglomerations: Regional differences, distribution dynamics, and convergence. Sustain. Cities Soc. 2022, 87, 104253. [Google Scholar] [CrossRef]
- Guo, Y.; Tong, L.; Mei, L. The effect of industrial agglomeration on green development efficiency in Northeast China since the revitalization. J. Clean. Prod. 2020, 258, 120584. [Google Scholar] [CrossRef]
- Fan, C.C.; Scott, A.J. Industrial agglomeration and development: A survey of spatial economic issues in East Asia and a statistical analysis of Chinese regions. Econ. Geogr. 2003, 79, 295–319. [Google Scholar] [CrossRef]
- Klarin, A.; Sharmelly, R.; Suseno, Y. A systems perspective in examining industry clusters: Case studies of clusters in Russia and India. J. Risk Financ. Manag. 2021, 14, 367. [Google Scholar] [CrossRef]
- Ellison, G.; Glaeser, E.L. The geographic concentration of industry: Does natural advantage explain agglomeration? Am. Econ. Rev. 1999, 89, 311–316. [Google Scholar] [CrossRef]
- Marshall, A. Principles of Economics: Unabridged, 8th ed.; Cosimo Inc.: New York, NY, USA, 2009. [Google Scholar]
- Van der Panne, G. Agglomeration externalities: Marshall versus jacobs. J. Evol. Econ. 2004, 14, 593–604. [Google Scholar] [CrossRef]
- Neffke, F.; Henning, M.; Boschma, R.; Lundquist, K.-J.; Olander, L.-O. The dynamics of agglomeration externalities along the life cycle of industries. Reg. Stud. 2011, 45, 49–65. [Google Scholar] [CrossRef]
- Bellandi, M. The industrial district in Marshall. In Small Firms and Industrial Districts in Italy; Routledge: London, UK, 1989; pp. 136–152. [Google Scholar]
- Hoover, E.M. The location of economic activity. Am. Econ. Rev. 1948, 57, 211–222. [Google Scholar]
- Hao, Y.; Guo, Y.; Li, S.; Luo, S.; Jiang, X.; Shen, Z.; Wu, H. Towards achieving the sustainable development goal of industry: How does industrial agglomeration affect air pollution? Innov. Green Dev. 2022, 1, 100003. [Google Scholar] [CrossRef]
- Wu, R.; Lin, B. Does industrial agglomeration improve effective energy service: An empirical study of China’s iron and steel industry. Appl. Energy 2021, 295, 117066. [Google Scholar] [CrossRef]
- Meadows, D.H.; Meadows, D.L.; Randers, J.; Behrens, W.W. The Limits to Growth-Club of Rome; Universe Books: New York, NY, USA, 1972. [Google Scholar]
- Dong, F.; Li, Y.; Qin, C.; Sun, J. How industrial convergence affects regional green development efficiency: A spatial conditional process analysis. J. Environ. Manag. 2021, 300, 113738. [Google Scholar] [CrossRef]
- Fabozzi, F.J.; Focardi, S.; Ponta, L.; Rivoire, M.; Mazza, D. The economic theory of qualitative green growth. Struct. Chang. Econ. Dyn. 2022, 61, 242–254. [Google Scholar] [CrossRef]
- Tang, R.; Zhao, J.; Liu, Y.; Huang, X.; Zhang, Y.; Zhou, D.; Ding, A.; Nielsen, C.P.; Wang, H. Air quality and health co-benefits of China’s carbon dioxide emissions peaking before 2030. Nat. Commun. 2022, 13, 1008. [Google Scholar] [CrossRef]
- Kang, D.; Zhai, X.; Chen, F.; Wang, W.; Lu, J. How to promote the development of a green economy: Talent or technology?—Evidence from China’s high-speed rail. Front. Psychol. 2022, 13, 953506. [Google Scholar] [CrossRef]
- Song, X.; Zhou, Y.; Jia, W. How do economic openness and R&D investment affect green economic growth?—Evidence from China. Resour. Conserv. Recycl. 2019, 146, 405–415. [Google Scholar]
- Soundarrajan, P.; Vivek, N. Green finance for sustainable green economic growth in India. Agric. Econ. 2016, 62, 35–44. [Google Scholar] [CrossRef]
- Cao, J.; Law, S.H.; Samad, A.R.B.A.; Mohamad, W.N.B.W.; Wang, J.; Yang, X. Impact of financial development and technological innovation on the volatility of green growth—Evidence from China. Environ. Sci. Pollut. Res. 2021, 28, 48053–48069. [Google Scholar] [CrossRef]
- Lin, B.; Zhu, J. Fiscal spending and green economic growth: Evidence from China. Energy Econ. 2019, 83, 264–271. [Google Scholar] [CrossRef]
- Dogan, E.; Altinoz, B.; Madaleno, M.; Taskin, D. The impact of renewable energy consumption to economic growth: A replication and extension of. Energy Econ. 2020, 90, 104866. [Google Scholar] [CrossRef]
- Talebzadehhosseini, S.; Garibay, I. The interaction effects of technological innovation and path-dependent economic growth on countries overall green growth performance. J. Clean. Prod. 2022, 333, 130134. [Google Scholar] [CrossRef]
- Ren, S.; Hao, Y.; Wu, H. How does green investment affect environmental pollution? Evidence from China. Environ. Resour. Econ. 2022, 81, 25–51. [Google Scholar] [CrossRef]
- Ali, S.A.; Alharthi, M.; Hussain, H.I.; Rasul, F.; Hanif, I.; Haider, J.; Ullah, S.; Ur Rahman, S.; Abbas, Q. A clean technological innovation and eco-efficiency enhancement: A multi-index assessment of sustainable economic and environmental management. Technol. Forecast. Soc. Chang. 2021, 166, 120573. [Google Scholar] [CrossRef]
- Licastro, A.; Sergi, B.S. Drivers and barriers to a green economy. A review of selected balkan countries. Clean. Eng. Technol. 2021, 4, 100228. [Google Scholar] [CrossRef]
- Mo, Y.; Ullah, S.; Ozturk, I. Green investment and its influence on green growth in high polluted Asian economies: Do financial markets and institutions matter? Econ. Res.-Ekon. Istraž. 2023, 36, 2140302. [Google Scholar] [CrossRef]
- NBSC (National Bureau of Statistics of China). China Statistical Yearbook; China Statistics Press: Bejing, China, 2022. [Google Scholar]
- Li, K.; Lin, B. Impact of energy conservation policies on the green productivity in China’s manufacturing sector: Evidence from a three-stage DEA model. Appl. Energy 2016, 168, 351–363. [Google Scholar] [CrossRef]
- Gramkow, C.; Anger-Kraavi, A. Developing green: A case for the Brazilian manufacturing industry. Sustainability 2019, 11, 6783. [Google Scholar] [CrossRef]
- Zheng, Y.; Qi, J.; Chen, X. The effect of increasing exports on industrial energy intensity in China. Energy Policy 2011, 39, 2688–2698. [Google Scholar] [CrossRef]
- Chen, C.; van Groenigen, K.J.; Yang, H.; Hungate, B.A.; Yang, B.; Tian, Y.; Chen, J.; Dong, W.; Huang, S.; Deng, A. Global warming and shifts in cropping systems together reduce China’s rice production. Glob. Food Secur. 2020, 24, 100359. [Google Scholar] [CrossRef]
- Kong, Y.; Khan, R. To examine environmental pollution by economic growth and their impact in an environmental Kuznets curve (EKC) among developed and developing countries. PLoS ONE 2019, 14, e0209532. [Google Scholar] [CrossRef]
- Magazzino, C.; Mele, M.; Schneider, N. The relationship between air pollution and COVID-19-related deaths: An application to three French cities. Appl. Energy 2020, 279, 115835. [Google Scholar] [CrossRef]
- Urhie, E.; Afolabi, A.; Afolabi, A.; Matthew, O.; Osabohien, R.; Ewetan, O. Economic growth, air pollution and health outcomes in Nigeria: A moderated mediation model. Cogent Soc. Sci. 2020, 6, 1719570. [Google Scholar] [CrossRef]
- Zhang, K.; Xu, D.; Li, S. The impact of environmental regulation on environmental pollution in China: An empirical study based on the synergistic effect of industrial agglomeration. Environ. Sci. Pollut. Res. 2019, 26, 25775–25788. [Google Scholar] [CrossRef]
- Li, X.; Lai, X.; Zhang, F. Research on green innovation effect of industrial agglomeration from perspective of environmental regulation: Evidence in China. J. Clean. Prod. 2021, 288, 125583. [Google Scholar] [CrossRef]
- Zhang, H.; Song, Y.; Zhang, L. Pollution control in urban China: A multi-level analysis on household and industrial pollution. Sci. Total Environ. 2020, 749, 141478. [Google Scholar] [CrossRef]
- Wu, Y.; Li, X.; Yu, L.; Wang, T.; Wang, J.; Liu, T. Review of soil heavy metal pollution in China: Spatial distribution, primary sources, and remediation alternatives. Resour. Conserv. Recycl. 2022, 181, 106261. [Google Scholar] [CrossRef]
- Fan, W.; Wang, F.; Liu, S.; Chen, T.; Bai, X.; Zhang, Y. How does financial and manufacturing co-agglomeration affect environmental pollution? Evidence from China. J. Environ. Manag. 2023, 325, 116544. [Google Scholar] [CrossRef] [PubMed]
- Zhang, X.; Zhang, Y.; Shi, P.; Bi, Z.; Shan, Z.; Ren, L. The deep challenge of nitrate pollution in river water of China. Sci. Total Environ. 2021, 770, 144674. [Google Scholar] [CrossRef] [PubMed]
- Ye, C.; Zhu, J.; Li, S.; Yang, S.; Chen, M. Assessment and analysis of regional economic collaborative development within an urban agglomeration: Yangtze River Delta as a case study. Habitat Int. 2019, 83, 20–29. [Google Scholar] [CrossRef]
- Li, C.; Gao, X.; Wu, J.; Wu, K. Demand prediction and regulation zoning of urban-industrial land: Evidence from Beijing-Tianjin-Hebei Urban Agglomeration, China. Environ. Monit. Assess. 2019, 191, 412. [Google Scholar] [CrossRef]
- Ning, L.; Wang, F.; Li, J. Urban innovation, regional externalities of foreign direct investment and industrial agglomeration: Evidence from Chinese cities. Res. Policy 2016, 45, 830–843. [Google Scholar] [CrossRef]
- Caragliu, A.; de Dominicis, L.; de Groot, H.L. Both Marshall and Jacobs were right! Econ. Geogr. 2016, 92, 87–111. [Google Scholar] [CrossRef]
- Yang, H.; Zhang, F.; He, Y. Exploring the effect of producer services and manufacturing industrial co-agglomeration on the ecological environment pollution control in China. Environ. Dev. Sustain. 2021, 23, 16119–16144. [Google Scholar] [CrossRef]
- McCann, P.; Van Oort, F. Theories of agglomeration and regional economic growth: A historical review. In Handbook of Regional Growth and Development Theories; Edward Elgar Publishing: Cheltenham, UK, 2019; pp. 6–23. [Google Scholar]
- Tao, J.; Wang, Y.; Zameer, H. Can urban spatial structure adjustment mitigate air pollution effect of economic agglomeration? New evidence from the Yangtze River Delta region, China. Environ. Sci. Pollut. Res. 2023, 30, 57302–57315. [Google Scholar] [CrossRef]
- Cohen, J.P.; Coughlin, C.C.; Paul, C.J.M. Agglomeration, productivity and regional growth: Production theory approaches. In Handbook of Regional Growth and Development Theories; Edward Elgar Publishing: Cheltenham, UK, 2019; pp. 104–123. [Google Scholar]
- Wang, Y.; Yao, L.; Xu, Y.; Sun, S.; Li, T. Potential heterogeneity in the relationship between urbanization and air pollution, from the perspective of urban agglomeration. J. Clean. Prod. 2021, 298, 126822. [Google Scholar] [CrossRef]
- Cai, X.; Zhu, B.; Zhang, H.; Li, L.; Xie, M. Can direct environmental regulation promote green technology innovation in heavily polluting industries? Evidence from Chinese listed companies. Sci. Total Environ. 2020, 746, 140810. [Google Scholar] [CrossRef] [PubMed]
- Barbieri, N.J. Fuel prices and the invention crowding out effect: Releasing the automotive industry from its dependence on fossil fuel. Technol. Forecast. Soc. Chang. 2016, 111, 222–234. [Google Scholar] [CrossRef]
- Trajtenberg, M.; Henderson, R.; Jaffe, A. University versus corporate patents: A window on the basicness of invention. Econ. Innov. New Technol. 1997, 5, 19–50. [Google Scholar] [CrossRef]
- Barbieri, N.; Marzucchi, A.; Rizzo, U.J. Knowledge sources and impacts on subsequent inventions: Do green technologies differ from non-green ones? Res. Policy 2020, 49, 103901. [Google Scholar] [CrossRef]
- Wang, J.; Zhang, Y. Environmental regulation, green technologically innovative intention and green technologically innovative behavior. Stud. Sci. Sci. 2018, 36, 352–360. [Google Scholar]
- Wang, Y.; Yu, L. Can the current environmental tax rate promote green technology innovation?—Evidence from China’s resource-based industries. J. Clean. Prod. 2021, 278, 123443. [Google Scholar] [CrossRef]
- Zhou, W.; Su, D.; Yang, J.; Tao, D.; Sohn, D. When do strategic orientations matter to innovation performance of green-tech ventures? The moderating effects of network positions. J. Clean. Prod. 2021, 279, 123743. [Google Scholar] [CrossRef]
- Tolliver, C.; Fujii, H.; Keeley, A.R.; Managi, S. Green innovation and finance in Asia. Asian Econ. Policy Rev. 2021, 16, 67–87. [Google Scholar] [CrossRef]
- Tang, D.Y.Y.; Yew, G.Y.; Koyande, A.K.; Chew, K.W.; Vo, D.-V.N.; Show, P.L. Green technology for the industrial production of biofuels and bioproducts from microalgae: A review. Environ. Chem. Lett. 2020, 18, 1967–1985. [Google Scholar] [CrossRef]
- Yousef, S.; Tatariants, M.; Tichonovas, M.; Kliucininkas, L.; Lukošiūtė, S.-I.; Yan, L. Sustainable green technology for recovery of cotton fibers and polyester from textile waste. J. Clean. Prod. 2020, 254, 120078. [Google Scholar] [CrossRef]
- Zhang, W.; Li, G. Environmental decentralization, environmental protection investment, and green technology innovation. Environ. Sci. Pollut. Res. 2020, 29, 12740–12755. [Google Scholar] [CrossRef]
- Zhen, L.; Wu, Y.; Wang, S.; Laporte, G. Green technology adoption for fleet deployment in a shipping network. Transp. Res. Part B Methodol. 2020, 139, 388–410. [Google Scholar] [CrossRef]
- Hussain, J.; Pan, Y.; Ali, G.; Yue, X. Pricing behavior of monopoly market with the implementation of green technology decision under emission reduction subsidy policy. Sci. Total Environ. 2020, 709, 136110. [Google Scholar] [CrossRef]
- Guo, M.; Nowakowska-Grunt, J.; Gorbanyov, V.; Egorova, M. Green Technology and Sustainable Development: Assessment and Green Growth Frameworks. Sustainability 2020, 12, 6571. [Google Scholar] [CrossRef]
- Lisi, W.; Zhu, R.; Yuan, C. Embracing green innovation via green supply chain learning: The moderating role of green technology turbulence. Sustain. Dev. 2020, 28, 155–168. [Google Scholar] [CrossRef]
- Perruchas, F.; Consoli, D.; Barbieri, N. Specialisation, diversification and the ladder of green technology development. Res. Policy 2020, 49, 103922. [Google Scholar] [CrossRef]
- Orlando, B.; Ballestra, L.V.; Scuotto, V.; Pironti, M.; Giudice, M.D. The impact of R&D investments on Eco-innovation: A cross-cultural perspective of green technology management. IEEE Trans. Eng. Manag. 2022, 69, 2275–2284. [Google Scholar]
- Yin, S.; Zhang, N.; Li, B. Enhancing the competitiveness of multi-agent cooperation for green manufacturing in China: An empirical study of the measure of green technology innovation capabilities and their influencing factors. Sustain. Prod. Consum. 2020, 23, 63–76. [Google Scholar] [CrossRef]
- Jung, S.H.; Feng, T. Government Subsidies for Green Technology Development under Uncertainty. Eur. J. Oper. Res. 2020, 286, 726–739. [Google Scholar] [CrossRef]
- Bian, J.; Zhang, G.; Zhou, G. Manufacturer vs Consumer Subsidy with Green Technology Investment and Environmental Concern. Eur. J. Oper. Res. 2020, 287, 832–843. [Google Scholar] [CrossRef]
- Wang, X.; Cho, S.-H.; Scheller-Wolf, A. Green Technology Development and Adoption: Competition, Regulation, and Uncertainty—A Global Game Approach. Manag. Sci. 2020, 67, 201–219. [Google Scholar] [CrossRef]
- Appiah, M.O. Investigating the multivariate Granger causality between energy consumption, economic growth and CO2 emissions in Ghana. Energy Policy 2018, 112, 198–208. [Google Scholar] [CrossRef]
- Du, K.; Li, P.; Yan, Z.J.T.F.; Change, S. Do green technology innovations contribute to carbon dioxide emission reduction? Empirical evidence from patent data. Technol. Forecast. Soc. Chang. 2019, 146, 297–303. [Google Scholar] [CrossRef]
- Ganda, F. The impact of innovation and technology investments on carbon emissions in selected organisation for economic Co-operation and development countries. J. Clean. Prod. 2019, 217, 469–483. [Google Scholar] [CrossRef]
- Hashmi, R.; Alam, K. Dynamic relationship among environmental regulation, innovation, CO2 emissions, population, and economic growth in OECD countries: A panel investigation. J. Clean. Prod. 2019, 231, 1100–1109. [Google Scholar] [CrossRef]
- Inkinen, T.; Suorsa, K. Intermediaries in regional innovation systems: High-technology enterprise survey from Northern Finland. Eur. Plan. Stud. 2010, 18, 169–187. [Google Scholar] [CrossRef]
- Aritenang, A.F.; Chandramidi, A.N. The impact of special economic zones and government intervention on firm productivity: The case of Batam, Indonesia. Bull. Indones. Econ. Stud. 2020, 56, 225–249. [Google Scholar] [CrossRef]
- Carayannis, E.G.; Dezi, L.; Gregori, G.; Calo, E. Smart environments and techno-centric and human-centric innovations for Industry and Society 5.0: A quintuple helix innovation system view towards smart, sustainable, and inclusive solutions. J. Knowl. Econ. 2021, 13, 926–955. [Google Scholar] [CrossRef]
- Deng, Y.; Cui, Y.; Khan, S.U.; Zhao, M.; Lu, Q. The spatiotemporal dynamic and spatial spillover effect of agricultural green technological progress in China. Environ. Sci. Pollut. Res. 2022, 29, 27909–27923. [Google Scholar] [CrossRef]
- Jibhakate, R.A.; Nirwan, N.W.; Rambhad, K.S. Enhancing the effectiveness of green technology in manufacturing industry. Mater. Today Proc. 2021, 47, 4298–4305. [Google Scholar] [CrossRef]
- Wang, M.; Xu, M.; Ma, S. The effect of the spatial heterogeneity of human capital structure on regional green total factor productivity. Struct. Chang. Econ. Dyn. 2021, 59, 427–441. [Google Scholar] [CrossRef]
- Drucker, S.; Puri, M. On loan sales, loan contracting, and lending relationships. Rev. Financ. Stud. 2009, 22, 2835–2872. [Google Scholar] [CrossRef]
- Maslikhina, V. Spatial concentration of the manufacturing industry: Evidence from Russia. J. Appl. Eng. Sci. 2017, 15, 509–517. [Google Scholar] [CrossRef]
- Guo, Q.; Wang, J.; Yin, H.; Zhang, G. A comprehensive evaluation model of regional atmospheric environment carrying capacity: Model development and a case study in China. Ecol. Indic. 2018, 91, 259–267. [Google Scholar] [CrossRef]
- Chen, C.; Lan, Q.; Gao, M.; Sun, Y. Green total factor productivity growth and its determinants in China’s industrial economy. Sustainability 2018, 10, 1052. [Google Scholar] [CrossRef]
- Xia, F.; Xu, J. Green total factor productivity: A re-examination of quality of growth for provinces in China. China Econ. Rev. 2020, 62, 101454. [Google Scholar] [CrossRef]
- Chung, Y.H.; Färe, R.; Grosskopf, S. Productivity and undesirable outputs: A directional distance function approach. J. Environ. Manag. 1997, 51, 229–240. [Google Scholar] [CrossRef]
- Olawumi, T.O.; Chan, D.W.; Saka, A.B.; Ekundayo, D.; Odeh, A.O. Are there any gains in green-tech adoption? Unearthing the beneficial outcomes of smart-sustainable practices in Nigeria and Hong Kong built environment. J. Clean. Prod. 2023, 410, 137280. [Google Scholar] [CrossRef]
- Nchofoung, T.N.; Fotio, H.K.; Miamo, C.W. Green taxation and renewable energy technologies adoption: A global evidence. Renew. Energy Focus 2023, 44, 334–343. [Google Scholar] [CrossRef]
- Moslehpour, M.; Aldeehani, T.M.; Sibghatullah, A.; Tai, T.D.; Phan, T.T.H.; Ngo, T.Q. Dynamic association between technological advancement, green finance, energy efficiency and sustainable development: Evidence from Vietnam. Econ. Res.-Ekon. Istraž. 2023, 36, 2190796. [Google Scholar] [CrossRef]
- Miao, X.; Han, J.; Wang, S.; Li, X. Spatial effects of market integration on the industrial agglomeration of agricultural products: Evidence from China. Environ. Sci. Pollut. Res. 2023, 30, 84949–84971. [Google Scholar] [CrossRef] [PubMed]
- Miao, W.; Huang, X.; Song, Y. An economic assessment of the health effects and crop yield losses caused by air pollution in mainland China. J. Environ. Sci. 2017, 56, 102–113. [Google Scholar] [CrossRef] [PubMed]
- Xing, Z.; Huang, J.; Wang, J. Unleashing the potential: Exploring the nexus between low-carbon digital economy and regional economic-social development in China. J. Clean. Prod. 2023, 413, 137552. [Google Scholar] [CrossRef]
- Li, X.; Wang, H.; Yang, C. Driving mechanism of digital economy based on regulation algorithm for development of low-carbon industries. Sustain. Energy Technol. Assess. 2023, 55, 102909. [Google Scholar] [CrossRef]
- Yang, J.; Hao, Y.; Feng, C. A race between economic growth and carbon emissions: What play important roles towards global low-carbon development? Energy Econ. 2021, 100, 105327. [Google Scholar] [CrossRef]
- Bonsu, N.O. Towards a circular and low-carbon economy: Insights from the transitioning to electric vehicles and net zero economy. J. Clean. Prod. 2020, 256, 120659. [Google Scholar] [CrossRef]
- Chen, L.; Bai, X.; Chen, B.; Wang, J. Incentives for green and low-carbon technological innovation of enterprises under environmental regulation: From the perspective of evolutionary game. Front. Energy Res. 2022, 9, 793667. [Google Scholar] [CrossRef]
- Du, M.; Feng, R.; Chen, Z. Blue sky defense in low-carbon pilot cities: A spatial spillover perspective of carbon emission efficiency. Sci. Total Environ. 2022, 846, 157509. [Google Scholar] [CrossRef]
- Li, F.; Xu, X.; Li, Z.; Du, P.; Ye, J. Can low-carbon technological innovation truly improve enterprise performance? The case of Chinese manufacturing companies. J. Clean. Prod. 2021, 293, 125949. [Google Scholar] [CrossRef]
- Shi, Y.; Wei, Z.; Shahbaz, M.; Zeng, Y. Exploring the dynamics of low-carbon technology diffusion among enterprises: An evolutionary game model on a two-level heterogeneous social network. Energy Econ. 2021, 101, 105399. [Google Scholar] [CrossRef]
- Chen, W.; Huang, X.; Liu, Y.; Luan, X.; Song, Y. The impact of high-tech industry agglomeration on green economy efficiency—Evidence from the Yangtze river economic belt. Sustainability 2019, 11, 5189. [Google Scholar] [CrossRef]
- Li, J.; Chen, L.; Chen, Y.; He, J. Digital economy, technological innovation, and green economic efficiency—Empirical evidence from 277 cities in China. Manag. Decis. Econ. 2022, 43, 616–629. [Google Scholar] [CrossRef]
- Zeng, W.; Li, L.; Huang, Y. Industrial collaborative agglomeration, marketization, and green innovation: Evidence from China’s provincial panel data. J. Clean. Prod. 2021, 279, 123598. [Google Scholar] [CrossRef]
- Vrontis, D.; Tardivo, G.; Bresciani, S.; Viassone, M. The competitiveness of the Italian manufacturing industry: An attempt of measurement. J. Knowl. Econ. 2018, 9, 1087–1103. [Google Scholar] [CrossRef]
- Liu, C.; Gao, X.; Ma, W.; Chen, X. Research on regional differences and influencing factors of green technology innovation efficiency of China’s high-tech industry. J. Comput. Appl. Math. 2020, 369, 112597. [Google Scholar] [CrossRef]
- Aritenang, A.F. The importance of agglomeration economies and technological level on local economic growth: The case of Indonesia. J. Knowl. Econ. 2021, 12, 544–563. [Google Scholar] [CrossRef]
Disclaimer/Publisher’s Note: The statements, opinions and data contained in all publications are solely those of the individual author(s) and contributor(s) and not of MDPI and/or the editor(s). MDPI and/or the editor(s) disclaim responsibility for any injury to people or property resulting from any ideas, methods, instructions or products referred to in the content. |
© 2023 by the authors. Licensee MDPI, Basel, Switzerland. This article is an open access article distributed under the terms and conditions of the Creative Commons Attribution (CC BY) license (https://creativecommons.org/licenses/by/4.0/).