Article

Experimental Study on Mechanical Properties and Acoustic Emission Characteristics of Dry and Water-Saturated Soft Rocks under Different Dynamic Loadings

1
State Key Laboratory of Mining Disaster Prevention and Control Co-Founded by Shandong Province and the Ministry of Science and Technology, Shandong University of Science and Technology, Qingdao 266590, China
2
State Key Laboratory for Geomechanics and Deep Underground Engineering, China University of Mining and Technology, Beijing 100083, China
3
Inner Mongolia Shanghaimiao Mining Co., Ltd., Ordos 016299, China
*
Author to whom correspondence should be addressed.
Sustainability 2023, 15(17), 13201; https://doi.org/10.3390/su151713201
Submission received: 30 July 2023 / Revised: 29 August 2023 / Accepted: 31 August 2023 / Published: 2 September 2023
(This article belongs to the Special Issue Deep Mining Engineering in Sustainability)

Abstract

:
Studying how soft rocks behave dynamically in water-rich settings is vital for ensuring sustainable coal extraction from deep water-saturated soft rock mines. A dynamic disturbance loading system utilizing creep-impact dynamics was employed to analyze the mechanical traits and acoustic emission behaviors of both dry and fully saturated soft rock. Expanding on uniaxial compression tests as a foundational framework, additional experiments involving dynamic disturbances and acoustic emission observations were carried out on the aforementioned soft rock samples. These experiments encompassed a spectrum of cyclic disturbance amplitudes ranging from 2 kN to 10 kN. Experimental results indicated the following: (1) during dynamic disturbance, the hysteresis loop exhibits a “sparse to dense” variation. When subjected to the same number of disturbances, the hysteresis loop takes on a pointed leaf-like shape, which increases with the amplitude of the disturbances. (2) The pinnacle of intensity and the elastic modulus of the samples, when exposed to diverse amplitudes of disturbances, can be categorized into a strengthening phase and weakening phase. The reinforcement effect is highest for both samples under the effect of a perturbation of 4 amplitudes. (3) Under the action of disturbances at various amplitudes, the acoustic emission signals from the samples can be classified into four stages. In all stages, the maximum acoustic emission signals exhibited by the desiccated samples surpass those emanated from the saturated samples. In the fluctuation period (II), dry and saturated samples exhibit a cyclic strengthening effect, which becomes more pronounced as the amplitude increases. The study results offer theoretical support for understanding deformation and instability mechanisms in roadways of deep water-saturated soft rock mines, which is essential for ensuring sustainable coal resource development.

1. Introduction

The extraction of coal resources is intricately linked to the principles of sustainable development, serving to meet the ever-expanding energy requisites of our nation. However, With the progressive exhaustion of shallow coal reserves, the focus of coal mining gradually transitions towards comparatively profound regions [1,2,3]. In complex geological conditions, the strata encompassing deep water-saturated soft rock mine workings is often subjected to the influence of fatigue loads from excavation, blasting, mining, and mine tremors, severely affecting the mechanical stability of the mine surrounding rock. With the extraction of coal resources, the stress condition of the superjacent strata pertaining to the coal seam roof dynamically readjusts, engendering the transference of water resources and inducing water–rock interactions that deteriorate the mechanical characteristics of the rocks [4,5,6]. This condition seriously affects the sustainability of the mine’s exploitation and hinders the sustainability of development.
Currently, in the research on the dynamic response in rocks, impact tests have been conducted on rocks of different lithologies [7,8,9,10,11]. Özbek et al. [12] and Khanlari et al. [13] conducted an investigation into the mechanical properties of rock specimens subjected to alternating dry and wet conditions. Ren et al. [14] and Zhang et al. [15] established that sandstone mechanical characteristics and rockburst propensity diminish with an increasing temperature. Wang et al. [16] examined the acoustic emission attributes of sandstone during impact-induced rock burst at various perturbation frequencies. Under actual triaxial unloading–dynamic disturbance conditions, Feng et al. [17] found that the extent of crack propagation in red sandstone was closely related to the initial axial static stress and the frequency of dynamic disturbances, considering different moisture conditions of the sandstone. Yang et al. [18] scrutinized the behavior of water-saturated sandstone under cyclic loading and deduced that with an escalating water content, there was a corresponding reduction in the axial deformation of the rock specimen. Literature [19,20,21,22] has delved into the progressive deterioration mechanism of rocks subjected to cyclic loading, considering diverse viewpoints.
In the research on water-rich soft rock, Sun et al. [23,24] conducted experiments on the mechanical properties of sandstone with varying water contents. They observed that as the water content increased, the damage pattern of the samples gradually transitioned from single-bevel shear damage to “X”-shaped conjugate shear-bevel damage. Additionally, they analyzed the deformation characteristics of the deep soft-rock roadway through numerical simulation and proposed corresponding reinforcement measures. Erguler et al. [25] found that the strength index of clayey soft rock decreased by over 90% in saturated conditions compared with when it was dry. Roy et al. [26] investigated the impact of varying saturation durations on the mechanical properties of sandstone, and their findings revealed that the tensile strength, Young’s modulus, and fracture stiffness of the sandstone exhibited a decline as the water content increased. Researchers, including Yu et al. [27] and Tang et al. [28], conducted uniaxial compression creep tests on red sandstone samples, systematically adjusting the water content levels. They found that the instantaneous strain and steady-state strain rate exhibited an exponential increase with a rise in the water content. Wang et al. [29] revealed the phenomenon, and nature and the factors contributing to substantial deformation in deep soft rock roadways were investigated, leading to the proposition of appropriate measures for supporting the infrastructure. Dong et al. [30] conducted a comprehensive examination into the mechanical characteristics and causative factors of damage in expanding soft rock roadways. Liu et al. [31] and Liu et al. [32] used CT scanning technology to study the damage information and damage process of sandstone under pressure.
In brief, ongoing studies concerning the Sdynamic reaction of rocks predominantly center around the impairment progression of rocks with varying rock types exposed to distinct frequencies of perturbation, as well as varying temperatures and moisture levels. These analyses delve into the attributes of rockburst phenomena. The research on water-rich soft rock mainly focuses on the nonlinear large deformation characteristics of water-rich soft rock, and the research under the action of the perturbation amplitude needs to be deepened. Therefore, this study considers the Inner Mongolia Xinshanghai No. 1 Mine as the research object and builds upon the experiments of water content testing and uniaxial compression on soft rock samples. The mechanical properties of dry and saturated soft rock under the influence of different disturbance amplitudes are further investigated through dynamic disturbance experiments. The research findings provide significant theoretical assistance in exploring the deformation and instability mechanisms of underground mine roadways located in water-rich soft rock formations, thereby facilitating the sustainable extraction of coal resources. This contributes to the overall sustainability of coal resource development to a significant extent.

2. Experimental Program and Conditions

2.1. Sample Preparation

In this experiment, mudstone from the Xinshanghai No. 1 Coal Mine was selected as the research target. Following the guidelines of the International Society for Rock Mechanics (ISRM), cylindrical rock specimens of standard dimensions, measuring 50 mm in diameter and 100 mm in height, were fabricated. The rock specimens were free of visible defects on their surfaces. To minimize the end effects of the sandstone in this experiment, efforts were made to ensure that the end surfaces of the specimens had a roughness and non-perpendicularity to the axis within the range of ±0.02 mm.
The samples were partitioned into two groups: the dry group and the saturated group, with a total of 36 samples (18 in each group). Within each group, three samples were used for uniaxial compression tests, and 15 samples were used for dynamic disturbance experiments. All samples were subjected to thermal desiccation within a controlled-temperature chamber. The desiccation temperature was established at 110 °C, while the desiccation duration was set at 24 h. After the drying process, the samples were allowed to cool naturally in a constant-temperature oven to obtain the dry-state samples. For the saturated group, the dry samples were subjected to water saturation using the natural soaking method. Periodically, the rock samples were removed, surface moisture was wiped off, and their mass was measured to calculate the water content.
Figure 1 depicts the water content fluctuation profile of rock specimens in response to the duration of immersion. The graph shows that the trend in the water content with the soaking time can be divided into three stages: Stage I, rapid increase stage; Stage II, slow increase stage; Stage III, stable stage. Following a 24-hour interval, the water content of the samples remained unaltered for a continuous duration of 12 h. Therefore, the rock samples had reached a saturated state, with an average saturation water content of 8.148%. The prepared samples were wrapped in plastic film, placed in sealed bags, and stored in cans to ensure that their moisture state remained unchanged.

2.2. Experimental Equipment

The testing system for this experiment consisted of a creep-dynamic disturbance loading system and acoustic emission data-acquisition system. As shown in Figure 2, the red dashed box in the figure indicates that the specimen in the box and the acoustic emission probe as a whole are placed in the experimental machine for loading, the operational mechanism of this system can be elucidated as follows: the servo motor drives the hydraulic pump to inject hydraulic oil into the accumulator. The dynamic servo valve with a high-frequency response is used to control the hydraulic oil entering the double-piston rod structure in the power chamber, achieving axial motion. This process applies axial loads to the sample through the actuator. At the same time, the data-acquisition system retrieves instantaneous feedback data from the experiment and automatically archives it in the designated pathway. The acoustic emission equipment used is the Sensor Highway II acoustic emission device from the Physical Acoustic Corporation (PAC) in the United States. It can acquire acoustic emission characteristic parameters and waveform data. To investigate the acoustic emission properties of dry and saturated samples under the influence of varying disturbance amplitudes, a two-probe dual-channel setup was used, with the probes fixed to the diagonally opposite corners of the sample. A layer of Vaseline was uniformly applied as a coupling agent between the acoustic emission sensor and the detecting surface of the specimen to ensure sufficient coupling between the sensor and the sample contact surface. In order to mitigate the impact of noise on the experimental data, the threshold value of the acoustic emission system was established at 43 dB, the pre-amplifier gain was calibrated to 40-fold amplification, the sampling frequency of the acoustic emission sensor R15α was configured to 1 MHz, with a resonance frequency of 150 KHz and a response frequency range of 50 to 200 KHz, and the length of the acoustic emission signal was specified as 1024.

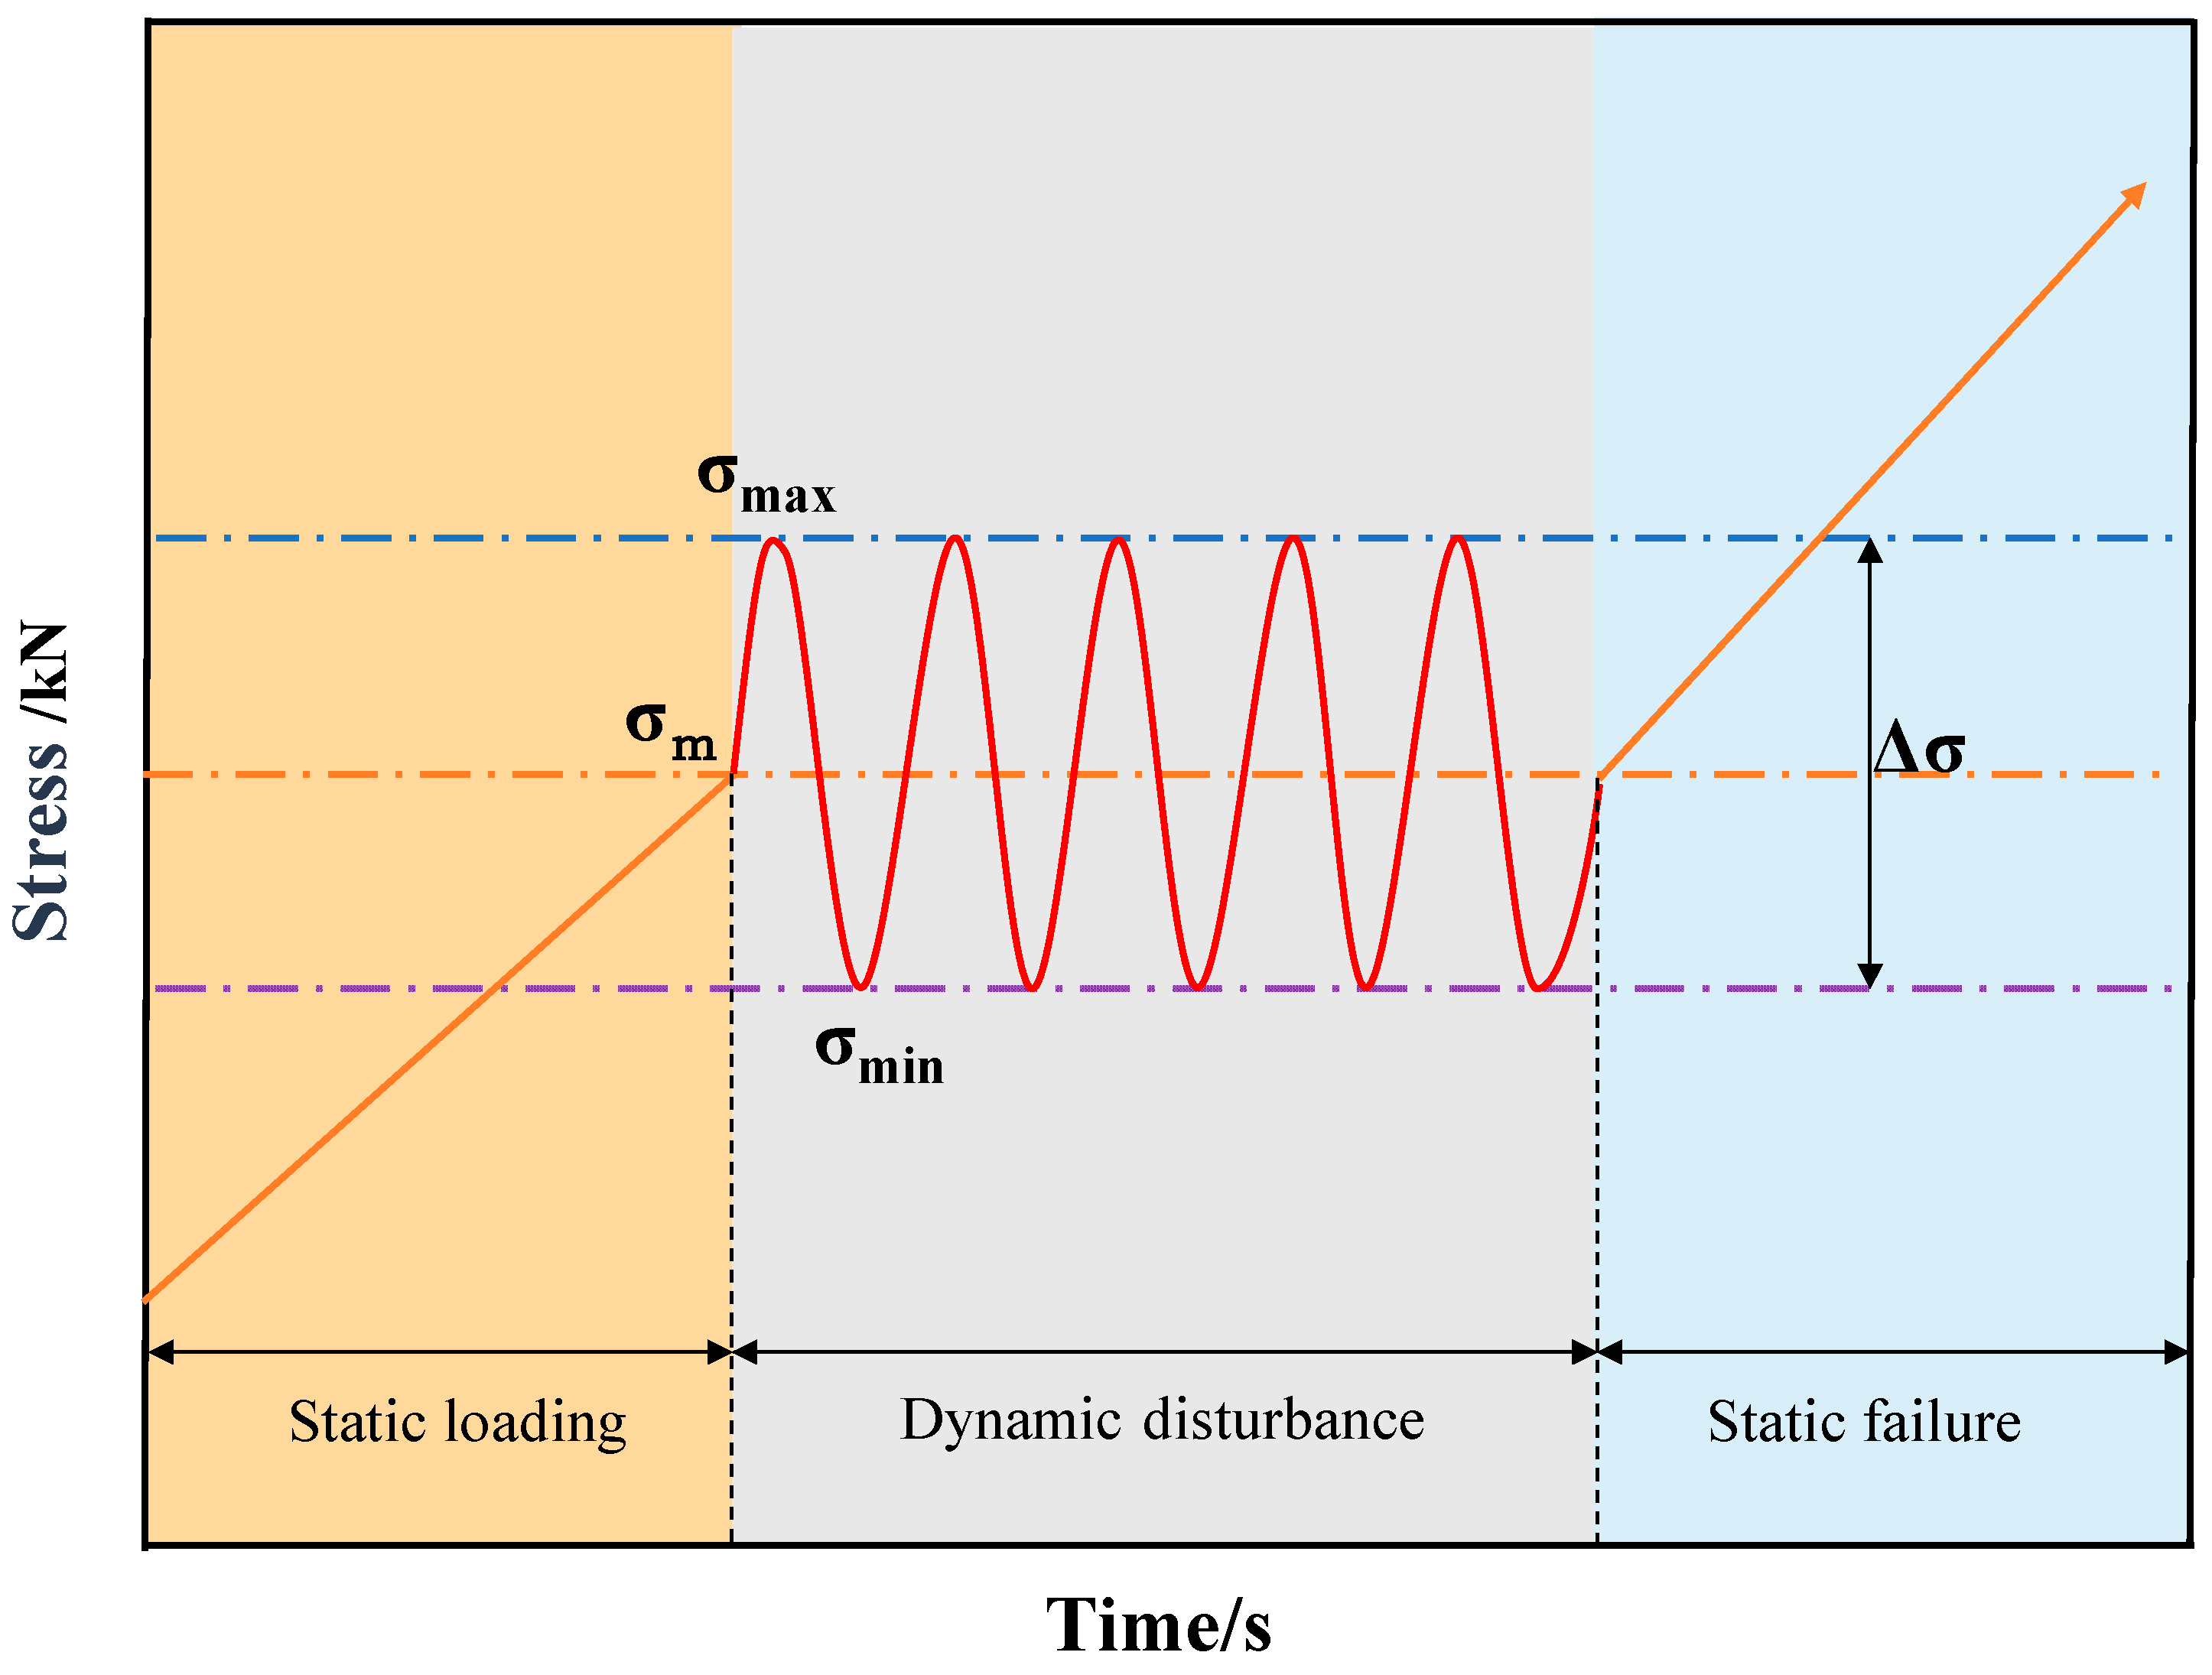
2.3. Experimental Program

In this experiment, a cyclic loading method was used to simulate the effect of dynamic disturbance loads on deep soft rock under certain static conditions. The specific loading procedure was as follows: a certain axial static load σm was applied to the specimen at a loading rate of 0.1 mm/min. Then, using σm as the mean value for cyclic loading, a fixed-frequency axial cyclic disturbance load was applied to the specimen. If the specimen could complete the preset number of cycles, then static axial loads were continuously applied until the specimen failed. The cyclic loading procedure is depicted in Figure 3, where σmax denotes the upper threshold of cyclic perturbation, σmin represents the lower threshold of cyclic perturbation, and Δσ signifies the amplitude of cyclic loading. For this experiment, a sine wave was selected as the disturbance waveform, with a disturbance frequency of 5 Hz and 1000 cycles of disturbance.
To obtain a reasonable cyclic loading average value σm, uniaxial compression experiments were carried out on both samples. The experiments were conducted using closed-loop constant displacement control with a loading speed of 0.1 mm/min. The static mechanical characteristics of the two sample types are presented in Table 1. Based on the static mechanical parameters of the samples, the cyclic loading average value σm was 50% of the uniaxial compressive strength for each state, and the cyclic disturbance amplitude Δσ was set to 2, 4, 6, 8, and 10 kN. The specific cyclic disturbance schemes are shown in Table 2.

3. Analysis of Experimental Results

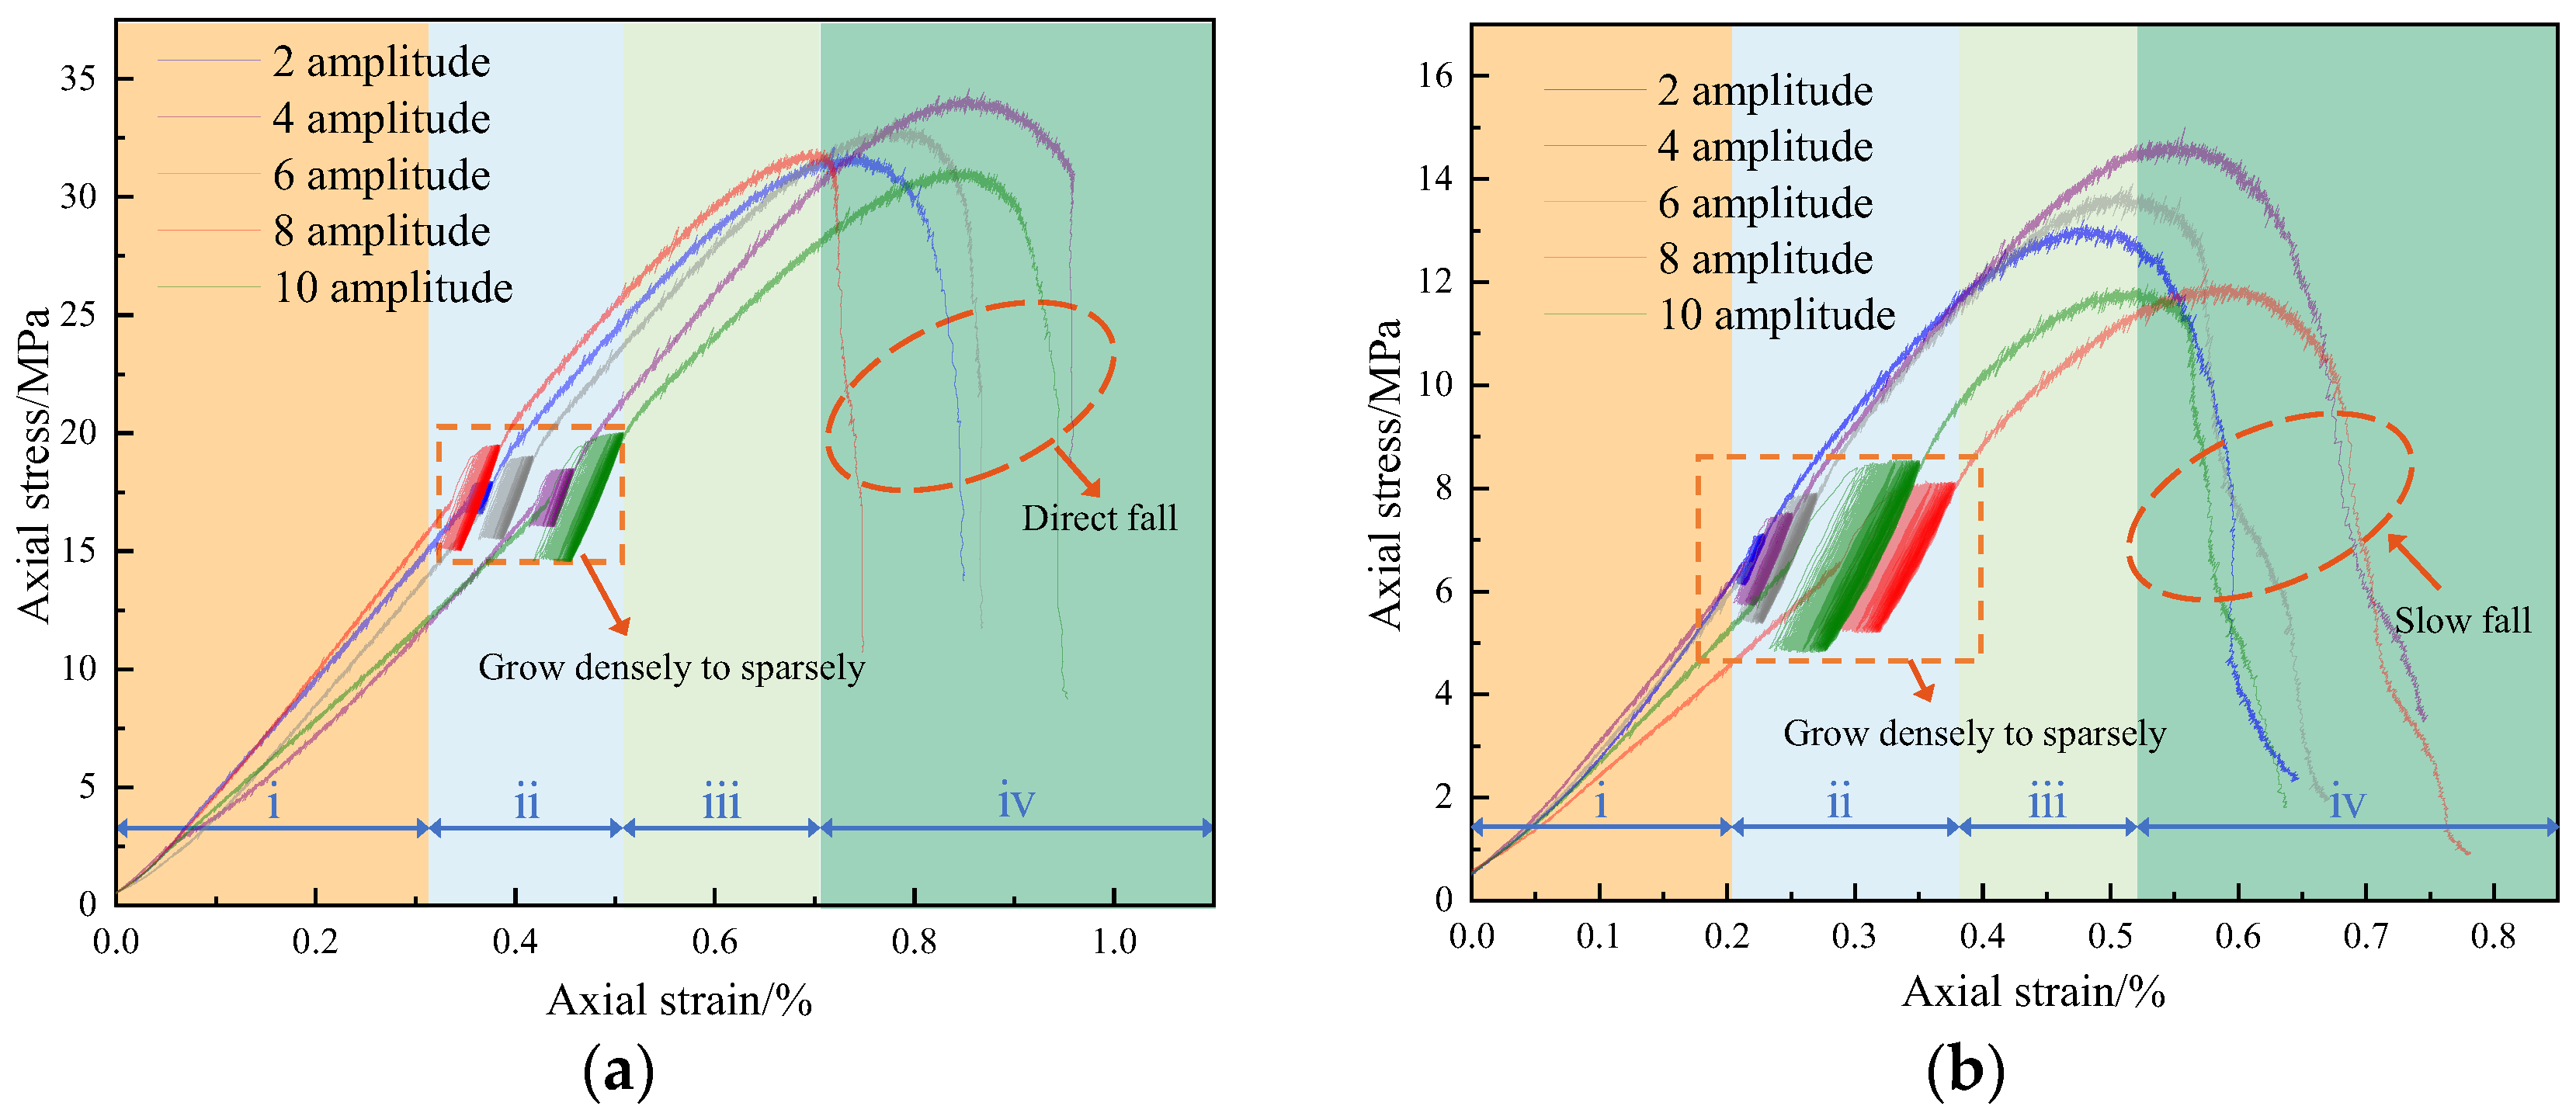
3.1. Stress–Strain Relationships

According to the disturbance experiment scheme in Table 2, the mechanical parameters obtained from the samples are displayed in Table 3. Figure 4 illustrates the stress–strain curves of water-rich soft rock under the influence of different disturbance amplitudes. The plotted graph illustrates that the comprehensive stress–strain profiles of both the dry and saturated specimens can be categorized into four distinct stages: (i,iii) static loading stage, (ii) scrambling stage, and (iv) post-peak stage. In the early loading stages of each amplitude sample the stress–strain curve shows an upward concave shape due to the recompaction of existing small pores and cracks. The elastic deformation phase of the dry specimens exhibits a notably greater magnitude compared to that of the saturated samples because water dissolves some cementing materials between the particles due to saturation. Moreover, the dissolution and erosion of water lead to the occurrence of micropores and microcracks inside the rock, causing the internal structure to become relatively loose. As a result, the linear elastic stage is reduced. After the peak, the stress of dry samples shows a rapid drop with a brittle behavior, whereas the stress–strain curves of the saturated samples show a slow decline with a softening behavior, exhibiting plastic characteristics. Comparing the stress–strain curves of dry and saturated-state samples, the post-peak curve trends of each amplitude sample under the same state are the same, indicating that the brittleness and plasticity of the samples are not related to the size of the disturbance amplitude but are related to whether the samples are saturated or dry.
During the dynamic disturbance process, as the quantity of disturbance cycles increases, the stress–strain curve of the sample exhibits hysteresis loops resembling sharp-pointed leaves. The magnitude of energy dissipation during the cyclic disturbance process is depicted by the area enclosed within the hysteresis loop. Figure 4 also shows that the hysteresis loops of the dry and saturated samples at various amplitudes show a pattern of “sparse to dense”. This due to the significant residual strain in the initial stage of the cyclic disturbance, and some energy is dissipated. Subsequently, the energy dissipation reaches a certain level and remains relatively constant, and with an increase in the number of cycles, the hysteresis loops become relatively dense. Figure 5 shows the hysteresis loops of dry and saturated-state samples at different amplitudes during the 200th cycle. The area enclosed by the hysteresis loop curve is calculated through mathematical integration, and S denotes the size of the area. The graph shows that under the same state, the extent of the hysteresis loop’s area experiences an increment, with the augmentation of the disturbance amplitude. This finding indicates that the dissipation of energy during the cyclic disturbance process increases with the amplitude, and the “sharp-pointed leaf” shape becomes more pronounced. In addition, for the same disturbance amplitude, the magnitude of the hysteresis loop’s area in saturated samples is notably greater compared to that of dry-state samples, because dry samples undergo enhanced particle brittleness after drying, and some cementing materials between particles lose water and become harder. This condition leads to the persistent consolidation and sealing of internal primary cracks, during the cyclic disturbance process, which restores the bearing capacity to some extent and results in relatively less internal energy dissipation. Moreover, saturated samples have their internal primary cracks filled with water, and the dissolution of some cementing materials forms microwater chambers. During the cyclic disturbance process, the static water pressure inside these chambers constantly changes and increases, causing the expansion of microcracks within the sample and leading to an overall softer and less stable state, resulting in relatively greater energy dissipation.

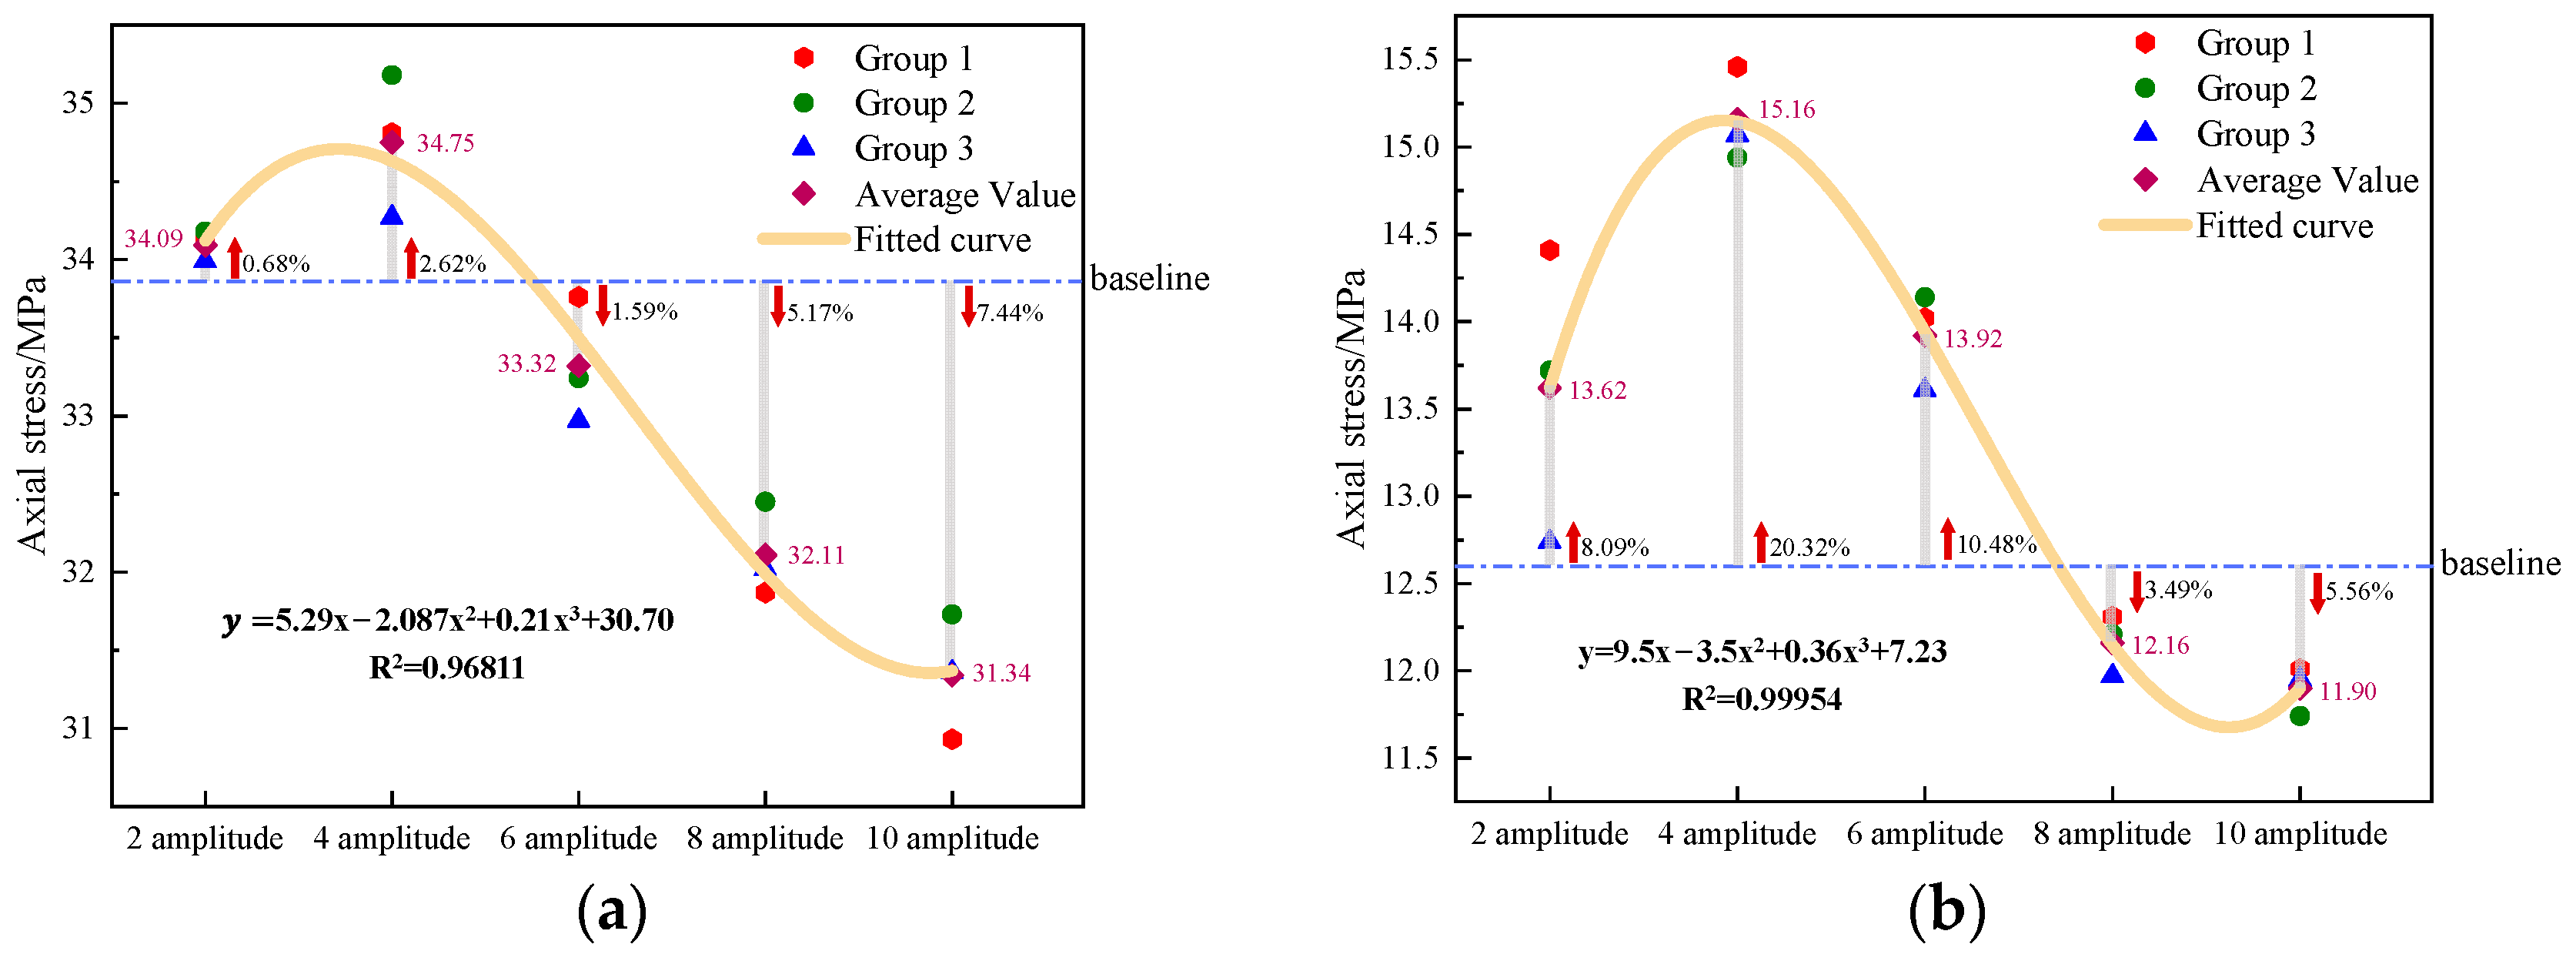
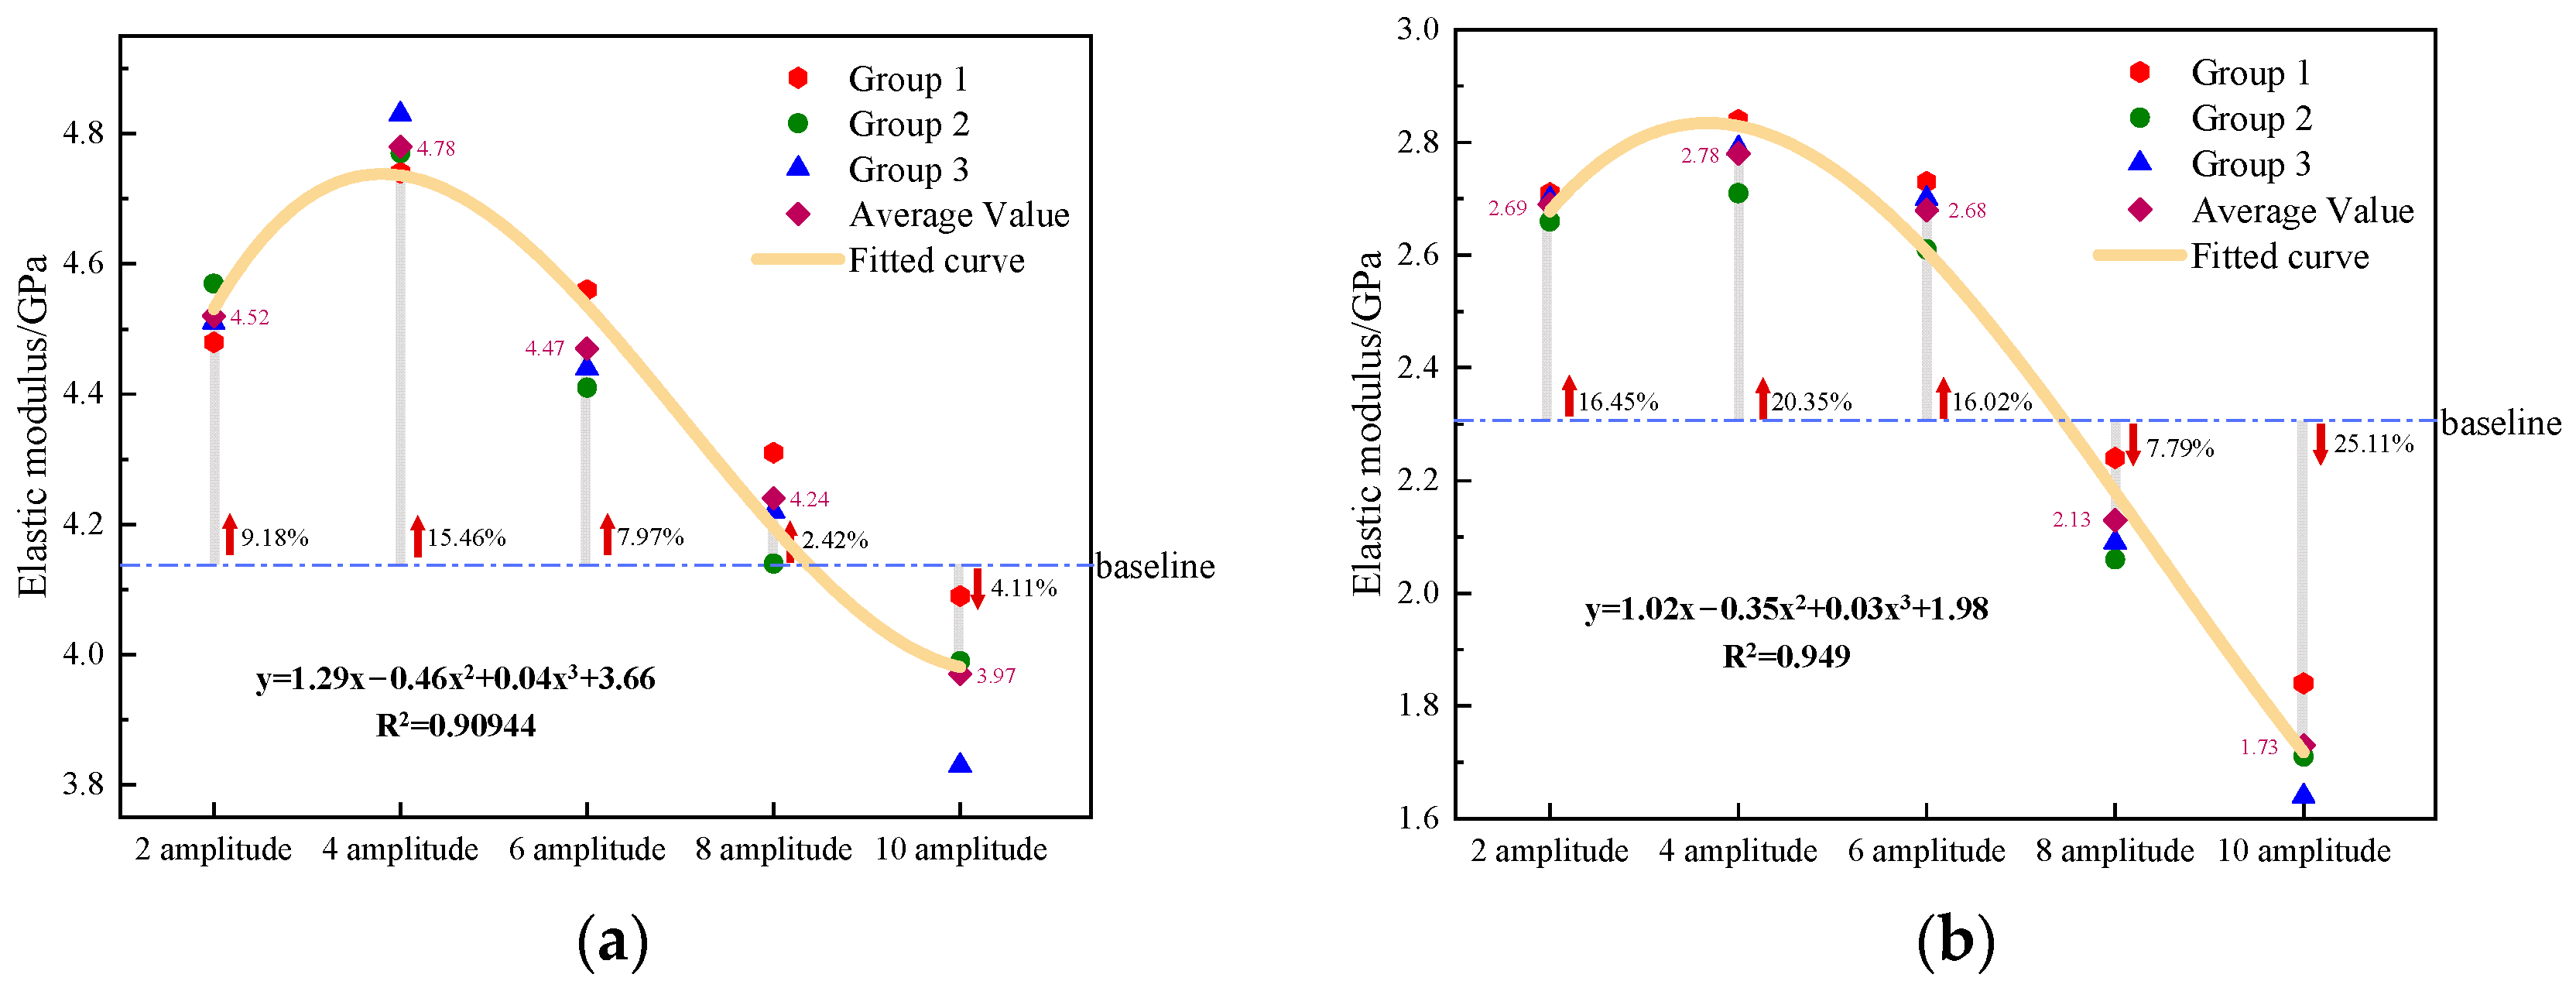
3.2. Change Rule of Mechanical Characteristics

Figure 6 displays the peak strength of various soft rocks with different water content levels under the influence of varying disturbance amplitudes. The observed graphical representation demonstrates that with the escalation of the disturbance amplitude, the peak strength of soft rocks at different humidity levels exhibits an initial augmentation followed by a subsequent attenuation, eventually culminating in an inflection point at the fourth amplitude. For dry samples, the peak strength increased by 0.68% and 2.68% at the second and fourth amplitudes, respectively, and decreased by 1.59%, 5.17%, and 7.44% from the sixth to eighth amplitudes, considering the uniaxial compressive strength of 33.86 MPa as the baseline. For saturated samples, when the baseline was 12.60 MPa, the peak strength increased by 8.09%, 20.32%, and 10.48% at the second, fourth, and sixth amplitudes and decreased by 3.49% and 5.56% from the eighth to 10th amplitudes. Figure 7 shows the elastic modulus of soft rocks with different water contents under the influence of different disturbance amplitudes. The Young’s modulus demonstrates a comparable trend to the compressive strength, displaying a distinct inflection point at the fourth amplitude. For dry samples, the elastic modulus increased by 9.18%, 15.46%, 7.97%, and 2.42% at the second to eighth amplitudes and decreased by 4.11% at the 10th amplitude, considering the uniaxial compressive elastic modulus of 4.14 GPa as the baseline. For saturated samples, when the baseline was 2.31 GPa, the elastic modulus increased by 16.45%, 20.35%, and 16.02% at the second, fourth, and sixth amplitudes and decreased by 7.79% and 25.11% from the eighth to 10th amplitudes. This finding is due to the partially re-compacted internal primary cracks of the sample under the influence of smaller amplitudes, as well as their resistance to deformation increasing. Moreover, due to the relatively small amplitude during the disturbance period, the stress at the top of the sharp-pointed leaf hysteresis loop cannot sufficiently cause the development of new cracks inside the sample, thereby increasing the peak stress and Young’s modulus. However, with the increase in the disturbance amplitude, the stress at the top of the sharp-pointed leaf hysteresis loop is sufficient to continuously develop new tiny cracks inside the sample, creating new weak links and reducing the overall compressive strength and elastic modulus. The information in the graph indicates that the variation range of the compressive strength and Young’s modulus for the saturated samples is greater than that of dry-state samples. In the fully saturated state, the internal moisture of the sample mainly exists as free water, filling the microcracks inside the sample. Under the influence of the applied disruptive load, the dynamic fluctuations in pore water pressure within the micropores expedite the progression and enlargement of internal cracks within the sample. As a consequence, there is a notable reduction observed in both the compressive strength and Young’s modulus.
The peak strength and Young’s modulus of dry and saturated samples exhibit an inflection point at the fourth amplitude. Therefore, under the influence of a disturbance amplitude of 4, the enhancement of the sample elastic modulus and compressive capacity reaches its maximum. For dry samples, the compressive strength shows an enhancement effect from the second to the fourth amplitude, but a weakening effect from the sixth amplitude and above. The elastic modulus exhibits an enhancement effect from the second to the eighth amplitude and a weakening effect from the 10th amplitude and above. For saturated samples, the compressive strength shows an enhancement effect from the second to the sixth amplitude, but a weakening effect from the eighth amplitude and above. The elastic modulus exhibits an enhancement effect from the second to the sixth amplitude and a weakening effect from the eighth amplitude and above. The weakening effect observed in saturated samples at the eighth amplitude can be attributed to the presence of internal microwater cavities. In light of the perturbation amplitude, the pore water pressure inside the microcavities undergoes significant changes. As the disturbance amplitude increases, the pore water pressure fluctuation also increases, leading to the instability and rupture of the microcavities. This condition causes the saturated samples to enter the weakening stage at the eighth amplitude. In summary, the influence of the disturbance amplitude on the mechanical properties of soft rocks is considerable in magnitude, and an optimal range for the disturbance amplitude is observed to achieve maximum enhancement of the sample’s compressive strength and elastic modulus. However, once the disturbance amplitude exceeds a certain threshold, the mechanical properties of the samples begin to weaken, especially in the case of saturated samples with microwater cavities.

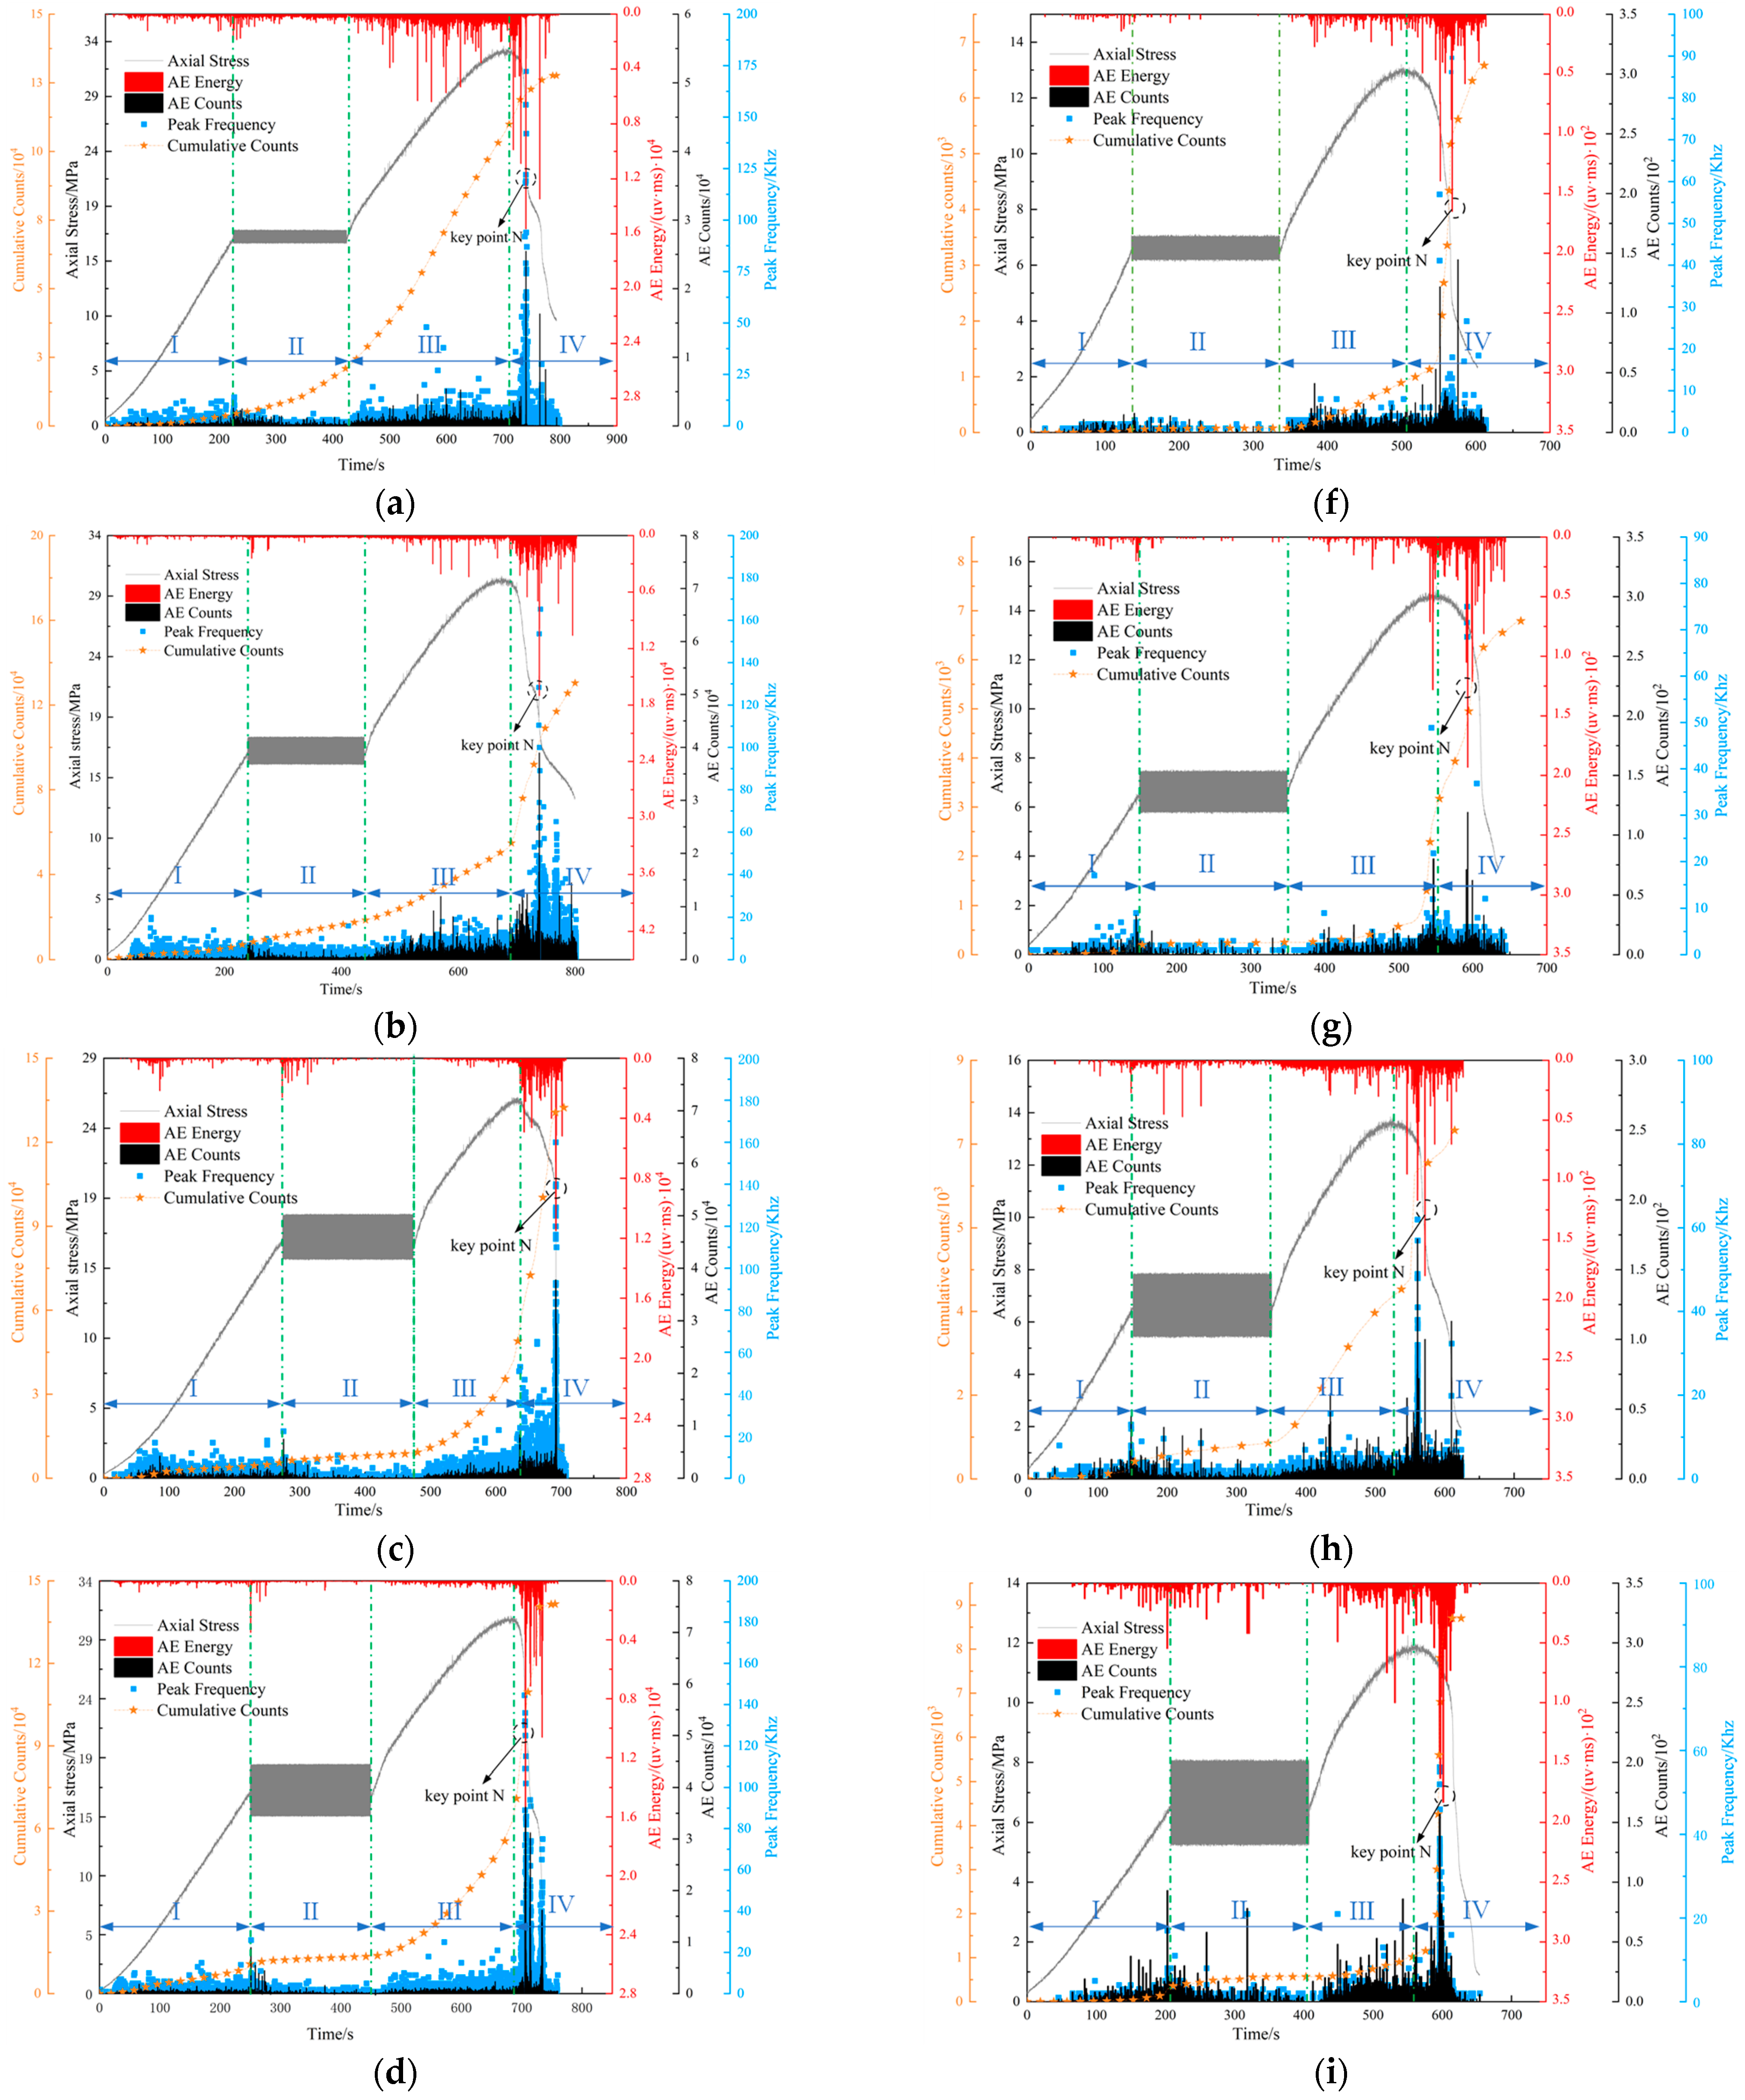
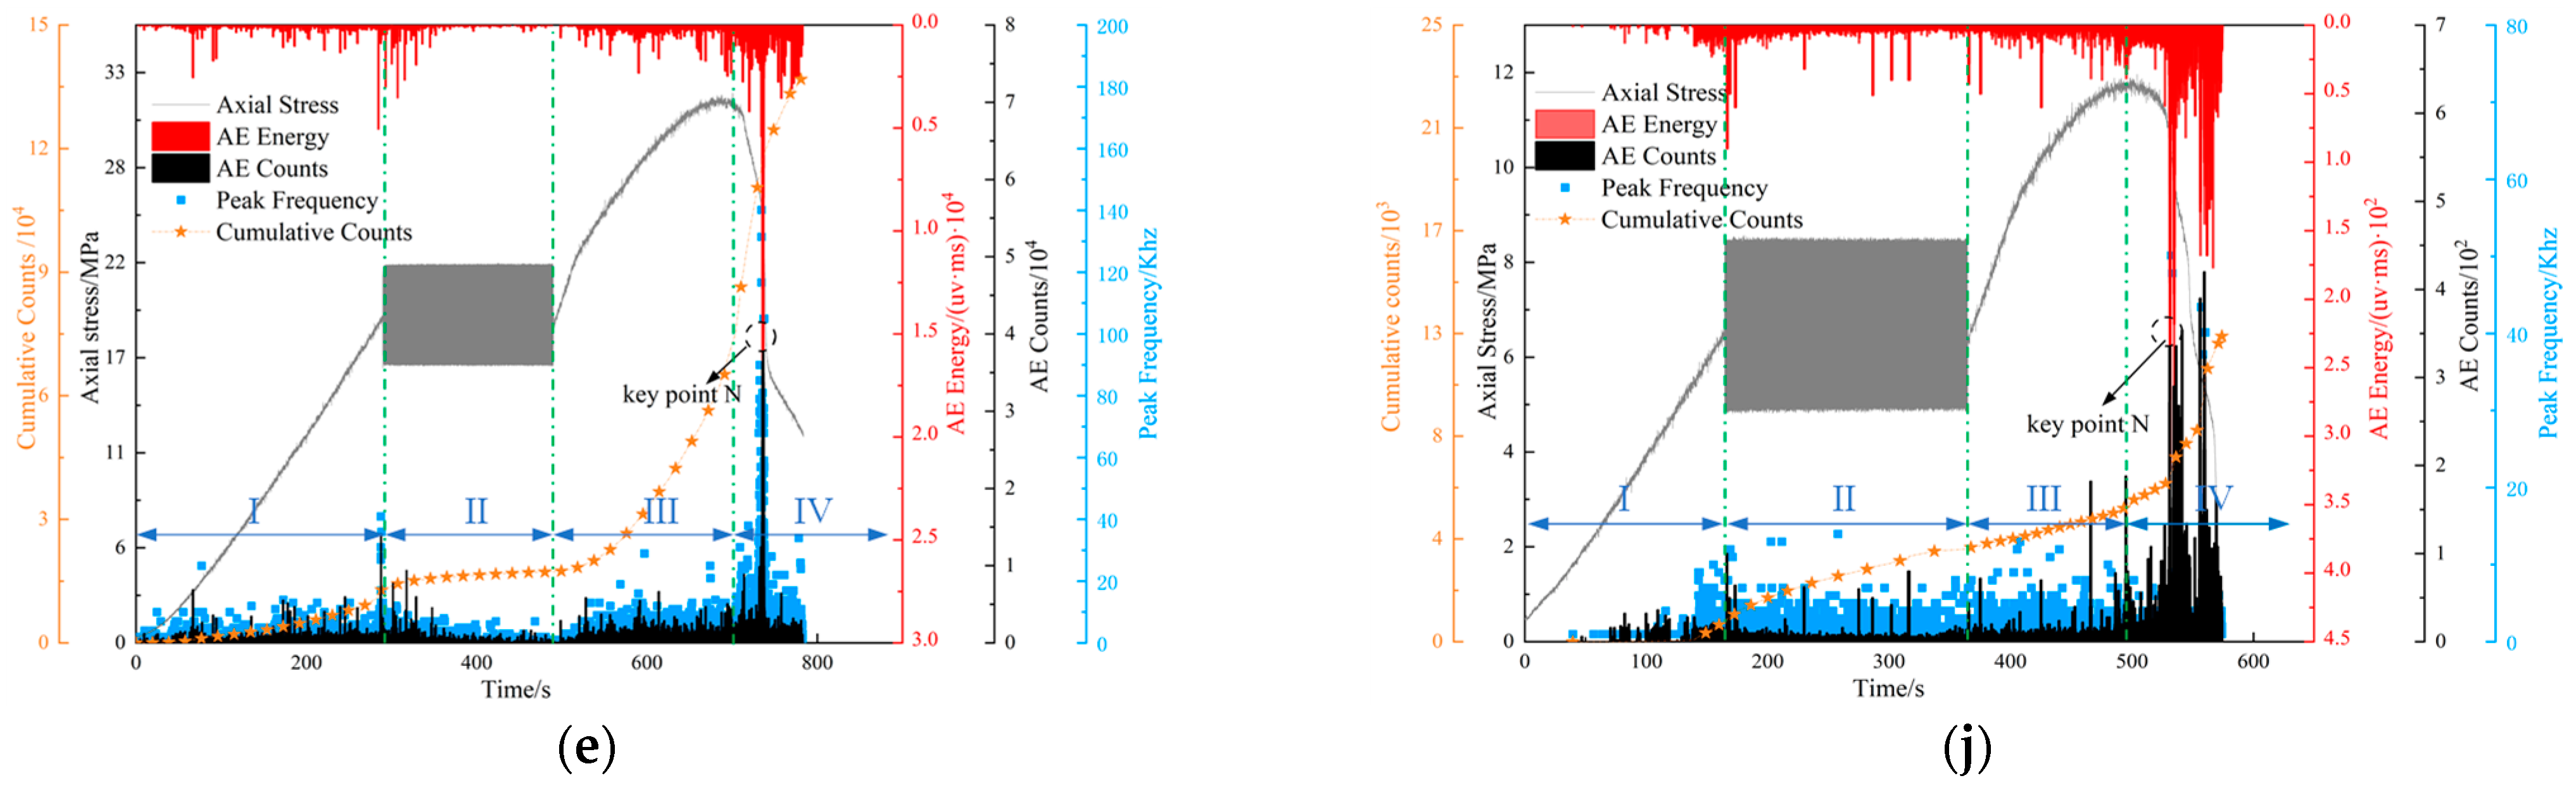
3.3. Acoustic Emission Characterization

Figure 8 presents the acoustic emission energy, ringing count (the number of oscillations exceeding the threshold value), and cumulative count for dry and saturated-state samples under the influence of different disturbance amplitudes. Panels (a) to (e) correspond to the experimental results of dry samples with disturbance amplitudes ranging from 2 to 10, whereas panels (f) to (j) correspond to saturated samples. Throughout the experiment, the acoustic emission system and loading system were synchronized. The graphical representations illustrate that the evolutionary characteristics of acoustic emission in both dry and saturated samples can be categorized into four distinct periods: quiet period (I), fluctuation period (II), increasing period (III), and bursting period (IV). During each stage, we can find that the trend in the peak frequency of the dry and saturated samples is basically the same as that of the acoustic emission energy and counts. Under the action of the same perturbation amplitude, in the quiet period, the peak frequency signal of the dry sample is “dense and large” compared with that of the saturated sample, and the peak frequency of the two samples in the fluctuation period first increases, then decreases, and then tends to stabilize. In the incremental period, the peak frequency signal of the dry sample is more active than that of the saturated sample, and in the rapid increase period, the peak frequency is larger than that of the saturated sample.
In the quiet period, the acoustic emission signal generated by the sample is generally low because of the sample undergoing the drying of the internal particles associated with water loss and hardening. This phenomenon can also be attributed to the interplay of frictional forces between rock particles and the irregularities present on the weakly bonded fracture surfaces during the primary stages of microcracking and pore compaction. The process generated a part of the acoustic emission signal of low energy, and water-saturated samples loaded at the initial stage of the sample by the stress are small. In the early stage of loading, the stress on the sample was low, and the presence of pore water in the sample hindered the propagation of the acoustic emission signals. Moreover, the water had a certain lubrication effect, which further reduced the friction and resistance between the particles. As a result, the amplitude of some acoustic emission signals is lower than the preset acoustic emission threshold, which was considered noise signals and filtered out.
During the fluctuation period, the transient changes in stress in the sample caused by the sudden change in loading resulted in the rapid expansion or interconnection of a portion of the uncompacted cracks in the sample, leading to a sudden increase in the acoustic emission energy signal, ringing counts, and peak frequency. With the continued application of the perturbation load, the sample began to adapt to the applied perturbation load, the mechanical response stabilized, and the acoustic emission energy, ringing counts, and peak frequency gradually decreased. With the passage of time, the sample entered a dynamic steady state, the microcrack expansion and energy release in the sample reached equilibrium, and the acoustic emission energy and ringing counts tended to stabilize. A positive correlation existed between the peak acoustic emission signal and the perturbation amplitude of the two samples during the perturbation stage, in which the “signal surge” phenomenon occurred in the water-saturated sample during the perturbation process. Moreover, the larger perturbation amplitude indicates a more frequent phenomenon, which is due to the large number of water-containing microporous spaces inside the water-saturated sample. As a result, the perturbation process became more frequent because the water-saturated sample has a large number of water-containing microporous spaces. The perturbation load was applied to constantly change the internal pore water pressure, part of the microporous space lost the carrying capacity of the rupture, and the perturbation amplitude of the sample was caused by the increased amplitude of the change in the water pressure of the microporous space. As a result, the rupture phenomenon occurred more frequently. The process generated acoustic emission signals that could be monitored, leading to the “signal surge” phenomenon.
During the incremental period, the acoustic emission energy, ringing counts, and peak frequency of the samples in each state exhibited a gradual augmentation as the experimental time progressed. The stress–strain curve displayed a concave upward shape, signifying the expansion and interconnection of primary cracks within the experimental samples, while secondary cracks initiated, progressed, and extended. The crack propagation rate in the water-saturated sample surpassed that observed in the dry sample, owing to the presence of unbound water within the former. Moreover, the larger perturbation amplitude indicates a more active acoustic emission signal.
During the rapid-increase period, under the action of axial load, the macroscopic cracks connected and expanded until they penetrated through the entire sample. In this period, the AE ringing counts, energy, and peak frequency signals were the most intense, the dry sample reached the load-bearing capacity, the stress decreased rapidly, the acoustic emission energy, counts, and peak frequency increased to the peak rapidly, and almost no large signal was found after the peak. Moreover, the sample exhibited brittleness. When the saturated samples reached the load-bearing capacity, the stress decreased slowly, the acoustic emission energy and counts reached the peak, a large acoustic emission signal was observed after the peak, and the sample exhibited plasticity. The peak energy at the point of failure for the dry sample significantly exceeded that of the water-saturated sample, as the presence of water undermined the mechanical integrity of the rock, diminishing its deformation resistance and impeding the accumulation of substantial elastic energy. After experiencing dynamic perturbation and continuous axial static loading, part of the energy was used for primary fracture expansion and the development of secondary cracks, leading to smaller acoustic emission energies detected at the time of destruction. The dry-state sample was hardened by the loss of water from the particles, the smaller amplitude of the perturbation made the sample recompacted internally, the load-carrying capacity and resistance to deformation were restored to a certain extent, the energy released during the destruction was relatively large, and the number of ringing counts was relatively high.
The acquired continuous AE signals in this experimental study were subjected to a transformation from the time domain to the frequency domain using the Fast Fourier Transform (FFT) technique, enabling a further analysis of the AE characteristics exhibited by the samples throughout the experiment. Moreover, a waveform file was formed every 1024 lines, and a 3D spectrum was plotted using Matlab. The sample at the time of damage was selected as the key point N of this experiment, and the height of the peak in the plot represents the size of the main frequency eigenvalue of the acoustic emission, corresponding to the damage degree of the sample. Figure 9 shows the 3D plots of the main frequency characteristics of dry and watery soft rock due to the dynamic perturbation under the influence of different perturbation amplitudes, where (a) to (e) corresponds to the experimental results of the dry samples from 2 amplitude to 10 amplitude, and (f) to (j) corresponds to the watery samples. The analysis leads to the following characteristics of the sample acoustic emission:
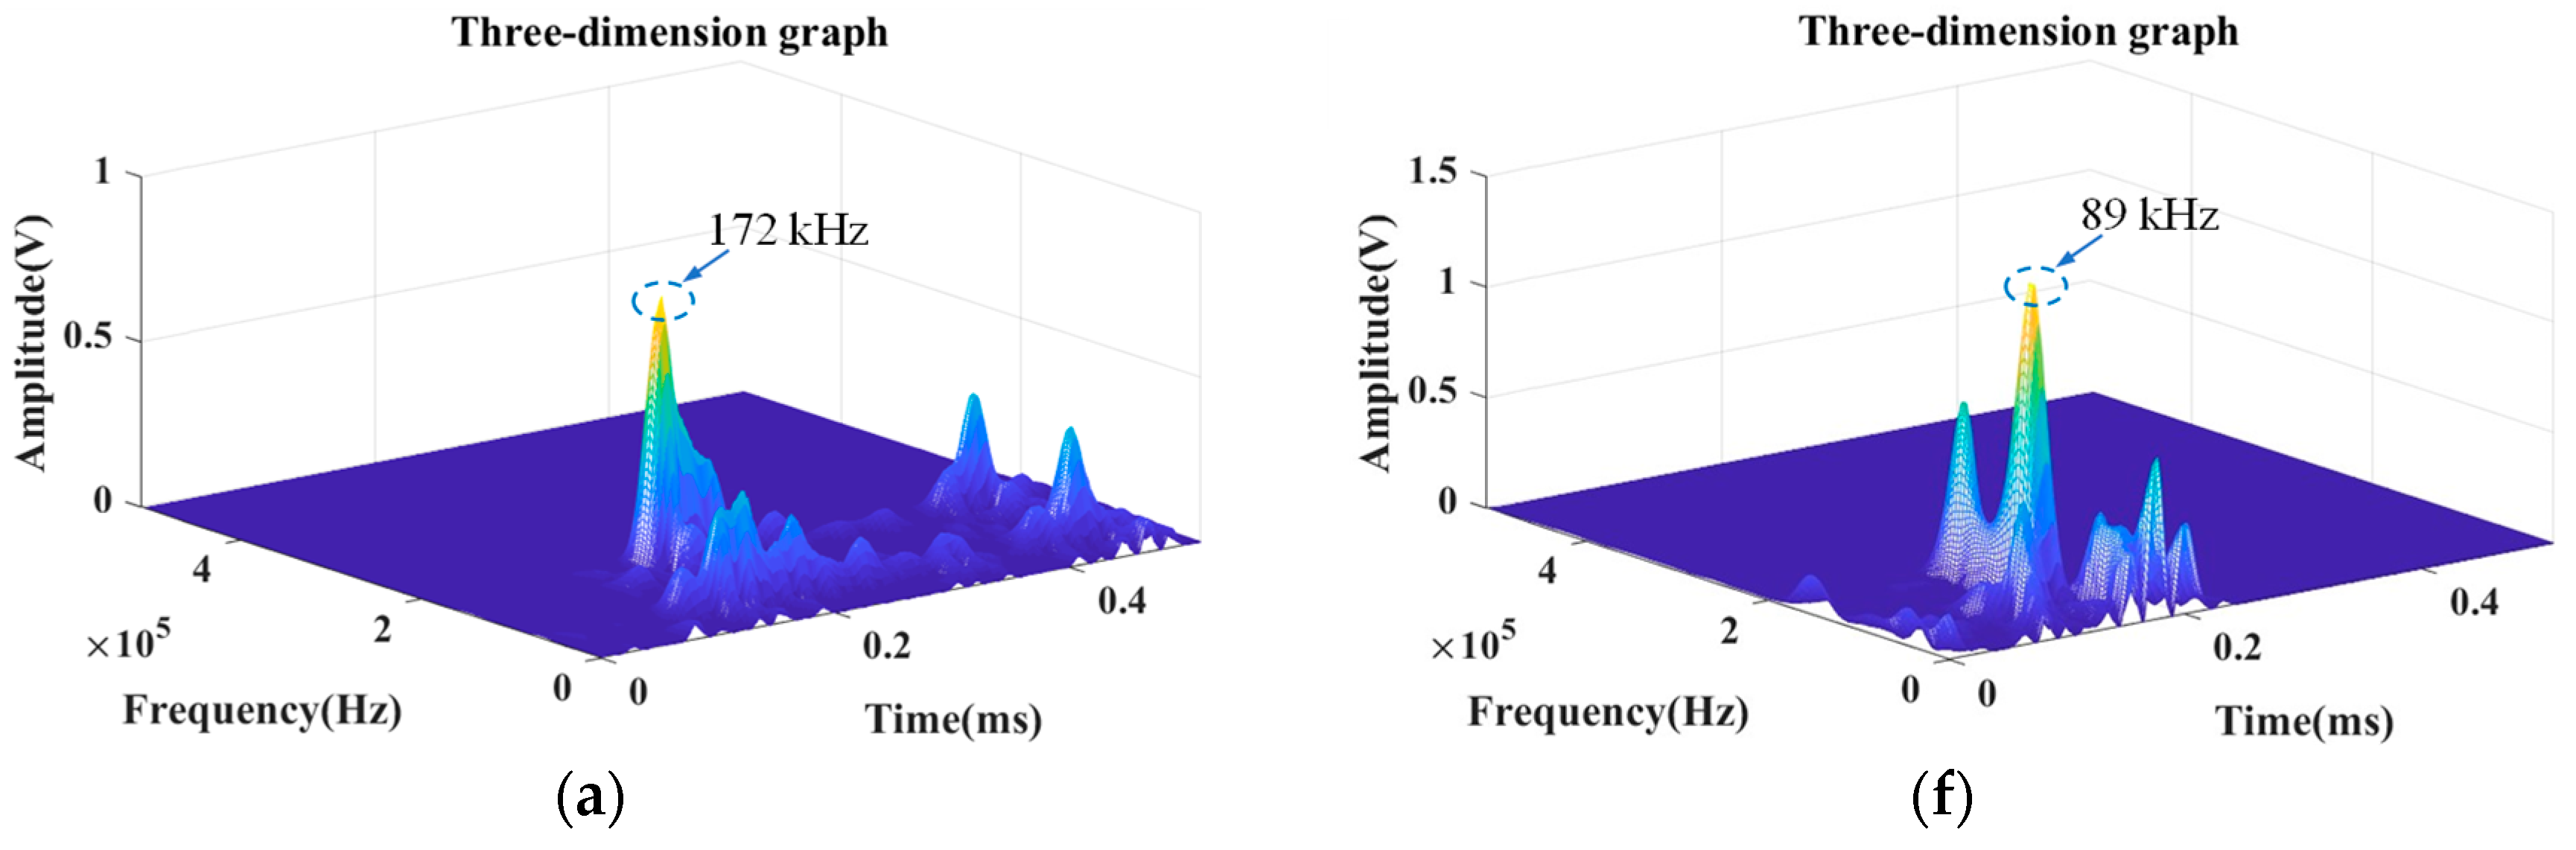
  • The main frequency eigenvalue of the dry sample decreased gradually with the increase in the perturbation amplitude, and the main frequency range of key point N was between 140 and 172 KHz, with the maximum of 172 KHz at 2 amplitude and the minimum of 140 KHz at an amplitude of 10. The main frequency eigenvalue of the saturated sample changed the rule of law with the dry sample, and the main frequency range of key point N was between 50 and 89 KHz, with the maximum of 89 KHz at 2 amplitude and the minimum of 50 KHz at an amplitude of 10. The smallest amplitude was 50 KHz.
  • The eigenvalues corresponding to the primary frequencies of the dry samples surpassed those of the water-saturated samples.
  • An inverse relationship was found between the degree of destruction of the sample and the eigenvalue of the dominant frequency. When the degree of destruction was intense, the eigenvalue of the dominant frequency was small.

3.4. Macro Damage Characteristics

Figure 10 shows the macroscopic damage characteristics of the dry and saturated states subjected to different perturbation amplitudes, where images (a) to (e) correspond to the experimental results of the dry samples from 2 amplitudes to 10 amplitudes, respectively, and images (f) to (j) correspond to the saturated samples. The figure shows the following:
(1)
Under the perturbation with an amplitude value of 2, the dry sample experienced the formation of multiple tensile cracks originating from the bottom and propagating towards the middle, leading to destabilization damage of the specimen; the overall performance of tensile damage; the sample from the end face of the development of the main crack and the formation of a shear angle of approximately 65° in the surface of the sample in the 4 amplitude value to 8 amplitude value of the perturbation; the experimental samples damage mode for the laminar surface of the shear slippage along the axial cleavage composite damage in the main cracks around the development of a number of micro-cracks; at 10 amplitude, the tensile cracks developed from the upper end face extending to the middle of the specimen; the right half of the sample had the tendency of peeling off, the macro-cracks increased significantly, and the experimental samples as a whole showed tensile damage.
(2)
In water-saturated samples with an amplitude value of 2, damage cracks from the top of the specimen down formed a shear surface, with the increase in stress gradually through the weak surface, and linear single oblique shear damage was formed. With amplitude values of 4 and 6, the conjugate shear damage and cracks in general showed “X”-type damage, and the degree of destruction deepened. At 8 and 10 magnitudes, the damage mode was tensile damage. The crack extension form was significantly affected by the perturbation load, tendency of peeling off on the surface of the samples existed, and the damage degree was further deepened.

4. Discussion

In this study, the behavior of muddy sandstones under the action of dynamic perturbations of different amplitudes was thoroughly investigated. The saturated water content was determined to provide an important basis for understanding the moisture state of the sandstones. The “dilute to dense” hysteresis loop curves observed during the dynamic perturbations highlight the intricacies of the mechanical response of the samples. The apparent response of the sample peak strength and Young’s modulus to different perturbation amplitudes reveals a complex pattern of strengthening and weakening phases, reflecting the subtle interplay between dynamic stresses and material properties. Notably, both dry and water-saturated samples show sensitivity to the perturbation amplitude, with moisture content having a significant effect on the growth of mechanical properties. The division of the acoustic emission (AE) signal into different phases reveals the dynamic response of the argillaceous sandstone. The effect of moisture on the intensity of the AE signal is evident, especially in each phase where the AE signal from the dry sample dominates. The cyclic intensification effect observed during fluctuations highlights the dynamic interplay between stress accumulation and release mechanisms. The evolving damage patterns at different perturbation amplitudes provide insight into the damage mechanisms of the material. The dry samples transition from tensile to composite damage, whereas the water-saturated samples evolve from monoclinic shear to “X”-type conjugate shear and finally to tensile damage. This highlights the role of water content in altering the damage mode and the underlying mechanisms involved.
However, there are limitations and deficiencies in this experimental assignment, which are reflected in (1) the diversity of samples, as only rocks in dry and saturated states were studied in this experiment and there were surrounding rocks with different water content gradients in the actual engineering; (2) the complexity of the disturbance, as the dynamic disturbance process is not only related to the disturbance amplitude but also related to the waveform, frequency, number of disturbances, and other factors, with this experiment only considering the disturbance amplitude factor; and (3) the lack of long-term behavior, as this experiment only captured the mechanical behavior of the samples under the action of short-term perturbations and was unable to fully understand the changes and deterioration trends of the samples subjected to long-term perturbations. These limitations need to be considered and addressed in future studies to obtain more comprehensive and accurate results.

5. Conclusions

(1)
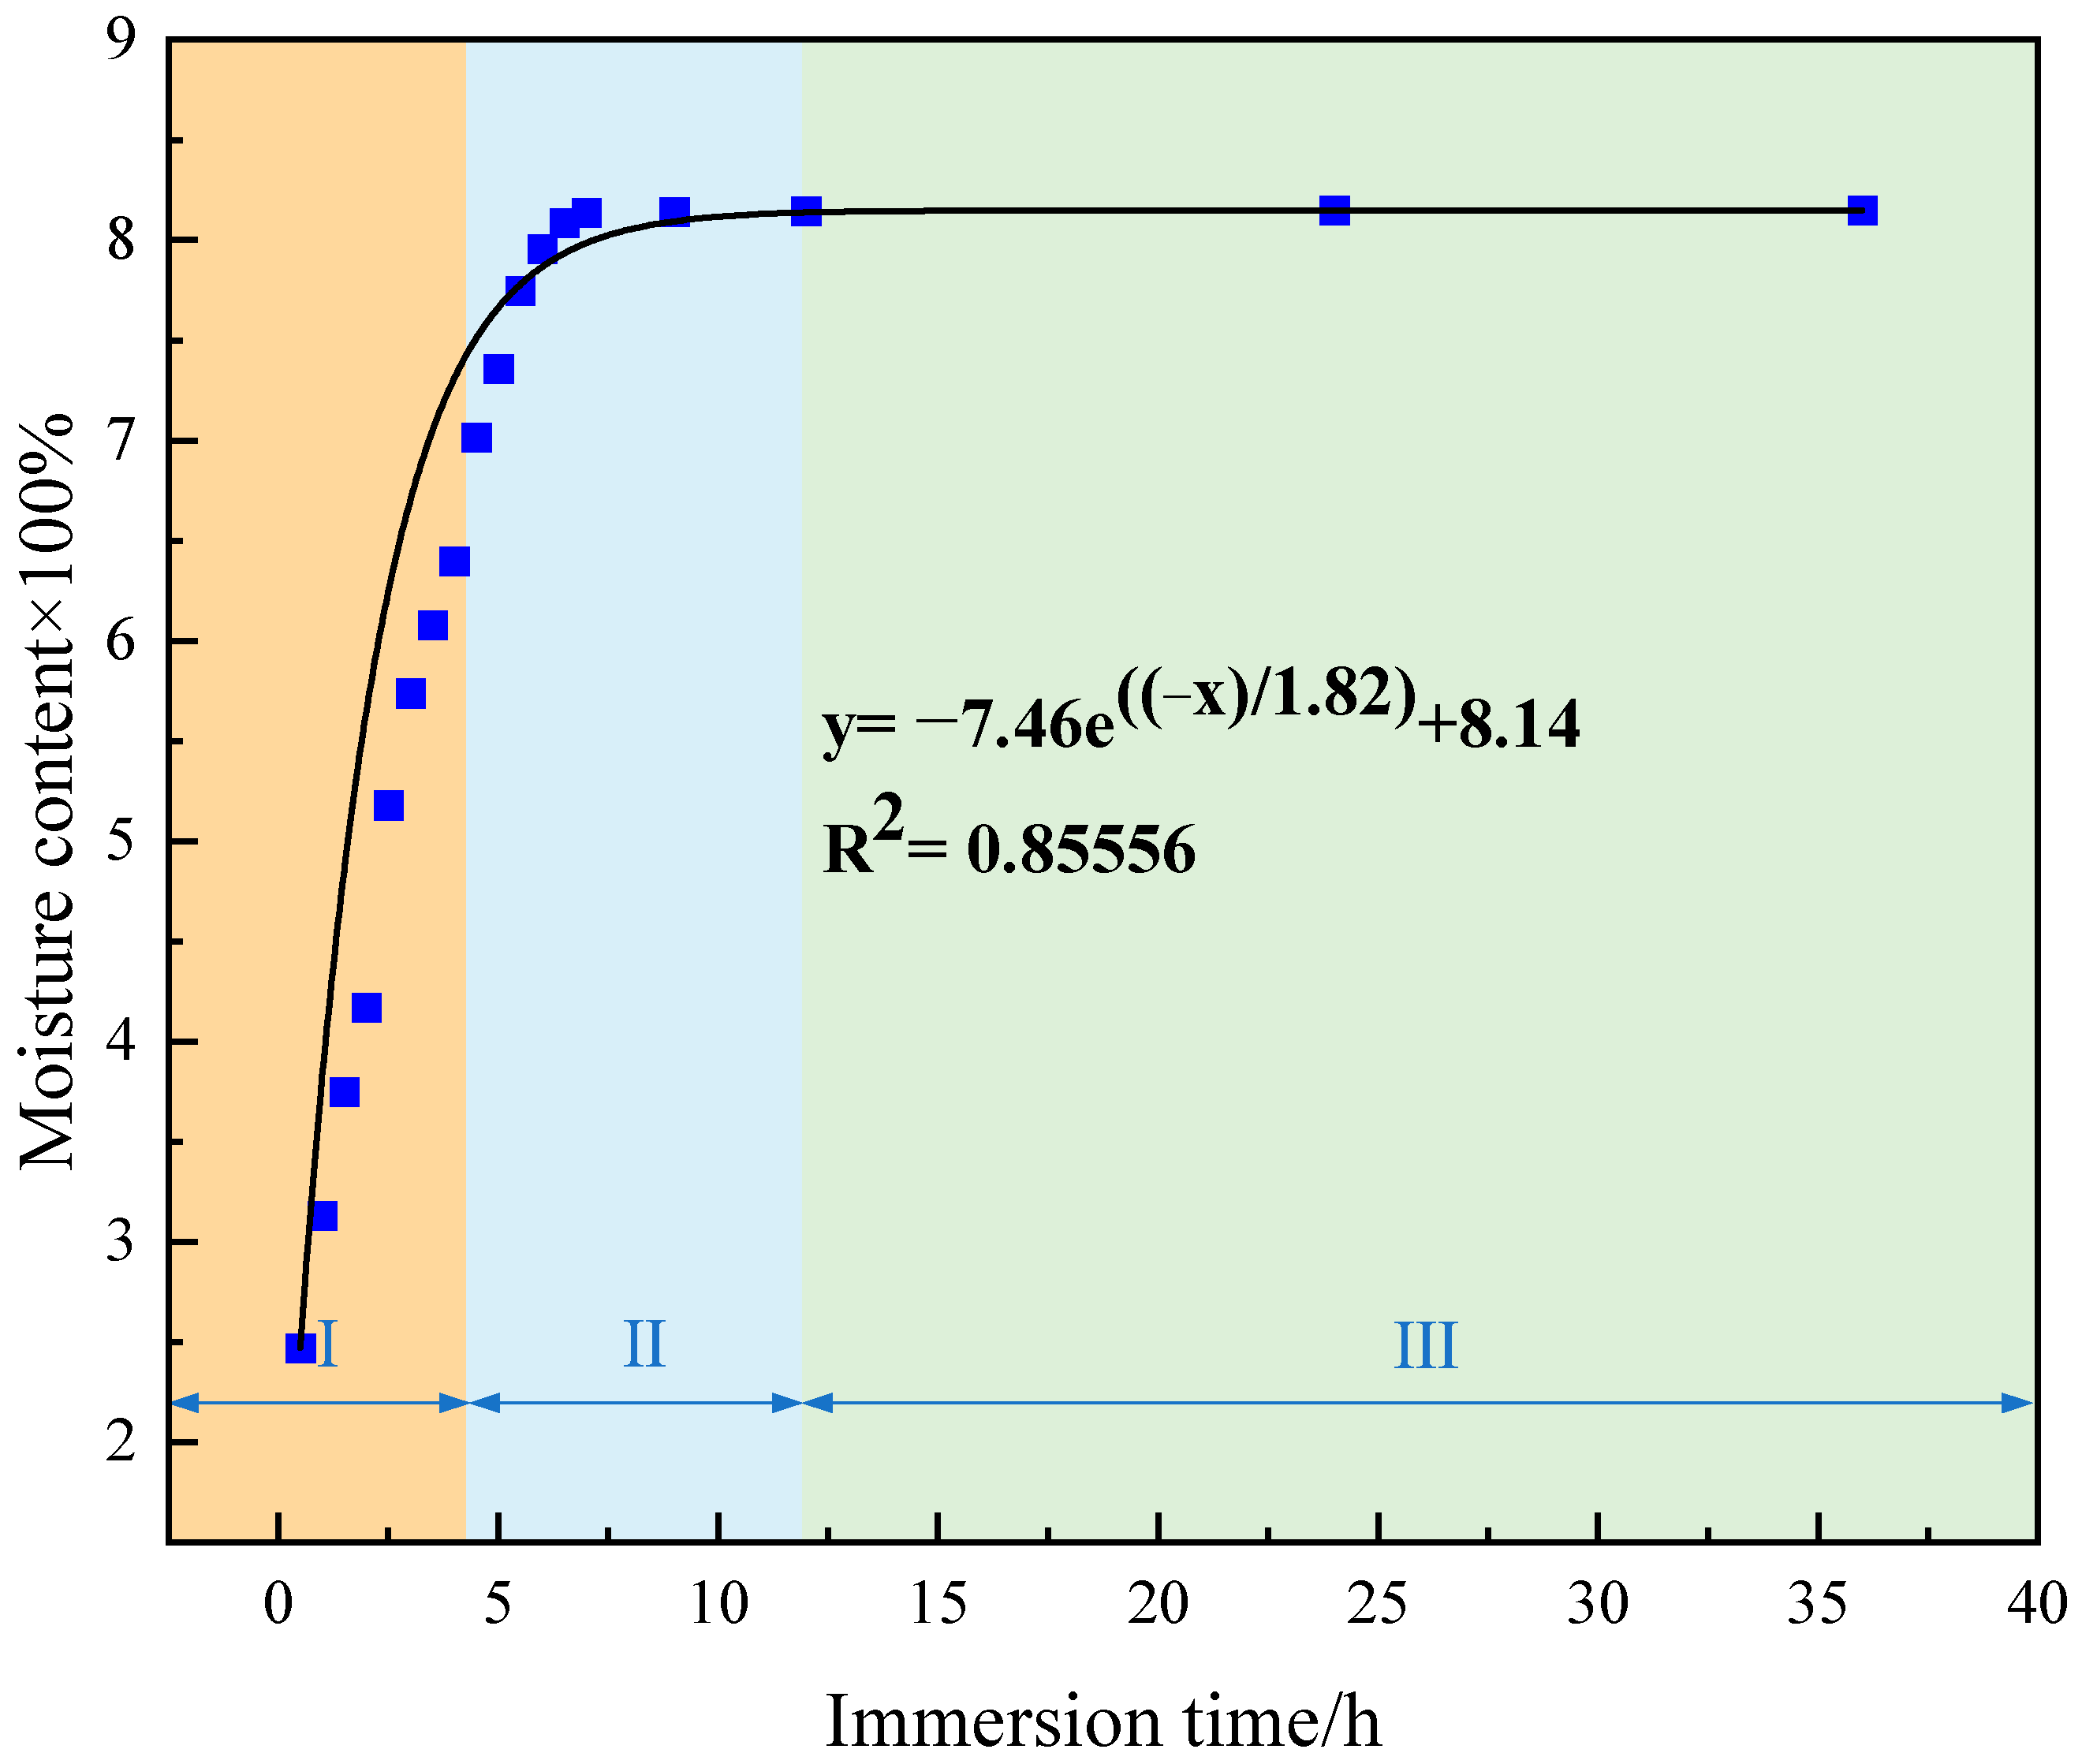
The muddy sandstone has a saturation water content of 8.148%. In the dynamic perturbation process, the area of the pointed leaf-shaped hysteresis loop is positively linked to the frequency of perturbations. Additionally, this area increases with the perturbation amplitude. Under the same amplitude conditions, the hysteresis loop area of saturated water samples is greater than that of the dry samples.
(2)
The peak strength and modulus of elasticity of the samples are nonlinearly related to the amplitude of the perturbation. At 4 amplitude, the strengthening of both samples reaches the maximum, and the water-saturated samples are more sensitive to the effect of the amplitude, and the mechanical characteristic parameters increase or decrease drastically.
(3)
The acoustic emission signals of the samples can be divided into four stages according to the characteristics of signal growth. The peak values of the acoustic emission signals of the dry samples are larger than those of the water-saturated samples, and there is a cyclic intensification effect in the fluctuation period (II), which is more obvious as the amplitude increases. The main frequency eigenvalues of the acoustic emission are larger than those of the water-saturated samples when the dry samples are damaged, but the damage degree is reduced.
(4)
The damage mode of dry samples varies with amplitude from tensile damage, to tensile–shear composite damage, and finally to tensile damage. The water-saturated samples vary from single-bevel shear damage, to “X”-type conjugate shear damage, and finally to tensile damage.

Author Contributions

L.C.: Writing original draft and data processing. D.W.: Writing original draft and reviewing. Y.J.: Reviewing. H.L.: Checking and proofreading. G.Z.: Checking and proofreading. B.L.: Data processing and typesetting. All authors have read and agreed to the published version of the manuscript.

Funding

This research was supported by the National Natural Science Foundation of China (No. 52204101), the Natural Science Foundation of Shandong Province (No. ZR2022QE137), and the Open Project of State Key Laboratory for Geomechanics and Deep Underground Engineering in CUMTB (No. SKLGDUEK2023).

Institutional Review Board Statement

Not applicable.

Informed Consent Statement

Not applicable.

Data Availability Statement

The data can be provided if necessary.

Acknowledgments

We sincerely thank our study participants.

Conflicts of Interest

The authors declare no conflict of interest.

References

  1. Xie, H.P.; Gao, F.; Ju, Y.; Gao, M.Z.; Zhang, R.; Gao, Y.N.; Liu, J.F.; Xie, L.Z. Quantitative definition and investigation of deep mining. J. Chin. Coal. Soc. 2015, 40, 1–10. [Google Scholar]
  2. Wang, X.F.; Chen, X.Y.; Wang, J.Y.; Chang, Z.C.; Qin, D.D.; Hang, Q.X. Study on creep failure mechanism and control of the deep soft rock roadway in pingdingshan mining area. J. Min. Saf. Eng. 2022, 1–12. [Google Scholar]
  3. Hang, B.X.; Zhang, N.; Jing, H.W.; Kan, J.G.; Meng, B.; Li, N.; Xie, W.B.; Jiao, J.B. Large deformation theory of rheology and structural instability of the surrounding rock in deep mining roadway. J. Chin. Coal. Soc. 2020, 45, 911–926. [Google Scholar]
  4. Grgic, D.; Amitrano, D. Creep of a porous rock and associated acoustic emission under different hydrous conditions. J. Geophys. Res. Solid Earth. 2009, 114, 1–19. [Google Scholar] [CrossRef]
  5. Codeglia, D.; Dixon, N.; Fowmes, G.J.; Marcato, G. Analysis of acoustic emission patterns for monitoring of rock slope deformation mechanisms. Eng. Geol. 2017, 219, 21–31. [Google Scholar] [CrossRef]
  6. Pham, Q.T.; Vales, F.; Malinsky, L.; Minh, D.N.; Gharbi, H. Effects of desaturation-resaturation on mudstone. Phys. Chem. Earth Parts A/B/C 2007, 32, 646–655. [Google Scholar] [CrossRef]
  7. Cai, X.; Zhou, Z.L.; Du, X.M. Water-induced variations in dynamic behavior and failure characteristics of sandstone subjected to simulated geo-stress. Int. J. Rock Mech. Min. Sci. 2020, 130, 104339. [Google Scholar] [CrossRef]
  8. Weng, L.; Wu, Z.J.; Liu, Q.S. Dynamic mechanical properties of dry and water-saturated siltstones under sub-zero temperatures. Rock. Mech. Rock. Eng. 2019, 53, 4381–4401. [Google Scholar] [CrossRef]
  9. Gao, L.S.; Xu, Y.; Wu, B.B.; Wang, S. Dynamic compression strength of thermal damaged Fangshan marble on dry and saturated conditions. Chin. J. Rock. Mech. Eng. 2018, 37, 3826–3833. [Google Scholar]
  10. Zhou, Z.L.; Cai, X.; Zhao, Y.; Chen, L.; Xiong, C.; Li, X.B. Strength characteristics of dry and saturated rock at different strain rates. T. Nonferr. Metal. Soc. 2016, 1919–1925. [Google Scholar] [CrossRef]
  11. Zhao, Y.X.; Liu, S.M.; Jiang, Y.D.; Wang, K.; Hang, Y.Q. Dynamic tensile strength of coal under dry and saturated conditions. Rock. Mech. Rock. Eng. 2016, 49, 1709–1720. [Google Scholar] [CrossRef]
  12. Özbek, A. Investigation of the effects of wetting-drying and freezing-thawing cycles on some physical and mechanical properties of selected ignimbrites. Bull. Eng. Geol. Environ. 2014, 73, 595–609. [Google Scholar] [CrossRef]
  13. Khanlari, G.; Abdilor, Y. Influence of wet-dry, freeze-thaw, and heat-cool cycles on the physical and mechanical properties of Upper Red sandstones in central Iran. Bull. Eng. Geol. Environ. 2015, 74, 1287–1300. [Google Scholar] [CrossRef]
  14. Ren, S.; Li, K.X.; Zhang, P. Mechanical properties and failure characteristics of sandstone under combined effect of dynamic disturbance and high temperature. J. Cent. South. Univ. (Sci. Technol.) 2023, 3, 1087–1097. [Google Scholar]
  15. Zhang, P.; Ren, S.; Zhang, C.; Wu, F.; Long, N.Z.; Li, K.X. Rockburst tendency and failure characteristics of sandstone under cyclic disturbance and high temperature. Rock. Soil. Mech. 2023, 3, 771–783. [Google Scholar]
  16. Wang, Y.; Zhou, Z.; Ling, K.; Guo, Y.P. Study on Acoustic Emission Characteristics of Sandstone Impact Rockburst under Different Disturbance Frequencies. Coal. Tech. 2022, 12, 27–31. [Google Scholar]
  17. Feng, F.; Chen, S.J.; Wang, Q.; Rostami, J.; Khoreshok, A.; Sheng, S.Q.; Bian, Z.; Ding, Y.S. Experimental study on failure characteristics of natural and saturated sandstone under true triaxial unloading and dynamic disturbance condition. Chin. J. Rock. Mech. Eng. 2022, 11, 2240–2253. [Google Scholar]
  18. Yang, K.; Zhang, Z.N.; Chi, X.L.; Lü, X.; Wei, Z.; Liu, W.J. Experimental study on crack evolution and damage characteristics of water bearing sandstone under cyclic loading. Rock. Soil. Mech. 2022, 7, 1791–1802. [Google Scholar]
  19. Zhang, Q.X.; Ge, X.R.; Hang, M.; Sun, H. Testing study on fatigue deformation law of Red-sandstone under triaxial compression with cyclic loading. Chin. J. Rock. Mech. Eng. 2006, 25, 473–478. [Google Scholar]
  20. Xiao, J.Q.; Ding, D.X.; Xu, G.; Jiang, F.L. Deformation characteristics of rock under constant amplitude cyclic loading. J. Cent. South. Univ. Sci. Technol. 2010, 41, 685–691. [Google Scholar]
  21. Li, S.C.; Xu, J.; Tao, Y.Q.; Tang, X.J.; Yang, H.W. Low cycle fatigue damage model and damage variable expression of rock. Rock. Soil. Mech. 2009, 30, 1611–1615. [Google Scholar]
  22. Guo, Y.T.; Zhao, K.L.; Sun, G.H.; Yang, C.H.; Ma, H.L.; Zhang, G.M. Experimental study of fatigue deformation and damage characteristics of salt rock under cyclic loading. Rock. Soil. Mech. 2011, 32, 1353–1358. [Google Scholar]
  23. Sun, X.M.; Jiang, M.; Wang, X.B.; Zang, J.C.; Gao, X.; Miao, C.Y. Experimental study on creep mechanical properties of sandstone with different water content in Wanfu Coal Mine. Rock. Soil. Mech. 2023, 44, 624–636. [Google Scholar]
  24. Sun, X.M.; Wang, D.; Feng, J.L.; Zhang, C.; Chen, Y.W. Deformation Control of Asymmetric Floor Heave in Deep Rock Roadway: A Case Study. Int. J. Min. Sci. Technol. 2014, 24, 799–804. [Google Scholar] [CrossRef]
  25. Erguler, Z.A.; Ulusay, R. Water-induced variations in mechanical properties of clay-bearing rocks. Int. J. Rock Mech. Min. Sci. 2009, 46, 355–370. [Google Scholar] [CrossRef]
  26. Roy, D.G.; Singh, T.N.; Kodikara, J.; Das, R. Effect of Water Saturation on the Fracture and Mechanical Properties of Sedimentary Rocks. Rock. Mech. Rock. Eng. 2017, 50, 2585–2600. [Google Scholar]
  27. Yu, C.; Tang, S.; Tang, C.A.; Duan, D.; Zhang, Y.; Liang, Z.; Ma, K.; Ma, T. The effect of water on the creep behavior of red sandstone. Eng. Geol. 2019, 253, 64–74. [Google Scholar] [CrossRef]
  28. Tang, S.B.; Yu, C.Y.; Heap, M.J.; Chen, P.Z.; Ren, Y.G. The Influence of Water Saturation on the Short- and Long-Term Mechanical Behavior of Red Sandstone. Rock. Mech. Rock. Eng. 2018, 51, 2669–2687. [Google Scholar] [CrossRef]
  29. Wang, D.; Jiang, Y.; Sun, X.; Luan, H.; Zhang, H. Nonlinear Large Deformation Mechanism and Stability Control of Deep Soft Rock Roadway: A Case Study in China. Sustainability 2019, 11, 6243. [Google Scholar] [CrossRef]
  30. Dong, L.; Wang, D.; Sun, X.; Jiang, Y.; Luan, H.; Xu, H.; Li, B.; Cai, F. Large-Deformation Failure Mechanism and Stability Control of a Swelling Soft Rock Roadway in a Sea Area: A Case Study in Eastern China. Sustainability 2023, 15, 5323. [Google Scholar] [CrossRef]
  31. Liu, H.; Yang, G.S.; Shen, Y.J.; Ye, W.J.; Xi, J.M.; Jin, L.; Wei, Y.; Li, B.R.; Liu, S. CT visual quantitative characterization of meso-damage evolution of sandstone under freeze-thaw-loading synergistic effect. Chin. J. Rock. Mech. Eng. 2023, 42, 1136–1149. [Google Scholar]
  32. Liu, S.X.; Xing, J.; Zheng, X.; Chen, S.J. Zonal damage information and critical failure identification of CT images of rock under triaxial compression. Chin. J. Geotech. 2021, 3, 432–438. [Google Scholar]
Figure 1. Water content curve over time.
Sustainability 15 13201 g001
Figure 2. Schematic diagram of the creep dynamic disturbance impact loading system.
Sustainability 15 13201 g002
Figure 3. Schematic diagram of the loading process of the cyclic disturbance load.
Sustainability 15 13201 g003
Figure 4. Stress–strain curves. (a) Dryness; (b) saturation.
Sustainability 15 13201 g004
Figure 5. Hysteresis loop curves. (a) Dryness; (b) saturation.
Sustainability 15 13201 g005
Figure 6. Compressive strength of dry and water-saturated samples. (a) Dryness; (b) saturation.
Sustainability 15 13201 g006
Figure 7. Young’s modulus of dry and water-saturated samples. (a) Dryness; (b) saturation.
Sustainability 15 13201 g007
Figure 8. Acoustic emission characteristic parameters and stress–strain relationships. (a) Dry 2 amplitude; (b) dry 4 amplitude; (c) dry 6 amplitude; (d) dry 8 amplitude; (e) dry 10 amplitude; (f) saturation 2 amplitude; (g) saturation 4 amplitude; (h) saturation 6 amplitude; (i) saturation 8 amplitude; (j) saturation 10 amplitude.
Sustainability 15 13201 g008aSustainability 15 13201 g008b
Figure 9. Three-dimensional mapping of the eigenvalues of the main frequency. (a) Dry 2 amplitude; (b) dry 4 amplitude; (c) dry 6 amplitude; (d) dry 8 amplitude; (e) dry 10 amplitude; (f) saturation 2 amplitude; (g) saturation 4 amplitude; (h) saturation 6 amplitude; (i) saturation 8 amplitude; (j) saturation 10 amplitude.
Sustainability 15 13201 g009aSustainability 15 13201 g009b
Figure 10. Sample macroscopic damage characteristics. (a) Dry 2 amplitude; (b) dry 4 amplitude; (c) dry 6 amplitude; (d) dry 8 amplitude; (e) dry 10 amplitude; (f) saturation 2 amplitude; (g) saturation 4 amplitude; (h) saturation 6 amplitude; (i) saturation 8 amplitude; (j) saturation 10 amplitude.
Sustainability 15 13201 g010
Table 1. Experimental data on the basic mechanical parameters of muddy sandstone samples.
State of Rock SampleNo. of SamplesAverage Water Content (%)Average Compressive Strength (MPa)Average Modulus of Elasticity (GPa)
Dryness30.00033.864.14
Saturation38.14812.602.31
Table 2. Experimental program for the dynamic perturbation of muddy sandstone samples.
State of Rock SampleSample GroupNo. of SamplesAverage Water Content (%)σm (MPa)Disturbance Frequency (Hz)Amplitude (kN)
DrynessDS-230.00016.9352
DrynessDS-430.00016.9354
DrynessDS-630.00016.9356
DrynessDS-830.00016.9358
DrynessDS-1030.00016.93510
SaturationSS-238.1486.3052
SaturationSS-438.1486.3054
SaturationSS-638.1486.3056
SaturationSS-838.1486.3058
SaturationSS-1038.1486.30510
Table 3. Mechanical parameters of the samples under different amplitude effects.
State of Rock SampleSample GroupNo. of SamplesAverage Water Content (%)Average Compressive Strength (MPa)Average Modulus of Elasticity (GPa)
DrynessDS-230.00034.094.52
DrynessDS-430.00034.754.78
DrynessDS-630.00033.324.47
DrynessDS-830.00032.114.24
DrynessDS-1030.00031.343.97
SaturationSS-238.14813.622.69
SaturationSS-438.14815.162.78
SaturationSS-638.14813.922.68
SaturationSS-838.14812.162.13
SaturationSS-1038.14811.901.73
Disclaimer/Publisher’s Note: The statements, opinions and data contained in all publications are solely those of the individual author(s) and contributor(s) and not of MDPI and/or the editor(s). MDPI and/or the editor(s) disclaim responsibility for any injury to people or property resulting from any ideas, methods, instructions or products referred to in the content.

