

Severity Predictions for Intercity Bus Crashes on Highway Using a Random Parameter Ordered Probit Model


Abstract
:1. Introduction
2. Literature Review
3. Methods
4. Results
4.1. Descriptive Statistics
4.2. Results of the Random Parameter Model
4.3. Results of Fixed Parameter Model
5. Discussion
6. Conclusions
Author Contributions
Funding
Institutional Review Board Statement
Informed Consent Statement
Data Availability Statement
Conflicts of Interest
References
- Enforcement Rule of Passenger Transport Service Act, S. Kor. Article 8.6. Available online: https://www.law.go.kr/LSW/lsInfoP.do?lsId=001749&ancYnChk=0#0000 (accessed on 12 April 2023).
- Korea Expressway Corporation’s Highway, Accident Raw Data on Expressway. Available online: https://www.data.go.kr/data/15045638/fileData.do (accessed on 25 January 2023).
- 46 Killed in Bulgaria in Europe’s Worst Bus Crash for a Decade|ARABNEWS. Available online: https://www.arabnews.com/node/1973936/world (accessed on 18 August 2023).
- European Commission. Annual Statistical Report on Road Safety in the EU 2022; European Road Safety Observatory: Brussels, Belgium, 2023. [Google Scholar]
- Fatality and Injury Reporting System Tool (FIRST)|NHTSA. Available online: https://cdan.dot.gov/query (accessed on 20 August 2023).
- Bhin, M.Y.; Son, S.G. Analysis of factors influencing traffic accident severity according to gender of bus drivers. J. Korean Soc. Transp. 2018, 36, 440–451. [Google Scholar] [CrossRef]
- Kim, H.J.; Jeon, G.S.; Jang, J.A.; Yoon, I.S. Analysis of Factors Affecting Buses and Trucks Crash Severity Using Meta-Analysis. J. Korean Soc. Transp. 2020, 38, 520–535. [Google Scholar] [CrossRef]
- Bhin, M.Y.; Son, S.G. The Analysis of Bus Traffic Accident to Support Safe Driving for Bus Drivers. J. Korea Inst. Intell. Transp. Syst. 2019, 18, 14–26. [Google Scholar] [CrossRef]
- Lee, K.Y.; Lee, Y.T.; Chang, M.S. The Application and Development of Accident Model on Freeways. In Proceedings of the 36th Conference of Korean Society of Transportation, Seoul, Republic of Korea, 1 October 1999; pp. 117–122. [Google Scholar]
- Samerei, S.Y.; Aghabayk, K.; Mohammadi, A.; Shiwakoti, N. Data mining approach to model bus crash severity in Australia. J. Saf. Res. 2021, 76, 73–82. [Google Scholar] [CrossRef] [PubMed]
- Nguyen, T.C.; Nguyen, M.H.; Armoogum, J.; Ha, T.T. Bus Crash Severity in Hanoi, Vietnam. Safety 2021, 7, 65. [Google Scholar] [CrossRef]
- Yoon, S.W.; Kho, S.Y.; Kim, D.K. Effect of Regional Characteristics on Injury Severity in Local Bus Crashes: Use of Hierarchical Ordered Model. Transp. Res. Rec. 2017, 2647, 1–8. [Google Scholar] [CrossRef]
- Shen, J.; Gu, H.; Feng, X.; Yu, M.; Zheng, C. Investigation of factors contributing to bus-crash severity based on extended hierarchical ordered probit model with heteroscedasticity. J. Transp. Saf. Secur. 2022, 14, 1531–1551. [Google Scholar] [CrossRef]
- Wang, X.; Jiao, Y.; Huo, J.; Li, R.; Zhou, C.; Pan, H.; Chai, C. Analysis of safety climate and individual factors affecting bus drivers’ crash involvement using a two-level logit model. Accid. Anal. Prev. 2021, 154, 106087. [Google Scholar] [CrossRef]
- Kaplan, S.; Prato, C.G. Risk factors associated with bus accident severity in the United States: A generalized ordered logit model. J. Saf. Res. 2012, 43, 171–180. [Google Scholar] [CrossRef]
- Damsere-Derry, J.; Adanu, E.K.; Ojo, T.K.; Sam, E.F. Injury-severity analysis of intercity bus crashes in Ghana: A random parameters multinomial logit with heterogeneity in means and variances approach. Accid. Anal. Prev. 2021, 160, 106323. [Google Scholar] [CrossRef]
- Nasri, M.; Aghabayk, K. Assessing risk factors associated with urban transit bus involved accident severity: A case study of a Middle East country. Int. J. Crashworthiness 2021, 26, 413–423. [Google Scholar] [CrossRef]
- Saha, B.; Fatmi, M.R.; Rahman, M.M. Modelling injury severity of victims in collisions involving public transit in Dhaka, Bangladesh. Int. J. Crashworthiness 2023, 28, 13–20. [Google Scholar] [CrossRef]
- Anastasopoulos, P.C.; Mannering, F.L. An empirical assessment of fixed and random parameter logit models using crash-and non-crash-specific injury data. Accid. Anal. Prev. 2011, 43, 1140–1147. [Google Scholar] [CrossRef] [PubMed]
- Russo, B.J.; Savolainen, P.T.; Schneider IV, W.H.; Anastasopoulos, P.C. Comparison of factors affecting injury severity in angle collisions by fault status using a random parameter bivariate ordered probit model. Anal. Methods Accid. Res. 2014, 2, 21–29. [Google Scholar] [CrossRef]
- Fountas, G.; Anastasopoulos, P.C.; Abdel-Aty, M. Analysis of accident injury-severities using a correlated random parameter ordered probit approach with time variant covariates. Anal. Methods Accid. Res. 2018, 18, 57–68. [Google Scholar] [CrossRef]
- Jalayer, M.; Shabanpour, R.; Pour-Rouholamin, M.; Golshani, N.; Zhou, H. Wrong-way driving crashes: A random-parameters ordered probit analysis of injury severity. Accid. Anal. Prev. 2018, 117, 128–135. [Google Scholar] [CrossRef] [PubMed]
- Chen, F.; Song, M.; Ma, X. Investigation on the injury severity of drivers in rear-end collisions between cars using a random parameter bivariate ordered probit model. Int. J. Environ. Res. Public Health 2019, 16, 2632. [Google Scholar] [CrossRef] [PubMed]
- Azimi, G.; Rahimi, A.; Asgari, H.; Jin, X. Severity analysis for large truck rollover crashes using a random parameter ordered logit model. Accid. Anal. Prev. 2020, 135, 105355. [Google Scholar] [CrossRef]
- Shao, X.; Ma, X.; Chen, F.; Song, M.; Pan, X.; You, K. A random parameter ordered probit analysis of injury severity in truck involved rear-end collisions. Int. J. Environ. Res. Public Health 2020, 17, 395. [Google Scholar] [CrossRef]
- Xie, S.; Ji, X.; Yang, W.; Fang, R.; Hao, J. Exploring risk factors with crash severity on China two-lane rural roads using a random-parameter ordered probit model. J. Adv. Transp. 2020, 2020, 8870497. [Google Scholar] [CrossRef]
- Darban Khales, S.; Kunt, M.M.; Dimitrijevic, B. Analysis of the impacts of risk factors on teenage and older driver injury severity using random-parameter ordered probit. Can. J. Civ. Eng. 2020, 47, 1249–1257. [Google Scholar] [CrossRef]
- Okafor, S.; Adanu, E.K.; Lidbe, A.; Jones, S. Severity analysis of single-vehicle left and right run-off-road crashes using a random parameter ordered logit model. Traffic Inj. Prev. 2023, 24, 251–255. [Google Scholar] [CrossRef]
- Zeng, Q.; Wen, H.; Huang, H.; Pei, X.; Wong, S.C. A multivariate random-parameters Tobit model for analyzing highway crash rates by injury severity. Accid. Anal. Prev. 2017, 99, 184–191. [Google Scholar] [CrossRef] [PubMed]
- Ijaz, M.; Lan, L.; Usman, S.M.; Zahid, M.; Jamal, A. Investigation of factors influencing motorcyclist injury severity using random parameters logit model with heterogeneity in means and variances. Int. J. Crashworthiness 2022, 27, 1412–1422. [Google Scholar] [CrossRef]
- Zhu, T.; Zhu, Z.; Zhang, J.; Yang, C. Electric bicyclist injury severity during peak traffic periods: A random-parameters approach with heterogeneity in means and variances. Int. J. Environ. Res. Public Health 2021, 18, 11131. [Google Scholar] [CrossRef] [PubMed]
- Rifaat, S.M.; Chin, H.C. Accident severity analysis using ordered probit model. J. Adv. Transp. 2007, 41, 91–114. [Google Scholar] [CrossRef]
- Xie, Y.; Zhang, Y.; Liang, F. Crash injury severity analysis using Bayesian ordered probit models. J. Transp. Eng. 2009, 135, 18–25. [Google Scholar] [CrossRef]
- Lemp, J.D.; Kockelman, K.M.; Unnikrishnan, A. Analysis of large truck crash severity using heteroskedastic ordered probit models. Accid. Anal. Prev. 2011, 43, 370–380. [Google Scholar] [CrossRef]
- Ye, F.; Lord, D. Investigation of effects of underreporting crash data on three commonly used traffic crash severity models: Multinomial logit, ordered probit, and mixed logit. Transp. Res. Rec. 2011, 2241, 51–58. [Google Scholar] [CrossRef]
- Chiou, Y.C.; Hwang, C.C.; Chang, C.C.; Fu, C. Reprint of “Modeling two-vehicle crash severity by a bivariate generalized ordered probit approach”. Accid. Anal. Prev. 2013, 61, 97–106. [Google Scholar] [CrossRef]
- Kardar, A.; Davoodi, S.R. A generalized ordered probit model for analyzing driver injury severity of head-on crashes on two-lane rural highways in Malaysia. J. Transp. Saf. Secur. 2020, 12, 1067–1082. [Google Scholar] [CrossRef]
- Roy, U.; Dissanayake, S. Comparison of factors associated with run-off-road and non-run-off-road crashes in Kansas. J. Transp. Res. Forum 2011, 50, 69–86. [Google Scholar] [CrossRef]
- Kang, C.; Chung, Y.; Chang, Y.J. Injury severity analysis of truck-involved crashes on Korean freeway systems using an ordered probit model. KSCE J. Civ. Environ. Eng. Res. 2019, 39, 391–398. [Google Scholar]
- Wang, K.; Bhowmik, T.; Yasmin, S.; Zhao, S.; Eluru, N.; Jackson, E. Multivariate copula temporal modeling of intersection crash consequence metrics: A joint estimation of injury severity, crash type, vehicle damage and driver error. Accid. Anal. Prev. 2019, 125, 188–197. [Google Scholar] [CrossRef]
- Dong, C.; Richards, S.H.; Huang, B.; Jiang, X. Identifying the factors contributing to the severity of truck-involved crashes. Int. J. Inj. Control. Saf. Promot. 2015, 22, 116–126. [Google Scholar] [CrossRef] [PubMed]
- Chen, H.; Cao, L.; Logan, D.B. Analysis of risk factors affecting the severity of intersection crashes by logistic regression. Traffic Inj. Prev. 2012, 13, 300–307. [Google Scholar] [CrossRef] [PubMed]
- Tay, R.; Rifaat, S.M. Factors contributing to the severity of intersection crashes. J. Adv. Transp. 2007, 41, 245–265. [Google Scholar] [CrossRef]
- Anowar, S.; Yasmin, S.; Tay, R. Factors influencing the severity of intersection crashes in Bangladesh. Asian Transp. Stud. 2014, 3, 143–154. [Google Scholar]
- Prato, C.G.; Kaplan, S. Bus accident severity and passenger injury: Evidence from Denmark. Eur. Transp. Res. Rev. 2014, 6, 17–30. [Google Scholar] [CrossRef]
- Zhu, X.; Srinivasan, S. A comprehensive analysis of factors influencing the injury severity of large-truck crashes. Accid. Anal. Prev. 2011, 43, 49–57. [Google Scholar] [CrossRef]
- Wang, Y.; Luo, Y.; Chen, F. Interpreting risk factors for truck crash severity on mountainous freeways in Jiangxi and Shaanxi, China. Eur. Trans. Res. Rev. 2019, 11, 26. [Google Scholar] [CrossRef]
- Anastasopoulos, P.C.; Shankar, V.N.; Haddock, J.E.; Mannering, F.L. A multivariate tobit analysis of highway accident-injury-severity rates. Accid. Anal. Prev. 2012, 45, 110–119. [Google Scholar] [CrossRef] [PubMed]
- Tamakloe, R.; Hong, J.; Park, D. A copula-based approach for jointly modeling crash severity and number of vehicles involved in express bus crashes on expressways considering temporal stability of data. Accid. Anal. Prev. 2020, 146, 105736. [Google Scholar] [CrossRef] [PubMed]
- Jamal, A.; Umer, W. Exploring the injury severity risk factors in fatal crashes with neural network. Int. J. Environ. Res. Public Health 2020, 17, 7466. [Google Scholar] [CrossRef] [PubMed]
- Chu, H.C. Assessing factors causing severe injuries in crashes of high-deck buses in long-distance driving on freeways. Accid. Anal. Prev. 2014, 62, 130–136. [Google Scholar] [CrossRef] [PubMed]
- Adavikottu, A.; Velaga, N.R. Analysis of speed reductions and crash risk of aggressive drivers during emergent pre-crash scenarios at unsignalized intersections. Accid. Anal. Prev. 2023, 187, 107088. [Google Scholar] [CrossRef] [PubMed]
- Čubranić-Dobrodolac, M.; Švadlenka, L.; Čičević, S.; Trifunović, A.; Dobrodolac, M. A bee colony optimization (BCO) and type-2 fuzzy approach to measuring the impact of speed perception on motor vehicle crash involvement. Soft Comput. 2022, 26, 4463–4486. [Google Scholar] [CrossRef]
- Bamney, A.; Pantangi, S.S.; Jashami, H.; Savolainen, P. How do the type and duration of distraction affect speed selection and crash risk? An evaluation using naturalistic driving data. Accid. Anal. Prev. 2022, 178, 106854. [Google Scholar] [CrossRef]
- Dosovitskiy, A.; Ros, G.; Codevilla, F.; Lopez, A.; Koltun, V. Carla: An open urban driving simulator. CARLA: An open urban driving simulator. In Proceedings of the Conference on Robot Learning, Mountain View, CA, USA, 13–15 November 2017; pp. 117–122. [Google Scholar]
- Xiang, X.; Wang, S.; Su, T.; Li, J.; Mao, S.S.; Geimer, M. KIT Bus: A Shuttle Model for CARLA Simulator. In Proceedings of the 2021 IEEE Industrial Electronics and Applications Conference (IEACon), Penang, Malaysia, 22–23 November 2021; pp. 7–12. [Google Scholar]


| Category | Definition of Variables | Avg. | Std. | |
|---|---|---|---|---|
| Spatial–temporal factors | Segment types | 1 if an intercity bus crashes in main lane; otherwise 0. | 0.731 | 0.443 |
| 1 if an intercity bus crashes in ramp; otherwise 0. | 0.108 | 0.310 | ||
| 1 if an intercity bus crashes in tollgate; otherwise 0. | 0.100 | 0.300 | ||
| 1 if an intercity bus crashes in tunnel; otherwise 0. | 0.050 | 0.217 | ||
| 1 if an intercity bus crashes in the other; otherwise 0. | 0.011 | 0.053 | ||
| Barrier facilities | 1 if an intercity bus crashes in guardrail shoulder; otherwise 0. | 0.435 | 0.496 | |
| 1 if an intercity bus crashes in guardrail fence; otherwise 0. | 0.007 | 0.084 | ||
| 1 if an intercity bus crashes in none of guardrail; otherwise 0. | 0.350 | 0.477 | ||
| 1 if an intercity bus crashes in concrete; otherwise 0. | 0.094 | 0.292 | ||
| 1 if an intercity bus crashes in the other; otherwise 0. | 0.114 | 0.107 | ||
| Human and vehicle factors | The causes of an accident | 1 if an intercity bus crashes due to vehicle defects; otherwise 0. | 0.082 | 0.274 |
| 1 if an intercity bus crashes due to negligence; otherwise 0. | 0.257 | 0.437 | ||
| 1 if an intercity bus crashes due to speeding; otherwise 0. | 0.223 | 0.416 | ||
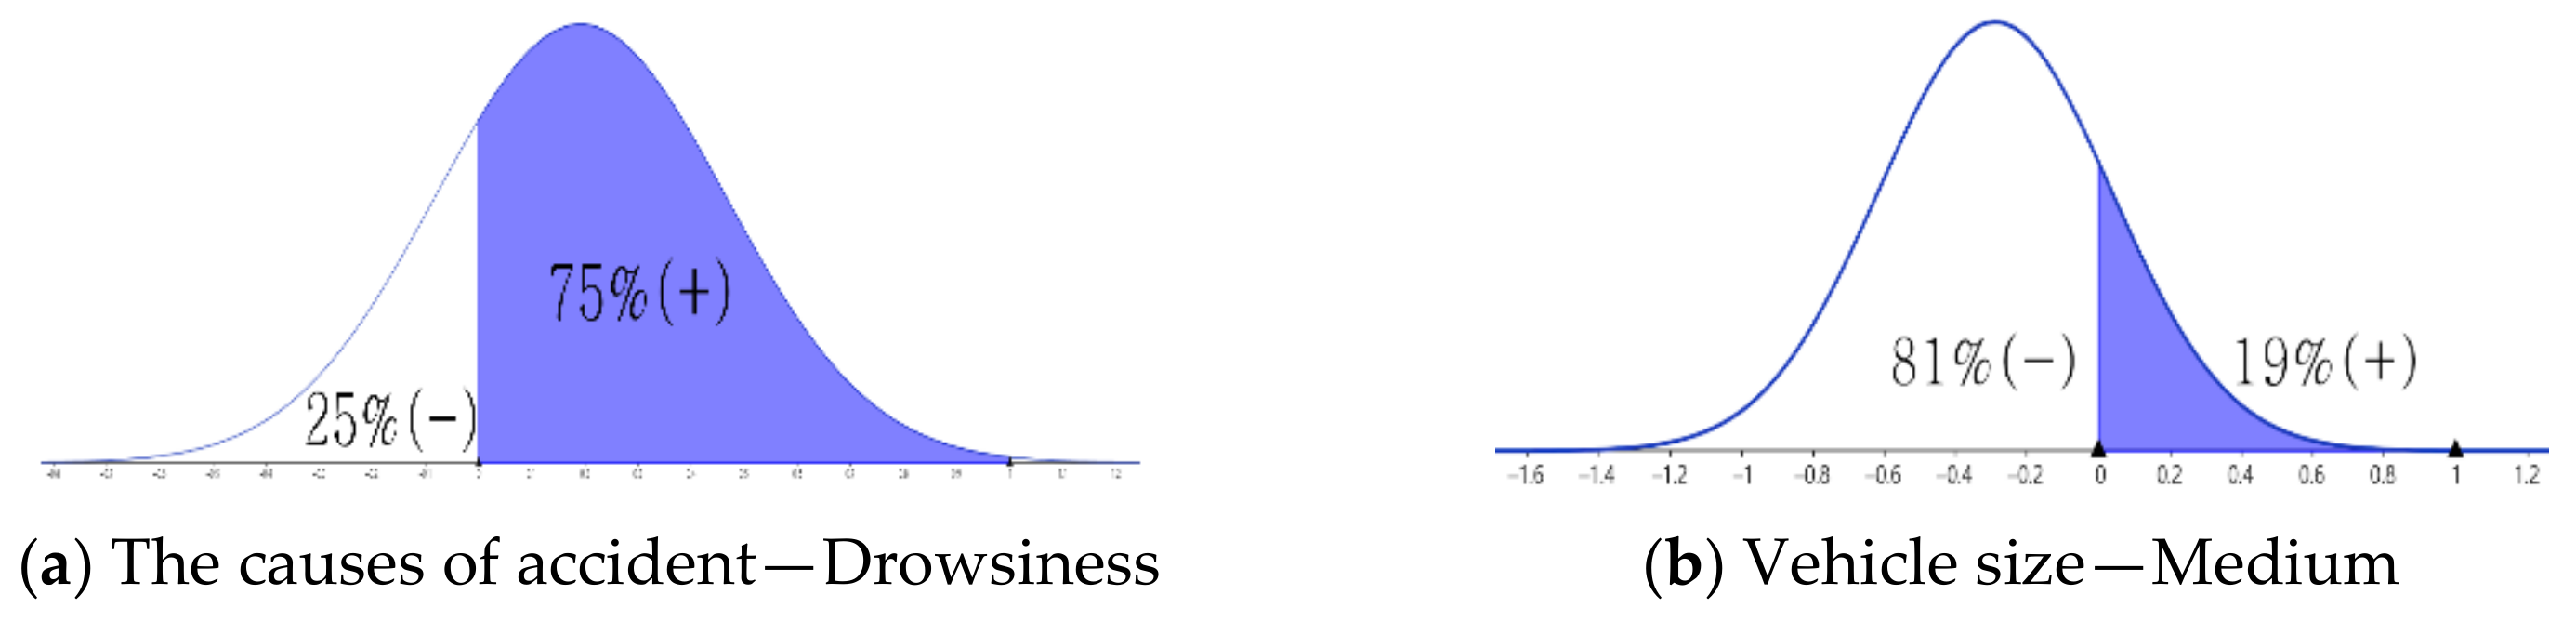
| 1 if an intercity bus crashes due to drowsiness; otherwise 0. | 0.096 | 0.295 | ||
| 1 if an intercity bus crashes due to flat tire; otherwise 0. | 0.071 | 0.258 | ||
| 1 if an intercity bus crashes due to obstacle; otherwise 0. | 0.096 | 0.295 | ||
| 1 if an intercity bus crashes due to safety distance violation; otherwise 0. | 0.039 | 0.192 | ||
| 1 if an intercity bus crashes due to the other; otherwise 0. | 0.136 | 0.097 | ||
| Driver’s condition | 1 if an intercity bus crashes due to normal; otherwise 0. | 0.922 | 0.268 | |
| 1 if an intercity bus crashes due to tired; otherwise 0. | 0.040 | 0.197 | ||
| 1 if an intercity bus crashes due to drinking; otherwise 0. | 0.020 | 0.141 | ||
| 1 if an intercity bus crashes due to the other; otherwise 0. | 0.017 | 0.045 | ||
| Vehicle sizes | 1 if the small size of intercity bus crashes; otherwise 0. | 0.488 | 0.500 | |
| 1 if the medium size of intercity bus crashes; otherwise 0. | 0.278 | 0.448 | ||
| 1 if the big size of intercity bus crashes; otherwise 0. | 0.212 | 0.409 | ||
| 1 if the other size of intercity bus crashes; otherwise 0. | 0.022 | 0.146 | ||
| Types of accident | 1 if the type of intercity bus crash is vehicle–object; otherwise 0. | 0.546 | 0.498 | |
| 1 if the type of intercity bus crash is vehicle–vehicle; otherwise 0. | 0.239 | 0.427 | ||
| 1 if the type of intercity bus crash is vehicle–pedestrian; otherwise 0. | 0.012 | 0.108 | ||
| 1 if the type of intercity bus crash is other; otherwise 0. | 0.203 | 0.278 | ||
| Driver’s ages | 1 if the bus driver is 20–29 s; otherwise 0. | 0.057 | 0.231 | |
| 1 if the bus driver is 30–39 s; otherwise 0. | 0.269 | 0.444 | ||
| 1 if the bus driver is 40–49 s; otherwise 0. | 0.135 | 0.342 | ||
| 1 if the bus driver is 50–59 s; otherwise 0. | 0.206 | 0.404 | ||
| 1 if the bus driver is 60–69 s; otherwise 0. | 0.227 | 0.419 | ||
| 1 if the bus driver is 70 s; otherwise 0. | 0.107 | 0.174 | ||
| Roadway and environmental factors | Rates of vehicle | 1 if the intercity bus crashes in rates of car; otherwise 0. | 0.684 | 0.075 |
| 1 if the intercity bus crashes in rates of truck; otherwise 0. | 0.038 | 0.018 | ||
| 1 if the intercity bus crashes in rates of bus; otherwise 0. | 0.277 | 0.076 | ||
| Road surface conditions | 1 if the intercity bus crashes on moisture of road surface; otherwise 0. | 0.272 | 0.445 | |
| 1 if the intercity bus crashes on dry road surface; otherwise 0. | 0.717 | 0.451 | ||
| 1 if the intercity bus crashes on icy road surface; otherwise 0. | 0.011 | 0.069 | ||
| Weather | 1 if the intercity bus crashes in snow; otherwise 0. | 0.049 | 0.216 | |
| 1 if the intercity bus crashes in fine weather; otherwise 0. | 0.596 | 0.491 | ||
| 1 if the intercity bus crashes in the rain; otherwise 0. | 0.207 | 0.405 | ||
| 1 if the intercity bus crashes in cloudy weather; otherwise 0. | 0.137 | 0.344 | ||
| 1 if the intercity bus crashes in other; otherwise 0. | 0.011 | 0.027 | ||
| Seasons | 1 if the intercity bus crashes in spring; otherwise 0. | 0.239 | 0.427 | |
| 1 if the intercity bus crashes in summer; otherwise 0. | 0.278 | 0.448 | ||
| 1 if the intercity bus crashes in fall; otherwise 0. | 0.245 | 0.430 | ||
| 1 if the intercity bus crashes in winter; otherwise 0. | 0.237 | 0.425 | ||
| Annual average daily traffic volumes (vehs/day) | Log (AADT) | 10.704 | 0.785 | |
| Variable | Estimate | Odds Ratio | Std. Err | t-Stat |
|---|---|---|---|---|
| Constant | −1.473 *** | 0.229 | 0.353 | −4.178 |
| Ramp (1 if ramp segment; 0 otherwise) | −0.355 *** | 0.701 | 0.087 | −4.074 |
| Tollgate (1 if tollgate; 0 otherwise) | −0.711 *** | 0.491 | 0.098 | −7.268 |
| Negligence (1 if driver is negligent; 0 otherwise) | 0.147 *** | 1.158 | 0.060 | 2.443 |
| Flat tire (1 if bus tire is flat; 0 otherwise) | 0.275 *** | 1.317 | 0.097 | 2.841 |
| Obstacle (1 if obstacle on the freeway; 0 otherwise) | −0.867 *** | 0.420 | 0.124 | −6.995 |
| Drowsiness (1 if driver is drowsy; 0 otherwise) | 0.226 *** | 1.254 | 0.086 | 2.619 |
| Small (1 if bus size is small; 0 otherwise) | −0.316 *** | 0.729 | 0.062 | −5.078 |
| Medium (1 if bus size is medium; 0 otherwise) | −0.246 *** | 0.782 | 0.068 | −3.634 |
| Vehicle–vehicle (1 if a vehicle to vehicle crash; 0 otherwise) | 0.739 *** | 2.095 | 0.060 | 12.358 |
| Vehicle–pedestrian (1 if a vehicle to pedestrian crash; 0 otherwise) | 2.134 *** | 8.445 | 0.208 | 10.255 |
| normal (1 if the driver’s condition is normal; 0 otherwise) | −0.342 *** | 0.711 | 0.089 | −3.820 |
| Rainy (1 if it rains; 0 otherwise) | 0.234 ** | 1.264 | 0.106 | 2.203 |
| Guardrail fence (1 if guardrail fence exists; 0 otherwise) | −0.639 ** | 0.528 | 0.315 | −2.025 |
| 30s (1 if driver’s age ≥30 and <40; 0 otherwise) | −0.173 *** | 0.841 | 0.058 | −2.981 |
| Rate of Truck volume (truck volume/total volume at the crash point) | 2.882 ** | 17.843 | 1.335 | 2.159 |
| Summer (1 if the season is summer; 0 otherwise) | −0.160 *** | 0.852 | 0.055 | −2.884 |
| Moisture (1 if moisture on the pavement; 0 otherwise) | −0.334 *** | 0.716 | 0.097 | −3.434 |
| Log AADT (logarithm of AADT) | 0.134 *** | 1.143 | 0.031 | 4.265 |
| Log-likelihood function = −2057.160 | ||||
| Number of observations = 3064 | ||||
| Restricted Log-likelihood function = −2374.412 | ||||
| Variable | Estimate | Odds Ratio | Std. Err | t-Stat |
|---|---|---|---|---|
| Constant | −1.534 *** | 0.216 | 0.354 | −4.328 |
| Ramp (1 if ramp segment; 0 otherwise) | −0.366 *** | 0.693 | 0.089 | −4.130 |
| Tollgate (1 if tollgate; 0 otherwise) | −0.740 *** | 0.477 | 0.097 | −7.662 |
| Negligence (1 if driver is negligent; 0 otherwise) | 0.149 *** | 1.161 | 0.062 | 2.399 |
| Flat tire (1 if bus tire is flat; 0 otherwise) | 0.292 *** | 1.339 | 0.093 | 3.140 |
| Obstacle (1 if obstacle on the freeway; 0 otherwise) | −0.884 *** | 0.413 | 0.126 | −6.987 |
| Drowsiness (1 if driver is drowsy; 0 otherwise) | 0.213 *** | 1.237 | 0.088 | 2.421 |
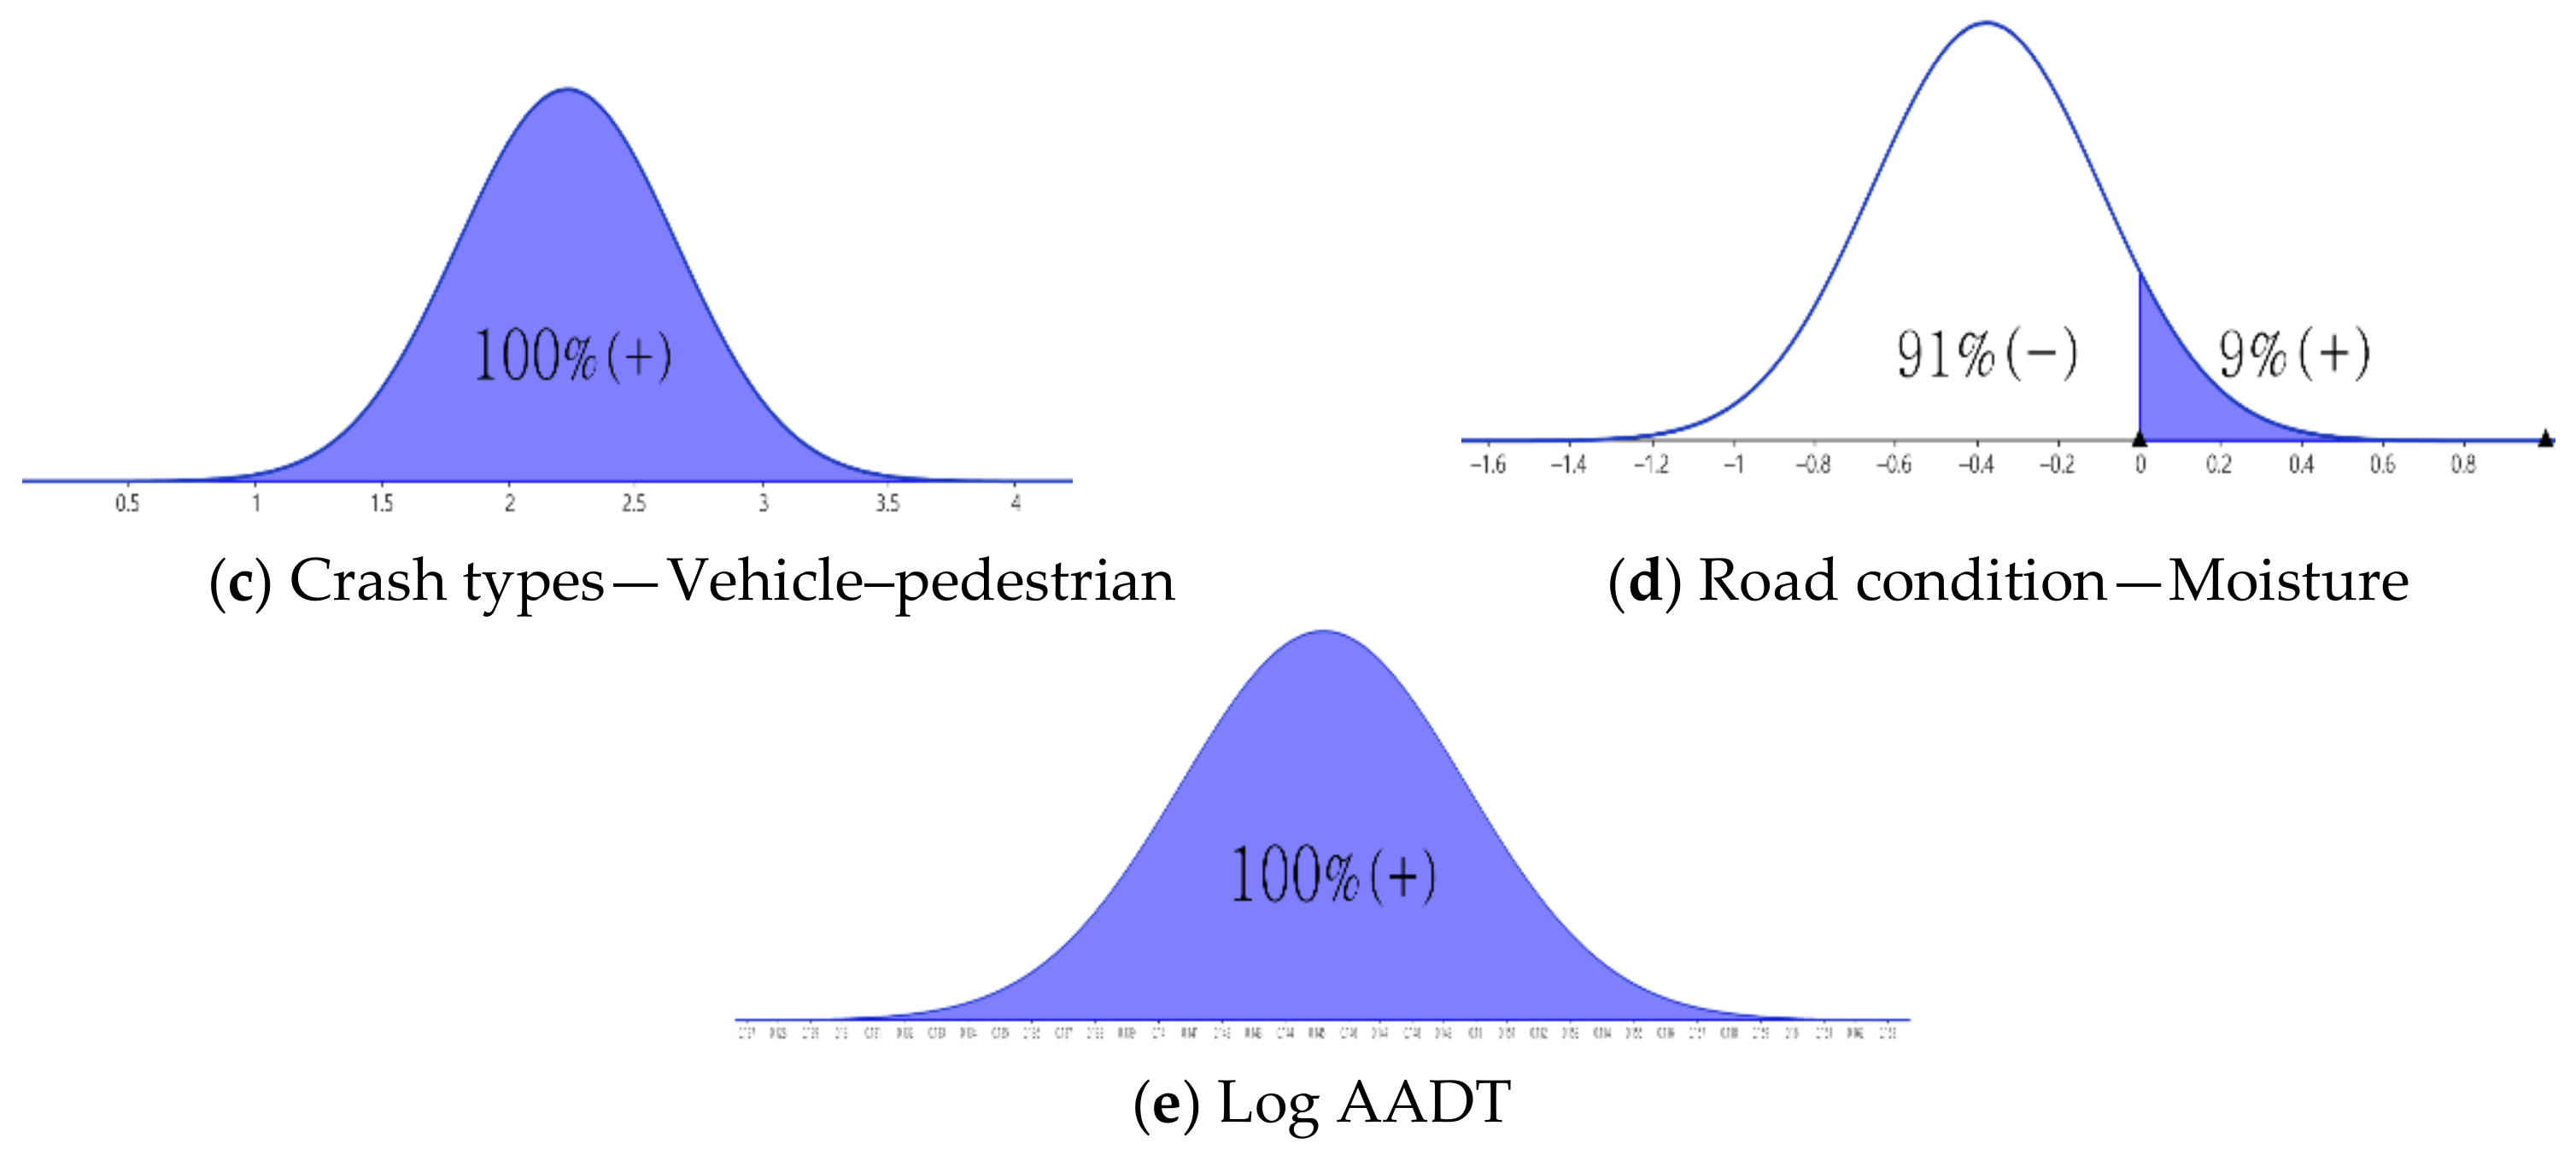
| Standard deviation of parameter | 0.307 *** | 1.360 | 0.074 | 4.150 |
| Small (1 if bus size is small; 0 otherwise) | −0.322 *** | 0.725 | 0.063 | −5.131 |
| Medium (1 if bus size is medium; 0 otherwise) | −0.290 *** | 0.748 | 0.070 | −4.156 |
| Standard deviation of parameter | 0.326 *** | 1.386 | 0.048 | 6.825 |
| Vehicle–vehicle (1 if a vehicle to vehicle crash; 0 otherwise) | 0.762 *** | 2.143 | 0.062 | 12.288 |
| Vehicle–pedestrian (1 if a vehicle to pedestrian crash; 0 otherwise) | 2.231 *** | 9.307 | 0.219 | 10.175 |
| Standard deviation of parameter | 0.432 ** | 1.540 | 0.212 | 2.035 |
| normal (1 if the driver’s condition is normal; 0 otherwise) | −0.359 *** | 0.698 | 0.087 | −4.137 |
| Rainy (1 if it rains; 0 otherwise) | 0.243 ** | 1.275 | 0.110 | 2.206 |
| Guardrail fence (1 if guardrail fence exists; 0 otherwise) | −0.652 * | 0.521 | 0.384 | −1.698 |
| 30s (1 if driver’s age ≥ 30 and <40; 0 otherwise) | −0.178 *** | 0.837 | 0.061 | −2.938 |
| Rate of Truck volume (truck volume/total volume at the crash point) | 3.008 ** | 20.252 | 1.414 | 2.128 |
| Summer (1 if the season is summer; 0 otherwise) | −0.166 *** | 0.847 | 0.057 | −2.943 |
| Moisture (1 if moisture on the pavement; 0 otherwise) | −0.377 *** | 0.686 | 0.100 | −3.784 |
| Standard deviation of parameter | 0.281 *** | 1.324 | 0.050 | 5.596 |
| Log AADT (Logarithm of AADT) | 0.141 *** | 1.152 | 0.032 | 4.479 |
| Standard deviation of parameter | 0.012 *** | 1.012 | 0.002 | 5.400 |
| Log-likelihood function = −2000.367 | ||||
| Number of observations = 3064 | ||||
| Restricted Log-likelihood function = −2374.412 | ||||
| Variable | Fatal and Severe Injury | Minor Injury | Property Damage Only |
|---|---|---|---|
| Ramp | −0.013 | −0.103 | 0.116 |
| Tollgate | −0.020 | −0.188 | 0.208 |
| Negligence | 0.007 | 0.045 | −0.052 |
| Flat tire | 0.018 | 0.089 | −0.107 |
| Obstacle | −0.021 | −0.214 | 0.235 |
| Drowsiness | 0.012 | 0.065 | −0.077 |
| Vehicle size—Small | −0.015 | −0.096 | 0.111 |
| Vehicle size—Medium | −0.012 | −0.085 | 0.096 |
| Vehicle–vehicle | 0.055 | 0.226 | −0.281 |
| Vehicle–pedestrian | 0.533 | 0.132 | −0.665 |
| Driver’s condition—normal | −0.023 | −0.110 | 0.133 |
| Rainy | 0.013 | 0.074 | −0.087 |
| Guardrail fence | −0.016 | −0.163 | 0.179 |
| Driver’s age—30s | −0.008 | −0.053 | 0.060 |
| Rate of Truck | 0.139 | 0.901 | −1.040 |
| Summer | −0.007 | −0.049 | 0.056 |
| Pavement-Moisture | −0.015 | −0.109 | 0.124 |
| Log AADT | 0.007 | 0.042 | −0.049 |
Disclaimer/Publisher’s Note: The statements, opinions and data contained in all publications are solely those of the individual author(s) and contributor(s) and not of MDPI and/or the editor(s). MDPI and/or the editor(s) disclaim responsibility for any injury to people or property resulting from any ideas, methods, instructions or products referred to in the content. |
© 2023 by the authors. Licensee MDPI, Basel, Switzerland. This article is an open access article distributed under the terms and conditions of the Creative Commons Attribution (CC BY) license (https://creativecommons.org/licenses/by/4.0/).
Share and Cite
Kim, K.; Hong, J. Severity Predictions for Intercity Bus Crashes on Highway Using a Random Parameter Ordered Probit Model. Sustainability 2023, 15, 13131. https://doi.org/10.3390/su151713131
Kim K, Hong J. Severity Predictions for Intercity Bus Crashes on Highway Using a Random Parameter Ordered Probit Model. Sustainability. 2023; 15(17):13131. https://doi.org/10.3390/su151713131
Chicago/Turabian StyleKim, Kanghyun, and Jungyeol Hong. 2023. "Severity Predictions for Intercity Bus Crashes on Highway Using a Random Parameter Ordered Probit Model" Sustainability 15, no. 17: 13131. https://doi.org/10.3390/su151713131
APA StyleKim, K., & Hong, J. (2023). Severity Predictions for Intercity Bus Crashes on Highway Using a Random Parameter Ordered Probit Model. Sustainability, 15(17), 13131. https://doi.org/10.3390/su151713131