Article

Supply and Demand Changes, Pig Epidemic Shocks, and Pork Price Fluctuations: An Empirical Study Based on an SVAR Model

1
Department of Management Science and Engineering, Guangxi University of Finance and Economics, Nanning 530007, China
2
Department of Logistics and Infrastructures, Guangxi University, Nanning 530004, China
*
Author to whom correspondence should be addressed.
Sustainability 2023, 15(17), 13130; https://doi.org/10.3390/su151713130
Submission received: 6 July 2023 / Revised: 22 August 2023 / Accepted: 29 August 2023 / Published: 31 August 2023
(This article belongs to the Section Sustainable Agriculture)

Abstract

:
The price of pork, as an important livelihood indicator in China, and its price fluctuations have a significant impact on the lives of residents and social stability. Therefore, it is vital to study the main factors that affect pork price fluctuations and implement targeted regulatory measures in a timely manner. In the context of the increasing number of pig epidemics and increased pork imports, it is necessary to consider the impact of pig epidemics and imported pork on pork price fluctuations, which can more accurately reflect actual pork price fluctuations in China. In this paper, a structural vector autoregressive (SVAR) model was applied to analyze the main factors affecting pork price fluctuations from the aspects of the pork price, supply and demand changes, and pig epidemic shocks. The results indicated that the impact of the pork price on pork price fluctuations was the largest, with the largest contribution rate, whereas the current month’s pork price had a 29.60% impact on the pork price 18 months later. The supply factor that affected the pork price was the pig herd, with the current month’s pig herd having a 34.85% impact on the pork price after 18 months. Imported pork had a relatively small structural impact on pork price fluctuations, with a positive impact in the first four months and a subsequent negative impact. However, pig epidemics mainly caused pork price fluctuations by changing the market relation between demand and supply, with the current month’s epidemic depth index having a 9.78% impact on the pork price 18 months later. Based on the results of this study, it is recommended to focus on the monitoring and early warning of the pork price by analyzing big data, promoting large-scale farming, and strengthening the implementation of early prevention and control measures during disease outbreaks to stabilize pig herd and achieve a stable pork market supply and price.

1. Introduction

China is a major producer and consumer of pork. Its pork production increased from 49.3285 million tons in 2009 to 55.4143 million tons in 2022, with its pig herd accounting for approximately 50% of the world’s total [1]. Its pork consumption has also consistently accounted for around 60% of the national total meat consumption, with live pig consumption increasing from 48.3 million tons in 2009 to 57.434 million tons in 2022 [2]. Looking back on the pig farming development process of China in the past decade, pig herd and sow herds remained stable from 2009 to 2012 but gradually decreased after 2013 due to the impact of environmental protection regulations and the acute diarrhea epidemic in pigs, reaching the lowest point in 2019 due to the impact of African swine fever. Since 2020, they have shown an upward trend and stabilized at normal multi-year levels. As a result of this process, the structure of pig farming in China has gradually changed. For instance, the proportion of farms (farmers) with 1–49 slaughter pigs per year has decreased from 99.32% in 2009 to 93.50% in 2021, while the number of farms (farmers) with more than 50,000 slaughter pigs per year increased from 0 to 849. Especially since the outbreak of African swine fever in 2019, the high pig price has attracted large funds, promoting the rapid development of China’s pig farming industry, forming an initial pattern where large-scale farms are developed, and small-scale family farms are gradually eliminated.
The pork price is closely related to people’s livelihoods. Frequent pork price fluctuations affect not only the daily consumption of individuals but also the healthy and sustainable development of the pork industry, even posing a threat to social stability. Therefore, pork price fluctuations have been the focus of governments, academia, and consumers [3,4]. For instance, in government document No.1 released in 2022, the Chinese government proposed long-term support policies to stabilize pig production, maintain a stable production capacity, and prevent excessive fluctuations. According to research findings, pork price fluctuations in China have experienced three distinct pig cycles since 2006, specifically from June 2006 to May 2009, April 2010 to April 2014, and March 2015 to May 2018 [5,6].
Research on the influencing factors that cause pork price fluctuations has been implemented from different perspectives. Firstly, from the perspective of supply and demand changes, research conducted in different provinces and countries has found that pork price fluctuations are primarily influenced by the supply and demand relationship in the pork industry. Fluctuations in feed prices, which are an upstream component of the pork industry chain, are the main factors driving pork price fluctuations. Additionally, the pork price exhibits seasonal characteristics [7,8,9,10]. Zhang et al. [11] and Hayes et al. [12] further suggested that seasonal price changes in pork may result from variations in pork supply, changes in consumer demand for pork products, and a combination of supply and demand factors. Secondly, scholars have focused on the impact of external shock factors on the pork price. Studies have found that pig epidemics diseases (e.g., blue-ear disease, acute diarrhea epidemic, swine foot-and-mouth disease, and African swine fever) [13,14,15,16], government policies [17,18], inflation [19], the consumer price index (CPI) [20], and network attention [21,22] can also have positive or negative impacts on the pork price. To sum up, due to the different research perspectives, selected factors, and sample sizes, there is still a lack of consistent conclusions regarding the impact of these shocks. Meanwhile, research has shown that consumers’ preferences for meat have undergone some changes [23]. In addition to the traditional chicken as a substitute for pork, such as the use of soybeans to make a new generation of plant-based foods and artificial meat are becoming emerging substitutes for pork [24]. Although many research efforts to explore the factors influencing pork price fluctuations. However, in terms of influencing factors, factors such as the supply of imported pork, plant-based alternatives, and the epidemic depth index, which represents the situation and mortality rate of diseases, have not been adequately considered. In terms of methodology, non-structural vector autoregression (VAR) models have been employed, which typically cannot capture the contemporaneous relationships between variables hidden in the error term correlation structure [25]. Based on the theory of supply and demand, taking into account both internal and external shocks, especially the introduction of the supply of imported pork plant-based alternatives, and the epidemic depth index, a structural vector autoregression (SVAR) model was used to analyze the main factors affecting the pork price fluctuations, to provide a more comprehensive analysis of the pork price fluctuations in China.
This paper is organized as follows. Section 2 describes the data sources and methodology used in this study. Section 3 provides a model-based empirical analysis to explore how the influencing factors affect pork price fluctuations. The last section summarizes the main findings of this study and provides a discussion of the policy implications of our findings.

2. Materials and Methods

2.1. Data Sources

1.
Data Sources: In total, 156 sample data from January 2009 to December 2021 were selected to investigate the influencing factors of pork price fluctuations in China. The data for the pork price, corn price, and chicken price were sourced from the China Agricultural Products Price Survey Yearbook. The data for the pig herd and sow herd were sourced from the China Statistical Yearbook. The data for urban residents’ per capita disposable income, rural residents’ per capita disposable income, soybean price (SP), and imported pork were sourced from the National Bureau of Statistics. The data for the epidemic intensity index is sourced from the Burick Agricultural Database.
2.
Variable Selection: The pork price (POP) was selected to represent the changes in the pork price. Factors related to supply, demand, and epidemic situations were chosen to investigate the main factors influencing pork price fluctuations.
Supply Factors: According to supply theory, supply is determined by production costs, which are mainly influenced by input goods prices. When the input goods prices increase, the production costs also increase, leading to a reduction in production supply. Feed costs are one of the major input costs in pig farming, and corn accounts for a significant proportion of feed costs (up to 66%). Therefore, the corn price (CP) was selected as an indicator of production costs [26]. Additionally, domestic supply (pig herd/PH, sow herd/SH) and the supply of imported pork (imported pork/IP) were also selected as supply factors.
Demand Factors: According to demand theory, consumer income and the availability of substitutes can both influence the quantity demanded, thus affecting production prices. Referring to previous research [6,27], the monthly averages of urban residents’ per capita disposable income (URPCDI) and rural residents’ per capita disposable income (RRPCDI) were selected as indicators of demand. Chicken [26] and soybean [24] are considered the best meat and plant-based substitutes for pork, respectively. Therefore, the chicken price (CHP) and soybean price (SP) were taken as the price of the substitute.
Pig Epidemic Impact: The outbreak of an epidemic can lead to a decrease in the supply of live pigs and force some farmers to exit the industry [28]. Therefore, changes in the supply–demand relationship caused by pig epidemics will also have an impact on pork prices. The epidemic width index and epidemic depth index are both used as indicators to describe the situation of pig epidemics, providing comprehensive quantitative results of the outbreak range, severity, and transmission speed of pig epidemic diseases such as blue-ear disease, swine fever, acute diarrhea, and high fever. Usually, indices less than 0.2 indicate a normal level, and indices greater than 0.25 indicate a severe epidemic [28,29]. Essentially, the epidemic width index mainly focuses on the outbreak of epidemics, while the epidemic depth index reflects the severity of pig diseases and includes factors such as the seriousness of the epidemic and the rate of transmission [29]. Pig epidemics can result in a large number of deaths among pigs or sows, which is an important factor affecting the pork supply. Therefore, the epidemic depth index (EDI) was selected as the main influencing factor.
3.
Data processing: Pork price (POP) was selected as the dependent variable, while the corn price (CP), pig herd (PH), sow herd (SH), imported pork (IP), chicken price (CHP), monthly average of urban residents per capita disposable income (URPCDI), monthly average of rural residents’ per capita disposable income (RRPCDI), and epidemic depth index (EDI) were chosen as the independent variables. To ensure the accuracy and objectivity of the model results, seasonal adjustments were made to the prices of major livestock products, and then the POP, CP, CHP, URPCDI, and RRPCDI were deflated using the price deflator index, which was calculated based on the national consumer price index (CPI) of January 2009. Then, the deflated data were processed using a logarithm to reduce heteroscedasticity between the variables [29].

2.2. Methods

The structural vector autoregressive (SVAR) model is an extension of the VAR model that incorporates structural equations. In an SVAR model, the relationships between variables are expressed as a system of linear equations for a better understanding of the dynamic change relationships between variables. By imposing constraints on the parameter space of an SVAR model, the number of estimated parameters can be reduced, enhancing the interpretability of the model and providing a better reflection of the actual situation [30]. Therefore, compared to the VAR model, the SVAR model was considered more accurate and reliable in capturing the relationships and dynamics among variables.
The general form of a pth order SVAR (p) model with k variables can be expressed as:
y t = r 1 y t 1 + r 2 y t 2 + r p y t p + u t ( t = 1,2 , , T )
where yt is the k-by-1 time series of the endogenous variables for the vector, p is the lag order, T is the sample size, r1, r2, …, rp represents the k-by-k matrix coefficients, and ut stands for the k-by-1 vector containing white noise [31,32].
The AB SVAR model is applied, where the A and B matrices are both k × k invertible matrices, i.e., Aεt = But (where εt represents the reduced-form shocks and ut represents the structural shocks). Certain constraints need to be imposed on the parameter space to ensure the identification of the SVAR model. The expression for short-term restrictions is as follows [28].
1 0 0 0 0 0 0 0 0 0 a 21 1 0 0 0 0 0 0 0 0 a 31 a 32 1 0 0 0 0 0 0 0 a 41 a 42 a 43 1 0 0 0 0 0 0 a 51 a 52 a 53 a 54 1 0 0 0 0 0 a 61 a 62 a 63 a 64 a 65 1 0 0 0 0 a 71 a 72 a 73 a 74 a 75 a 76 1 0 0 0 a 81 a 82 a 83 a 84 a 85 a 86 a 87 1 0 0 a 91 a 92 a 93 a 94 a 95 a 96 a 97 a 98 1 0 a 101 a 102 a 103 a 104 a 105 a 106 a 107 a 108 a 109 1 ε t l n P O P ε t l n C P ε t l n P H ε t l n S H ε t l n I P ε t l n C H P ε t l n s p ε t l n U R P C D I ε t l n R R P C D I ε t l n E D I = b 11 0 0 0 0 0 0 0 0 0 0 b 22 0 0 0 0 0 0 0 0 0 0 b 33 0 0 0 0 0 0 0 0 0 0 b 44 0 0 0 0 0 0 0 0 0 0 b 55 0 0 0 0 0 0 0 0 0 0 b 66 0 0 0 0 0 0 0 0 0 0 b 77 0 0 0 0 0 0 0 0 0 0 b 88 0 0 0 0 0 0 0 0 0 0 b 99 0 0 0 0 0 0 0 0 0 0 b 1010 u t l n P O P u t l n C P u t l n P H u t l n S H u t l n I P u t l n C H P u t l n S P u t l n U R P C D I u t l n R R P C D I u t l n E D I
The analysis process is as follows [25,33].
(1)
Stationarity test: To avoid the issue of spurious regression in regression analysis, it is necessary to perform a stationarity test. Therefore, the Augmented Dickey-Fuller (ADF) test is employed. The test statistic is compared with the critical value at a 5% significance level. If the test statistic is smaller than the critical value, the null hypothesis can be rejected, indicating that the series is stationary at the significance level. If the opposite pattern is found, it suggests that the series is non-stationary, and differencing is required to achieve stationarity for the non-stationary series.
(2)
Cointegration test: The Johansen cointegration test is employed to determine whether long-term equilibrium relationships exist in the variables and to obtain the number and vector of cointegration relationships.
(3)
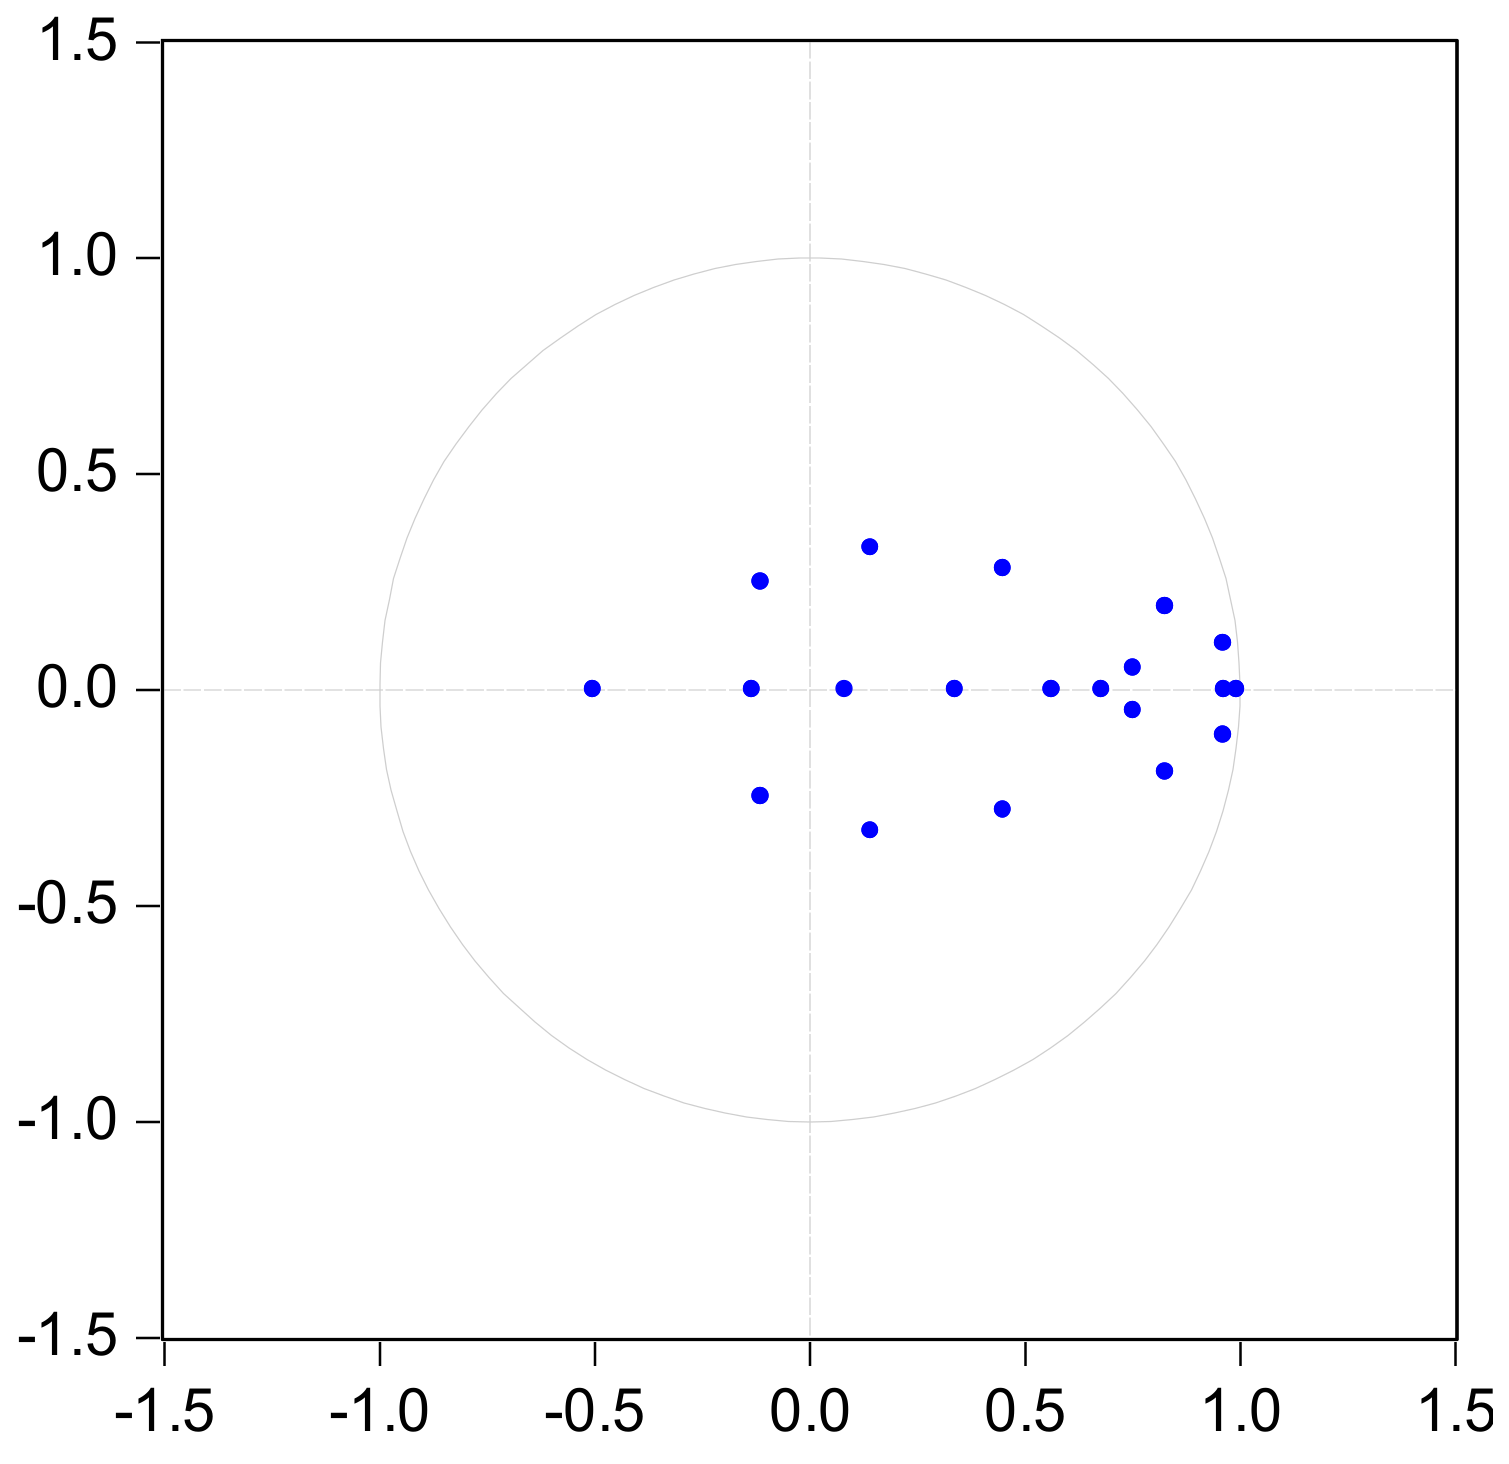
Determination of lag order and stability test: The optimal lag order of the model is determined using information criteria such as the Akaike information criterion (AIC), Schwarz criterion (SC), Hannan–Quinn criterion (HQ), etc. Then, the parameters of the model are estimated using the Full information maximum likelihood (FIML) method and a characteristic root decomposition is performed to determine whether the roots are within the unit circle. If all roots are within the unit circle, the model is considered stable. Otherwise, adjustments or modifications may be necessary to ensure model stability.
(4)
Impulse response function: The impulse response function is used to analyze the interaction effect and dynamic change trends among variables.
(5)
Variance decomposition analysis: The contribution degree of different external shocks to each variable in the model is analyzed to measure the importance of different external shocks.

3. Empirical Analysis

3.1. Stationarity Test

Non-stationary time series may lead to spurious regression, which can affect the effectiveness of the model [6]. Therefore, the ADF test was conducted using Eviews 10.0 to test the stationarity of the time series. The results are presented in Table 1.
According to Table 1, the ADF statistics of the pork price, corn price, pig herd, sow herd, supply of imported pork, chicken price, soybean price, urban residents’ per capita disposable income, rural residents per capita disposable income, and epidemic depth index were all greater than the critical value at a significance level of 5%. Therefore, the null hypothesis could not be rejected, indicating that these variables were non-stationary. To solve the non-stationary time series, a first-order differential was applied to eliminate the trend. The results after applying the first-order differential are presented in Table 2. All the ADF statistics for the first-order differential variables were below the critical value at a significance level of 1%, indicating that the series was stationary. It was suggested that the original time series had a unit root, and all variables had the same order sequence. Therefore, the cointegration relationship among the variables was analyzed in the next step.

3.2. Cointegration Test

The Johansen cointegration test was conducted to analyze the long-term equilibrium relationships among the variables. The results are shown in Table 3. It can be observed that the model rejected the null hypothesis of having a maximum of 7 cointegration equations at a significance level of 5%, which indicates that there were at least 7 or more cointegration relationships among the 10 variables, suggesting the existence of long-term stable equilibrium relationships among the variables. As such, the construction of the SVAR model proceeds in the next step.

3.3. Determination of Lag Order and Parameter Estimation

The choice of lag order in the SVAR model is particularly important for obtaining accurate results. Five criteria, namely the LR statistic, Fnal prediction error (FPE), Akaike information criterion (AIC), Schwarz criterion (SC), and Hannan–Quinn criterion (HQ), were used to comprehensively evaluate the lag order of the model. The results are shown in Table 4. It is observed that the optimal lag order of the SVAR model is 2.
When the SVAR model meets an identifiable condition, the FIML method is used to estimate the parameters of the model. The parameter estimation results of the AB SVAR model are as follows.
A = 1 0 0 0 0 0 0 0 0 0 0.0333 1 0 0 0 0 0 0 0 0 0.0071 0.0951 1 0 0 0 0 0 0 0 0.0667 0.0048 0.0969 1 0 0 0 0 0 0 0.0169 0.9585 1.1723 0.8487 1 0 0 0 0 0 0.1444 0.0336 0.0121 0.0187 0.0059 1 0 0 0 0 0.0098 0.1746 0.0213 0.0478 0.0045 0.0099 1 0 0 0 0.0656 0.2534 0.6940 0.0649 0.0015 0.3433 0.4642 1 0 0 0.0009 0.0018 0.0042 0.0111 0.0019 0.0007 0.0413 1.2141 1 0 0.4649 0.8605 1.0754 1.0803 0.0921 0.6807 5.5838 0.4959 0.3079 1
B = 0.0511 0 0 0 0 0 0 0 0 0 0 0.0164 0 0 0 0 0 0 0 0 0 0 0.0152 0 0 0 0 0 0 0 0 0 0 0.0175 0 0 0 0 0 0 0 0 0 0 0.1755 0 0 0 0 0 0 0 0 0 0 0.0158 0 0 0 0 0 0 0 0 0 0 0.0087 0 0 0 0 0 0 0 0 0 0 0.0178 0 0 0 0 0 0 0 0 0 0 0.0032 0 0 0 0 0 0 0 0 0 0 0.1843

3.4. Stability Test

The eigenvalue test was used to perform stability tests on the SVAR model. The results are shown in Figure 1. It is observed that the reciprocal eigenvalues of all variables were the unit circles with a radius of 1, which indicates that the system composed of all variables was stable. That is, the constructed SVAR model was stable and effective and could be subsequently used for the impulse response function and variance decomposition analyses.

3.5. Impulse Response Function Analysis

The estimation results of the model can only reflect a local dynamic relationship and may not capture comprehensive and complex dynamic relationships. Therefore, it is necessary to conduct a comprehensive analysis using impulse response functions [34]. Impulse response functions describe the effects of a standard deviation shock on the current and future values of endogenous variables, as well as the path of these effects. They vividly depict the dynamic impact effects among the endogenous variables. The model is focused on the interaction between the pork price and supply and demand dynamics and the pig epidemic impact. Thus, the analysis in this section mainly focuses on the impulse response function graphs of variables related to the above. The results are shown in Figure 2, Figure 3, Figure 4 and Figure 5.

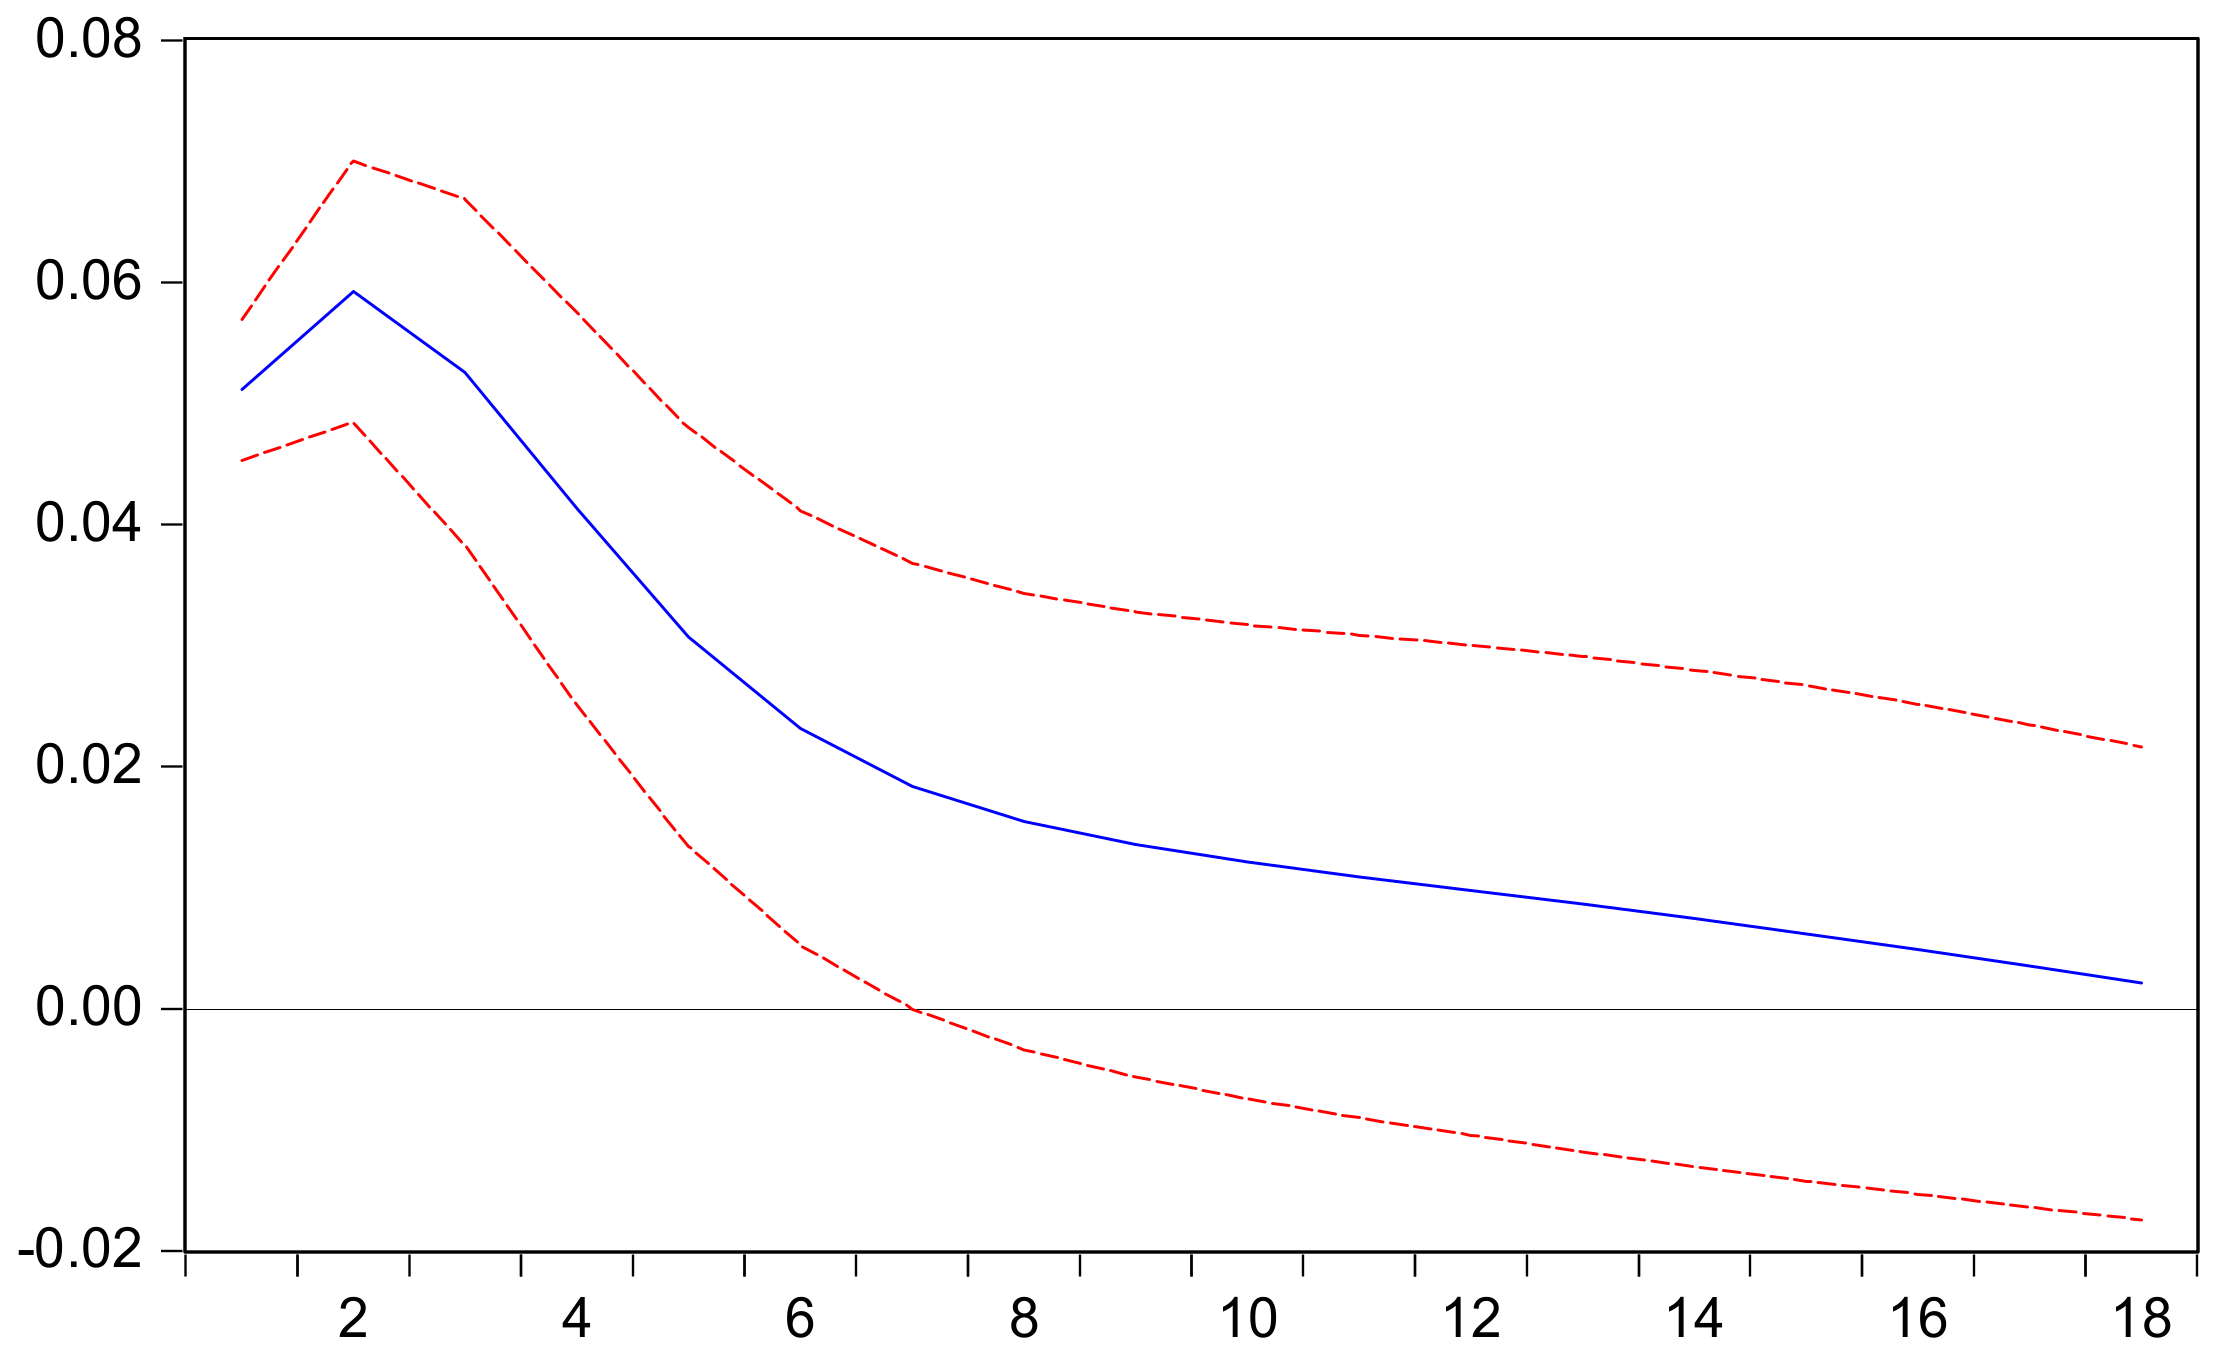
3.5.1. Dynamic Response Relationship between Pork Price and Pork Price Fluctuation

As shown in Figure 2, when a positive shock was applied to pork price, it had an immediate significant impact in the 1st month, reaching a maximum value of 0.059 in the 2nd month and then gradually diminishing until it approached 0 in the 18th month. This indicates that pork price had a significant positive impact on itself, which is consistent with the original hypothesis of this study, as well as the research results of Zheng et al. and Noda et al. [6,35]. When the pork price increases, it attracts more capital investment into the pig farming industry, and farmers increase their herd sizes to increase the inventory of their pig herd. At the same time, high market prices will also encourage farmers with an existing inventory to accelerate the market supply, leading to a significant pork price fluctuation. Currently, China’s pig farming industry is undergoing a transition towards large-scale farming, and the production decisions of farmers generally follow the cobweb theory, which is characterized by high profits—increased inventory and low profits—low inventory.

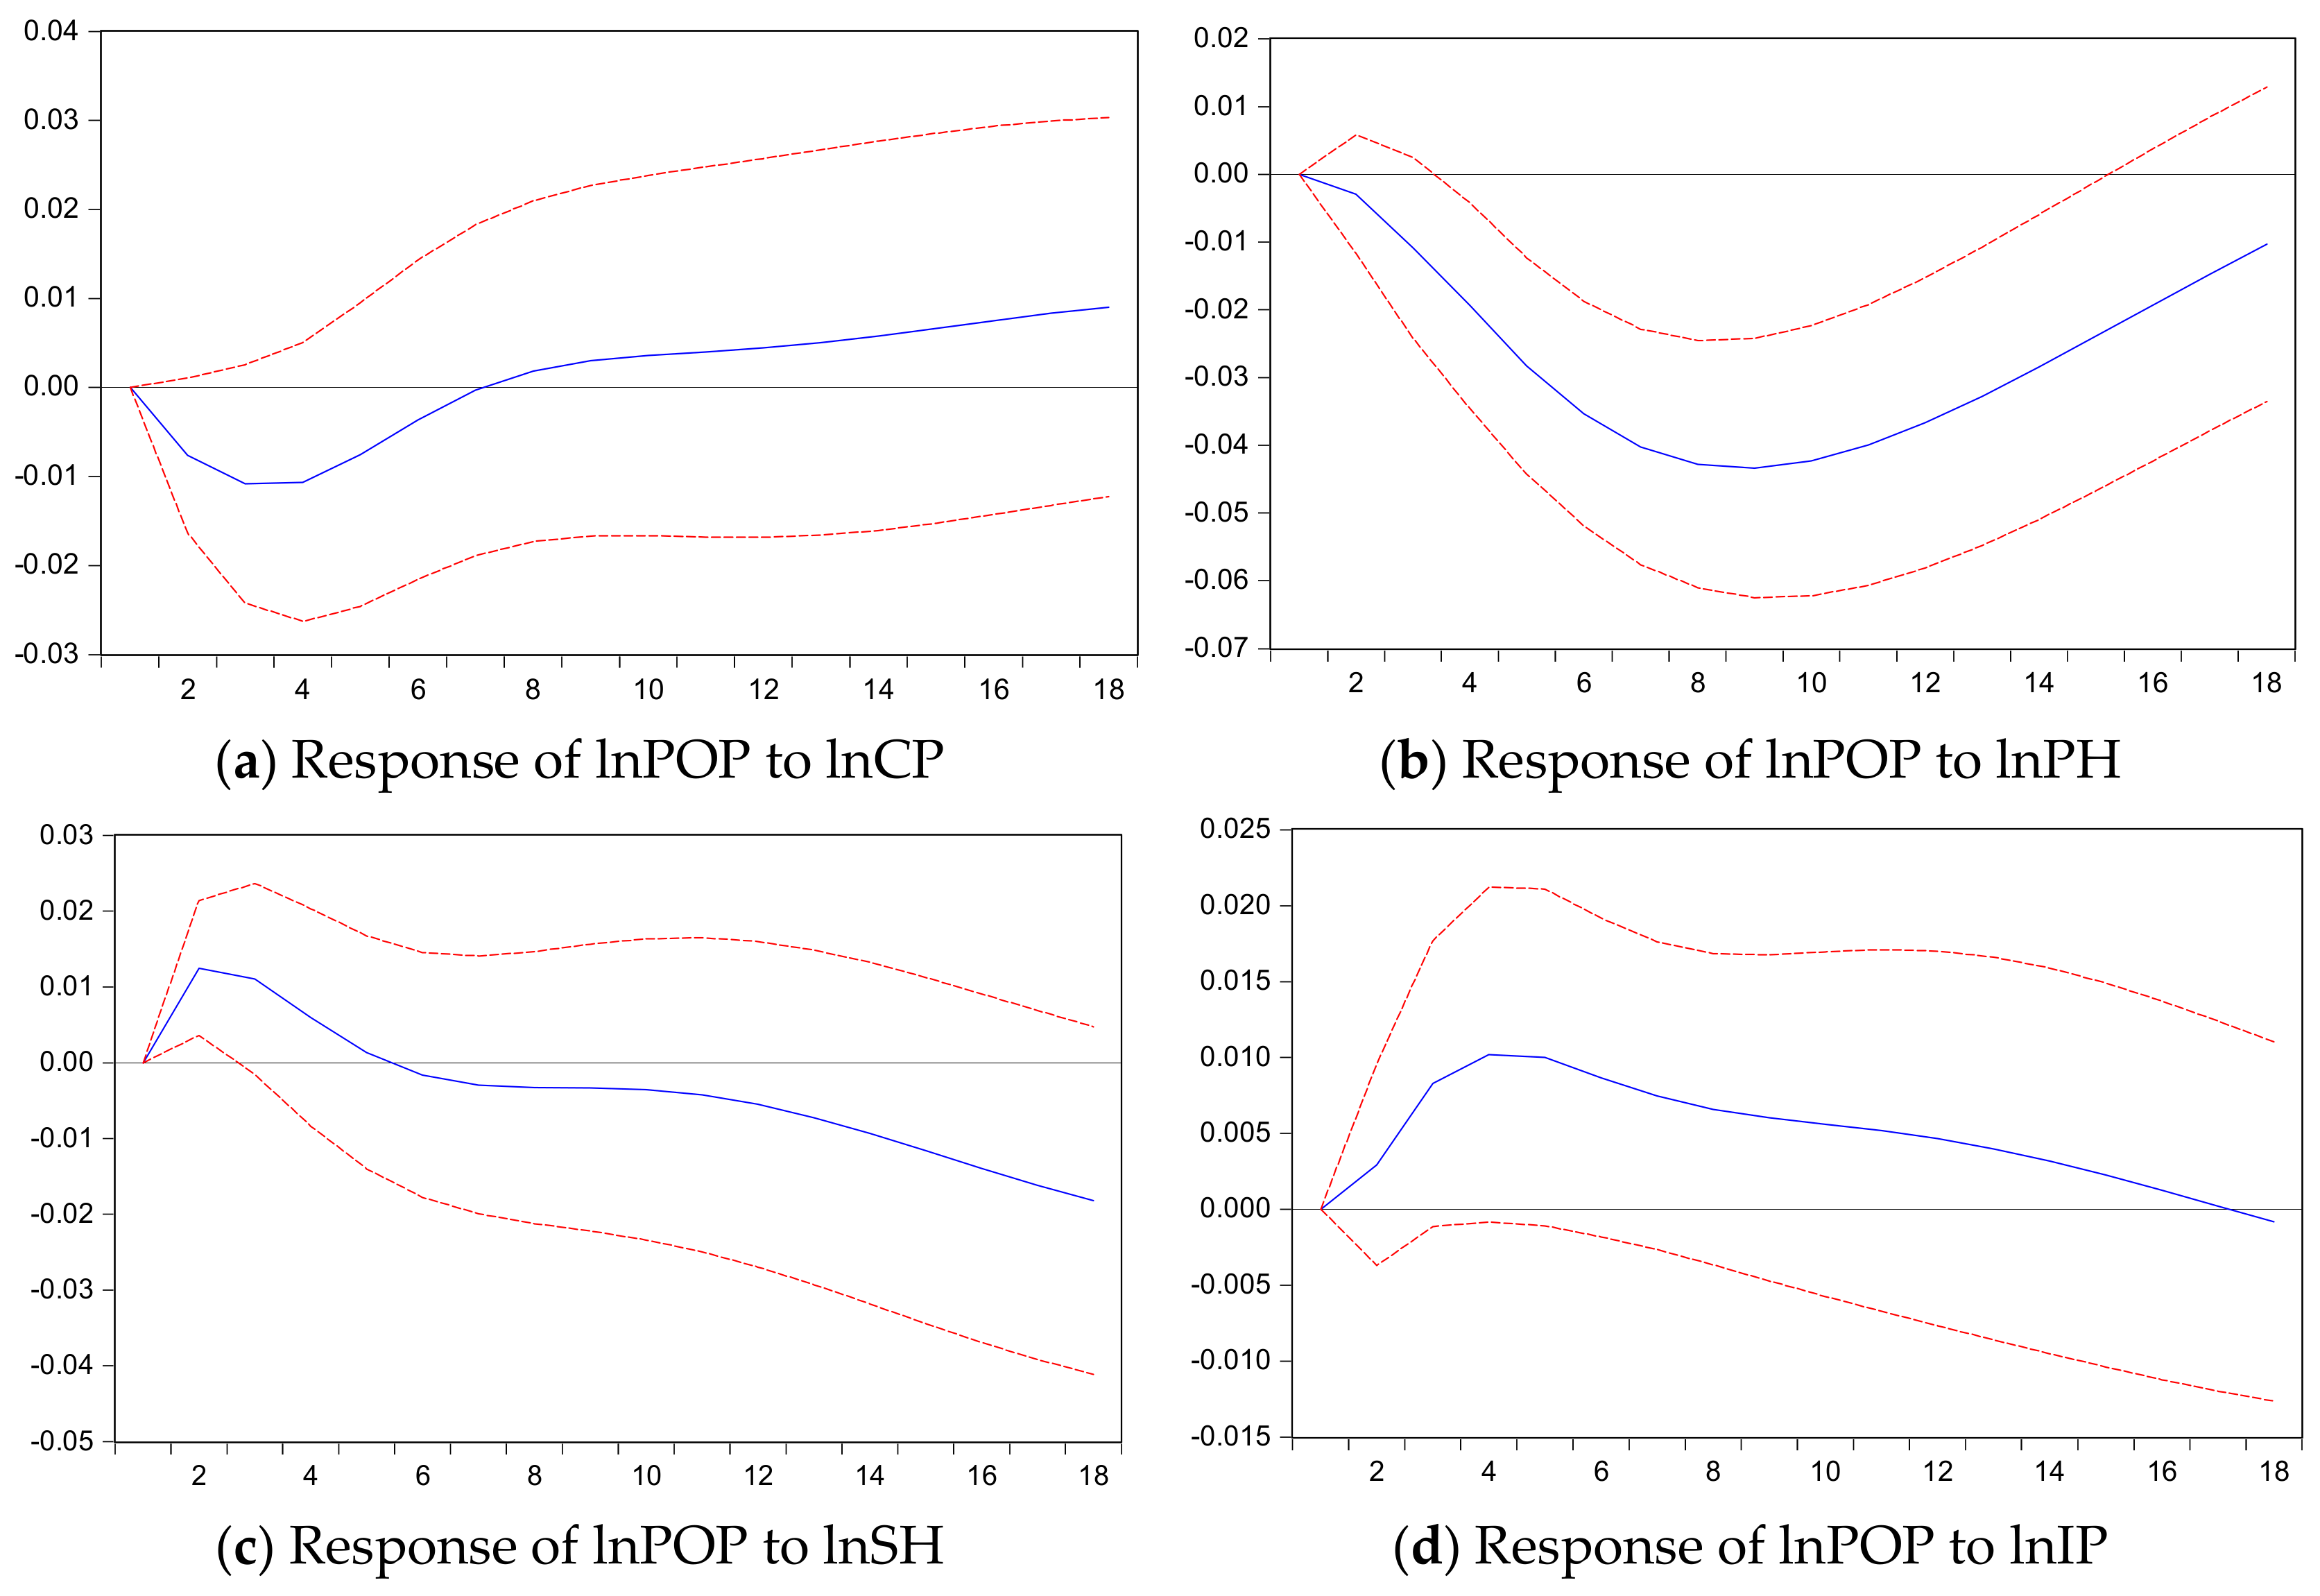
3.5.2. Dynamic Response Relationship between Supply and Pork Price Fluctuation

As shown in Figure 3a, when there was a positive shock to the corn price, it initially had a short-term negative effect on the pork price. However, it showed a positive effect from the 7th month and gradually increased to 0.004 in the 10th month, creating a persistent and stable impact. It is observed that when the corn price increases, the cost of pig farming also increases. In the short term, farmers may choose to sell their pigs earlier to minimize losses, leading to an increase in pork supply and a subsequent decrease in pork price. In the early stage of a corn price increase, the lag effect of the corn price on the pork price will lead to an increase in pig breeding costs in the short term. In order to reduce losses, farmers may choose to sell out in advance, leading to an increase in supply and a decrease in the pork price. In the long run, the corn price has a positive impact on the pork price. That is, when the corn price increases, the pork price also increases. Studies such as Deng et al. have shown that for every 1% increase in the corn price, the pork price increases by 0.82% [36]. This indicates that the corn price has a significant impact on fluctuations in the pork price and a longer impact time frame.
The impulse response of the pig herd to the pork price is shown in Figure 3b. It can be observed that the pig herd had a long-term negative effect on the pork price. The largest impact occurred in the 9th month, with a magnitude of −0.043. Based on supply and demand theory, when the price of pork increases, farmers increase their pig stock in order to obtain higher profits. However, the increase in pork supply leads to an oversupply situation, causing prices to decline. Conversely, when the pork price falls, farmers reduce their pig herd to avoid losses, resulting in a decrease in pork supply and a subsequent increase in price. Supply has a negative impact on the price. In the supply of pigs, due to the long and fixed growth cycle of pigs, the amount of increase in the number of slaughter pigs is limited and cannot be rapidly improved, while the amount of increase in the pig herd is not limited by the growth cycle of live pigs and can be rapidly improved. Therefore, the pork price is mainly affected by the pig herd in the long run. The results on the impact of the pig herd on the pork price echo the findings of Yan et al. [37].
When there was a positive shock to the sow herd, there was a structural fluctuation effect on the pork price, transitioning from positive to negative (Figure 3c). This indicates that a decrease in the sow herd does not immediately lead to fluctuations in the pork price. However, a negative impact was observed from the 6th month. This finding is consistent with the production cycle of pigs, where the gestation period of sows up to the production of piglets is typically around 114 days, and the time from birth to market takes approximately 6 months [6,38]. This lag of around 6–10 months between the pregnancy of sows and the market availability of pork plays an important moderating role in pork price fluctuations [33]. It is commonly believed that a decrease in the sow herd is a leading indicator of rising pork prices. Specifically, an increase in the sow herd in a given month would lead to a decrease in the pork price 10 months later, while a decrease in the sow herd in a given month would result in an increase in the pork price 10 months later.
When there was a positive shock to imported pork, there was initially a positive impact on the pork price from the 1st to the 4th month, reaching a peak value of 0.010 in the 4th month, but then a negative impact was consistently generated (Figure 3d). This indicates that the supply of imported pork is constrained by market mechanisms and does not immediately lead to a decrease in the pork price. However, starting from the 4th month, with the increase in imported pork, there was a sustained negative impact on the pork price, accelerating the decline in the pork price. This suggests that imported pork has a negative effect on the pork price, but its dependency should not be too high, ensuring a relatively high level of pork self-sufficiency and maintaining stable prices.

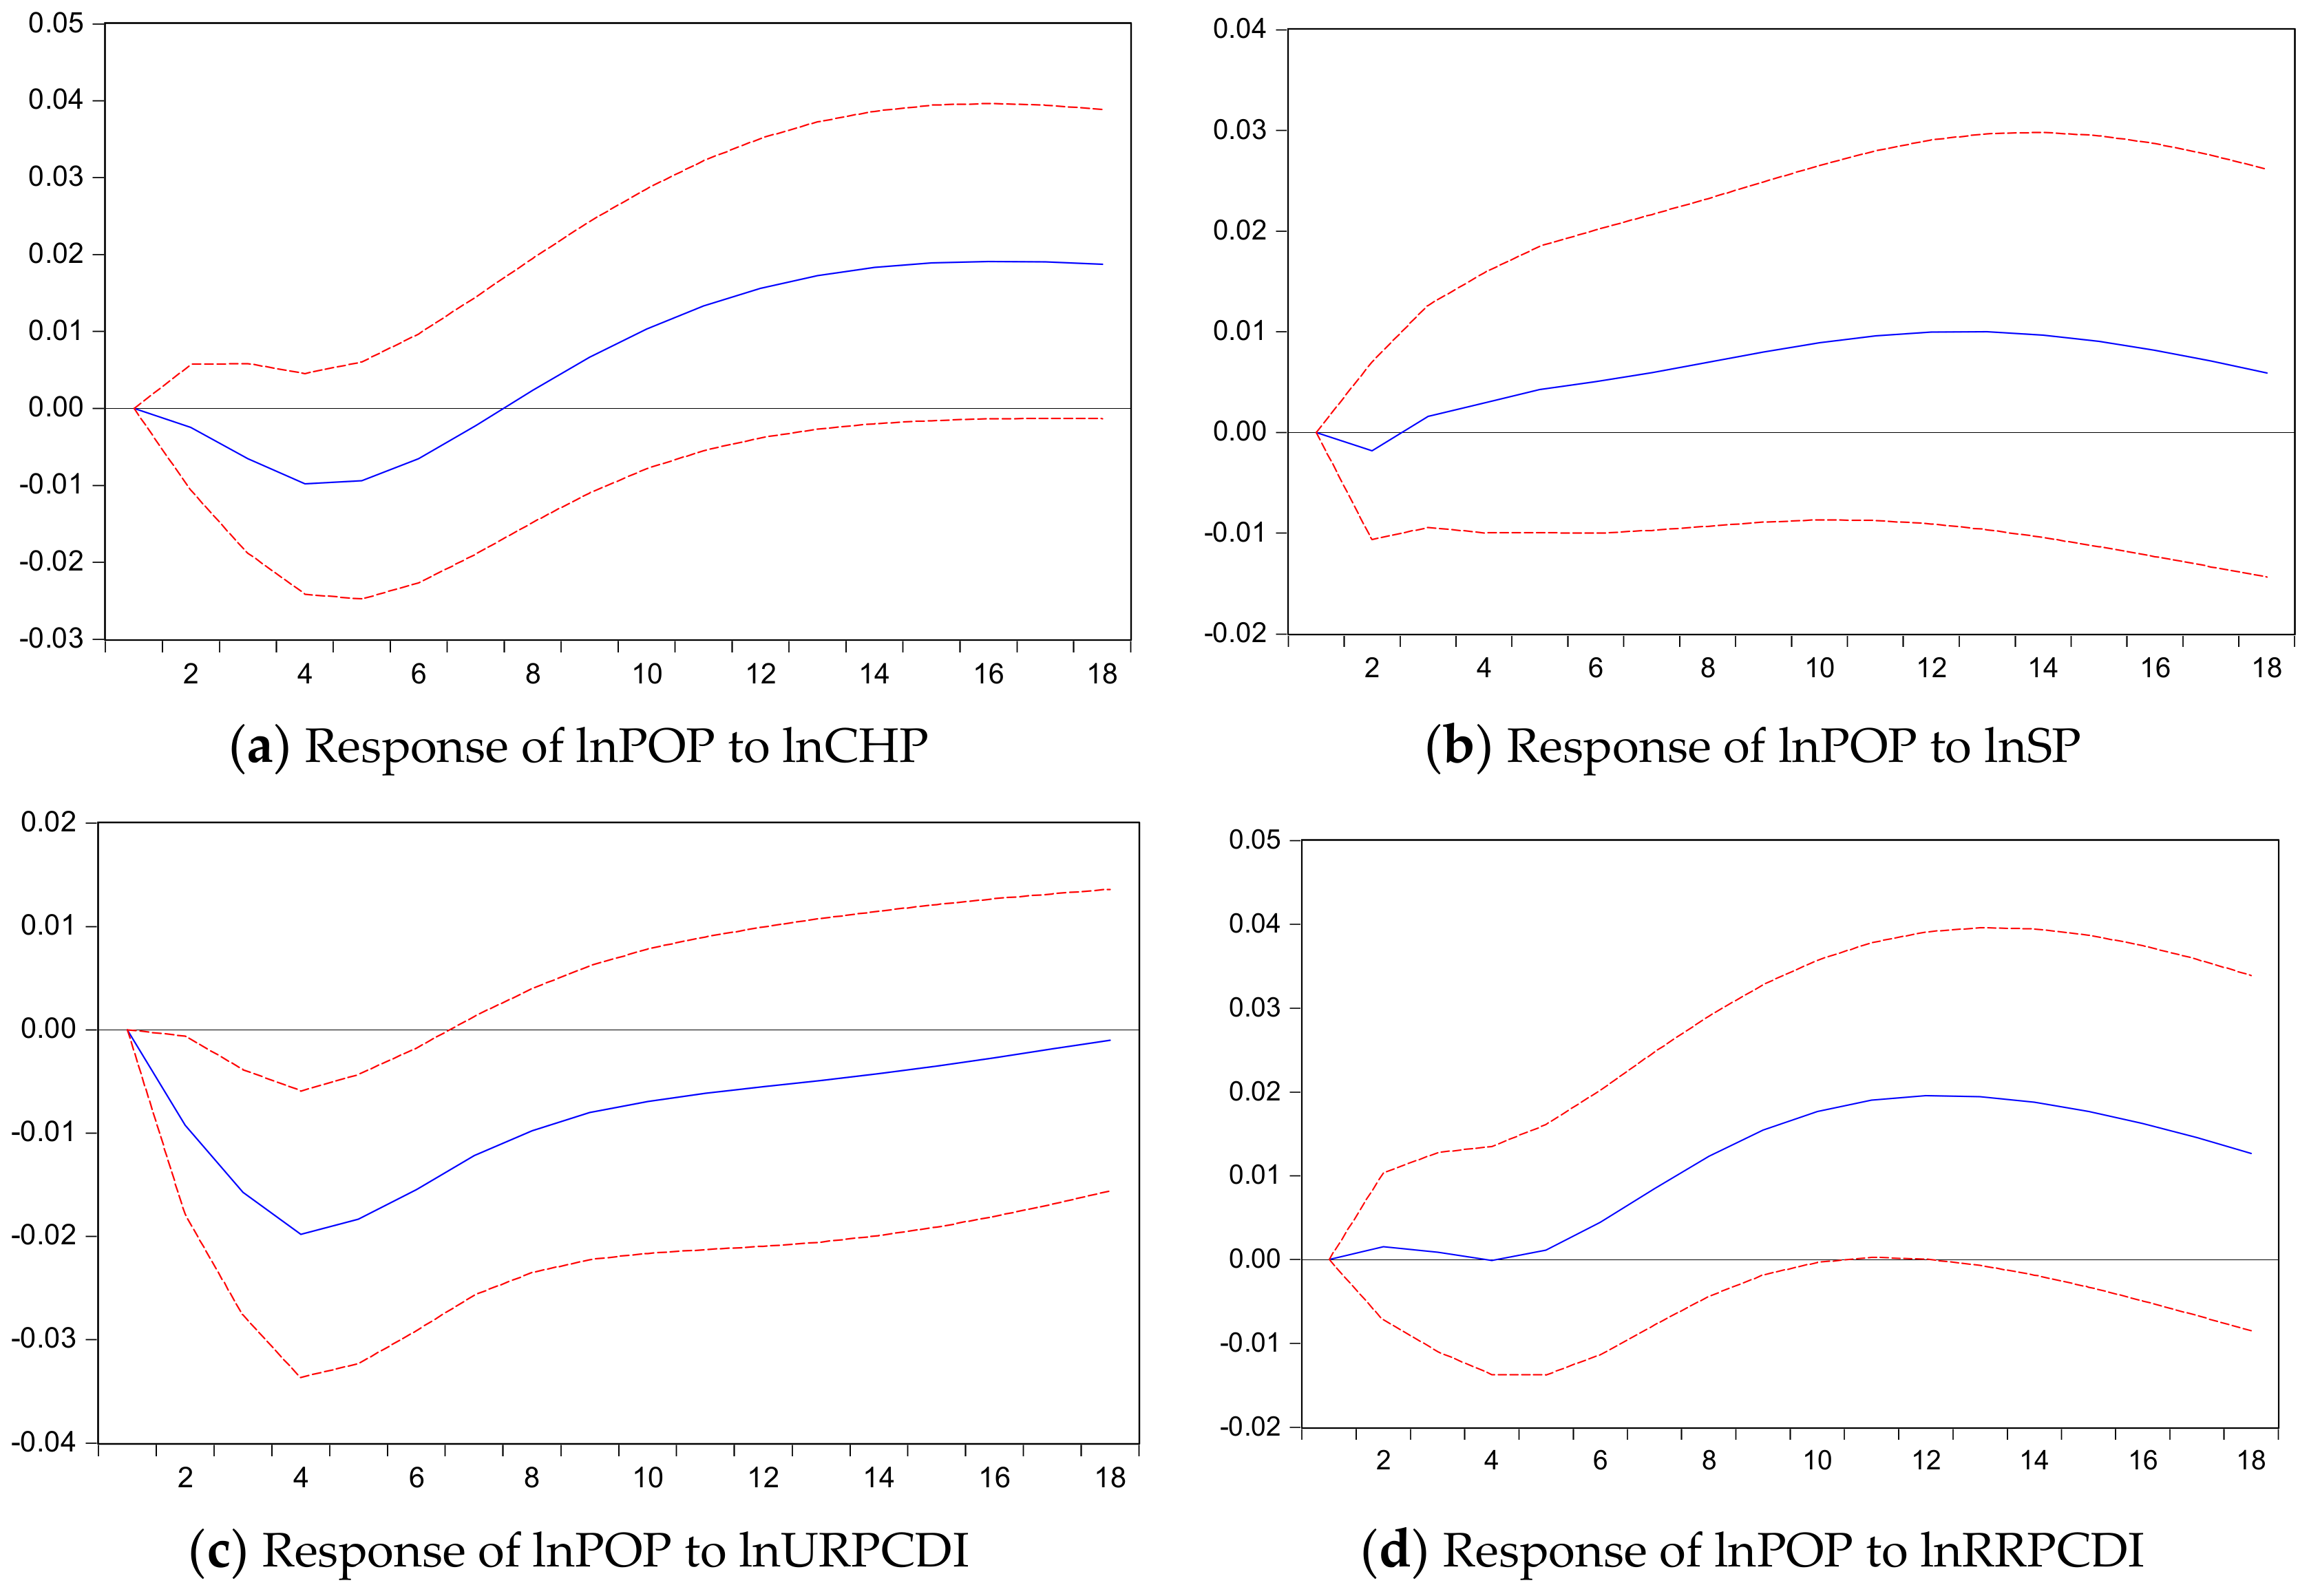
3.5.3. Dynamic Response Relationship between Demand and Pork Price Fluctuation

In the Figure 4a, it can be observed that the chicken price has a long-term positive effect on the pork price. When there was a positive shock to the substitute product, the chicken price, the impact on the pork price initially showed a short-term negative effect. From the 8th month, it gradually turned into a positive effect and increased over time, stabilizing at 0.018 in the 14th month. This result aligns with economic theory, which states that an increase in the price of substitute products leads to a decrease in the output of the corresponding goods. When the chicken price increases, the short-term supply of pigs is relatively high, leading to a temporary decrease in the pork price. However, chicken is a substitute for pork in the long run. When the chicken price rises, consumers turn to buying pork, leading to an increase in the pork price due to the stronger demand for pork. This is consistent with the research results of Zhao et al. [39] and Li et al. [13], which show a significant positive correlation between the chicken price and pork price. Moreover, plant-based meat has gradually become an important component of the meat substitute market and can meet the needs of some meat consumers. The main component of plant-based meat is soybean [23]. When there was a positive shock to the plant-based substitute product, soybeans, the impact on the pork price initially showed a short-term negative effect. From the 3rd month, it gradually turned into a positive effect and increased over time, stabilizing at 0.01 in the 10th month, as shown in Figure 4b. This result indicates that soybean, as a plant-based substitute, has a weak positive impact on the pork price. Although it can reduce greenhouse gas emissions, improve animal welfare, and have diet-related health outcomes, it still faces some limitations and challenges [23,24], and its substitutability for pork is still relatively low.
In terms of the demand factors, urban residents’ per capita disposable income has a weak long-term negative effect on the pork price, while rural residents’ per capita disposable income showed a positive response (Figure 4c,d), indicating a relatively stable demand for pork. According to the Slutsky equation, income effects cause overall changes in demand. Generally, the demand for pork increases with the growth in household income, leading to an increase in the pork price. However, when household incomes reach a relatively high level, the Engel coefficient continues to decrease, resulting in a decrease in the demand for pork and a slight downward adjustment in the pork price [25]. Pork is considered a necessity in daily life, and its income elasticity of demand and price elasticity of demand are both less than 1, indicating a relatively inelastic demand for pork in response to changes in income and price [40]. In China, pork accounts for about 60% of meat consumption on an annual basis, and meat consumption in urban areas has reached a saturation point. However, the income levels of residents in rural areas are relatively low, and pork consumption is not yet saturated, so income growth has a significant impact on the demand for pork [37].

3.5.4. Dynamic Response Relationship between Pig Epidemic Impact and Pork Price Fluctuation

When there was a positive shock to the epidemic severity index, it initially had a short-term negative effect on the pork price (Figure 5). However, starting from the 7th month, it gradually transitioned into a positive effect, which increased over time and stabilized at 0.023 after the 14th month. This change can be mainly attributed to the initial outbreaks of the pig epidemics, whereby pig farmers may have been willing to sell out in advance, leading to an increased supply. Conversely, consumers’ willingness to buy pork may have decreased in the early stages of the pig epidemics, reducing the demand for pork in the short term and eventually leading to a decline in the pork price. In the medium to long term, the dynamic response of the pork price to the shock to the pig epidemic severity index exhibited a structural fluctuation from negative to positive.
During the research period, China experienced major pig epidemics such as blue-ear disease, acute diarrhea, high fever, and African swine fever, which are characterized by strong transmission and high risk. Pig epidemics can have a significant and lasting effect on pork prices. Pig epidemic shocks mainly affect the supply and demand of pigs through the behavior and expectations of producers and consumers, which is reflected in the fluctuations in the pig herd, sow herd, and pork price during epidemics [26], and these fluctuation characteristics could objectively reflect the situation of pig epidemic in the early, outbreak, and recovery stages. According to data from the National Bureau of Statistics, the pig and sow herds in China decreased by 26.86% and 14.87%, respectively, while the pork price increased by 139% from July 2017 to October 2019. This indicates that the outbreak of African swine fever in August 2018 was a decisive factor in the decrease in inventory and the tight supply. In addition, these pig epidemics have forced some small and medium-sized farmers to exit the pig farming industry, exacerbating the imbalance of supply and demand. On the demand side, the spread of public opinion related to pig epidemics leads to a decrease in consumers’ willingness to buy pork in the short term, and the consumption demand for pork declines sharply. The COVID-19 epidemic immediately cut pork procurement channels, and residents’ pork consumption declined in the early stage of the epidemic. Data show that the CPI increased by 5.2% year on year in February 2020, of which the rise in pork prices drove 3.2 percentage points, accounting for 62% [28]. Residents’ pork consumption rebounded in the late stage of the epidemic [41]. In the long run, as the pork supply recovers and pork price declines, pork demand will gradually recover. Overall, the impact of pig epidemics on the pork market involves both the supply side and the demand side, resulting in a more pronounced supply-demand imbalance and significant price fluctuations.
In conclusion, pork price fluctuations were generally positively correlated with the pork price and rural residents’ per capita disposable income and negatively correlated with the pig herd and urban residents’ per capita disposable income [6,29,42]. In addition, the corn price, soybean price, sow herd, imported pork, chicken price, and epidemic depth index exhibited structural fluctuations in relation to the pork price [4,5,43]. Specifically, for imported pork, in an official opinion issued by the State Council in September 2020 [44], a 95% self-sufficiency target for pork was proposed [45]. This shows that China does allow for sizable imports from other major pig-producing countries. Imported pork can produce structural fluctuations in the pork price from positive to negative, and its complementary role in domestic production should not be overlooked, as it can effectively regulate pork price fluctuations. Maintaining a stable import regime and allowing imports to compete with domestic production on an equal footing will provide an important stabilizer for the domestic pork market. For pig epidemics, the epidemic width index and epidemic depth index both showed structural fluctuations from negative to positive with the pork price [26,29], but the epidemic depth index had a longer-lasting impact, and the medium to long-term effects were mainly positive, which should receive more attention. Additionally, the conclusion of this study is also consistent with the cobweb model, that is, the current supply of pigs is affected by the previous period of the pork price, and the pork price in the current period impacts its own fluctuations, while other independent variables have a lag effect on pork price fluctuations [13,25].

3.6. Variance Decomposition Analysis

To better assess the contributions of different variable shocks to the forecast error variance of the pork price and measure the relative importance of various variable shocks, the variance decomposition analysis results for the pork price are presented in Table 5.
First, the most significant factor affecting pork price fluctuations was the pork price itself. It showed a declining trend, starting at 100% in the first month and decreasing to 73.68% in the fifth month, with an impact of 29.60% until the 18th month. Second, in terms of supply, the factors influencing pork price fluctuation in descending order of impact were as follows: pig herd > corn price > sow herd > imported pork. Among them, the pig herd had the highest contribution rate, reaching 38.32% in the 13th month. On the demand side, the impact of rural residents’ per capita disposable income on pork price fluctuations was higher than that of urban residents’ per capita disposable income, with an impact rate of 7.13% and 2%, respectively, by the 18th month. The impact rate of the chicken price and soybean price showed an overall increasing trend, reaching 6.48%, 2.00%in the 18th month. Finally, regarding the impact of pig epidemic shocks, the contribution rate of the epidemic depth index to the pork price was strengthened over time, gradually stabilizing at 9.42% after the 17th month. This contribution rate was only surpassed by the impact of the pork price itself and the pig herd. Two different types of substitutes, chicken and soybeans, were considered in this study. For meat substitutes, the impact rate of the chicken price over the same month was lower than reported by Zheng et al. However, the influence rate gradually increased after the 15th month, and its proportion also gradually increased, which is consistent with the results of Zheng et al. [6]. For plant substitutes, demand and supply were still in the early stage of development in China, and further attention needs to be paid to its impact on the fluctuations of the pork price. According to equilibrium price theory, the prices of meat and other agricultural products depend on the market’s supply and demand relationship [12]. The impulse response and variance decomposition results indicate that the pork price in China is mainly influenced by the pig herd, which is consistent with previous research [6,46].

4. Conclusions and Suggestions

4.1. Conclusions

Based on an SVAR model, the pork price, corn price, pig herd, sow herd, supply of imported pork, epidemic depth index, etc., were selected to carry out an empirical study on pork price fluctuations. (1) The pork price itself had a significant positive impact on its fluctuations, and it had the highest long-term contribution rate. Especially in the short term, it made the greatest contribution to pork price fluctuations. Over time, the impact gradually decreased, but it still maintained a contribution rate of 29.60% in the 18th month. (2) In terms of supply, the pig herd had the largest impact on pork price volatility. Its contribution rate started at 0 in the first month and gradually increased. It reached 8.33% in the 5th month and reached its peak in the 13th month, with a contribution rate of 38.32%. However, the impacts of the corn price, sow herd, and supply of imported pork on pork price fluctuations were relatively small. (3) In terms of demand, the change in demand had a limited impact on pork price fluctuations. Specifically, rural residents’ per capita disposable income had a positive impact on the pork price, with a maximum contribution rate of 7.13%; the maximum impact rate of the chicken price was 6.48%; and the influence of urban residents’ per capita disposable income and soybean price had little impact on pork price fluctuations. (4) The epidemic depth index had a significant and long-lasting impact on pork price fluctuations, with a stable contribution rate of approximately 9.42%. The pig epidemics exacerbated the supply–demand relationship, which amplified the impact of the epidemics on the pork price.

4.2. Suggestions

According to the results, the government needs to adjust management policies to facilitate reasonable resource allocation when macroeconomically regulating pork prices.
(1)
In terms of the pork price, it is recommended to enhance price monitoring through big data analysis. The research findings indicate that the pork price is significantly influenced by its own dynamics, meaning that short-term fluctuations in the pork price may have a prolonged impact on future price trends. It is suggested that relevant departments should collect all kinds of data related to pork prices, including the pig herd, sow herd, consumption, import and export data, epidemic information, and residents’ income levels, to create a big data platform. Then, the big data platform should be used to monitor and analyze the factors affecting the pork price, build a relationship model between the pork supply–demand ratio and pork price, and analyze price trends, which will help pig farms and farmers to make informed breeding plans based on timely market information, avoid blindly following market trends, and contribute to stabilizing the supply and market. When there is a deviation from the predicted pork supply–demand ratio, the pork price may deviate from the supply–demand equilibrium price. Based on the big data platform, the pork supply can be adjusted from the perspectives of the pig herd, sow herd, and imports, for example, by increasing reserve management and reverse-regulating pig cycles so as to assist in future pork price regulation.
(2)
In terms of supply, it is recommended to maintain a stable pig herd to ensure the supply of pork in the market. At present, the proportion of small-scale family farming in China is still high. However, with the deepening development of green ecological farming and circular economy in China, the structural transformation of pig farming is underway, and the advantages of large-scale farms have also gradually emerged. According to statistics, in China, the number of farms (farmers) with 1–49 slaughter pigs per year accounted for 93.80% of the total number, while the number of slaughter pigs in large-scale farms accounted for 57% of the total number of slaughter pigs in 2020. Compared to small-scale family farming, large-scale farms have lower comprehensive costs, higher requirements for pig epidemic prevention and control, and better management efficiency. It is evident that there is significant potential for improvement and expansion in the supply capacity of China’s pig farming industry through the development of large-scale farms. To increase the inventory of the pig herd, it is recommended to continue promoting large-scale farming, provide greater support to farmers, and promote the high-quality development of pig farming towards modernization and industrialization in order to ensure a self-sufficiency rate of pork that meets the safety level.
(3)
In terms of demand, in order to effectively alleviate the fluctuations of pork prices, the residents’ per capita disposable income should have been increased, especially in rural areas residents, enhancing the potential for pork consumption in a positive economy. At the same time, residents should be guided to diversify their meat consumption structure; chicken, plant meat, and other alternatives to pork consumption can alleviate the contradiction in demand under special circumstances. Although the market for plant substitutes is not yet mature, the Chinese government has listed cultured meat and artificial dairy as future food to be developed in China’s “14th Five-Year” National Agricultural Technology Development Plan to improve food security and the sustainability of its food system. It can be observed that the impact of substitutes on pork prices is a focus of future research, particularly plant-based substitutes. Due to the lack of data on plant substitution prices, soybean prices, the main component of plant substitutes, were chosen for analysis in this paper. The results may have deviation to some extent.
(4)
During disease outbreaks, the first six months have a negative impact on the pork price, and farmers bear the greatest losses. In such situations, the government should implement strict control measures, scientifically and effectively manage the outbreaks, and provide corresponding subsidies to farmers. In addition, consumer decision-making is influenced by information dissemination, public opinion guidance, and policy control and can induce changes in pork supply and demand, alleviate pork price fluctuations caused by reduced supply, and mitigate the impact. After approximately six months, efforts should be made to guide and support farmers in resuming production, promote the expansion of the pig farming scale, increase pig production capacity, and ensure the stable production, supply, and price of live pigs. This paper only analyzed the impact of the pig epidemics on pork prices. However, in the event of human epidemics (such as COVID-19), the individual or combined effects of human and animal epidemics can be further considered based on the availability of data.

Author Contributions

Writing draft, J.P. and J.Y.; data curation, J.P., J.Y. and S.L.; writing—review and editing, J.Y.; methodology, J.P. and J.Y.; Supervision, G.L. and S.L. All authors have read and agreed to the published version of the manuscript.

Funding

This research was supported by the Guangxi First-class Discipline Statistics Construction Project Fund, Guangxi Philosophy and Social Sciences Foundation (Grant No. 21FGL034), and Research Ability Improvement Plan for Young and Middle-aged Teachers in Guangxi Universities (Grant No. 2023KY0676).

Institutional Review Board Statement

Not applicable.

Informed Consent Statement

Not applicable.

Data Availability Statement

Not applicable.

Acknowledgments

The authors gratefully acknowledge the financial support received from the Department of Education of Guangxi Zhuang Autonomous Region.

Conflicts of Interest

The authors declare no conflict of interest.

References

  1. Yan, Z.; Cao, Y.; Liu, Y. Analysis on the Law of “Hog Cycle” based on EMD. Price Theory Pract. 2022, 459, 121–124. [Google Scholar] [CrossRef]
  2. Zhang, H.; Chen, S.; Chen, N.; Wang, Z. Development of China’s pig industry in 2022 and trends in 2023. China Swine Ind. 2023, 18, 13–18. [Google Scholar] [CrossRef]
  3. Shi, Z.; Li, J.; Hu, X. The Impact of Pig epidemic on China’s Pork Supply and Demand. J. Agrotech. Econ. 2023, 3, 4–17. [Google Scholar] [CrossRef]
  4. Yao, H.; Zang, C.; Zuo, X.; Xian, Y.; Lu, Y.; Huang, Y.; Li, X. Tradeoff analysis of the pork supply and food security under the influence of African swine fever and the COVID-19 outbreak in China. Geogr. Sustain. 2022, 3, 32–43. [Google Scholar] [CrossRef]
  5. Cui, M.; Zhang, Y.; Huo, J.; Yang, D. The Impact of COVID-19 Policy Response on Food Prices: A Case Study in China. Sustainability 2023, 15, 9490. [Google Scholar] [CrossRef]
  6. Zheng, J.; Wu, Z.; Shi, A. Empirical study on influencing factors of pork price fluctuation in China based on VAR model. Chin. J. Anim. Sci. 2022, 58, 259–265. [Google Scholar] [CrossRef]
  7. Duan, Y.; Wang, G.; Shi, A. Analysis of Influential Factors for Pork Price Fluctuating in Sichuan Based on VAR Model. J. Sichuan Agric. Univ. 2011, 29, 580–584. [Google Scholar]
  8. Sun, D.; Chen, L. Analysis of dynamic relationship between pork price and influencing factors. Chin. J. Anim. Sci. 2020, 36, 74–77. [Google Scholar] [CrossRef]
  9. Utnik-Bana’s, K.; Schwarz, T.; Szymanska, E.J.; Bartlewski, P.M.; Satoła, Ł. Scrutinizing Pork Price Volatility in the European Union over the Last Decade. Animals 2022, 12, 100. [Google Scholar] [CrossRef]
  10. Sirohi, J.; Hloušková, Z.; Bartoňová, K.; Malec, K.; Maitah, M.; Koželský, R. The Vertical Price Transmission in Pork Meat Production in the Czech Republic. Agriculture 2023, 13, 1274. [Google Scholar] [CrossRef]
  11. Zhang, F.; Hu, T. Analysis on fluctuation of pig price and regulation policy in China. Chin. J. Anim. Sci. 2012, 48, 16–19. [Google Scholar]
  12. Hayes, D.J.; Schulz, L.L.; Hart, C.E.; Jacobs, K.L. A Descriptive Analysis of the COVID Impacts on U.S. Pork, Turkey, and Egg Markets. Agribusines 2021, 37, 122–141. [Google Scholar] [CrossRef] [PubMed]
  13. Li, H.; Hu, C.; LÜ, Z.; Li, M.; Guo, X. African swine fever and meat prices fluctuation: An empirical study in China based on TVP-VAR model. J. Integr. Agric. 2021, 20, 2289–2301. [Google Scholar] [CrossRef]
  14. Fan, P.; Yao, W.; Chen, Y.; Tang, L. Research on the Impact of the New Coronary Pneumonia Epidemic on Pork Market Price and Countermeasure—Based on the data analysis of Changzhou City, Jiangsu Province. Price Theory Pract. 2020, 8, 80–83. [Google Scholar] [CrossRef]
  15. Hua, J.; Su, G.; Jia, Y. Research on Pork Price Forecasting and Risk Early Warning Under Impact of Swine Epidemic. Agric. Econ. Manag. 2022, 76, 101–113. [Google Scholar]
  16. Ma, M.; Wang, H.; Hua, Y.; Qin, F.; Yang, J. African swine fever in China: Impacts, responses, and policy implications. Food Policy 2021, 102, 102065. [Google Scholar] [CrossRef]
  17. Zhu, Z.; Ma, Y. Study on China’s Government Frozen Pork Storage Policy and Its Implementation Effects. Price Theory Pract. 2022, 460, 66–70. [Google Scholar] [CrossRef]
  18. Cui, M.; Zhang, X.; Zhang, Y.; Yang, D.; Huo, J.; Xia, F. Effects of Policy Intervention on Food System Resilience to Emergency Risk Shock: Experience from China during COVID-19 Pandemic. Foods 2023, 12, 2345. [Google Scholar] [CrossRef]
  19. Kang, H.; Xiao, H. Relationship of Livestock Meat Price and Inflation in China under Background of African Swine Fever—Based on Research of VEC Model. Agric. Econ. Manag. 2020, 16, 76–85. [Google Scholar]
  20. Shi, Z.; Zhou, H.; Hu, X. Statistical Test of Heterogeneous Effect of Epidemic Shock on Pork Price and CPI Fluctuation. Stat. Decis. 2021, 37, 49–53. [Google Scholar] [CrossRef]
  21. Wang, H.; Wang, M. Research on the Influence of Net Distribution and Emotion on the Price Fluctuation of Livestock Products—Analysis of Baidu Index and Sina Weibo Big Data Based on COVID-19 Epidemic. Price Theory Pract. 2021, 8, 108–111. [Google Scholar] [CrossRef]
  22. Ma, C.; Tao, J.; Tan, C.; Liu, W.; Li, X. Negative Media Sentiment about the Pig Epidemic and pork price fluctuation: A Study on Spatial Spillover Effect and Mechanism. Agriculture 2023, 13, 658. [Google Scholar] [CrossRef]
  23. Sun, J.; Ortega, D.L.; Lin, W. Food values drive Chinese consumers’ demand for meat and milk substitutes. Appetite 2023, 181, 106392. [Google Scholar] [CrossRef] [PubMed]
  24. Arrigoni, A.; Marveggio, D.; Allievi, F.; Dotelli, G.; Scaccabarozzi, G. Environmental and health-related external costs of meat consumption in Italy: Estimations and recommendations through life cycle assessment. Sci. Total Environ. 2023, 869, 161773. [Google Scholar] [CrossRef] [PubMed]
  25. Jiang, F.; Wei, H.; Tao, Q. Empirical Research on the Influential Factors of Chinese Crude Drug Price Based on SVAR Model. China Pharm. 2021, 32, 2695–2700. [Google Scholar]
  26. Pan, F.; Wang, N.; Deng, H.; Liu, L. Time-varying supply response of feeding sows based on the TVP-VAR-SV model. Res. Agric. Mod. 2022, 43, 627–637. [Google Scholar] [CrossRef]
  27. Xiang, L. Research on the Influencing Factors and Industrial Development of China’s Hog Price Fluctuation. Master’s Thesis, Xihua University, Chengdu, China, 2022. [Google Scholar]
  28. Li, W.; Dang, Y.; Fang, F.; Xue, Q.; Du, X. An empirical analysis of the impact of pig epidemic on pork price. J. Henan Agric. Univ. 2022, 56, 868–876. [Google Scholar] [CrossRef]
  29. Liu, M.; Liu, F.; Liu, Y. Empirical study of pig price fluctuation in China based on VAR model. Chin. J. Anim. Sci. 2020, 56, 184–188. [Google Scholar] [CrossRef]
  30. Gao, T. Application and Examples of Econometric Analysis Methods and Modeling EViews, 4th ed.; Tsinghua University Publishing House: Beijing, China, 2020; pp. 251–268. [Google Scholar]
  31. Shumba, T.; Mukorera, S. Monetary Policy Implications on Macroeconomic Performance in the Common Monetary Area: A Panel-SVAR Framework. Economies 2023, 11, 144. [Google Scholar] [CrossRef]
  32. Yang, Y.; Zhang, S.; Zhang, N.; Wen, Z.; Zhang, Q.; Xu, M.; Zhang, Y.; Niu, M. The Dynamic Relationship between China’s Economic Cycle, Government Debt, and Economic Policy. Sustainability 2022, 14, 1029. [Google Scholar] [CrossRef]
  33. Liu, S.; Xiao, H. Seasonal fluctuation characteristics of China’s mutton price and the shock effect of substitute price: An empirical analysis based on HEGY test and SVAR model. J. China Agric. Univ. 2022, 27, 264–274. [Google Scholar]
  34. Li, S.; Shen, L. Currency is distracted from Their Intended Purpose and Virtual Economic Prosperity: Evidence based on Financial and Real Estate Industry. Southwest Financ. 2019, 460, 32–41. [Google Scholar]
  35. Noda, H.; Kyo, K. Dynamic relationships among changes in prices of beef, pork, and chicken in Japan: A Bayesian approach. J. Agric. Food Res. 2022, 11, 100464. [Google Scholar] [CrossRef]
  36. Liu, R.; Zhang, R.; Yu, J. Investigation of influencing factors of price fluctuation of agricultural products—Take pork price. Anhui Agric. Sci. Bull. 2021, 27, 124–127. [Google Scholar] [CrossRef]
  37. Yan, Z.; Liu, Y.; Cao, Y. Supply determines price: A study of “pig cycle” based on EMD. J. Commer. Econ. 2022, 4, 185–188. [Google Scholar]
  38. Zhang, M.; Liu, S.; Liu, F. Spatial-Temporal Effects of Pork Price Changes in China. Econ. Geogr. 2018, 38, 135–142. [Google Scholar] [CrossRef]
  39. Zhao, S.; Miao, X.; Bai, L. Spatiotemporal correlation of pork price and its influencing factors. China Price 2023, 6, 102–104. [Google Scholar]
  40. He, S.; Zeng, H.; He, B. Estimation and cyclical comparison of pork demand elasticity of rural residents in China: Based on extended linear expenditure system. Jiangsu Agric. Sci. 2017, 45, 335–338. [Google Scholar] [CrossRef]
  41. Liu, Y.; Han, Q. The impact of COVID-19 on Chinese residents’ pork consumption behavior and countermeasures: An analysis based on 525 questionnaires from Chinese residents. Chin. J. Anim. Sci. 2021, 57, 256–260. [Google Scholar] [CrossRef]
  42. Wang, X. Research on Meat Consumption and Influencing Factors of Chinese Residents. Master’s Thesis, Northeast Agricultural University, Harbin, China, 2020. [Google Scholar]
  43. Panagiotou, D. Asymmetric price responses of the US pork retail prices to farm and wholesale price shocks: A nonlinear ARDL approach. J. Econ. Asymmetries 2021, 23, e00185. [Google Scholar] [CrossRef]
  44. State Council. Opinions on Promoting the High-Quality Development of Animal Husbandry. 2020. Available online: http://www.gov.cn/zhengce/content/2020-09/27/content_5547612.htm (accessed on 16 January 2022).
  45. Han, M.; Yu, W.; Clora, F. Boom and Bust in China’s Pig Sector during 2018–2021: Recent Recovery from the ASF Shocks and Longer-Term Sustainability Considerations. Sustainability 2022, 14, 6784. [Google Scholar] [CrossRef]
  46. Yan, Z.; Cao, Y.; Liu, Y.; Liu, L. Analysis of pork price fluctuation rule based on modal data decomposition. Stat. Decis. 2023, 39, 84–88. [Google Scholar] [CrossRef]
Figure 1. Inverse roots of AR characteristic polynomial.
Sustainability 15 13130 g001
Figure 2. Response of lnPOP to lnPOP. Note. The blue line represents the impulse response fitting value, and the red dashed line represents the standard deviation.
Sustainability 15 13130 g002
Figure 3. Impulse response of supply to pork price.
Sustainability 15 13130 g003
Figure 4. The impulse response of demand to pork price.
Sustainability 15 13130 g004
Figure 5. Response of lnPOP to lnEDI.
Sustainability 15 13130 g005
Table 1. Results of the stationarity test of the original variables.
VariableADF StatisticCritical Valuep-ValueStationarity
1%5%10%
lnPOP0.0367−2.5801−1.9429−1.61530.6930Non-stationary
lnCP−1.7893−3.4731−2.8802−2.57680.3847Non-stationary
lnPH−1.9763−3.4731−2.8802−2.57680.2971Non-stationary
lnSH−0.4993−2.5801−1.9429−1.61530.4986Non-stationary
lnIP−3.3245−4.0187−3.4393−3.14400.0662Non-stationary
lnCHP−3.2407−4.0187−3.4393−3.14400.0805Non-stationary
lnSP3.7013−2.5801−1.9429−1.61530.9999Non-stationary
lnURPCDI−2.8572−4.0187−3.4393−3.14400.1796Non-stationary
lnRRPCDI−3.1233−4.0187−3.4393−3.14400.1046Non-stationary
lnEDI−2.7721−3.4731−2.8802−2.57680.0647Non-stationary
Table 2. Results of the stationarity test of the first-order differential variables.
VariableADF StatisticCritical Valuep-ValueStationarity
1%5%10%
dlnPOP−6.6943−2.5802−1.9429−1.61530.0000Stationary
dlnCP−6.0765−2.5802−1.9429−1.61530.0000Stationary
dlnPH−5.7188−2.5802−1.9429−1.61530.0000Stationary
dlnSH−6.7794−2.5802−1.9429−1.61530.0000Stationary
dlnIP−10.5639−2.5802−1.9429−1.61530.0000Stationary
dlnCHP−7.2978−2.5802−1.9429−1.61530.0000Stationary
dlnSP−7.3922−3.4734−2.8803−2.57690.0000Stationary
dlnURPCDI−9.4532−3.4734−2.8803−2.57690.0000Stationary
dlnRRPCDI−9.5298−3.4734−2.8803−2.57690.0000Stationary
dlnEDI−9.1391−2.5802−1.9429−1.61530.0000Stationary
Note. “dx” represents the first-order differential variable, where “x” represents each variable.
Table 3. Johansen cointegration test results.
No. of CE(s)EigenvalueStatistic5% Critical Valuep
None *0.5076401.8734251.26500.0000
At most 1 *0.3636292.7855208.43740.0000
At most 2 *0.2901223.1963169.59910.0000
At most 3 *0.2732170.4279134.67800.0001
At most 4 *0.2144121.2948103.84730.0021
At most 5 *0.152384.130876.97280.0128
At most 6 *0.146658.682954.07900.0184
At most 70.105334.275335.19280.0626
At most 80.091317.145020.26180.1272
At most 90.01552.40339.16450.6968
Note.* denotes rejection of the hypothesis at the 0.05 level.
Table 4. Results of the optimal lag order test.
LagLogLLRFPEAICSCHQ
01708.3520NA1.25 × 10−22−22.0565−21.8593−21.9764
13520.29703365.04002.76 × 10−32−44.2896−42.1203 *−43.4084
23687.8840289.4681 *1.17 × 10−32 *−45.1673 *−41.0260−43.4851 *
Note. “NA” indicates that the item does not exist. The asterisk (*) denotes the optimal choice for each criterion.
Table 5. Variance decomposition table of the SVAR model.
MonthS.E.LnPOP
(%)
LnCP
(%)
LnPH
(%)
LnSH
(%)
LnIP (%)LnCHP
(%)
LnSP (%)LnURPCDI
(%)
LnRRPCDI
(%)
LnEDI
(%)
10.0511100.00000.00000.00000.00000.00000.00000.00000.00000.00000.0000
30.101186.87321.71801.23482.71160.75490.47160.05773.25880.03142.8881
50.125173.67692.21028.32532.00981.79551.48640.21066.77640.02903.4799
70.142061.52891.781320.70501.61672.04521.38770.46707.18210.47662.8094
90.158850.84791.472431.27691.37811.95071.30670.81836.37391.93182.6433
110.175042.73481.306136.80721.23441.79662.00781.23475.52853.79263.5573
130.189037.10241.245738.32051.28901.64553.23771.61684.89115.38065.2707
150.200333.28351.303537.57701.69961.50374.61171.87834.43256.45357.2565
170.209030.63391.484835.84122.60141.38405.90131.99254.09357.01339.0542
180.212729.59861.614234.85443.24511.33826.47882.00123.95617.12879.7846
Disclaimer/Publisher’s Note: The statements, opinions and data contained in all publications are solely those of the individual author(s) and contributor(s) and not of MDPI and/or the editor(s). MDPI and/or the editor(s) disclaim responsibility for any injury to people or property resulting from any ideas, methods, instructions or products referred to in the content.

