Article

A Study on Ecological Emergy and Carbon-Emissions-Coupling Sustainability of Building Systems

1
School of Civil Engineering, Architecture and Environment, Hubei University of Technology, Wuhan 430068, China
2
Key Laboratory of Health Intelligent Perception and Ecological Restoration of River and Lake of the Ministry of Education, Hubei University of Technology, Wuhan 430068, China
3
School of Civil Engineering and Architecture, Jiangsu University of Science and Technology, Zhenjiang 212100, China
4
School of Architecture, Architectural History and Theory, Southeast University, Nanjing 210096, China
*
Authors to whom correspondence should be addressed.
Sustainability 2023, 15(17), 13075; https://doi.org/10.3390/su151713075
Submission received: 4 August 2023 / Revised: 22 August 2023 / Accepted: 25 August 2023 / Published: 30 August 2023
(This article belongs to the Section Green Building)

Abstract

:
In the face of the increasingly deteriorating global environment, the sustainability of building systems has become a major research topic. This paper presents sustainability research on large-scale building cases from the perspectives of ecological emergy value and carbon emissions. Specifically, by calculating the emergy value and carbon emissions throughout the entire life cycle of the building system, a quantitative analysis of sustainability based on the LCA–emergy–carbon-emissions framework is completed. The results indicate that from the perspectives of both emergy value (over 80%) and carbon emissions (over 90%), the operational stage and the building-material-production stage are the controlling factors. Retrofit design strategies help enhance the sustainability performance of the building system, but different types of design strategies have different effects. The landscape-transformation-design strategy (strategy A) significantly improves the ecological sustainability of the building system, the equipment-improvement strategy (strategy B) helps reduce the carbon emissions of the building system, while the infrastructure-renewal strategy not only has a weaker impact on sustainability improvement but also generates the highest carbon emissions. Additionally, with the aim of controlling carbon emissions, the integration of solar clean energy sources contributes to the overall sustainability of the building system, providing references for architects and building managers.

1. Introduction

In the face of increasingly severe environmental degradation worldwide, building systems, as human habitation hubs, have a significant impact on the global ecosystem in terms of their sustainability [1,2]. As open systems, building systems require the continuous input of materials, energy, information, and other resources, which inevitably lead to changes in the sustainability statuses of building systems [3,4]. At the same time, variations in the supply of various building-system components can affect carbon emissions calculations. According to estimations by researchers, carbon emissions from the entire building system account for more than one-third of total carbon emissions [5,6]. Therefore, research on the ecological sustainability and carbon emissions of building systems needs to be simultaneously addressed.
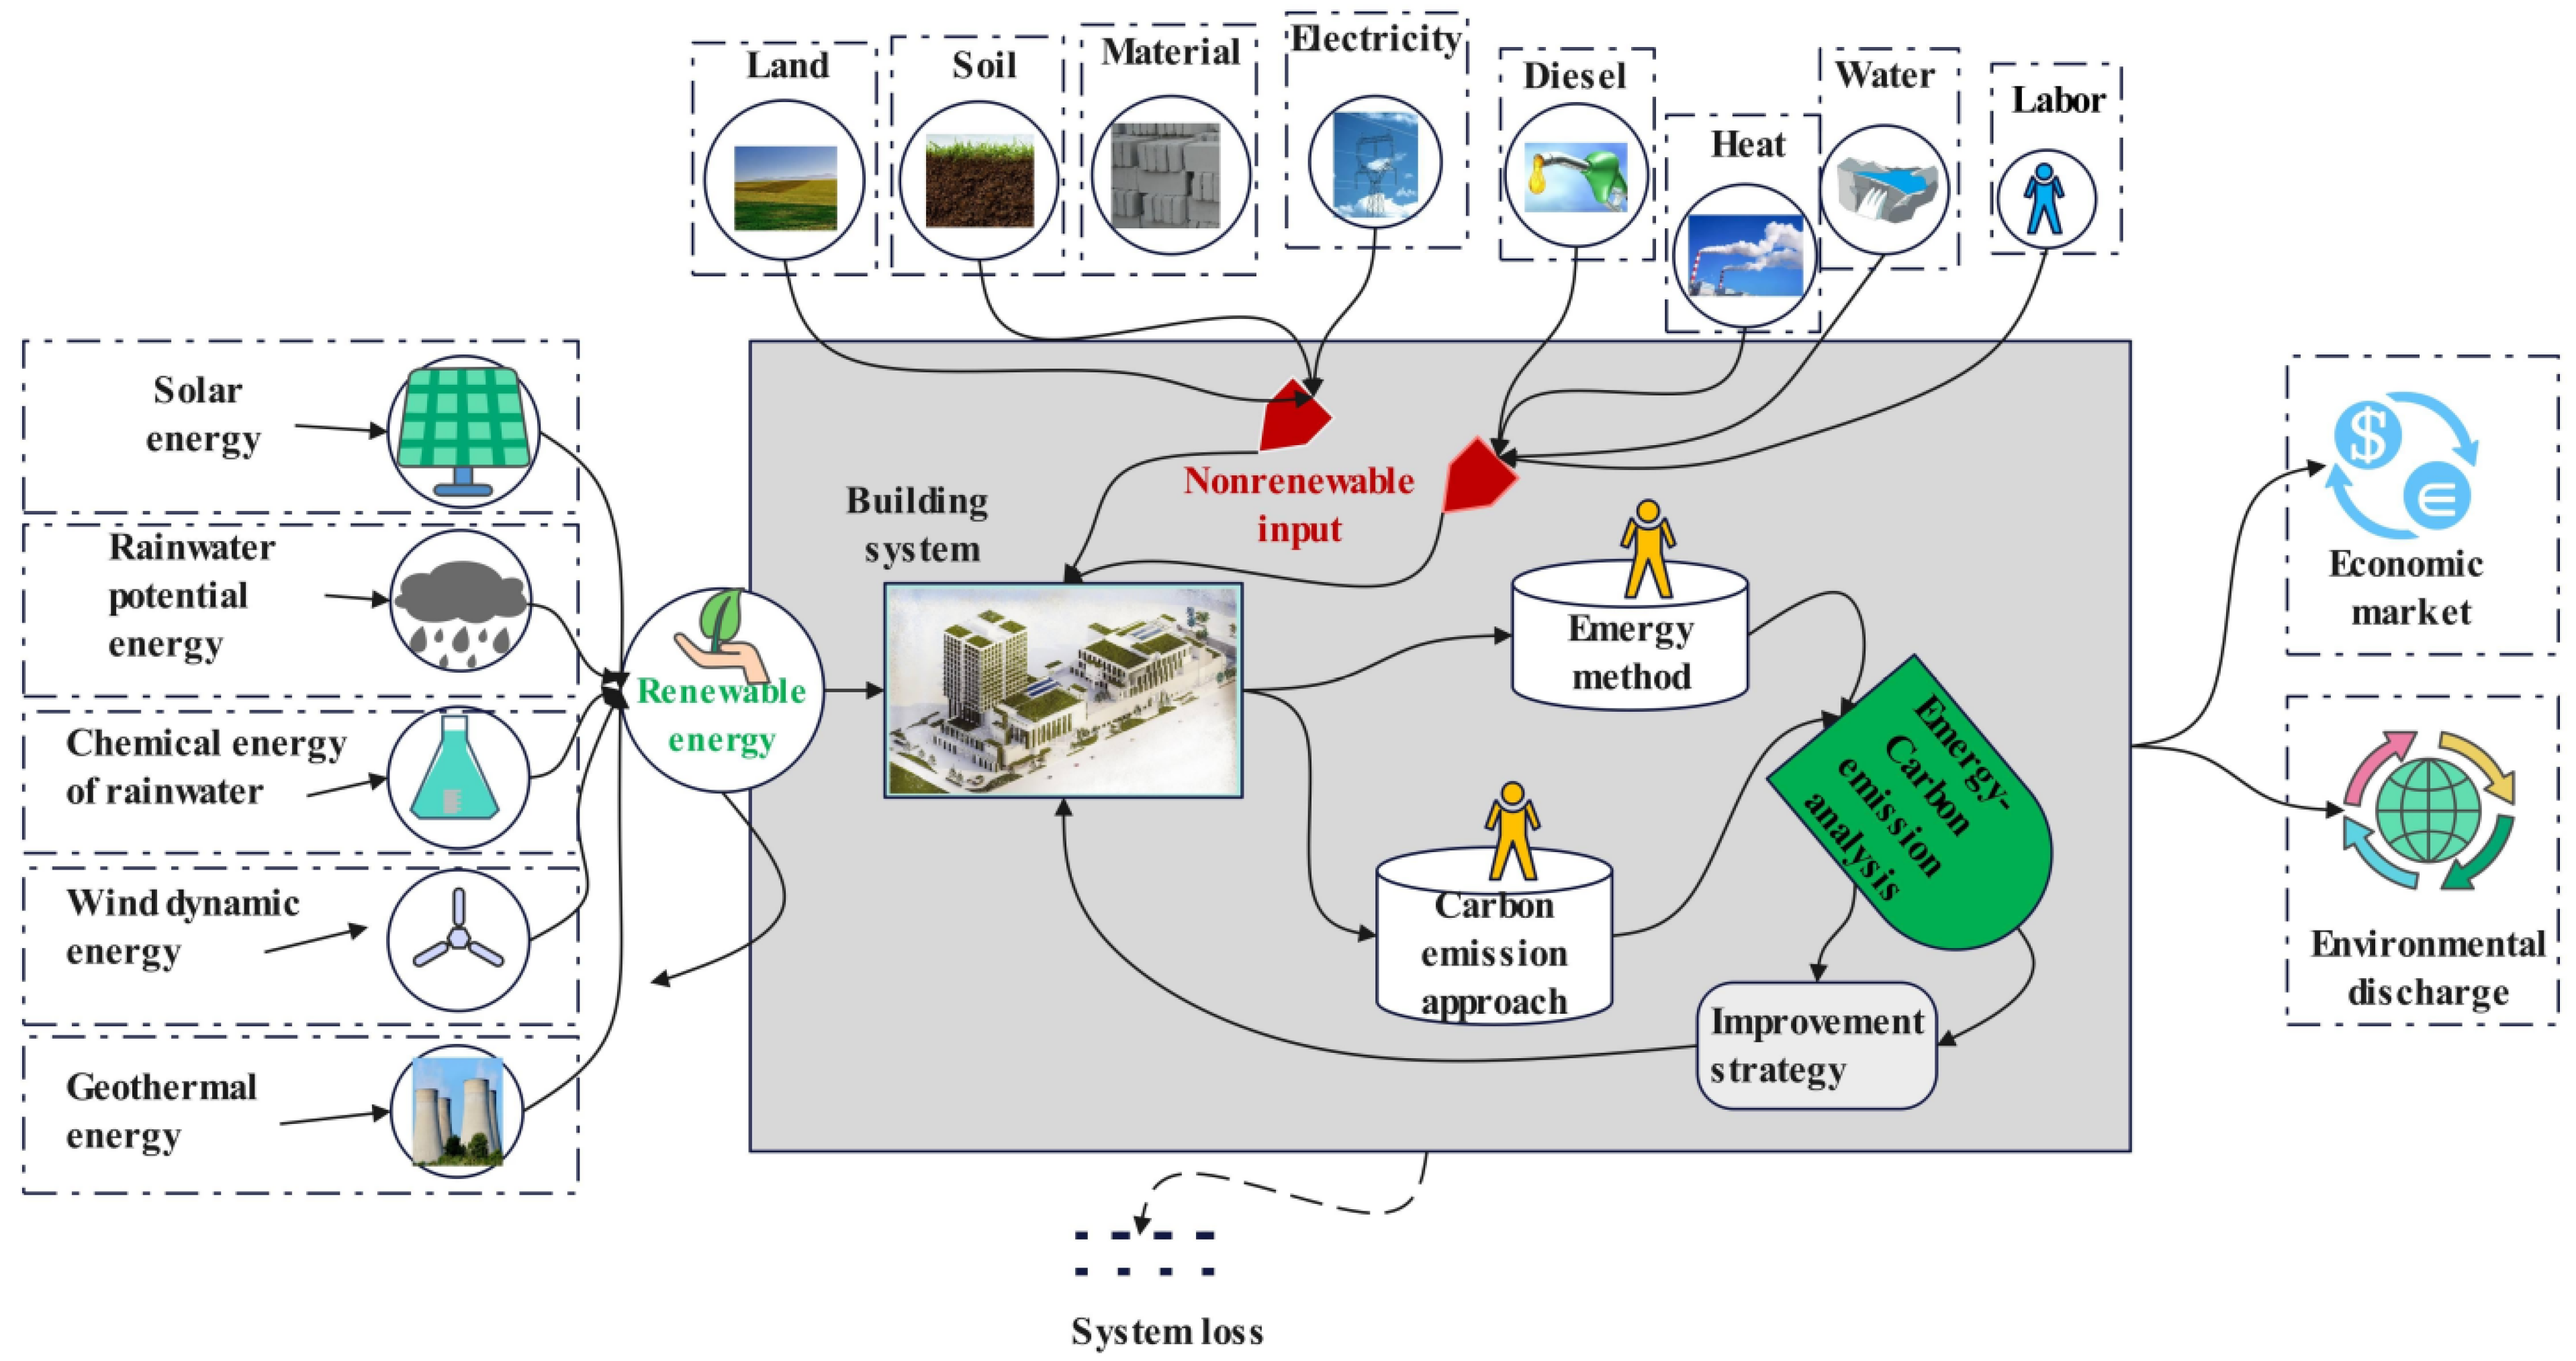
This study applies two methods: ecological emergy analysis and carbon-emission estimation. Emergy analysis is an approach used to analyze systems from an ecological–economic perspective and has been widely applied in various fields, including urban areas [7], water treatment [8], industry [9], materials [10,11], ecology [12], and economics [13]. Additionally, building systems also constitute an important research area in the field of emergy analysis. However, the focus of research varies among different researchers. Some couple emergy analysis with other methods, such as building information modeling (BIM) technology [14] or clean energy technologies [15]. Others have focused on the impact of the emergy embodied in building materials on building systems [16]. Evaluating green building systems and assessing their sustainability status from the perspective of emergy analysis is also an important research topic [17]. Moreover, architects can use this method to guide building design, which can help reduce the negative environmental effects of buildings [18].
As this study involves the emergy analysis of the entire life cycles of building systems, relevant research regarding the relationship between building systems and LCA–emergy methods has been reviewed. Currently, there is limited research in this area, mainly focusing on the emergy analysis of the entire life cycles of building systems [19], renewal design strategies for building systems [20], and the impact of the energy embodied in building materials on the sustainability of building systems [21].
There has been extensive research on carbon emissions from building systems, with different researchers studying and analyzing carbon emissions from various perspectives. For example, the effects of the carbon emissions from different building models have been explored to provide pathways for low-carbon designs [22]. Starting from the perspective of low-carbon city design, researchers have delved into low-carbon design at the building level, introducing a new way of thinking [23]. Considering that carbon emissions are dynamic processes, the analysis of the trends in the development of carbon emissions in public buildings has also been a focus of research [24]. Some researchers have employed system-dynamics methods to analyze and predict carbon emissions in buildings [25]. The management of carbon emissions in supply chains has also become a research hotspot to ensure the normal operation of building systems [26]. The integration of low-carbon-design concepts into the renewal design of old buildings is advocated as one of the industry’s approaches [27]. The low-carbon effects of green space design through the coupling of building and landscape systems have also received attention from multiple scholars [28]. The analysis of the impact of carbon-emission quotas on the construction industry is a task undertaken by government officials [29]. The model of zero-carbon buildings, regarded as the optimal model for building systems, has consistently been a focal point of the industry [30].
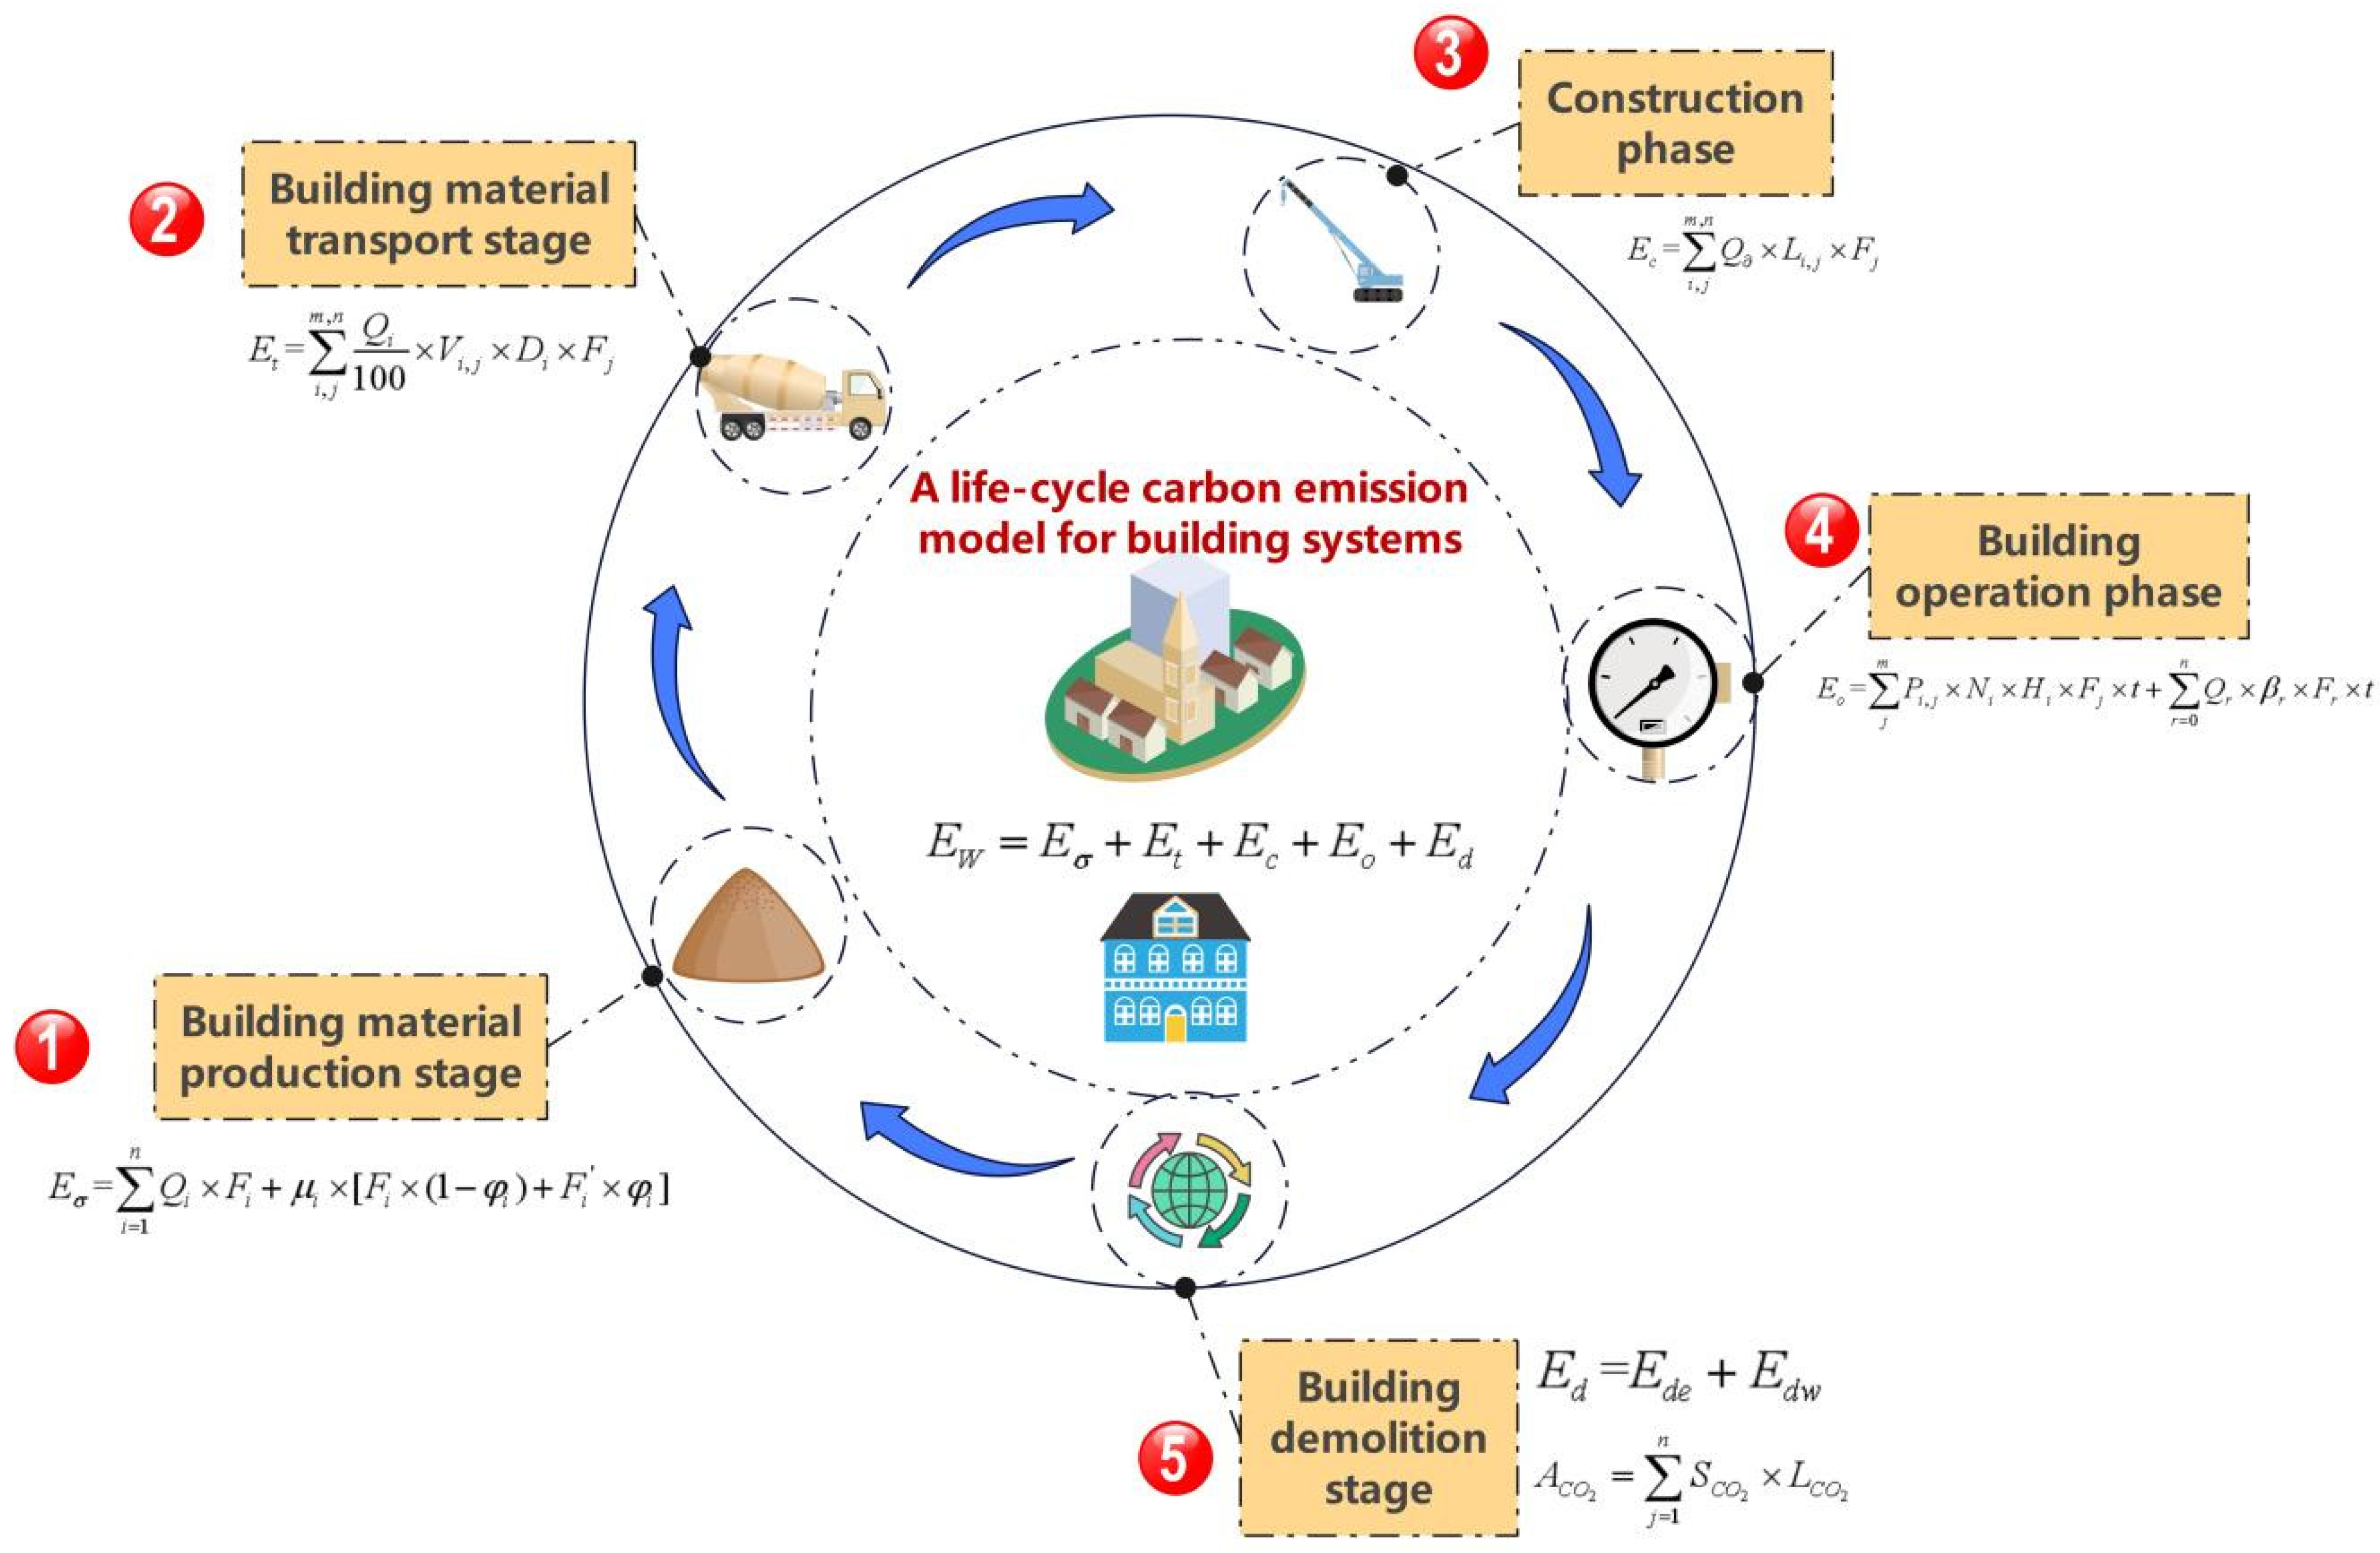
Furthermore, research on the life-cycle carbon emissions of building systems is another major topic. For example, the carbon-emissions intensity and cost of building systems, combined with BIM technology and the LCA method, have been studied and garnered attention [31]. The economic effects of low-carbon buildings, in conjunction with energy-saving measures, have been analyzed [32]. Some scholars have explored the environmental and climate effects of low-carbon buildings [33]. In addition to methodological differences, different types of buildings are also the focus of attention in terms of low-carbon aspects. Topics such as the life-cycle carbon emissions of zero-carbon buildings and the application of carbon capture and storage technologies have been investigated [34]. Researchers have delved into the carbon emissions of residential houses, rural dwellings, and prefabricated buildings [35,36,37]. Carbon sequestration in concrete materials is an important approach to carbon reduction in building systems. Scholars have conducted research on the chemical reactions between concrete materials and carbon dioxide using a multi-scale thermo-physical model. The findings prove that this is a feasible method for carbon reduction in building systems [38,39,40].
However, at the time of writing, research on the integration of emergy analysis with carbon-emissions analysis in the context of building systems is still in its early stages. As two perspectives for assessing sustainability, are the ecological perspective and carbon emission perspective consistent when it comes to building systems? What are the similarities and differences between the two? Can they provide support for architects and building managers? These are the research focuses of this paper.
The uniqueness of this article lies in its comprehensive study of the sustainability of building systems by coupling emergy theory and carbon emissions methodology. From the perspectives of ecological landscape and carbon emissions, it provides an integrated assessment of the state of buildings, offering novel insights to architects and building managers in approaching sustainable architecture.

2. Material and Methods

2.1. Research Framework

Figure 1 illustrates the evaluation framework based on the emergy method and carbon emissions in this paper. It consists of five main components: renewable energy inputs on the left side, non-renewable resource inputs on the top side, environmental impacts and economic benefits on the right side, system losses on the bottom side, and the building system framework diagram in the middle. The specific process involves renewable and non-renewable resources entering the building system, being transformed into emergy and carbon emissions, and then calculating emergy indicators and carbon emission indicators to comprehensively assess the ecological and low-carbon performance of the building system. Finally, improvement measures are provided.
In Figure 1, transportation is calculated based on fossil fuel consumption, factors in building design are implemented through manual services, and the building case type selected is large-scale commercial complexes.

2.2. LCA–Emergy Method

2.2.1. Emergy Concept

Emergy is a new form of energy, which is considered a type of embodied energy. It incorporates various energy modes, including energy flow, information flow, and material flow. It brings together different energy types to create a unified platform for comparative analysis. This concept was initially introduced by scholars from the University of Florida [41] and has been extensively utilized in diverse systems such as geography, urban development, agriculture, industry, and architecture. It facilitates effective evaluation and analysis of sustainability in various systems, offering valuable insights for enhancing ecological aspects.

2.2.2. LAC-Emergy Approach

  • Solar irradiation emergy calculation equation
E S = A × J × ( 1 β ) × T C × T U E V s
The solar emergy in the construction process can be calculated by using Equation (1), which is expressed as follows: (1) here, E S represents the solar emergy in the construction process. A refers to the site surface area. J represents the amount of solar radiation (3.5 × 10⁹ J/m2) [42]. β is the surface albedo (0.7). T C denotes the construction time. T U E V s represents the unit emergy values.
2.
Mass calculation equation
The emergy of mass in the construction system can be calculated using the Equation (2), as follows:
E mass = i = 1 n Q i × T U 1
Here, E mass represents the emergy of the mass. Q i refers to the amount of mass. T U 1 represents the unit emergy value.
3.
Electricity calculation equation
The equation for calculating the emergy of electricity in the building system has been given by
E e = L × T U e
Here, E e is the emergy of electricity in the building system. L denotes the quantity of electricity. T U e is the unit emergy value of electricity.
4.
Water emergy calculation equation
The calculation of water emergy has two applications in the building system. Firstly, in the demolition and construction stage, the water emergy can be calculated by using Equation (4), as follows:
E w a t e r = V × ρ × G × U E V w
Here, E w a t e r represents the water emergy. V refers to the volume of water. ρ is the density of water. G represents the Gibbs energy of water (4.92 J/g). U E V w denotes the transformity of water.
Secondly, the water emergy should also be considered in the operation phase of the building. The equation for calculating the water emergy in the building operation stage is shown by Equation (5):
F w a t e r = V o × N o × T o × ρ × G × U E V w
Here, F w a t e r represents the water emergy in the building operation stage. V o refers to the water volume per day per person (25 L/d/p). N o represents the number of employees (which is 200 in this study). T o is the working time (280 days in this study).
5.
Diesel fuel emergy calculation equation
Diesel fuel is a necessary component of the building system due to machinery usage. The equation for calculating the emergy of diesel fuel is as follows:
E diesel = μ × χ × U E V d
Here, E diesel represents the emergy of diesel fuel. μ shows the amount of diesel oil used in the building system. χ denotes the calorific value of diesel fuel. U E V d represents the unit emergy value of diesel fuel.
6.
Gasoline emergy calculation model
The emergy of gasoline can be calculated using the following equation:
E g a s o l i n e = ϕ × φ × U E V g
Here, E g a s o l i n e represents the emergy of gasoline. ϕ refers to the quantity of gasoline. φ denotes the calorific value of gasoline. U E V g represents the unit emergy of gasoline.
7.
Human labor emergy calculation equation
The emergy of human labor can be calculated using the following equation:
E H = L T × N P × T d × U E V H
Here, E H represents the emergy of human labor. L T refers to the working time, typically 8 h. N P illustrates the number of employed workers. T d represents the number of working days. U E V H is the unit emergy of human labor.
8.
Emergy indicators
This paper adopts several indicators to evaluate the ecological status of the building system, as follows:
9.
The Emergy yield ratio (EYR) measures the ratio between the obtained emergy and the consumed emergy in a system, representing the emergy input–output ratio of the building system. The calculation formula is EYR = Comprehensive output emergy/Comprehensive input emergy.
10.
The Environmental loading ratio (ELR) evaluates the level of the environmental burden caused by a system, indicating the environmental resources consumed per unit of emergy output. The calculation formula is ELR = Environmental resource consumption emergy/Comprehensive output emergy.
11.
The Emergy sustainability indicator (ESI) provides a comprehensive assessment of the sustainability of the building system by combining the EYR and ELR indicators. The calculation formula is ESI = EYR/ELR.
By calculating EYR, ELR, and ESI, we can analyze and evaluate the effectiveness of the sustainability improvement measures. Higher EYR and lower ELR values indicate better energy utilization efficiency and reduced environmental burden, showing a better sustainability of the system.

2.3. LCA–Carbon Emission Model

Figure 2 presents the pathways of carbon emissions in a building system, consisting of five aspects: material production stage, material transportation stage, construction stage, operational stage, and demolition stage. Each stage includes specific carbon emission calculation models (Table 1).

3. Case Study

3.1. Case Introduction

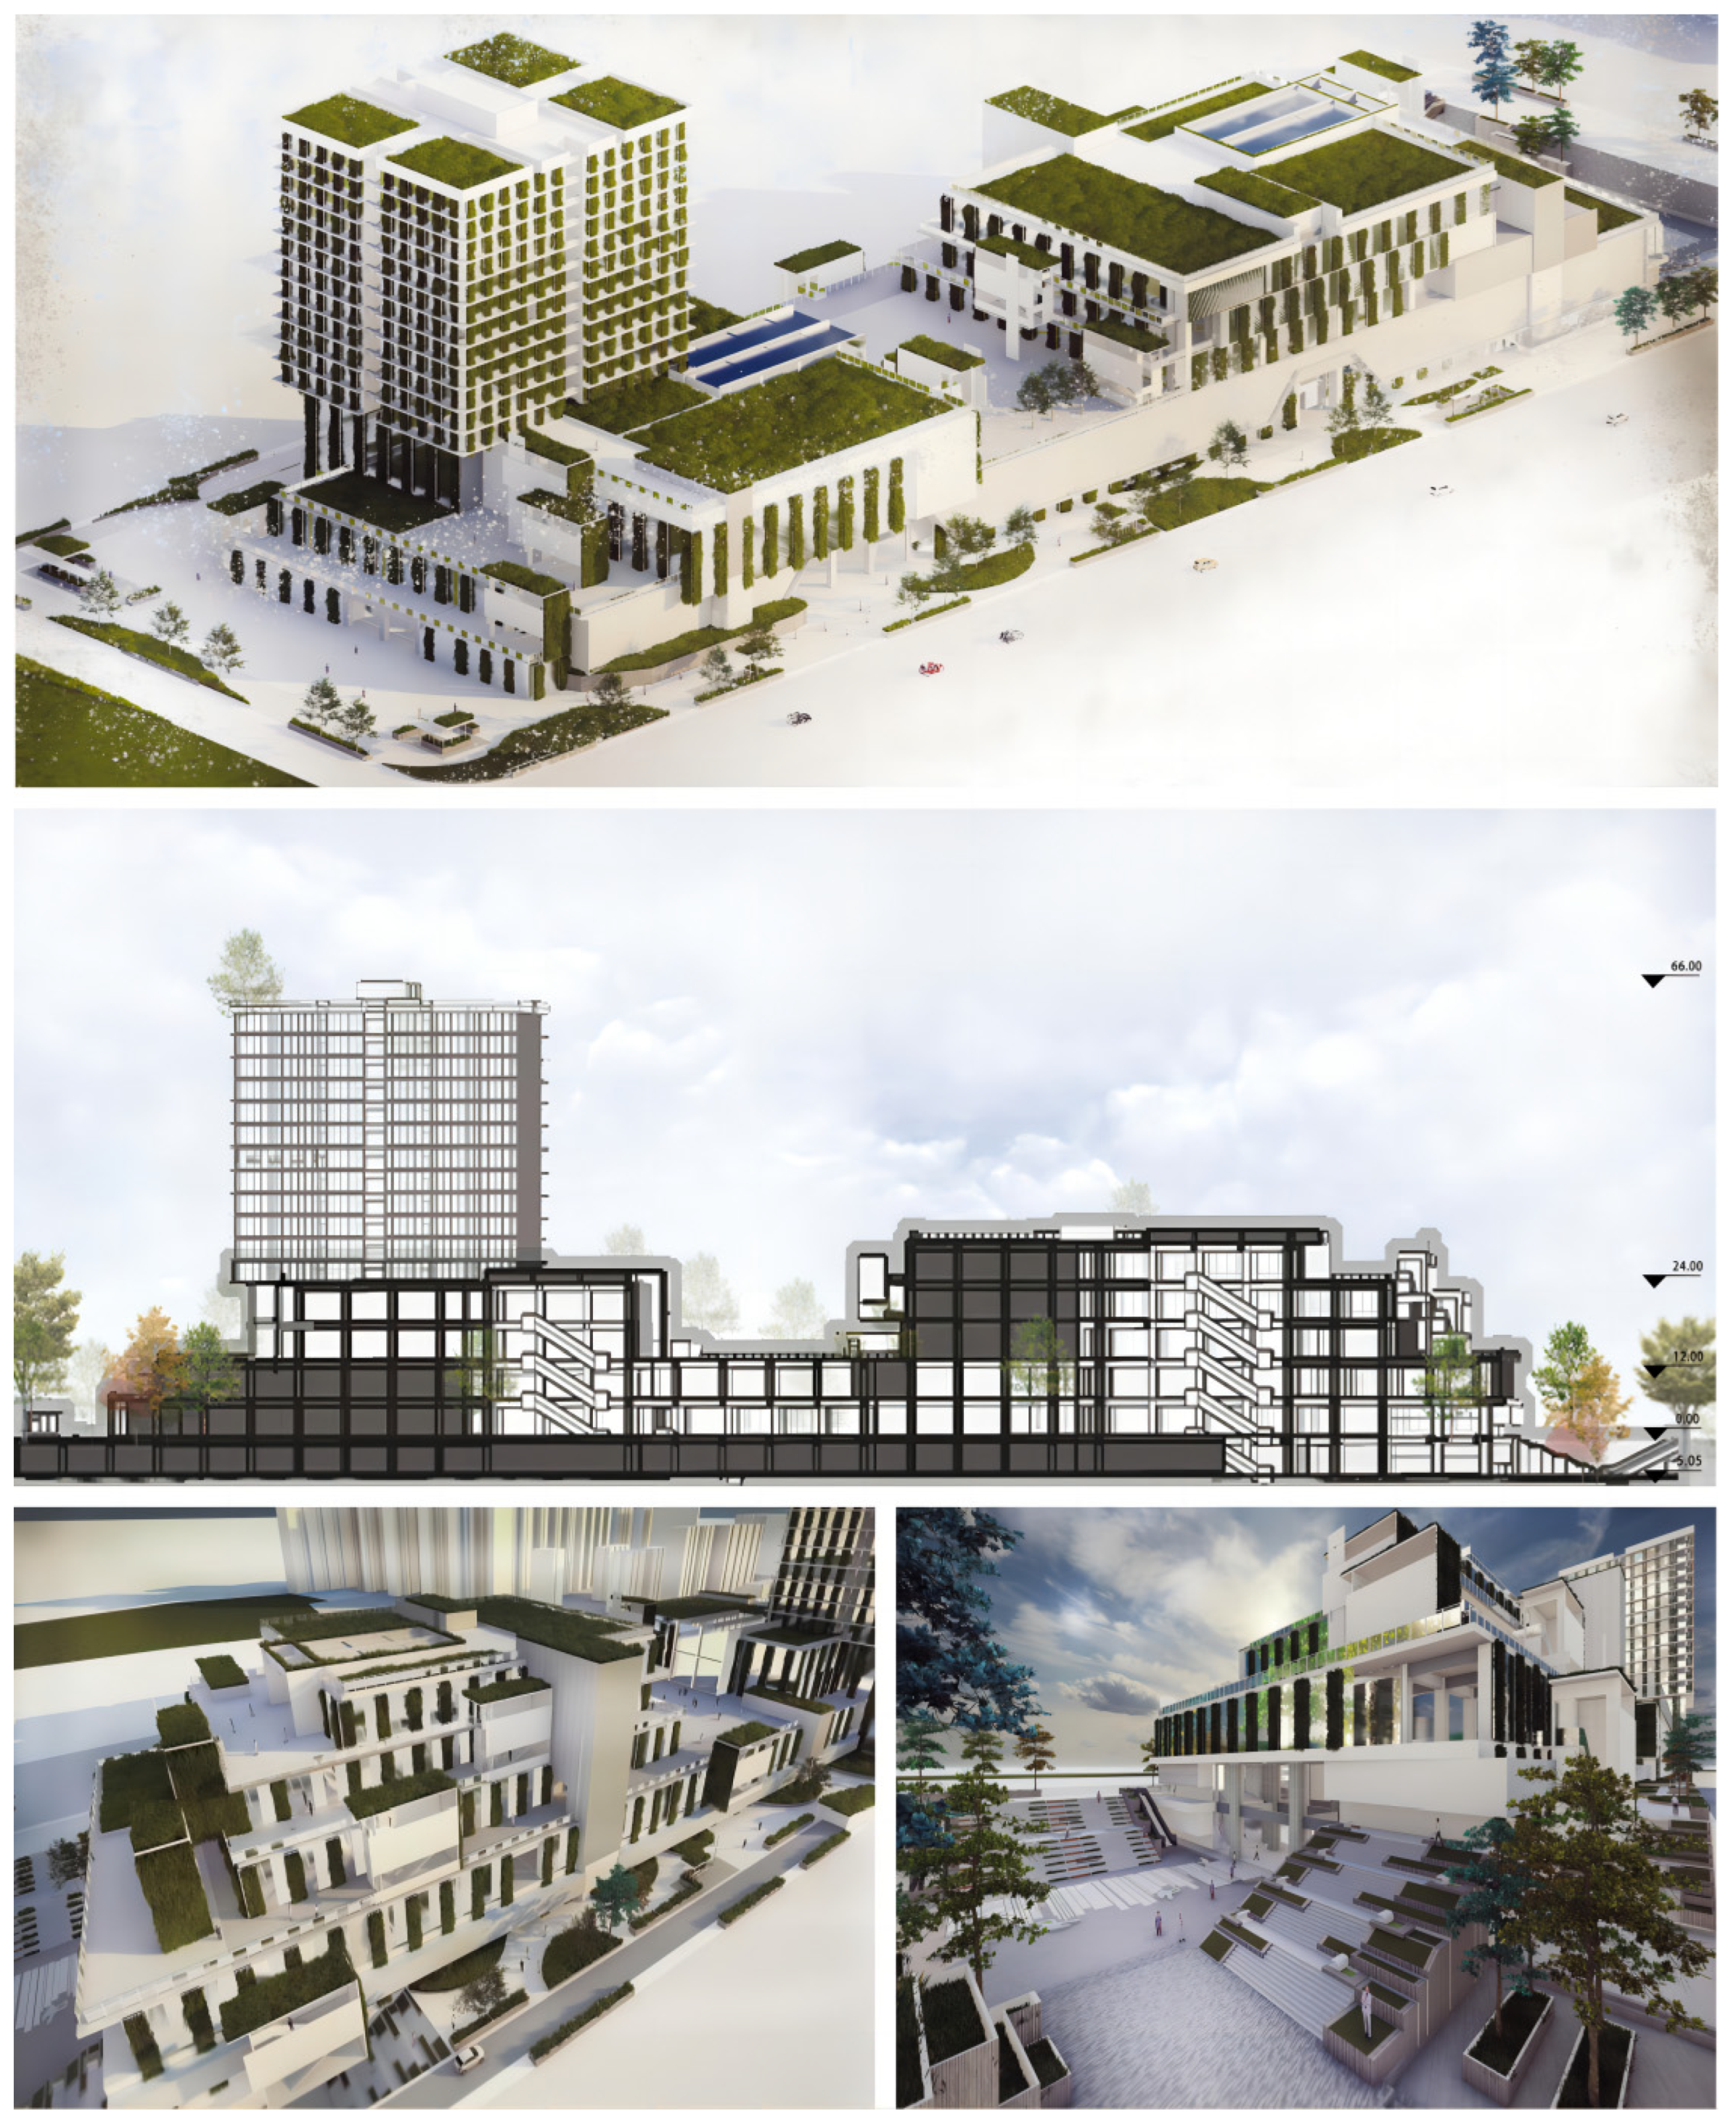
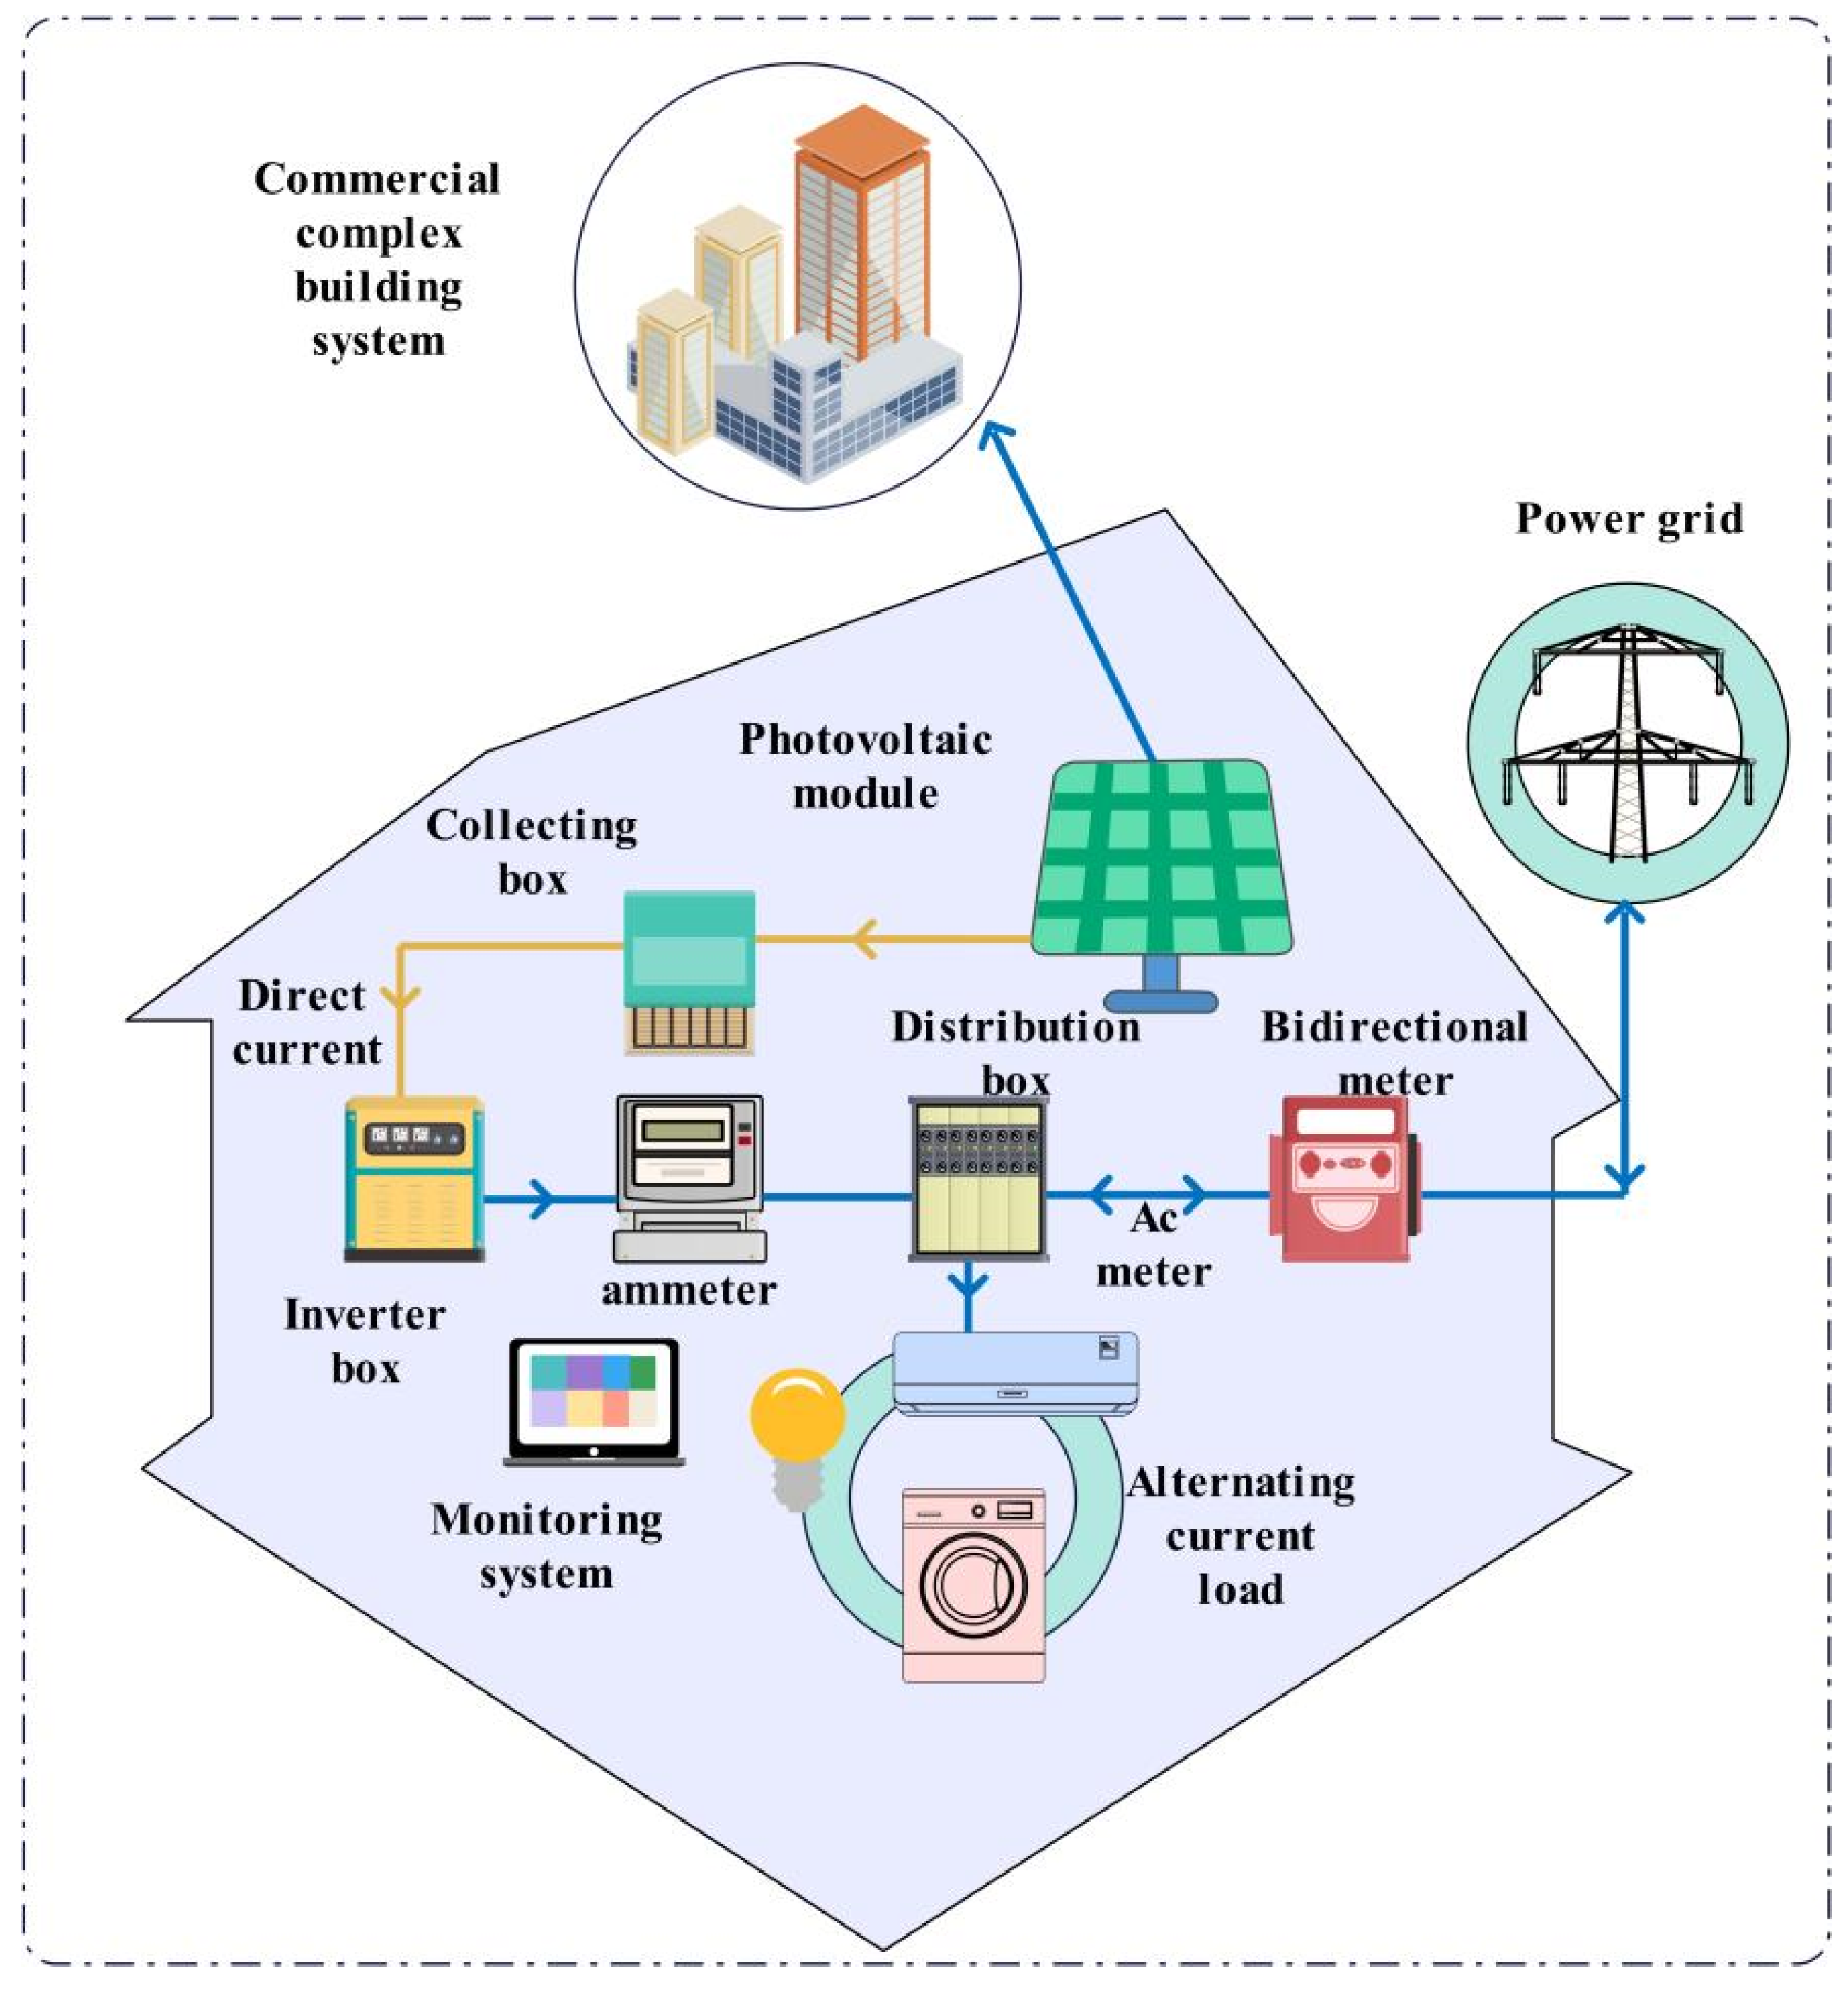
The building in question is a renovation project that aims to transform and enhance its functionality. Due to its age of over 25 years, the exterior of the building has deteriorated significantly and no longer meets the requirements for commercial activities. Moreover, the excessive hardscape elements within the complex have disturbed the ecological balance and hindered integration with the surrounding environment. The updated design of the building incorporates the following features: a green coverage ratio of 72%, a building footprint of approximately 14,000 square meters, and a total area of around 56,100 square meters.
The design concept focuses on creating a sustainable commercial complex that integrates seamlessly with the natural environment and topography. The eastern part of the landscape includes a hotel and commercial terraces, while the southern section, facing a planned residential area, is designed as a terrace to provide an unobstructed view. Considering the blocked view from the northern community center, the commercial floors are connected by corridors that include vertical transportation modules. Additionally, the entire building incorporates eco-friendly design elements such as an ecological curtain wall, rooftop gardens, and sunken ecological plazas (refer to Figure 3).

3.2. Date Collection

The data required for the entire study can be classified into two categories.
Firstly, the basic data can be obtained from construction manufacturers. These data include material lists, transportation input lists, and labor input data.
Secondly, emergy conversion rates can be found in the relevant research literature, while carbon emission factor data can be obtained from the Intergovernmental Panel on Climate Change (IPCC).
The carbon emission factor is derived from the emission coefficient method, which is widely recognized as one of the most commonly used methods for carbon emission accounting. It quantifies the production of greenhouse gases associated with the consumption per unit of substance. In the construction industry, three types of carbon emission factors are commonly utilized: fossil energy carbon emission factor, electric power carbon emission factor, and building material carbon emission factor.

4. Results and Discussion

4.1. LCA–Emergy Analysis

4.1.1. Dominated Contributor

According to the calculated emergy for the five stages in the building system, the operational stage has the highest emergy value (calculated based on a 25-year operation period), which is 7.92 × 10¹⁹ sej. The next highest emergy value is in the building materials production stage, which is 3.45 × 10¹⁹ sej. The construction stage has an emergy value of 1.27 × 10¹⁹ sej, followed by the building materials transportation stage with 7.31 × 10¹⁷ sej, and finally, the building demolition stage with an emergy value of 2.86 × 10¹⁶ sej. From calculated emergy, it can be observed that the operational stage of the building has the highest emergy and holds the most significant position. As the building’s lifespan increases, the proportion of emergy consumed during the operational stage will gradually increase. Following that is the emergy consumption during the building materials production stage, construction stage, building materials transportation stage, and building demolition stage.
With the increase of the building service life cycle, the proportion of emergy in each stage changes. In Figure 4, three time points of 25 years, 35 years, and 50 years are selected for the building’s service life cycle. It can be clearly seen that with the increase of the service life cycle, the proportion of emergy value in the operational stage of the building significantly increases, with an increase of 8.37% and 24.9%, respectively. The proportions of emergy value in the other four stages decrease to a certain extent, especially in the material production stage and construction stage.
The unit emergy value reference can be found in the literature [19].

4.1.2. Sustainable Renewal Strategy

There are three categories of upgrading strategies focusing on a sustainable goal. Design strategy A revolves around green vegetation, including measures such as vertical landscape walls, rooftop gardens, and sunken plaza gardens. Design strategy B emphasizes equipment upgrades, such as adding solar photovoltaic power generation devices, rainwater collection systems, heat pump technology utilization, and updating the fresh air system. Design strategy C aims to improve the spatial performance of the building complex, involving the replacement of energy-saving walls and the use of storage walls change, etc.
By implementing the sustainable upgrading measures mentioned above, we can carry out emergy calculations for each category of measures and calculate various indicators such as Emergy yield ratio (EYR), Environmental loading ratio (ELR), and Emergy sustainability indicator (ESI) to analyze the effectiveness of the sustainability improvement measures.
Figure 5 presents the changes in the three primary sustainability indicators after implementing the sustainable measures. Taking EYR as an example, the highest EYR is achieved by strategy A + B + C (158), followed by strategy A, and the lowest values are for strategies B and C (70). Considering ELR, the combined measures of strategies A + B + C have the greatest impact on the environment (210), followed by strategies C and B, while strategy A has the smallest impact (78). This is because the addition of green landscapes has fewer environmental side effects, while modifications involving equipment and walls have a greater environmental impact. The final ranking of the ESI indicator is as follows: strategy A, strategy (A + B + C), strategy C, and strategy B, with values of 1.05, 0.75, 0.68, and 0.55 (all below the value of 1 indicate unsatisfactory results). The analysis of improvement strategies reveals that negative effects can also occur during the process of sustainable transformation in building systems, requiring special attention.

4.1.3. Sensitivity Analysis of Emergy View

The data collected during the operational phase will have an impact on the overall sustainability of the building system. Therefore, a sensitivity analysis is needed to assess the effects. In this study, four assumptions were considered, involving a 5%, −5%, 8%, and −8% fluctuation in the base data. The impacts on the EYR, ELR, and ESI indicators were analyzed to further assess the sustainability.
The collected base data includes five building operational subsystems: water supply and wastewater treatment, HVAC systems, power systems, Telecommunications systems, and elevator systems.
Figure 6 and Figure 7 illustrate the sensitivity changes and trends in sustainability indicators (EYR, ELR, and ESI) under the four assumptions. The 5% fluctuation in emergy values is noticeably smaller than the 8% fluctuation, as clearly shown in Figure 7. From Figure 6, we can observe that the −5% (Figure 6b) and 8% (Figure 6c) sensitivity changes exhibit better consistency, followed by the −8% (Figure 6a) and 5% (Figure 6d) assumptions.
In terms of the specific magnitude of changes, for the −8% and −5% assumptions, ELR shows the highest variation, with 6.1% and 4.6%, respectively. For the 8% assumption, the largest variation is observed in ESI, with a change of 6.5%. As for the 5% assumption, EYR shows the highest variation, with a change of 4.2%.
Through the sensitivity analysis, we can determine the range of variation in indicators. A larger fluctuation range may indicate that the indicator is more sensitive to input data, and the reliability of its results may be compromised. This reminds us of the need to collect and process data more accurately.
Sensitivity analysis also allows decision-makers to understand the impact of different decision scenarios on indicators. The analysis can help decision-makers make wiser decisions to maximize sustainability and reduce uncertainty.
Due to the large amount of data involved in this study, sensitivity analysis is conducted to ensure the stability of key indicators. Sensitivity analysis can help validate the reliability of the model. By observing the impact of different values of input variables, we can determine how the model performs under different circumstances and whether improvements are needed. At the same time, sensitivity analysis can enhance readers’ confidence in the results of this study.

4.2. LCA–Carbon Emission Analysis

The carbon emissions of the five stages have also been calculated to demonstrate the distribution of carbon emissions in the entire building system and then determine the carbon emissions of key stages in order to provide a basis for carbon reduction. The carbon emission factors for this section can be referred to in reference [44].

4.2.1. The Carbon Emission of the Building Material Production Stage

In the materials production phase (Figure 8), there are 14 main building materials, ranked by their carbon emissions, namely cement, iron, steel, glass, gravel, water, lime, wood, brick, aluminum, polyester, ceramic tile, polyester, and PVC. The building materials with higher carbon emissions are typically heavy industrial products that require integrated inputs. These materials have high input requirements in terms of energy and resources, leading to a larger carbon footprint.
Please refer to Appendix A (Table A1) for the detailed calculation process.

4.2.2. The Carbon Emission of Building Construction Stage

Figure 9 shows the carbon emissions distribution of six construction subsystems. It is clear that the E subsystem (Telecommunications system) has the highest carbon emissions, accounting for 36% of the total building construction emissions. The B subsystem (Water supply and sewage system treatment facilities) comes next, occupying 22%. The A subsystem (Labor and service) accounts for 21%. The F subsystem (Elevator system) contributes 9% to the emissions. Both the D subsystem (Electricity installations) and the C subsystem (Heating and cooling systems) contribute 6% each.
Figure 10 illustrates the carbon emissions contributions of elements within each subsystem. Taking the largest contributor for each subsystem as an example, for the A subsystem, machinery diesel is identified as the primary influencing factor. In the B subsystem, steel has significantly higher carbon emissions compared to the other 12 items. Diesel fuel is the main carbon emissions contributor in the C subsystem. Steel contributes significantly to the carbon emissions in the D subsystem. Aluminum products are the key carbon emitters in the E subsystem. Diesel fuel controls the major carbon emissions output in the F subsystem.
Please refer to Appendix A (Table A2) for the detailed calculation process.

4.2.3. The Carbon Emission in the Building Operation Stage

During the operational phase of the building, data collection focuses on the electricity, heat, and water. The carbon emission calculations of a 25-year period are presented in Figure 11. The figure clearly compares the contributions of these three key influencing factors. Thermal energy has the highest carbon emissions, followed by electricity, and finally, water. Based on this distribution, reducing carbon emissions should primarily focus on measures targeting thermal energy and electricity.
Please refer to Appendix A (Table A3) for the detailed calculation process.

4.2.4. The Carbon Emission in the Building Renewal Stage

The sustainable update strategy requires fundamental construction work. The collected data are shown in Appendix A Table A4. Three types of update strategy (A/B/C) are referenced in Section 4.1.2.
Figure 12 provides a preliminary analysis of carbon emissions under three types of update strategies. Strategy C has the highest carbon emissions (254 tCO2) due to the renovation of building walls, which requires a large construction effort. Strategy A follows with 184 tCO2 emissions. Lastly, strategy B has relatively lower carbon emissions because it primarily involves the installation of various equipment (this study does not consider the operational carbon emissions of new equipment at this stage).
Please refer to Appendix A (Table A4) for the detailed calculation process.

4.2.5. The Carbon Emission in the Building Demolition Stage

Figure 13 displays seven categories of carbon emissions during the building demolition phase. From the graph, it is shown that carbon emissions are ranked in descending order: glass, steel, aluminum, concrete, PVC, bricks, and diesel fuel. The study primarily focuses on building material data, with the demolition quantity calculated as 5% of the total usage of each building material. This emphasizes the importance of considering the carbon emissions of building materials in the building system.

4.2.6. LCA–Carbon Emissions Analysis

Figure 14 presents the distribution of carbon emissions across the five stages. Figure 14A illustrates the distribution of carbon emissions in each stage, where the operational stage (B3) contributes the highest amount of carbon emissions at 6.46 × 10⁵ tCO2, by surpassing the carbon emissions from the other four stages. When considering the proportion of carbon emissions from the five stages (Figure 14B), the operational stage accounts for 97.6% of the total emissions. This is because the operational phase of the building is calculated based on a 25-year period.
Please refer to Appendix A (Table A6) for the detailed calculation process.

4.2.7. Sensitivity Analysis of Carbon Emissions View

The carbon emissions during the operational stage are the highest and are considered the main influencing factor. Among them, electricity and thermal energy are key input factors. This study implements the sensitivity analysis based on these two variables. The four assumptions are a 5% change in electricity data leading to carbon emissions variation, a 10% fluctuation in electricity data causing changes in carbon emissions, a 5% variation in thermal energy resulting in carbon emissions changes, and a 10% modification in thermal energy leading to changes in carbon emissions.
Figure 15 illustrates the sensitive changes in carbon emissions caused by the four assumptions. Therein, a 10% variation in thermal energy leads to a significant fluctuation of 11.8% in carbon emissions, which is much higher than the other three categories. This is because thermal energy has the most significant control over carbon emissions. The next highest sensitivity is observed for a 10% variation in electricity, resulting in a 7.29% change in carbon emissions. The remaining sensitivities are 6.31% for a 5% variation in thermal energy and 4.82% for a 5% variation in electricity. Considering the high sensitivity of electricity and thermal energy during the operational stage of the building, it is crucial to ensure the accuracy and reliability of data collection to minimize errors in research results.

5. The Comprehensive Analysis Based on LCA–Emergy and LCA–Carbon Emission

In this chapter, both the emergy and carbon emissions perspectives were analyzed for the same building system to understand their similarities and differences. The findings are as follows:
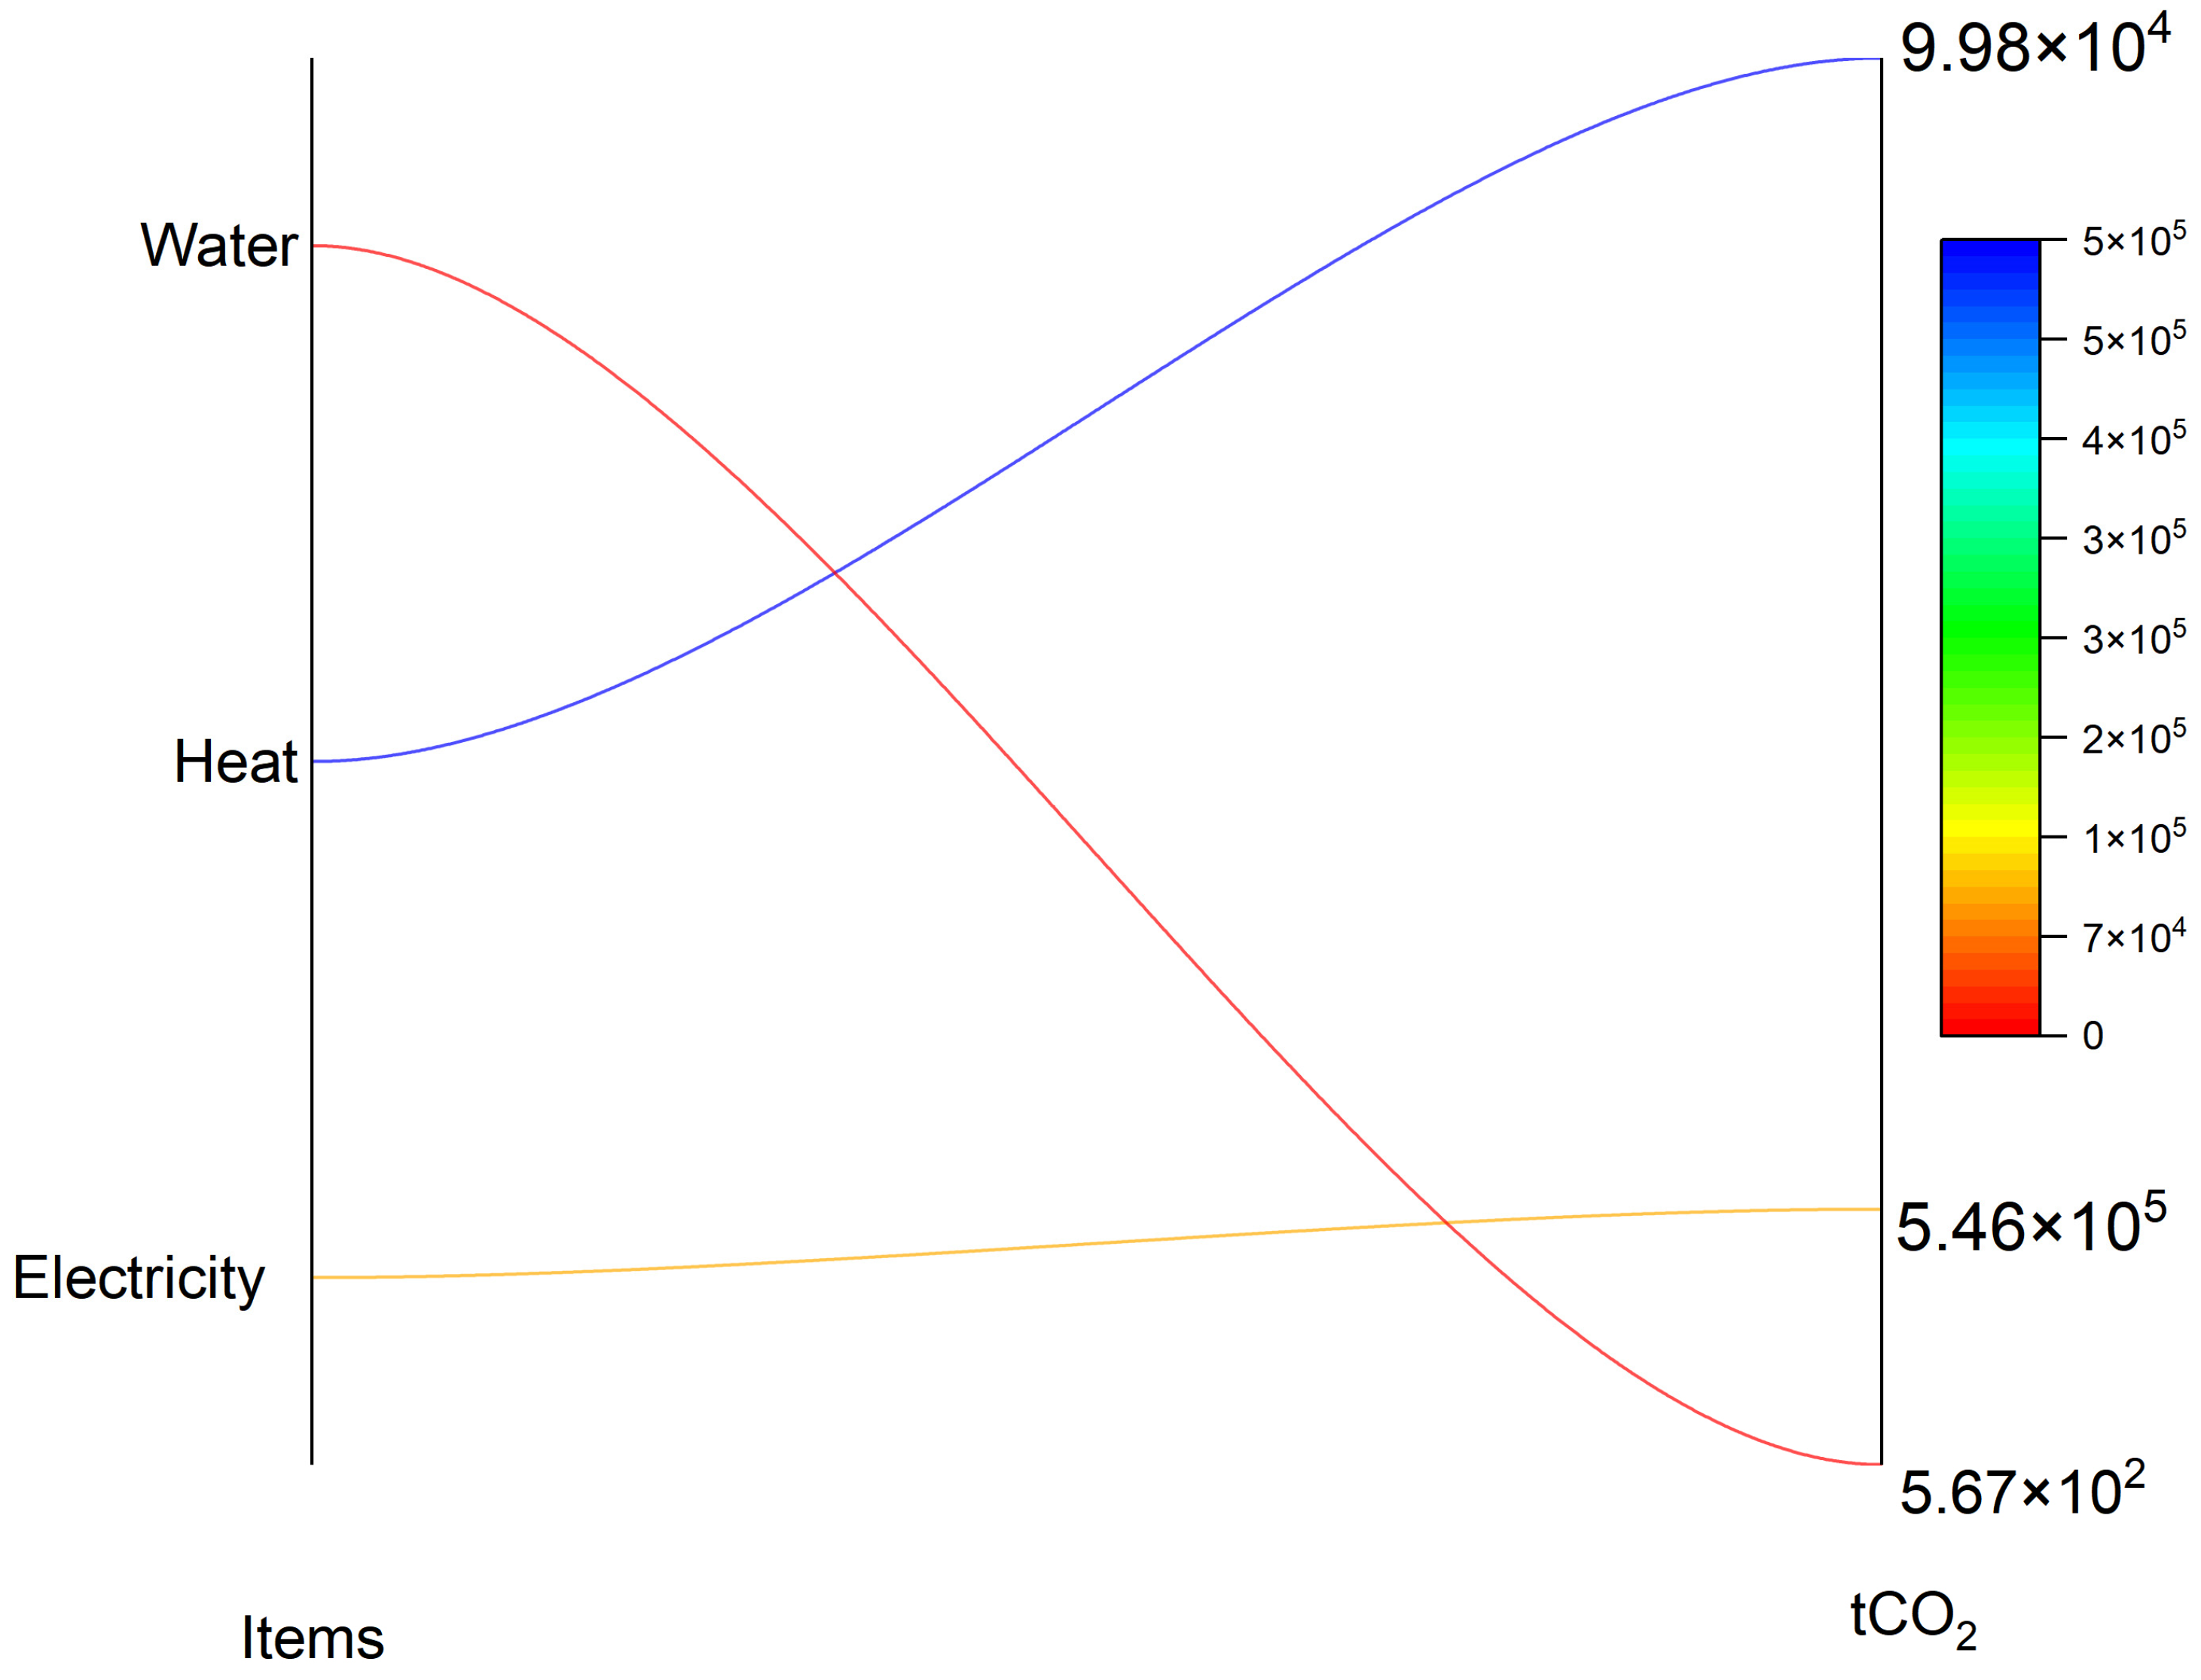
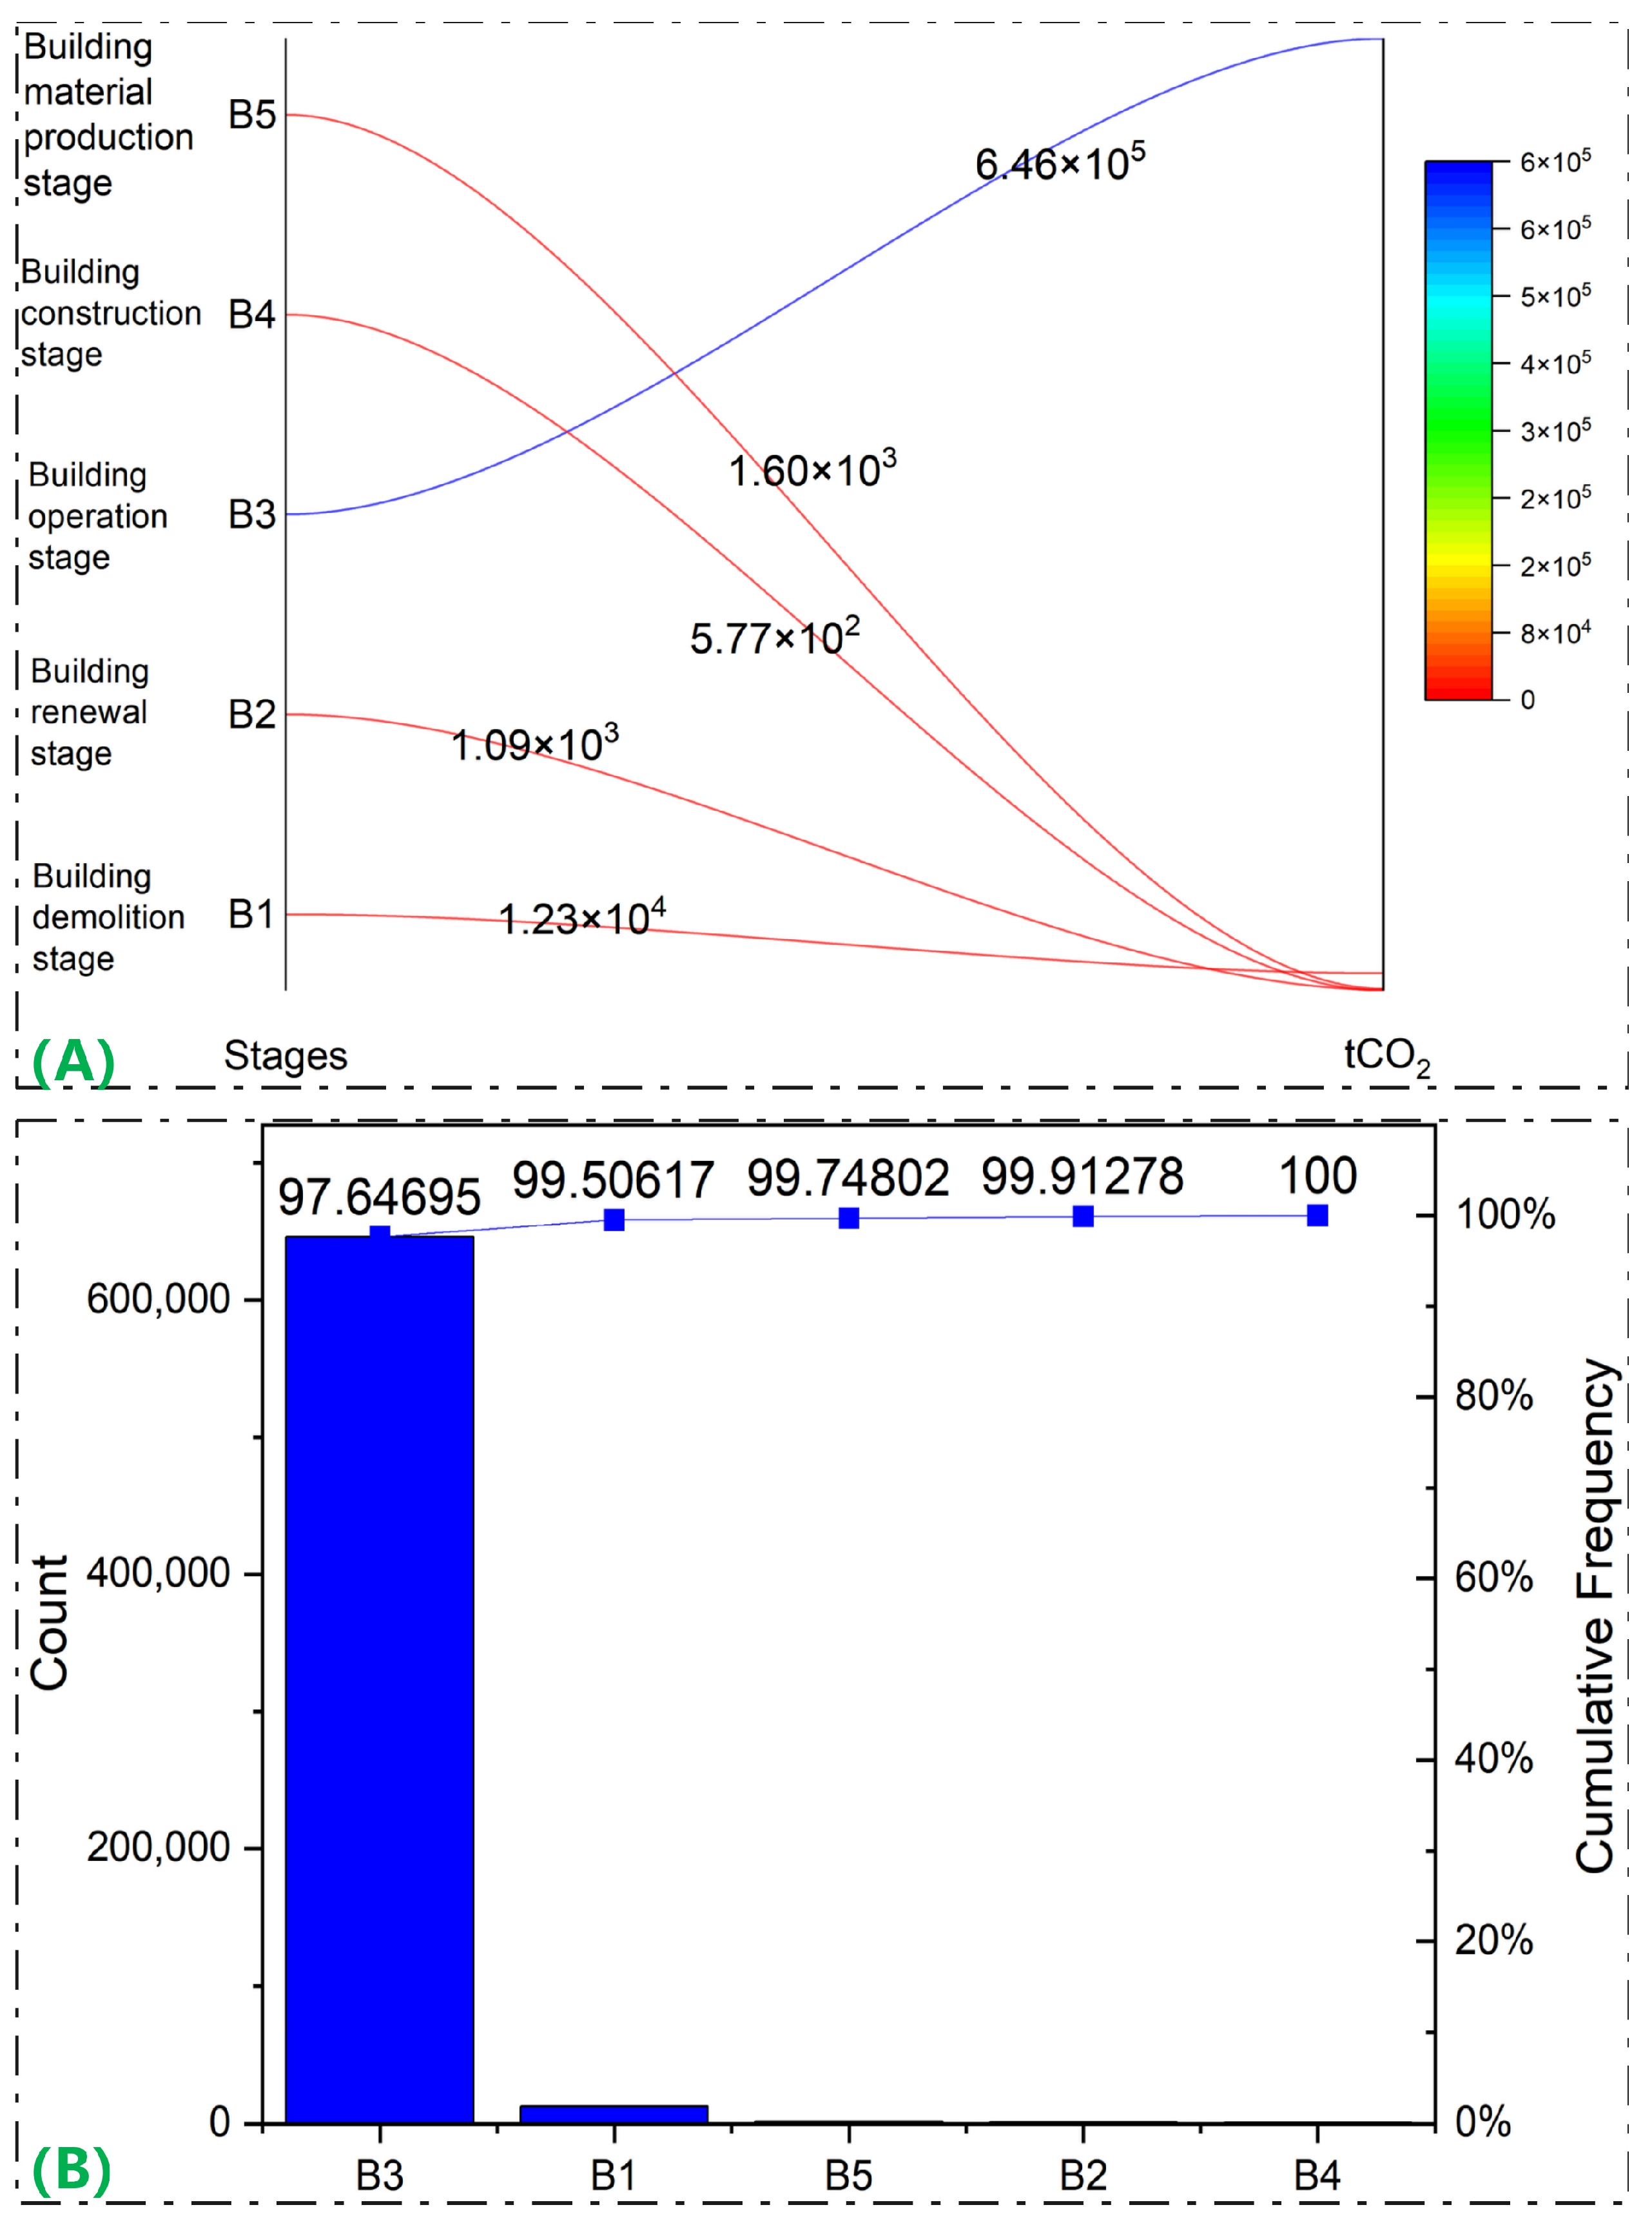
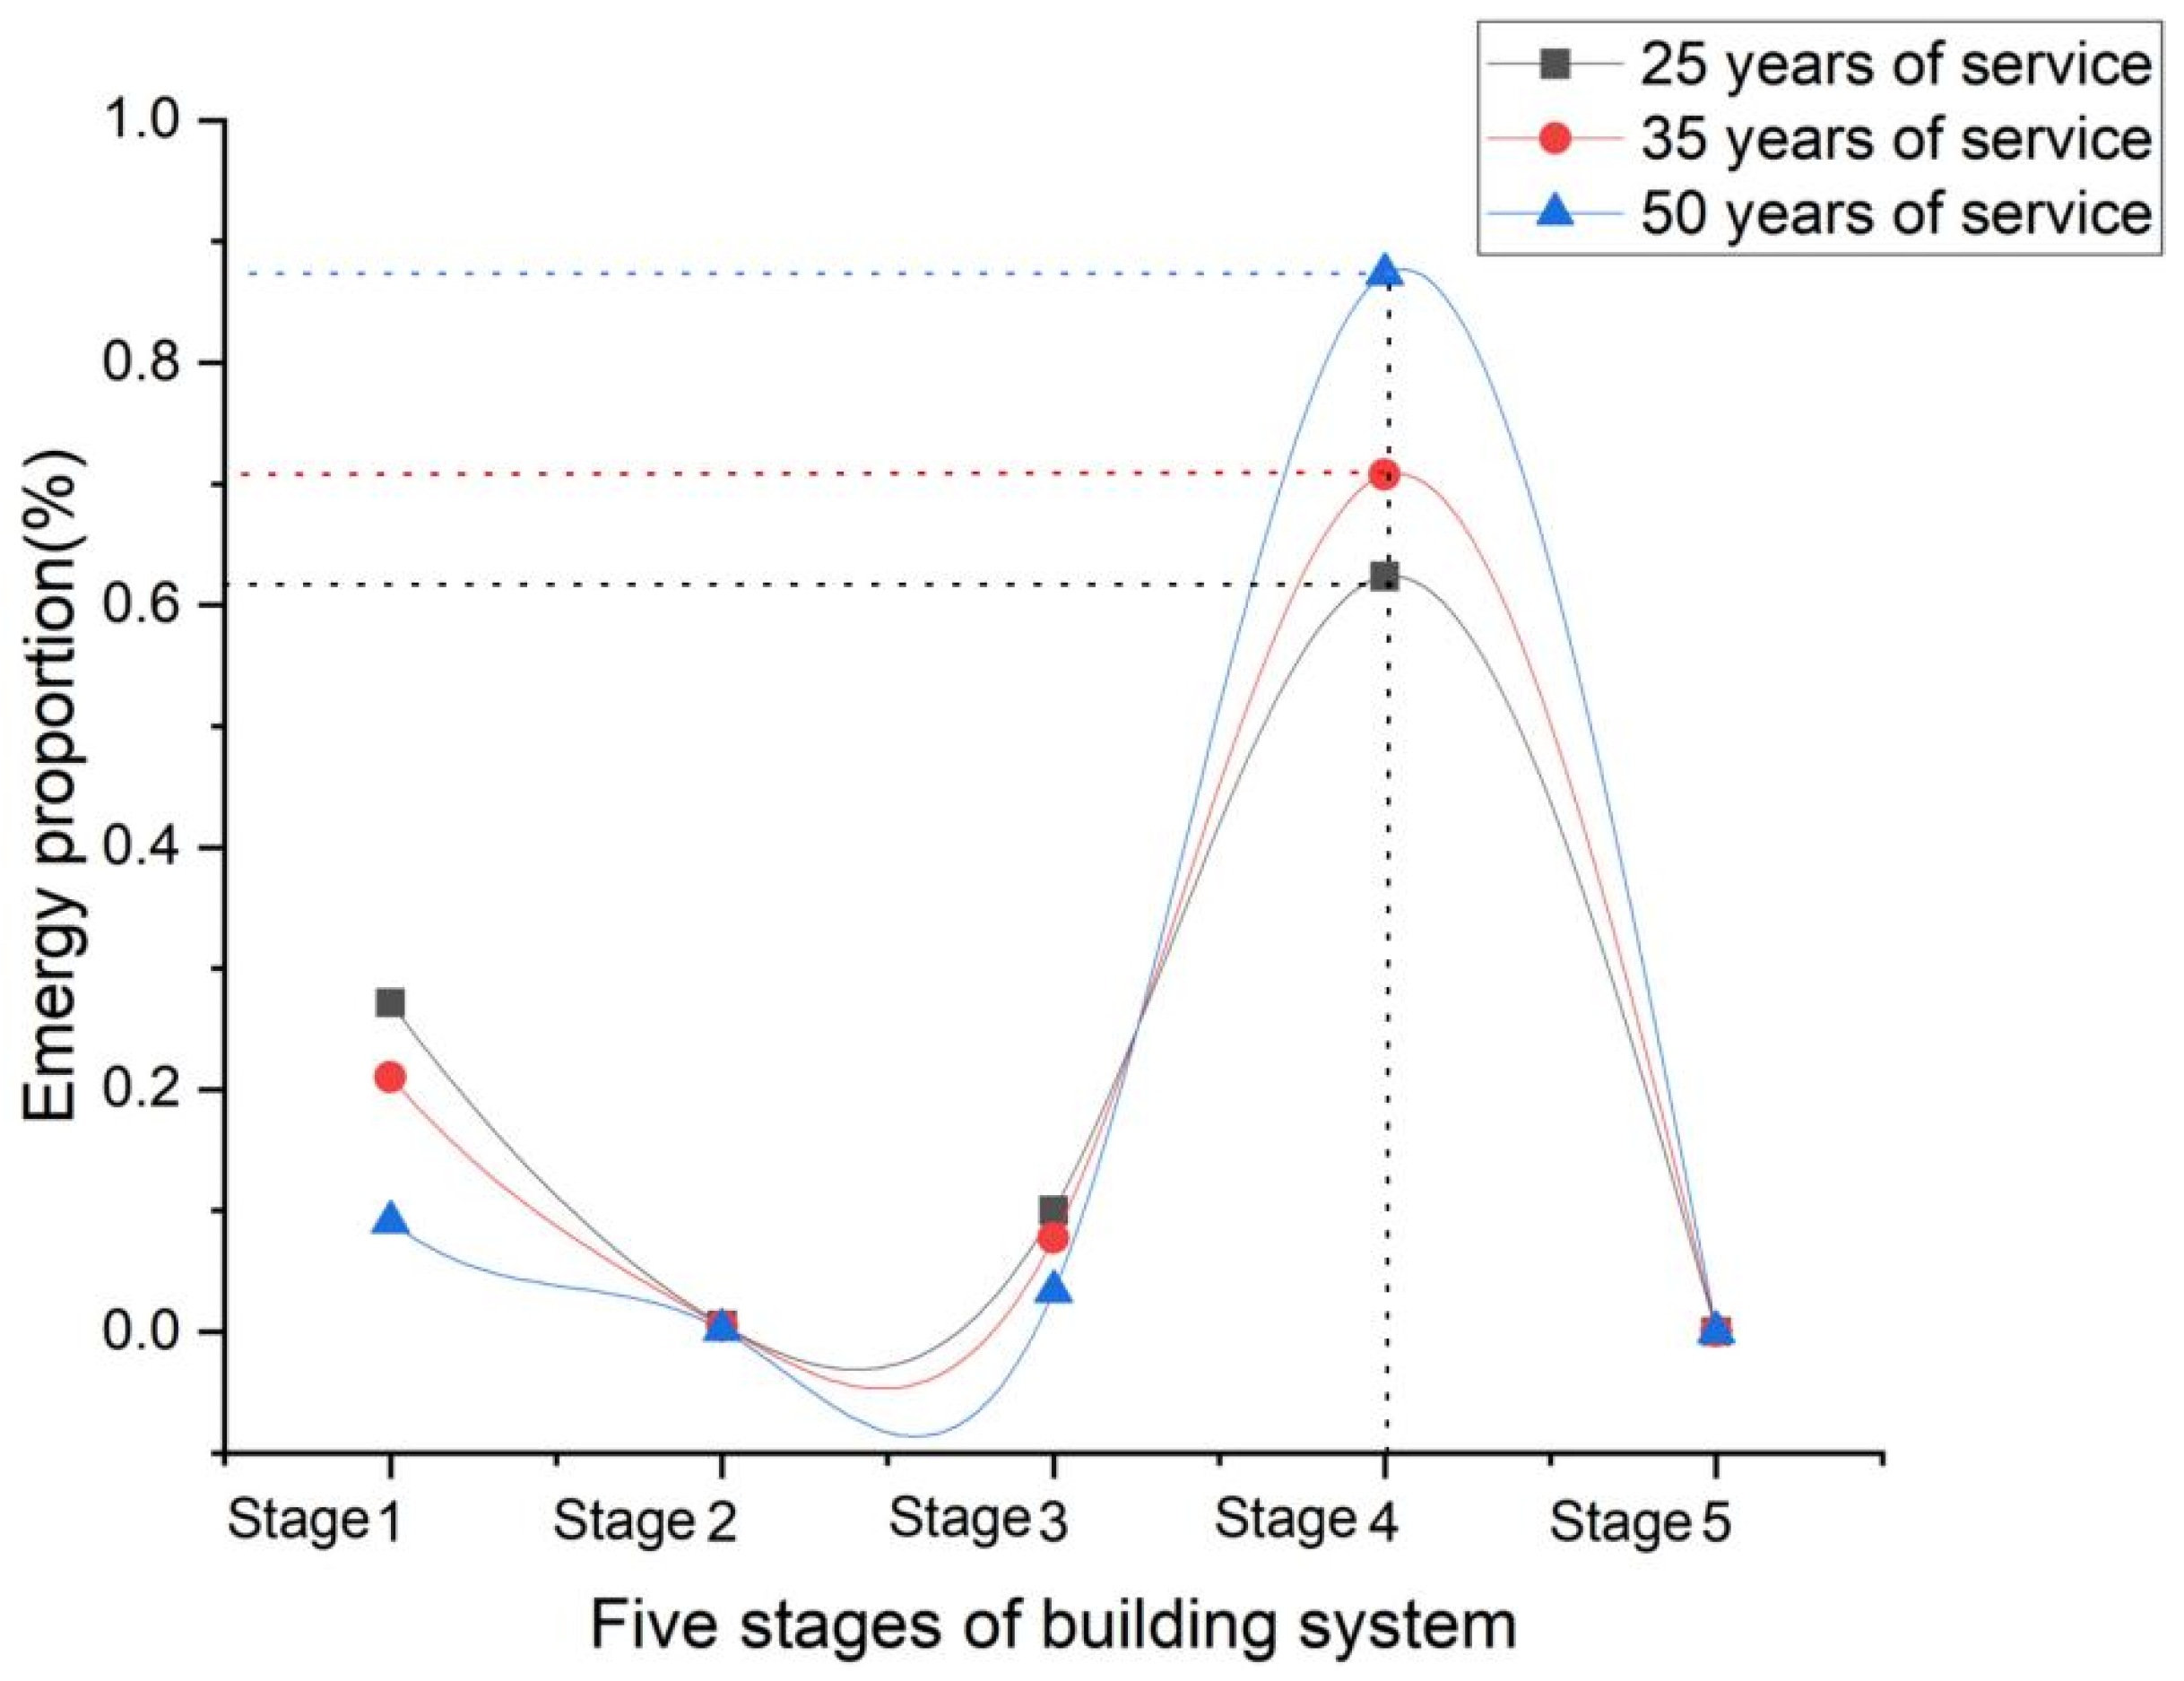
Similar conclusions: Regardless of the perspective, whether it is emergy or carbon emissions, the operational stage of the building system and the building materials production stage are the main controlling factors. These two stages contribute to a significant portion of the emergy consumption and carbon emissions throughout the entire life cycle of the building system and therefore require focused attention and research.
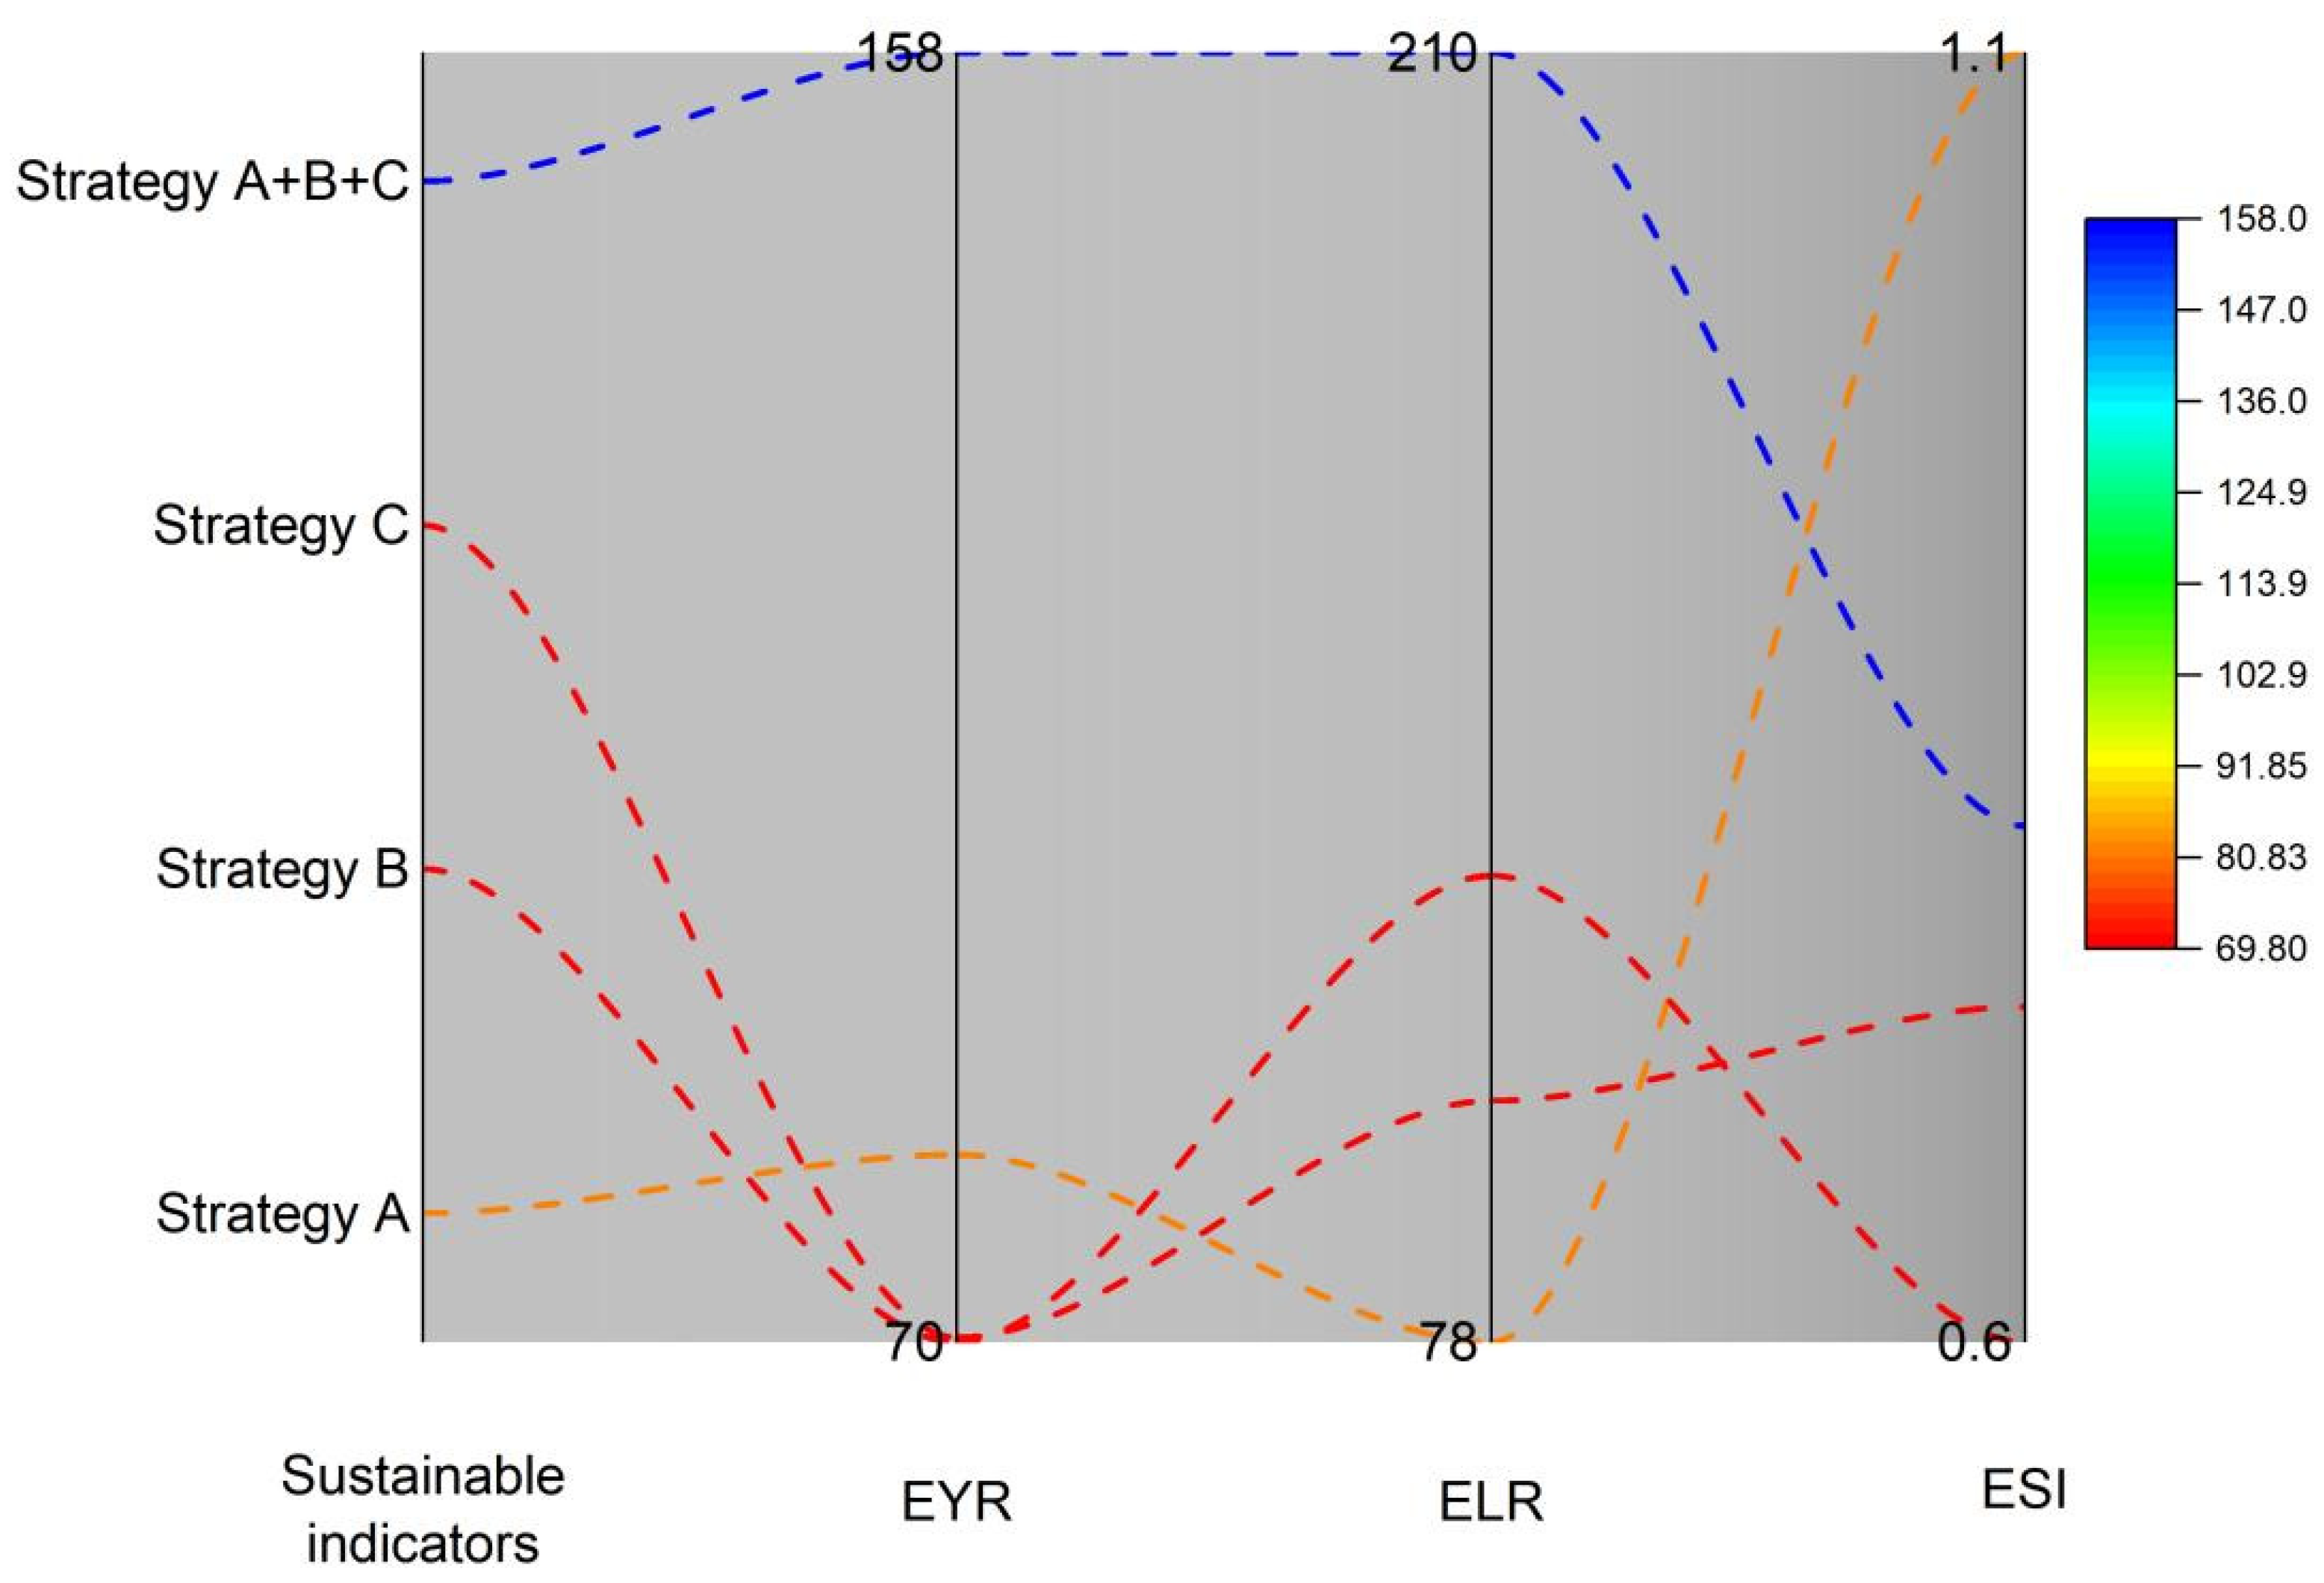
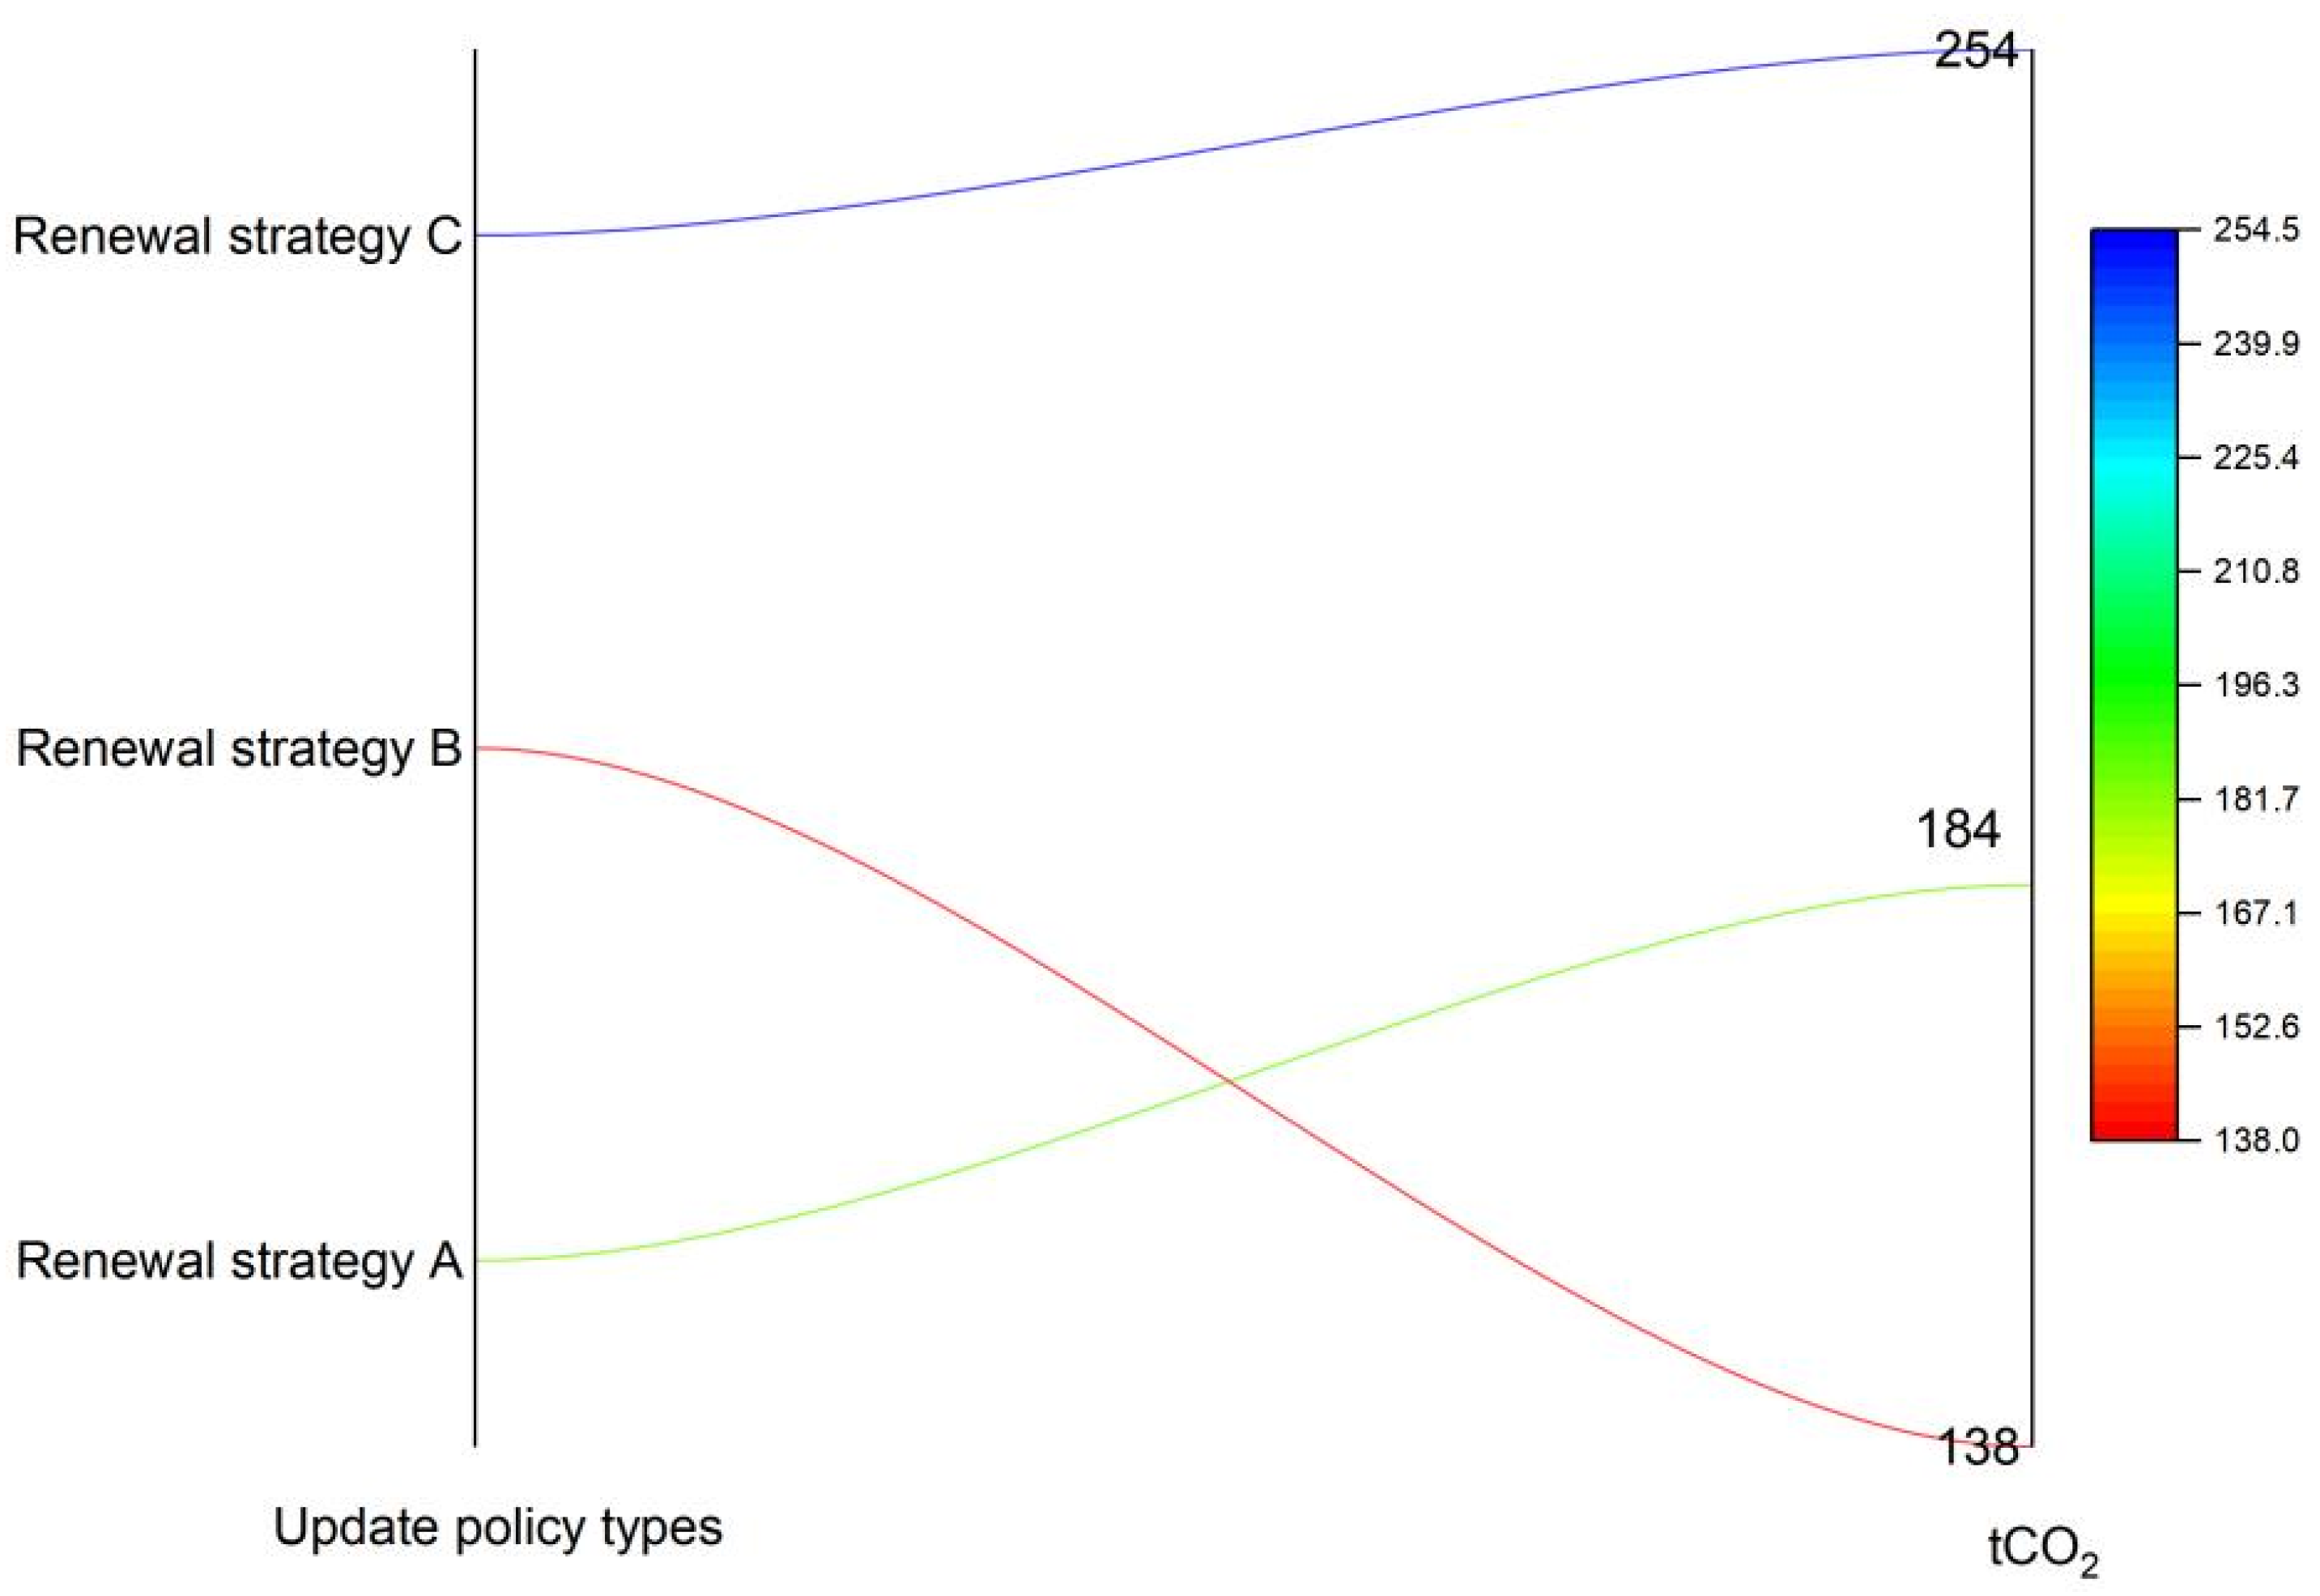
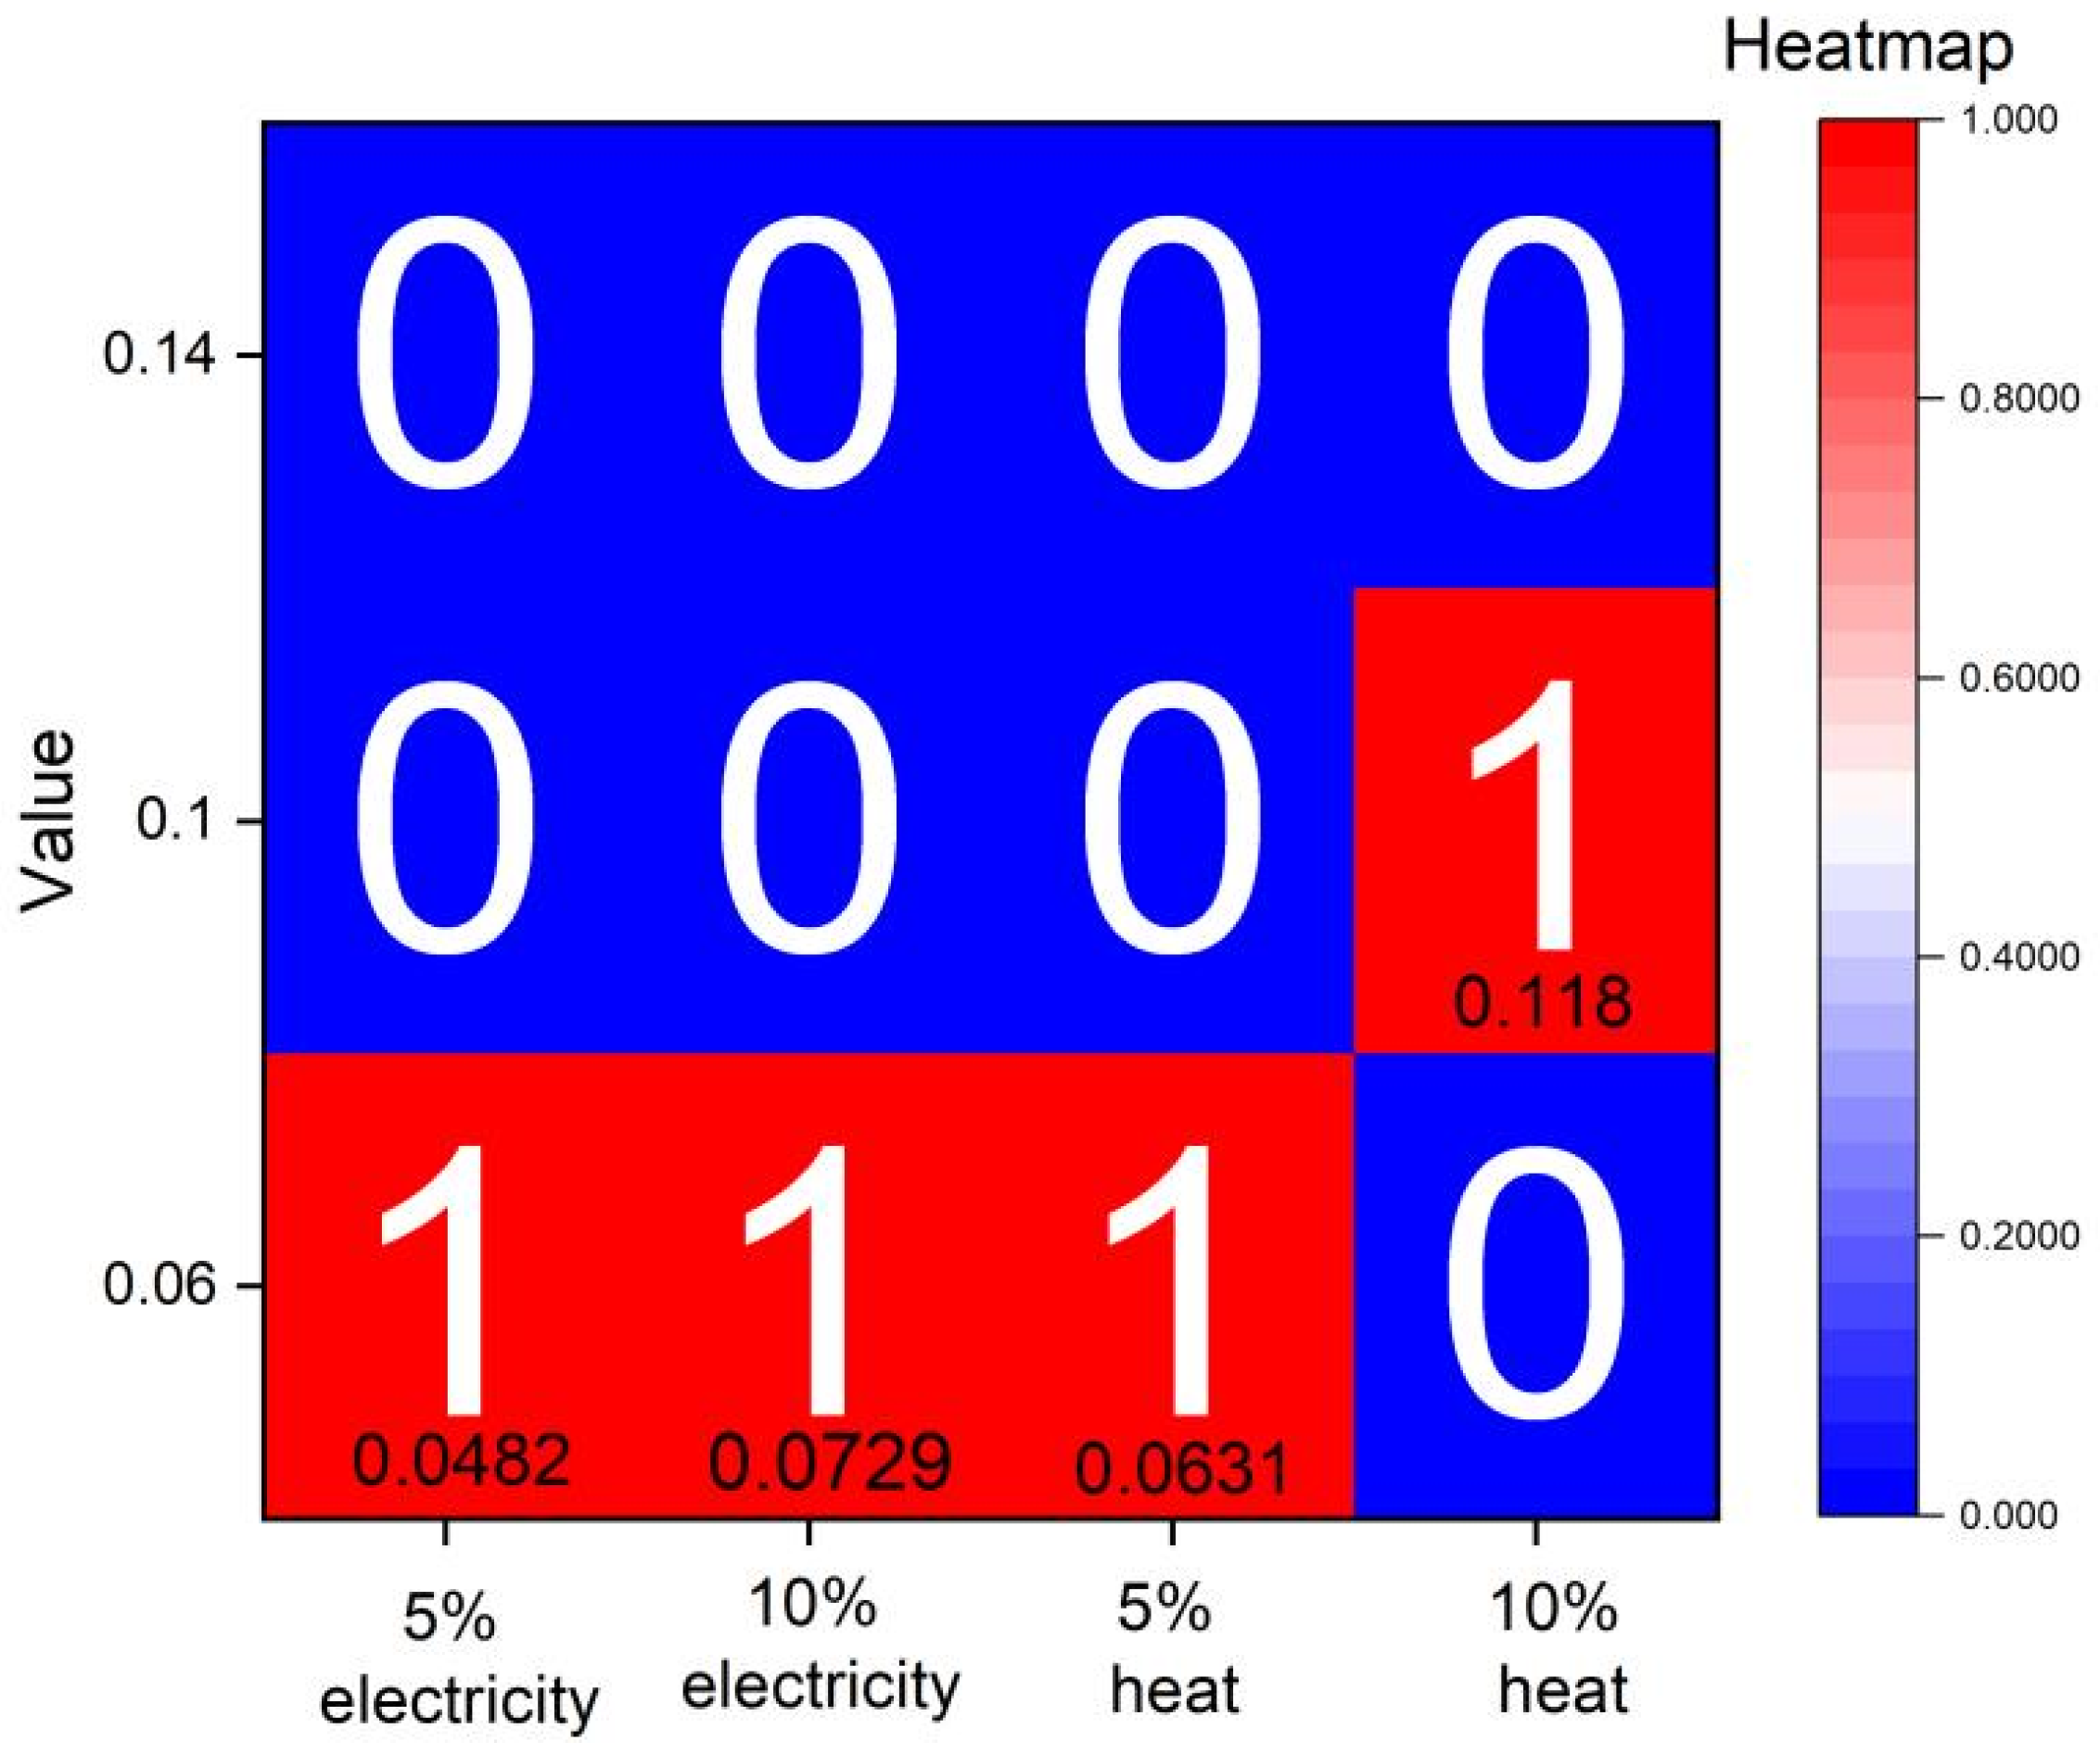
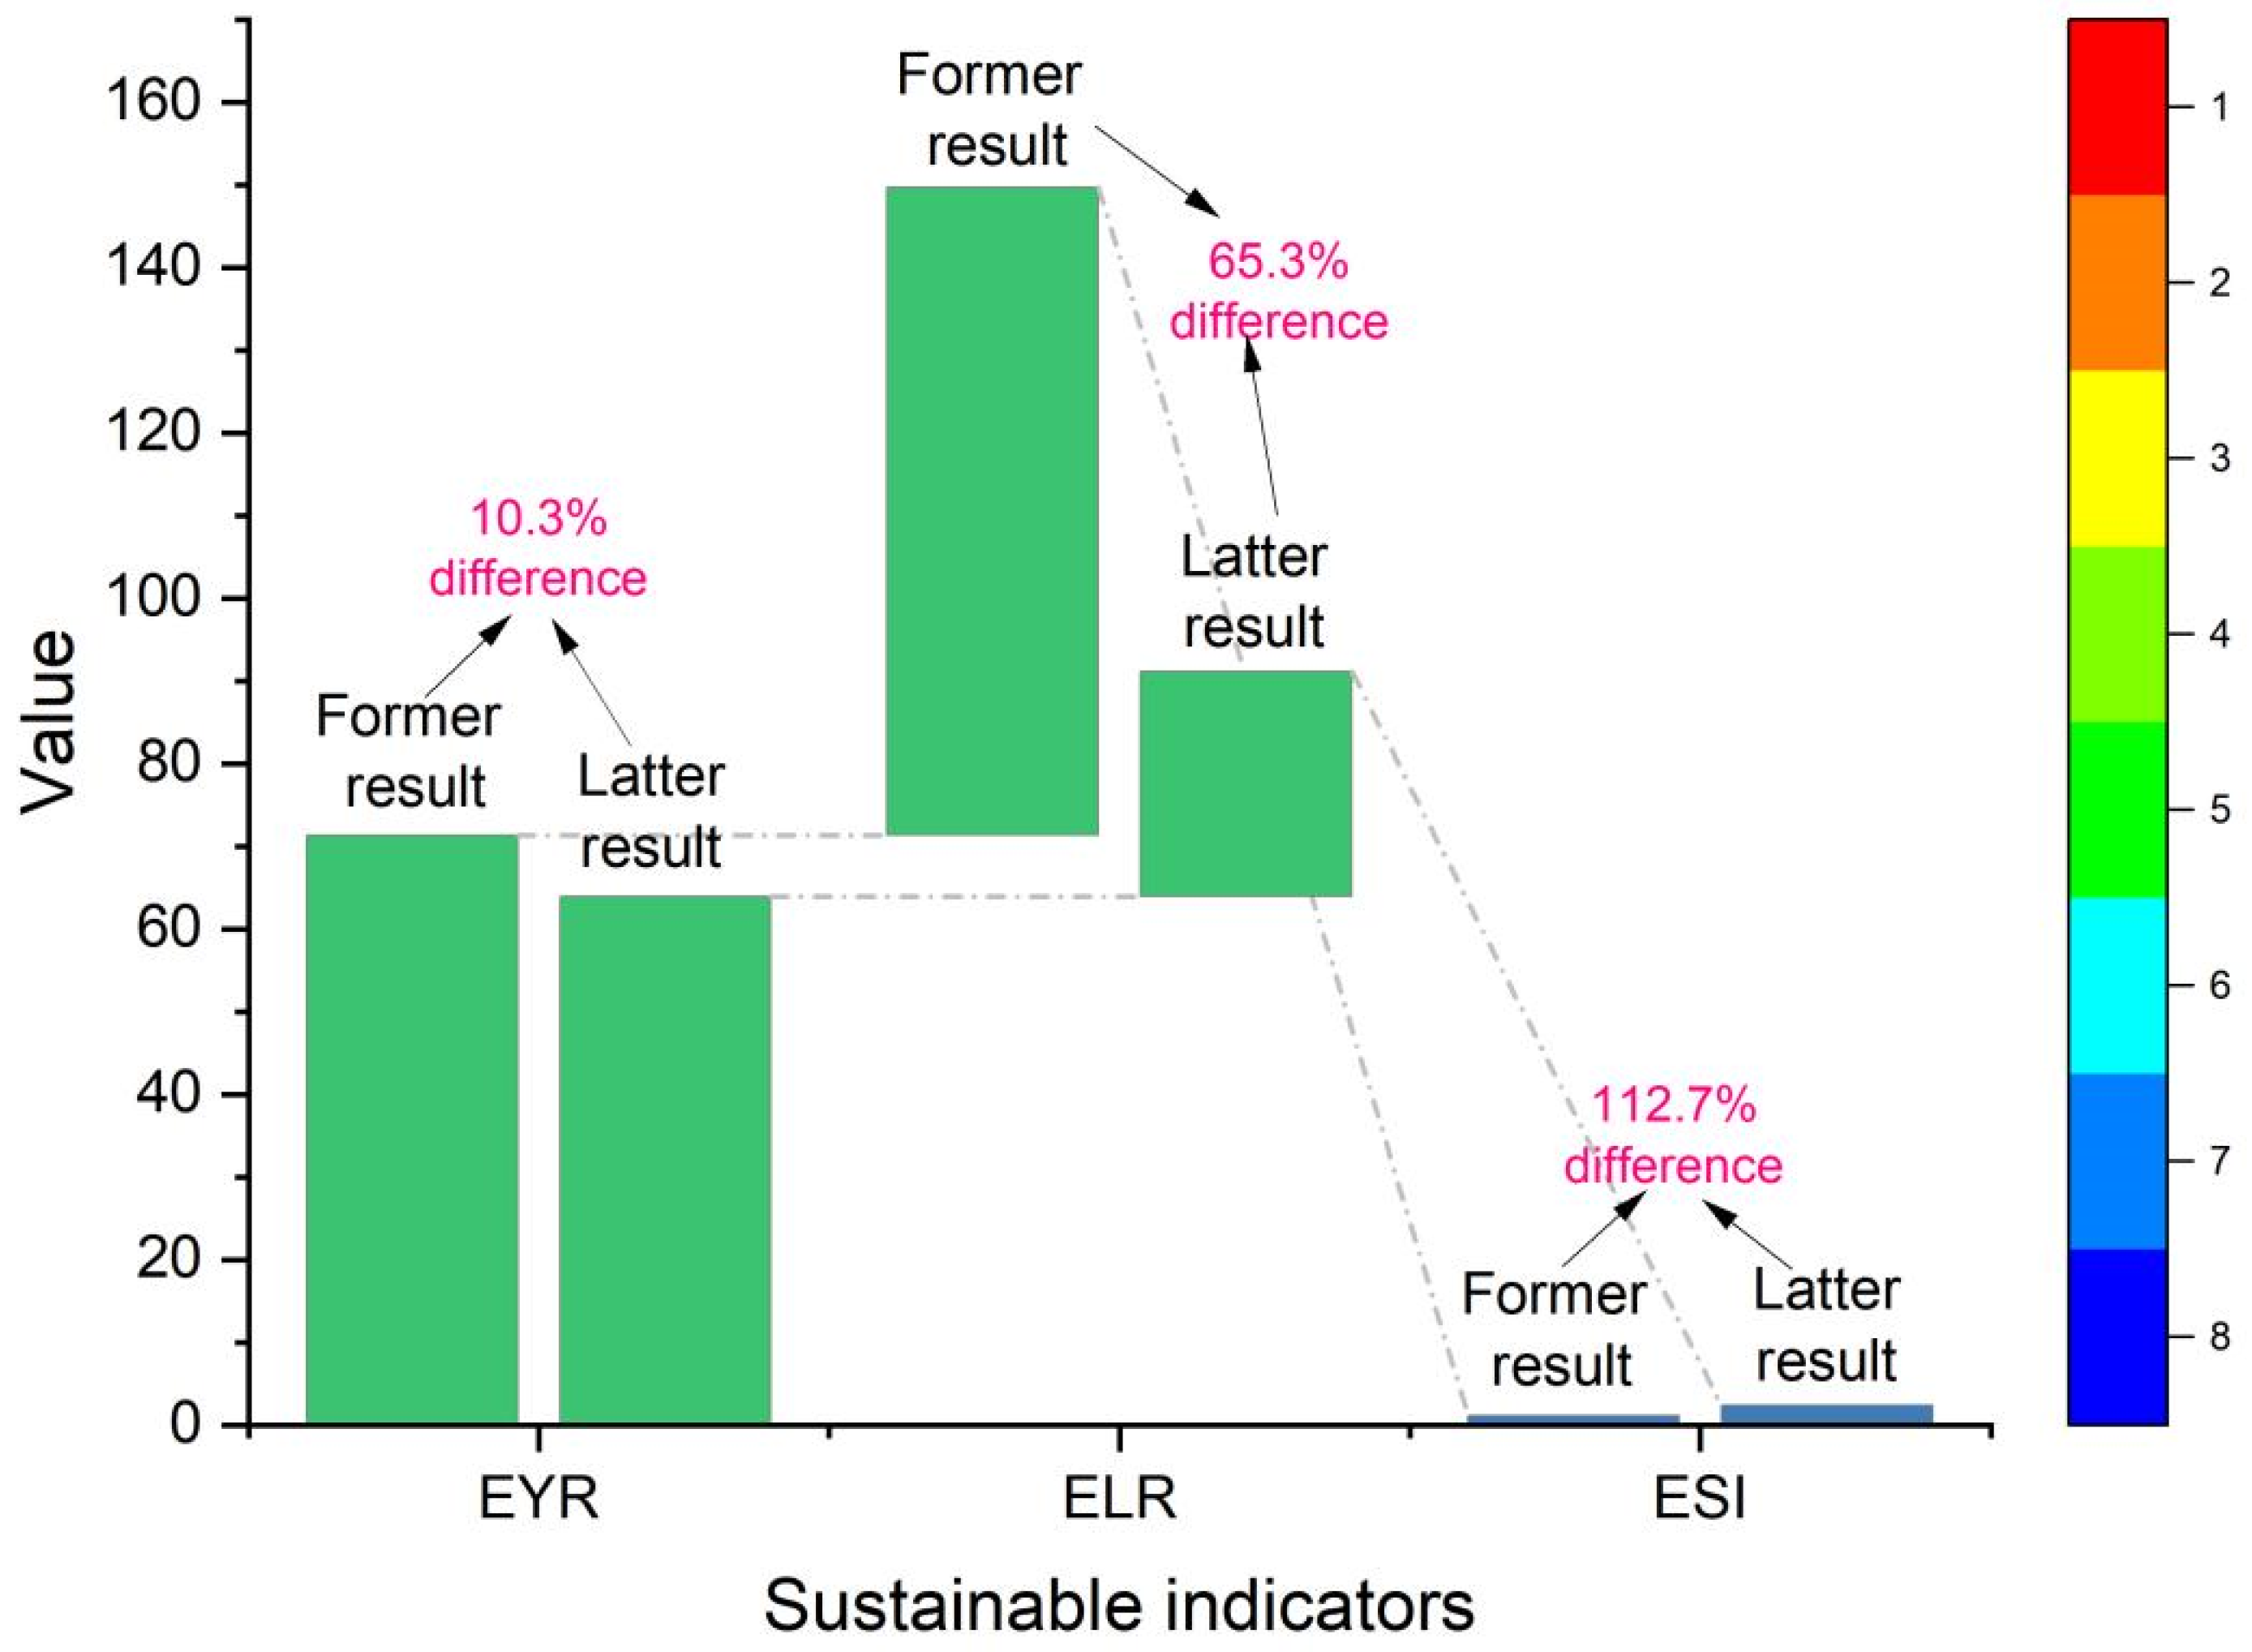
Differences: Taking the building retrofit stage as an example, three different retrofit design strategies were evaluated from the perspective of emergy sustainability. Design strategy A was found to be the most optimal, followed by design strategy B and design strategy C. Based on common predictions, the order of carbon emissions would be A < B < C (which is incorrect). However, in reality, the order is B < A < C (which is the actual result). This explains that analyzing from a single perspective may lead to discrepancies. This has positive implications for architects and building managers.

6. A Sustainability Improvement Measure

The operational stage of the building is a major impact factor, and electricity, as one of the primary input items, plays a crucial role from the view of emergy consumption and carbon emissions. The objective of this section is to enhance the sustainability of the building system by utilizing renewable energy sources to replace fossil fuels. Figure 16 represents a schematic diagram of a solar power generation system that provides electricity for the building system. It aims to analyze the differences and trends in the sustainability of the building system when clean energy sources are adopted.
In Figure 16, a schematic diagram of the solar power generation photovoltaic framework is designed, including the building system, power grid, photovoltaic modules (including collecting box, direct current, inverter box, ammeter, distribution box, bidirectional meter, AC meter, monitoring system, and alternating current load), etc.
  • From an emergy perspective, the analysis was conducted by using data collected from Table A7 in Appendix A to assess the degree of sustainable parameter changes before and after utilizing Emergy sustainability indicators. Figure 17 facilitates the analysis of the differential changes in three categories of indicators. Among them, EYR exhibited a variation fluctuation of 10.3%; ELR decreased by 65.3%, and ESI increased by 112.7%. This change indicates that the coupled design of the solar power generation system has positive effects from an emergy perspective. Most notably, it significantly reduces the negative environmental impact and plays a significant role in improving sustainability parameters.
Please refer to Appendix A (Table A7) for the detailed calculation process.
2.
From a carbon emissions standpoint, the integration of the new system has led to increased carbon emission pressure and an increase in carbon emissions for the entire building system. Due to the design constraint that the emissions should not exceed 3% of the building system’s carbon emissions (the owner’s requirement), the carbon emissions are approximately 8.95 × 10³ tCO2 (accounting for 1.35% of the total building carbon emissions). Any subsystem addition will increase the carbon emission pressure of the building, necessitating the selection of clean energy sources based on specific design requirements.

7. Conclusions

As a complex system, the definition of sustainability in the context of architecture is diverse. While readers often associate sustainable architecture with green buildings, the sustainable perspective of building systems can be much broader. This paper introduces two interconnected perspectives (emergy and carbon emission) for analyzing the sustainability of building systems, providing readers with new directions to consider.
The LCA–Emergy analysis and the LCA–Carbon emission perspective revealed that the operational stage and the building materials production stage are critical stages throughout the entire life cycle. Retrofit design strategies help enhance the sustainability performance of the building system, and the extent of improvement depends on the choice of design strategies. However, there are differences between the two perspectives. For instance, the integration of solar clean energy sources enhances the sustainability of the building system from an emergy perspective, but it also increases the overall carbon emissions of the building system from a carbon emissions perspective, thereby having a negative impact on the environment to some extent. Therefore, comprehensive analysis and judgment are required by considering both perspectives.
To conduct a more comprehensive sustainable analysis, future work will focus on the dynamic monitoring and prediction of emergy performance and carbon emissions. This will involve utilizing theoretical models related to artificial intelligence and machine learning for analysis. This area will be the primary focus of future research.

Author Contributions

Conceptualization, H.W. (Hechi Wang); methodology, H.W. (Hechi Wang); software, Z.Y. (Zerong Yan), X.H., Z.Y. (Zhaoyi Yan), J.Z. and X.C.; formal analysis, Q.Z., J.Z. and H.W. (Hechi Wang), H.W. (Hongying Wang); investigation, H.W. (Hongying Wang), J.Z., J.G., Z.Y. (Zhaoyi Yan), and X.H.; writing—original draft preparation, H.W. (Hechi Wang) and Z.Y. (Zhaoyi Yan); writing—review and editing, H.W. (Hechi Wang) and Z.Y. (Zhaoyi Yan), H.W. (Hongying Wang); resources, H.W. (Hechi Wang) and J.Z.; visualization, H.W. (Hechi Wang), Z.Y. (Zhaoyi Yan), X.H., Z.Y. (Zerong Yan), J.G. and X.C.; supervision, H.W. (Hechi Wang) and Q.Z.; funding acquisition, H.W. (Hechi Wang). All authors have read and agreed to the published version of the manuscript.

Funding

This research was funded by the Doctoral Fund of the Hubei University of Technology: “Research on the protection of modern educational architectural heritage from the perspective of sustainable development” (grant number BSQD2019044), and the Green Industry Leading Science and Technology Project of Hubei University of Technology (grant number XJ2021001802). Open fund of State Key Laboratory of Silicate Materials for Architectures (Wuhan University of Technology) (SYSJJ2022-16). XJTLU Urban and Environmental Studies University Research Centre (UES) (UES-RSF-23030601).

Institutional Review Board Statement

Not applicable.

Informed Consent Statement

Not applicable.

Data Availability Statement

The data presented in this study are available within this article.

Acknowledgments

The authors are thankful for the support from Hubei University of Technology, Jiangsu University of Science and Technology, Southeast University to conduct this research.

Conflicts of Interest

The authors declare no conflict of interest.

Appendix A

Table A1. The carbon emission calculation of material production.
Item Data Unit Carbon Emission FactorsCarbon Emission Unit
Steel 6.93 × 10⁵Kg2.67 tCO2/t1850.31 tCO2
Cement 8.20 × 10⁷Kg0.07 tCO2/t5740 tCO2
Gravel 1.93 × 10⁴Kg 16 kgCO2/kg308.8tCO2
Brick 9.21 × 10⁵Kg0.24 kgCO2/kg221tCO2
Lime 6.18 × 10⁵Kg0.44 tCO2/t271.92 tCO2
Water 3.48 × 10⁵M30.82 kgCO2/m3285.36 tCO2
Iron9.94 × 105Kg2.05 tCO2/t2037.7 tCO2
Wood 7.32 × 10⁵Kg0.31 kgCO2/kg226.92 tCO2
Glass 7.62 × 10⁵Kg1.4 kgCO2/kg1066.8tCO2
Polyester 7.31 × 10²Kg72.65tCO2/t53.11 tCO2
Aluminum 5.49 × 10³Kg15.8 tCO2/t86.77 tCO2
Ceramic tile 5.94 × 10⁴Kg0.74 tCO2/t43.96 tCO2
Polystyrene 8.63 × 10³Kg3.78 kgCO2/kg32.63 tCO2
PVC6.58 × 103Kg4.79 kgCO2/kg31.53 tCO2
Table A2. The carbon emission in the building construction stage.
Item Data Unit Carbon Emission FactorsCarbon Emission Unit
Labor and service
Diesel fuel5.90 × 10t3.797 tCO2/t224.023tCO2
Machinery diesel3.26 × 102t3.797 tCO2/t1237.822tCO2
Transport diesel 2.30 × 10²t3.797 tCO2/t873.31tCO2
Water supply and sewage system treatment facilities
Steel 4.69 × 10⁵Kg2.67 tCO2/t1.25 × 103tCO2
PVC7.57 × 103Kg4.79 kgCO2/kg3.62 × 10tCO2
Polystyrene2.40 × 103Kg3.78 kgCO2/kg9.08tCO2
Brass 6.66 × 10³Kg3.73 tCO2/t2.48 × 10tCO2
Polypropylene 7.19 × 10³Kg5.98 tCO2/t4.30 × 10tCO2
Glass fiber7.57 × 103Kg1.4 kgCO2/kg1.06 × 10tCO2
Iron 2.64 × 10⁴Kg2.05 tCO2/t5.40 × 10tCO2
Ceramic 5.24 × 10⁵Kg0.74 tCO2/t3.88 × 102tCO2
Glass 3.79 × 10⁴Kg1.4 kgCO2/kg5.30 × 10tCO2
Cement 4.80 × 10⁶Kg0.07 tCO2/t3.36 × 102tCO2
Water 4.33 × 10⁴m30.82 kgCO2/m33.55 × 10tCO2
Gravel 5.42 × 10³Kg16 kgCO2/kg8.67 × 10tCO2
Diesel fuel1.97 × 10t3.797 tCO2/t7.48 × 10tCO2
Heating and cooling systems
Steel 2.94 × 10⁴Kg2.67 tCO2/t7.85 × 10tCO2
Polypropylene 3.05 × 10³Kg5.98 tCO2/t1.82 × 10tCO2
Aluminum 3.78 × 10³Kg15.8 tCO2/t5.97 × 10tCO2
Glass wool 5.76 × 10³Kg1.4 kgCO2/kg8.06tCO2
Brass 5.43 × 10³Kg3.73 tCO2/t2.02 × 10tCO2
Copper 5.52 × 10³Kg3.73 tCO2/t2.06 × 10tCO2
Diesel fuel 1.21 × 10²t3.797 tCO2/t4.60 × 102tCO2
Electricity installations
Copper 1.11 × 10⁴Kg3.73 tCO2/t4.13 × 10tCO2
Aluminum sheet3.98 × 103Kg15.8 tCO2/t6.29 × 10tCO2
Galvanized steel4.73 × 103Kg15.8 tCO2/t7.47 × 10tCO2
Steel 7.47 × 10³Kg15.8 tCO2/t1.18 × 102tCO2
Rubber 5.78 × 10³Kg2.4 tCO2/t1.39 × 10tCO2
Polyester 6.47 × 10²Kg72.65tCO2/t4.70 × 10tCO2
Iron 4.50 × 10⁴Kg2.05 tCO2/t9.22 × 10tCO2
Ceramics 5.60 × 10⁴Kg0.74 tCO2/t4.15 × 10tCO2
Plastic 8.22 × 10³Kg7.83 kgCO2/kg6.43 × 10tCO2
Glass3.16 × 104Kg1.4 kgCO2/kg4.42 × 10tCO2
Diesel fuel 1.40 × 10t3.797 tCO2/t5.30 × 10tCO2
Telecommunications system
Copper 4.30 × 10⁴Kg3.73 tCO2/t1.60 × 102tCO2
PVC5.10 × 104Kg4.79 kgCO2/kg2.44 × 102tCO2
Aluminum sheet6.10 × 104Kg15.8 tCO2/t9.63 × 102tCO2
Plastic 1.78 × 10⁴Kg7.83 kgCO2/kg1.39 × 102tCO2
Brass 3.46 × 10⁴Kg3.73 tCO2/t1.29 × 102tCO2
Aluminum 5.15 × 10⁴Kg15.8 tCO2/t8.14 × 102tCO2
Glass 6.79 × 10⁴Kg1.4 kgCO2/kg9.50 × 10tCO2
Steel 5.19 × 10⁴Kg15.8 tCO2/t8.20 × 102tCO2
Diesel fuel 1.45t3.797 tCO2/t5.51 × 102tCO2
Elevator system
Steel 7.65 × 10³Kg15.8 tCO2/t1.21 × 102tCO2
Rubber 8.80 × 10³Kg2.4 tCO2/t2.11 × 10tCO2
Iron 1.09 × 10⁴Kg2.05 tCO2/t2.24 × 10tCO2
Glass 5.69 × 10³Kg1.4 kgCO2/kg7.97 × 10tCO2
Diesel fuel 2.16 × 10²t3.797 tCO2/t8.20 × 102tCO2
Table A3. The carbon emission of the building operation stage.
Item Data Unit Carbon Emission FactorsCarbon EmissionUnit
Electricity1.42 × 108kWh0.7025 kgCO2/kWh9.98 × 104tCO2
Heat2.73 × 108J0.002 tCO2/J5.46 × 105tCO2
Water6.91 × 105m30.82 kgCO2/m35.67 × 102tCO2
Table A4. The carbon emission of the building renewal stage.
ItemDataUnitCarbon Emission FactorsCarbon EmissionUnit
Renewal strategy A
Glass3.55 × 104Kg 1.4 kgCO2/kg49.77 tCO2
Water5.50 × 104Kg0.82 kgCO2/m345.12 tCO2
Diesel fuel 3.91 × 10⁵Kg0.23 tCO2/t89.87 tCO2
Renewal strategy B
PVC7.17 × 103Kg4.79 kgCO2/kg34.34 tCO2
Bricks 3.57 × 10⁴Kg0.24 kgCO2/kg8.56 tCO2
Concrete2.33 × 105Kg0.13 kgCO2/kg30.33 tCO2
Diesel fuel 2.82 × 10⁵Kg0.23 tCO2/t64.80 tCO2
Renewal strategy C
Cement 4.24 × 10⁵Kg0.07 tCO2/t29.70 tCO2
Aluminum 2.12Kg15.8 tCO2/t33.52 tCO2
Diesel fuel8.31 × 105kg0.23 tCO2/t191.03 tCO2
Table A5. The carbon emission of the building demolition stage.
Item Data Unit Carbon Emission FactorsCarbon Emission Unit
Glass 3.99 × 10⁵Kg 1.4 kgCO2/kg558.59 tCO2
Steel 2.14 × 10⁵Kg 2.05 tCO2/t438.24 tCO2
PVC 1.63 × 10⁴Kg 4.79 kgCO2/kg78.20 tCO2
Aluminum 2.50 × 10⁴Kg 15.8 tCO2/t394.44 tCO2
Bricks 4.19 × 10⁴Kg 0.24 kgCO2/kg10.07 tCO2
Concrete 8.64 × 10⁵Kg 0.13 kgCO2/kg112.30 tCO2
Diesel fuel 1.65 × 10³Kg 3.797 tCO2/t6.22 tCO2
Table A6. The carbon emission calculation of the LCA–Carbon emission method.
Stages AbbreviationCarbon Emission Unit
Building material production stageB11.23 × 104tCO2
Building construction stageB21.09 × 103tCO2
Building operation stageB36.46 × 105tCO2
Building renewal stageB45.77 × 102tCO2
Building demolition stageB51.60 × 103tCO2
Table A7. Sustainable emergy index progress.
No.Indicators Previous IndexAmeliorative IndexUnit
1Emergy yield ratio (EYR)71.363.9-
2Environmental loading ratio (ELR)78.427.2-
3Emergy sustainability indicator (ESI)1.12.34-
Table A8. Abbreviated noun interpretation.
No.AbbreviationExplanations
1LCALife Cycle Assessment
2BIMBuilding Information Modeling
3UEVUnit emergy value
4EYREmergy yield ratio
5ELREnvironmental loading ratio
6ESIEmergy sustainability indicator
7IPCCIntergovernmental Panel on Climate Change

References

  1. Goubran, S.; Walker, T.; Cucuzzella, C.; Schwartz, T. Green building standards and the United Nations’ Sustainable Development Goals. J. Environ. Manag. 2023, 326, 116552. [Google Scholar] [CrossRef]
  2. Guidetti, E.; Ferrara, M. Embodied energy in existing buildings as a tool for sustainable intervention on urban heritage. Sustain. Cities Soc. 2023, 88, 104284. [Google Scholar] [CrossRef]
  3. Noyce, G.L.; Smith, A.J.; Kirwan, M.L.; Rich, R.L. Oxygen priming induced by elevated CO2 reduces carbon accumulation and methane emissions in coastal wetlands. Nat. Geosci. 2023, 16, 63–68. [Google Scholar] [CrossRef]
  4. Jiang, P.; Sonne, C.; You, S. Dynamic Carbon-Neutrality Assessment Needed to Tackle the Impacts of Global Crises. Environ. Sci. Technol. 2022, 56, 9851–9853. [Google Scholar] [CrossRef] [PubMed]
  5. Chen, R.; Tsay, Y.-S.; Zhang, T. A multi-objective optimization strategy for building carbon emission from the whole life cycle perspective. Energy 2023, 262, 125373. [Google Scholar] [CrossRef]
  6. Du, Q.; Wang, Y.; Pang, Q.; Hao, T.; Zhou, Y. The dynamic analysis on low-carbon building adoption under emission trading scheme. Energy 2023, 263, 125946. [Google Scholar] [CrossRef]
  7. Zhang, J.; Ma, L. Urban ecological security dynamic analysis based on an innovative emergy ecological footprint method. Environ. Dev. Sustain. 2021, 23, 16163–16191. [Google Scholar] [CrossRef]
  8. Zhang, J.; Ma, L. Environmental Sustainability Assessment of a New Sewage Treatment Plant in China Based on Infrastructure Construction and Operation Phases Emergy Analysis. Water 2020, 12, 484. [Google Scholar] [CrossRef]
  9. Oliveira, M.; Cocozza, A.; Zucaro, A.; Santagata, R.; Ulgiati, S. Circular economy in the agro-industry: Integrated environmental assessment of dairy products. Renew. Sustain. Energy Rev. 2021, 148, 111314. [Google Scholar] [CrossRef]
  10. Zhang, J.; Srinivasan, R.S.; Peng, C. A Systematic Approach to Calculate Unit Emergy Values of Cement Manufacturing in China Using Consumption Quota of Dry and Wet Raw Materials. Buildings 2020, 10, 128. [Google Scholar] [CrossRef]
  11. Zhang, J.; Zhang, H.; Asutosh, A.T.; Sun, N.; Fu, X.; Wang, H.; Li, X. Ecological sustainability assessment of building glass industry in China based on the point of view of raw material emergy and chemical composition. Environ. Sci. Pollut. Res. 2023, 30, 40670–40697. [Google Scholar] [CrossRef]
  12. Alibaba, M.; Pourdarbani, R.; Manesh, M.H.K.; Ochoa, G.V.; Forero, J.D. Thermodynamic, exergo-economic and exergo-environmental analysis of hybrid geothermal-solar power plant based on ORC cycle using emergy concept. Heliyon 2020, 6, e03758. [Google Scholar] [CrossRef] [PubMed]
  13. Yadegaridehkordi, E.; Hourmand, M.; Nilashi, M.; Alsolami, E.; Samad, S.; Mahmoud, M.; Alarood, A.A.; Zainol, A.; Majeed, H.D.; Shuib, L. Assessment of sustainability indicators for green building manufacturing using fuzzy multi-criteria decision making approach. J. Clean. Prod. 2020, 277, 122905. [Google Scholar] [CrossRef]
  14. Paneru, S.; Jahromi, F.F.; Hatami, M.; Roudebush, W.; Jeelani, I. Integration of Emergy Analysis with Building Information Modeling. Sustainability 2021, 13, 7990. [Google Scholar] [CrossRef]
  15. Wang, J.; Xu, S.; Ma, G.; Gou, Q.; Zhao, P.; Jia, X. Emergy analysis and optimization for a solar-driven heating and cooling system integrated with air source heat pump in the ultra-low energy building. J. Build. Eng. 2023, 63, 105467. [Google Scholar] [CrossRef]
  16. Tilba, T.; Praveen, A. Emergy parameters for ensuring sustainable use of building materials. J. Clean. Prod. 2020, 276, 122382. [Google Scholar]
  17. Yi, H.; Srinivasan, R.S.; Braham, W.W.; Tilley, D.R. An ecological understanding of net-zero energy building: Evaluation of sustainability based on emergy theory. J. Clean. Prod. 2017, 143, 654–671. [Google Scholar] [CrossRef]
  18. Li, D.; Du, B.; Zhu, J. Evaluating old community renewal based on emergy analysis: A case study of Nanjing. Ecol. Model. 2021, 449, 109550. [Google Scholar] [CrossRef]
  19. Chen, X.; Wang, H.; Zhang, J.; Zhang, H.; Asutosh, A.T.; Wu, G.; Wei, G.; Shi, Y.; Yang, M. Sustainability Study of a Residential Building near Subway Based on LCA-Emergy Method. Buildings 2022, 12, 679. [Google Scholar] [CrossRef]
  20. Cui, W.; Hong, J.; Liu, G.; Li, K.; Huang, Y.; Zhang, L. Co-Benefifits Analysis of Buildings Based on Different Renewal Strategies: The Emergy-Lca Approach. Int. J. Environ. Res. Public Health 2021, 18, 592. [Google Scholar] [CrossRef]
  21. Wang, H.; Liu, Y.; Zhang, J.; Zhang, H.; Huang, L.; Xu, D.; Zhang, C. Sustainability Investigation in the Building Cement Production System Based on the LCA-Emergy Method. Sustainability 2022, 14, 16380. [Google Scholar] [CrossRef]
  22. Hu, S.; Zhang, Y.; Yang, Z.; Yan, D.; Jiang, Y. Challenges and opportunities for carbon neutrality in China’s building sector—Modelling and data. Build. Simul. 2022, 15, 1899–1921. [Google Scholar] [CrossRef]
  23. Zhang, N.; Luo, Z.; Liu, Y.; Feng, W.; Zhou, N.; Yang, L. Towards low-carbon cities through building-stock-level carbon emission analysis: A calculating and mapping method. Sustain. Cities Soc. 2022, 78, 103633. [Google Scholar] [CrossRef]
  24. Gan, L.; Liu, Y.; Shi, Q.; Cai, W.; Ren, H. Regional inequality in the carbon emission intensity of public buildings in China. Build. Environ. 2022, 225, 109657. [Google Scholar] [CrossRef]
  25. Huo, T.; Ma, Y.; Xu, L.; Feng, W.; Cai, W. Carbon emissions in China’s urban residential building sector through 2060: A dynamic scenario simulation. Energy 2022, 254, 124395. [Google Scholar] [CrossRef]
  26. Wang, X.; Du, Q.; Lu, C.; Li, J. Exploration in carbon emission reduction effect of low-carbon practices in prefabricated building supply chain. J. Clean. Prod. 2022, 368, 133153. [Google Scholar] [CrossRef]
  27. Lou, Y.; Yang, Y.; Ye, Y.; He, C.; Zuo, W. The economic impacts of carbon emission trading scheme on building retrofits: A case study with U.S. medium office buildings. Build. Environ. 2022, 221, 109311. [Google Scholar] [CrossRef]
  28. Liu, W.; Zuo, B.; Qu, C.; Ge, L.; Shen, Q. A reasonable distribution of natural landscape: Utilizing green space and water bodies to reduce residential building carbon emissions. Energy Build. 2022, 267, 112150. [Google Scholar] [CrossRef]
  29. Gan, L.; Ren, H.; Cai, W.; Wu, K.; Liu, Y.; Liu, Y. Allocation of carbon emission quotas for China’s provincial public buildings based on principles of equity and efficiency. Build. Environ. 2022, 216, 108994. [Google Scholar] [CrossRef]
  30. Grinham, J.; Fjeldheim, H.; Yan, B.; Helge, T.D.; Edwards, K.; Hegli, T.; Malkawi, A. Zero-carbon balance: The case of HouseZero. Build. Environ. 2022, 207, 108511. [Google Scholar] [CrossRef]
  31. Zhang, Y.; Jiang, X.; Cui, C.; Skitmore, M. BIM-based approach for the integrated assessment of life cycle carbon emission intensity and life cycle costs. Build. Environ. 2022, 226, 109691. [Google Scholar] [CrossRef]
  32. Kang, Y.; Xu, W.; Wu, J.; Li, H.; Liu, R.; Lu, S.; Rong, X.; Xu, X.; Pang, F. Study on comprehensive whole life carbon emission reduction potential and economic feasibility impact based on progressive energy-saving targets: A typical renovated ultra-low energy office. J. Build. Eng. 2022, 58, 105029. [Google Scholar] [CrossRef]
  33. Röck, M.; Saade, M.R.M.; Balouktsi, M.; Rasmussen, F.N.; Birgisdottir, H.; Frischknecht, R.; Habert, G.; Lützkendorf, T.; Passer, A. Embodied GHG emissions of buildings—The hidden challenge for effffective climate change mitigation. Appl. Energy 2020, 258, 114107. [Google Scholar] [CrossRef]
  34. Li, B.; Pan, Y.; Li, L.; Kong, M. Life Cycle Carbon Emission Assessment of Building Refurbishment: A Case Study of Zero-Carbon Pavilion in Shanghai Yangpu Riverside. Appl. Sci. 2022, 12, 9989. [Google Scholar] [CrossRef]
  35. Petrović, B.; Zhang, X.; Eriksson, O.; Wallhagen, M. Life Cycle Cost Analysis of a Single-Family House in Sweden. Buildings 2021, 11, 215. [Google Scholar] [CrossRef]
  36. Li, X.-j.; Xie, W.-j.; Xu, L.; Li, L.-l.; Jim, C.Y.; Wei, T.-b. Holistic life-cycle accounting of carbon emissions of prefabricated buildings using LCA and BIM. Energy Build. 2022, 266, 112136. [Google Scholar] [CrossRef]
  37. Li, H.; Luo, Z.; Xu, X.; Cang, Y.; Yang, L. Assessing the embodied carbon reduction potential of straw bale rural houses by hybrid life cycle assessment: A four-case study. J. Clean. Prod. 2021, 303, 127002. [Google Scholar] [CrossRef]
  38. Aziz, M.A.; Zubair, M.; Saleem, M.; Alharthi, Y.M.; Ashraf, N.; Alotaibi, K.S.; Aga, O.; Al Eid, A.A.A. Mechanical, non-destructive, and thermal characterization of biochar-based mortar composite. Biomass Convers. Biorefinery 2023, 1–14. [Google Scholar] [CrossRef]
  39. Zhang, J.; Asutosh, A.T.A. Sustainability Analysis Based on the LCA–Emergy–Carbon Emission Approach in the Building System. Appl. Sci. 2023, 13, 9707. [Google Scholar] [CrossRef]
  40. Aziz, A.; Zubair, M.; Saleem, M. Development and Testing of Cellulose Nanocrystal-based Concrete. Case Stud. Constr. Mater. 2022, 15, e00761. [Google Scholar] [CrossRef]
  41. Odum, H.T. Environmental Accounting: Emergy and Environmental Decision-Making; John and Wiley and Sons: Hoboken, NJ, USA, 1996; pp. 32–34. [Google Scholar]
  42. Andrić, I.; Pina, A.; Ferrão, P.; Lacarrière, B.; Le Corre, O. The impact of renovation measures on building environmental performance: An emergy approach. J. Clean. Prod. 2017, 162, 776–790. [Google Scholar] [CrossRef]
  43. GB/T 51366-2019; Standard for Building Carbon Emission Calculation in China. 2019. Available online: http://zjj.panzhihua.gov.cn/ztzl/szsnjnljxc/jsbz/4207183.shtml (accessed on 30 June 2023).
  44. CPCD. China Products Carbon Footprint Factors Database. Available online: lca.cityghg.com (accessed on 30 July 2023).
Figure 1. Research Framework of Building System.
Sustainability 15 13075 g001
Figure 2. The carbon emission process of a building system.
Sustainability 15 13075 g002
Figure 3. A case study of a low-carbon commercial complex.
Sustainability 15 13075 g003
Figure 4. Emergy ratio change in five stages (Stage 1-building material production stage; Stage 2-Building material transport phase; Stage 3-building construction stage; Stage 4-building operation stage; Stage 5-building demolition stage).
Sustainability 15 13075 g004
Figure 5. Trends in sustainability indicators.
Sustainability 15 13075 g005
Figure 6. Sensitivity analysis of four assumptions. (ad) represent the base data fluctuations of −8%, −5%, 8%, and 5% respectively.
Sustainability 15 13075 g006
Figure 7. Trends in sensitivity analysis of the four assumptions.
Sustainability 15 13075 g007
Figure 8. The carbon emissions from major building materials.
Sustainability 15 13075 g008
Figure 9. The proportion of six subsystems. (A-Labor and service; B-Water supply and sewage system treatment facilities; C-Heating and cooling systems; D-Electricity installations; E-Telecommunications system; F-Elevator system).
Sustainability 15 13075 g009
Figure 10. The carbon emission distribution of six subsystems. (A)—Labor and service; (B)—Water supply and sewage system treatment facilities; (C)—Heating and cooling systems; (D)—Electricity installations; (E)—Telecommunications system; (F)—Elevator system).
Sustainability 15 13075 g010
Figure 11. The carbon emission in the building operation stage.
Sustainability 15 13075 g011
Figure 12. The carbon emission of building renewal stage.
Sustainability 15 13075 g012
Figure 13. The carbon emission in the building demolition stage.
Sustainability 15 13075 g013
Figure 14. The carbon emission distribution based on LCA perspective.
Sustainability 15 13075 g014
Figure 15. The sensitivity analysis based on carbon emission view.
Sustainability 15 13075 g015
Figure 16. Solar power subsystem in the building system.
Sustainability 15 13075 g016
Figure 17. Differences in solar energy utilization.
Sustainability 15 13075 g017
Table 1. The carbon emission calculation model of a building system.
StagesEquations and Explanations [43]
Sustainability 15 13075 i001 E σ = i = 1 n Q i × F i + μ i × [ F i × ( 1 φ i ) + F i × φ i ]
where E σ is the carbon emission calculation of the building material production stage; n is the quantity of building materials; Q i is the consumption of building material i; F i is the carbon emission factor in the initial state; φ i is the carbon emission factor in the recycling state; μ i is the rate of attrition; F i is the recovery utilization rate.
Sustainability 15 13075 i002 E t = i , j m , n Q i 100 × V i , j × D i × F j
where E t is the carbon emission calculation of the construction transport stage; n is the quantity of building materials; Q i is the consumption of building material i; V i , j is the amount of energy used to transport materials (t/100 t·km); D i is the transportation distance of materials or equipment (km); F j is the carbon emission factor.
Sustainability 15 13075 i003 E c = i , j m , n Q × L i , j × F j
where E c is the carbon emission calculation of the building construction stage; n is the quantity of equipment; m is the number of energy types; Q is the Total number of machines; L i , j is the energy consumed by machinery; F j is the carbon emission factor.
Sustainability 15 13075 i004 E o = j m P i , j × N i × H i × F j × t + r = 0 n Q r × β r × F r × t
where E o is the carbon emission calculation of operational use stage; m is the total types of energy; n is the material renewal quantity; t is the life of the building(year); P i , j is the energy expended per hour; N i is the total number of equipment; H i is the average operating hours of the device; F j is the carbon emission factor of equipment; Q r is the maintenance update consumption; β r is the annual renewal rate; F r is the carbon emission factor of alternate material.
Sustainability 15 13075 i005 E d = E d e + E d w
where E d is the carbon emission at the stage of building demolition; E d e is the carbon emission of mechanical equipment; E d w is the carbon emission of waste transportation.
A C O 2 = j = 1 n S C O 2 × L C O 2
where A C O 2 is the amount of carbon dioxide emissions; S C O 2 is the mass amount; L C O 2 is the emission factors of different building materials.
Disclaimer/Publisher’s Note: The statements, opinions and data contained in all publications are solely those of the individual author(s) and contributor(s) and not of MDPI and/or the editor(s). MDPI and/or the editor(s) disclaim responsibility for any injury to people or property resulting from any ideas, methods, instructions or products referred to in the content.

