Article

Design, Simulation and Performance Evaluation of a Risk-Based Border Management System

1
Fraunhofer Institute for High-Speed Dynamics, Ernst-Mach-Institut, EMI, Am Klingelberg 1, 79588 Efringen-Kirchen, Germany
2
Nederlandse Organisatie voor Toegepast Natuurwetenschappelijk Onderzoek (TNO), 2595 DA The Hague, The Netherlands
*
Author to whom correspondence should be addressed.
Sustainability 2023, 15(17), 12991; https://doi.org/10.3390/su151712991
Submission received: 20 July 2023 / Revised: 15 August 2023 / Accepted: 24 August 2023 / Published: 29 August 2023
(This article belongs to the Special Issue Advances in Transportation Planning and Management)

Abstract

:
Border control systems at Europe’s Schengen (and worldwide) borders are necessary to mitigate cross-border threats, but are perceived as free-traveling bottlenecks. Today’s applicable European regulations demand rule-based control schemes and do not allow risk-based elements. A policy shift towards risk-based border control has been considered in several studies and research (including HEU projects). However, there is a lack of scientific evidence on how they compare with existing rule-based schemes. This paper aims to fill that gap. The simulation allows design of a realistic border control system. The passenger flow is modeled via travelers with good and bad intents. The border control system includes decision-making elements to classify travelers into risk groups. System elements including operators and their interaction were modeled in terms of statistical distributions based on the subject matter experts’ input. The performance is estimated across security effectiveness, resource usage, passenger flow, and traveler experience. Assessment of a set of simulations reveals better scalability of risk-based systems in terms of resource usage and passenger flow. The potential factors to improve the detection rate of the border control process are also studied. Despite having several benefits, the model demonstrates that social acceptance of the risk-based system is the limiting factor for increased scalability.

1. Introduction

Border control is crucial for the safety of countries, e.g., as highlighted in the mission statements of two of the biggest organizations ensuring the safety of their respective territories. FRONTEX [1] is, together with EU member states, responsible for migratory flows, vulnerability assessment, and risk assessment at European external borders to ensure a safe and smooth passenger flow. U.S. Homeland Security’s mission is described as protecting borders from the illegal movement of drugs, weapons, people, and contraband, while supporting lawful entry [2].
Increasing cross-border transportation activities in the past decades have brought along questions about the capabilities of existing security measures. The purpose of strengthening airport security gained an alarming significance after the terrorist attacks on 11 September 2001. Although the immediate course of action led to the enforcement of the Transportation Security Administration (TSA), it initially worked on an equal-resource fallacy, where every passenger and piece of baggage is equally scrutinized, assuming that each passenger has the same potential of being a threat. However, such non-distinctive approaches intensively use the same amount of resources, for instance, Explosive Detection Systems (EDS) for every person without knowing the background of the owner [3,4]. This makes the process very time intensive and expensive [5]. Also, for land borders, cost efficiency is critical for improving security designs [6], not to mention the inconvenience faced by passengers due to extremely scrutinizing security screening [7], which ultimately lead to airlines incurring losses [8]. Such approaches allow focus to be only on the optimization of passenger flow without ensuring tighter security with efficient resource usage [9]. The Schengen area serves as a free travel zone and allows the movement of people, goods, and services [10]. Because of, inter alia, potential illegal migration [11], human trafficking, and terrorist intrusion [12], as well as non-identification of persons on search lists [13], there is a need for an efficient and reliable method to identify high-risk travelers during cross-border activities, in particular at external borders [14]. Another challenge with the present approach is to economize the flow of passengers [15]. However, in addition to security and flow, ethical concerns, privacy and data protection compliance, and passenger satisfaction [16] should also be considered.
This motivates the need for risk-based decision-making, which emphasizes identifying the passengers that fall in the higher risk categories and scrutinizing them along with their baggage more intensively. This approach has been formulated, e.g., within the “Smart Borders” policy process in 2011 within the EU [17,18], which has to be distinguished from risk-inspired overall border policy management [19]. While the current risk-based paradigms take into account identification factors like personal data, biometrics, etc., at the border control point (BCP) only, it would be beneficial to consider other factors like voluntary information given by passengers, remote sensor data, and search lists of persons, whilst maintaining and fostering social, ethical, and privacy requirements [20,21]. Along these lines, the EU research projects XP-DITE [22] focused on overall system performance and security control regarding dangerous items at airport borders [4] and TRESSPASS [23] focused on risk-based border control at land, sea, and air borders [24,25]. In TRESSPASS, all these factors were assessed to reach an adaptive risk-based approach to determine the objective risk categories of the travelers.
Having said that, the challenge at hand is to evaluate the overall performance of the risk-based approach while taking into account a large number of possible scenarios [26]. These challenges have been addressed initially by the XP-DITE project, which worked towards providing help to airports in evaluating the performance of checkpoints whilst keeping security regarding dangerous objects, cost, throughput, passenger satisfaction, and ethical factors as the top priorities [27]. The ambition was to develop a checkpoint design and evaluation tool to assess the performance of the checkpoints at the system level [4]. In contrast, this paper focuses on simulated comparison of the risk-based border control process as developed within the EU project TRESSPASS [23] with the existing rule-based methodology.
The framework presented in this paper aims to achieve optimum security while maintaining high performance in terms of throughput, cost-efficiency, privacy, and ethical compliance, as well as perceived comfort. The simulation works according to the concept of operations (CONOPS) of feasible and realistic identification processes at border control points. Using the risk factor, the present Monte Carlo (MC) agent simulation determines the risk score of every agent. As in the real world, within the simulation, the agents have to pass through four different stages: (i) Pre-travel: The phase where travel planning begins; (ii) Approaching BCP: The traveler starts traveling towards the BCP; (iii) At BCP: Stage when the traveler is in the vicinity of the BCP; (iv) Post BCP: The traveler is allowed to cross the border. Furthermore, the approach aims to support the design of secure and efficient BCPs. It also provides solutions for reducing queuing due to high arrival rates at BCPs by suggesting the targeted addition of more server desks with defined capabilities of operators, extending the concept presented in [24]. The main aim of the paper is to address the question of whether the risk-based approach is better than rule-based by comparing the two within a comprehensive simulation framework.
Section 2 investigates the existing risk-based border control approaches along with promising simulation methodologies and determines gaps that need to be addressed. Section 3 and Section 4 describe the design and implementation details of the risk-based BCP within the simulator. Section 5 talks about the performance assessment indicators. Section 6 presents several case studies while comparing the performance of sample BCPs. Section 7 summarizes and concludes.

2. Current Approaches and Research Gaps

2.1. Challenges of Risk-Based Traveler Profiling for Border Management

Several risk-based programs were seen to be deployed for transportation in the U.S. The Immigration and Naturalization Passenger Accelerated Service System served as a trusted traveler program for passengers returning from overseas [28,29,30]. Under this, the volunteering passengers provided biometric information along with hand geometry during registration. As a result, these returning passengers were allowed to use special kiosks for biometric scanning instead of a slow immigration process to obtain clearance. However, it is no longer in use, due to several drawbacks [31]. Another risk-based program is the Advance Passenger Information System (APIS) [32], which focuses on passengers landing in the U.S. from overseas. It mandates airlines to provide U.S. Customs and Border Protection (CBP) with details of each passenger and crew member like name, sex, passport number, and visa number prior to departure. This enables risk-based checks of all the passengers by comparison with the records of numerous federal agencies before the flight lands, thus helping to identify the high-risk passengers on board.
As a security measure following the 9/11 attacks, the United States and Canada formed a fast-lane program for border crossing called NEXUS [33]. It allows a faster flow of pre-screened, low-risk travelers, to save resources for high-risk travelers. Similar preclearance models that have been introduced are the free and secure trade (FAST) program for truck drivers and their cargo [34,35]. In October 2001, a system called PRIVIUM was introduced at Amsterdam Schiphol Airport [36] which enables faster checking of passengers who own a paid membership by allotting a separate fast lane. It includes a 15 min process where passengers with valid passports or European identity cards from a country within the European Union are digitally checked for documents and criminal history by scanning their iris.
The present approach in particular goes beyond integrated border control and management (IBM) [37,38], as is currently in operation in highly industrialized neighboring countries, such as U.S. and Canada, Norway and Sweden [39], and increasingly more eastern borders of the EU [40]. Similar approaches are about to be introduced in India [41]. The approach also exceeds automated border control (ABC) checkpoints that authenticate electronic machine readable travel documents (e-MRTDs) [42]. The approach is broader when compared to smart border concepts [43] strongly focusing on massive identification technology improvement, see, e.g., [44].

2.2. Border Control System Simulation Approaches and Gaps

Risk-based simulation calls for the evaluation and analysis of security and flow aspects of border control while maintaining societal and ethical standards. These aspects include passenger consent to information gathering as the basis of most data collection and generation [45], including national and security databases, remote sensor data, voluntary information provided by passengers, search lists, social media profiles, and employment status, among many others [46]. The present approach simulates, in an aggregating way, these properties to provide insight into the risk associated with the entry of each passenger.
Zhang et al. [47] evaluated a two-stage security-check system (TSCS) of border control while balancing performance and security using a cost function. Nie et al. [48] used a rule-based heuristic to optimize the resources of selectee lanes while maximizing the true alarm rates. Ruiz et al. [49] worked on multi-agent modeling of legal interaction and effects of policies at the micro-level at border control points on migration flows. These three publications are examples of simplified border control process models that cannot cover the full range of risk indicators for decision-making thereby influencing passenger flows, as aimed for in the present paper.
With the increasing need for risk-based border control checks, there have been different types of simulations developed so far. A Sequential Stochastic Multilevel Passenger Screening Problem (SSMPSP) [50], which is an extension of the Multilevel Passenger Screening Problem (MPSP) [51], follows a multilevel screening methodology using Markov Decision Processes. The SSMPSP relies on a dynamic approach to risk assessment in which the risk classification updates dynamically as more information about the traveler is gathered during screenings. The approaches reveal that passenger risk information can be used for effective security screening subject to budget constraints. Nikolaev et al. [52] introduced the multistage sequential passenger screening problem (MSPSP) along with the feature of dynamic perceived risk updates to ensure maximum security. Their paper also presented an MC simulation-based optimal assignment policy (OAP) heuristic regarding the risk levels of passengers. The last three approaches can be seen as abstract optimization problems of the present approach, which are more driven bottom-up by feasible checkpoint designs, realistic risk-indicator modeling, and supplement information available at decision-making points in BCPs. Janssen et al. [53] introduced AbSRiM, an agent-based security risk management for airport operations. Agent-based modeling is used to perceive the threat scenarios along with MC simulation to estimate the risk. It is based on traditional risk management methodologies such as threat, vulnerability, and consequence (TVC).
In summary, there are a few shortcomings with these simulation approaches, as per the rising emphasis on maintaining maximum security while ensuring the efficiency of these risk management strategies. For instance, the SSMPSP approach does not take into consideration the overload caused by the excessively high arrival rates of travelers. Since there is a high possibility of the passengers outnumbering the actual capacity of the checkpoint in a short period of time, this may lead to longer queues and waiting times. Integrating social interactions and gathering more information than just the generic details of passengers is also lacking. It is also important to monitor the behavior of passengers at the airport and to consider related risk indicators determining the risk score of passengers. Furthermore, the voluntary provision of data while ensuring data privacy and security are also not covered within the past approaches.
In a nutshell, an ideal risk-based border management strategy should be evaluated on security as well as performance criteria such as cost-effectiveness, ethics, privacy, and passenger flow. The main objective of a risk-based simulation approach is to enable a maximum level of security while keeping the cost of resources in check, carrying out the screening process in an ethical manner, and ensuring no infringement of the passengers’ privacy. This includes in particular the option to opt out of any voluntary data provision by passengers, including being not observed if no consent has been given. Thus, ‘hybrid’ scenarios need to be considered where partial or in particular no information is provided by the passenger.

3. Risk-Based Screening Concept and BCP Design Overview

This section describes the concept of risk-based methodology to motivate the design of risk-based BCP. The detailed concept was developed in the TRESSPASS project and is documented in [46].

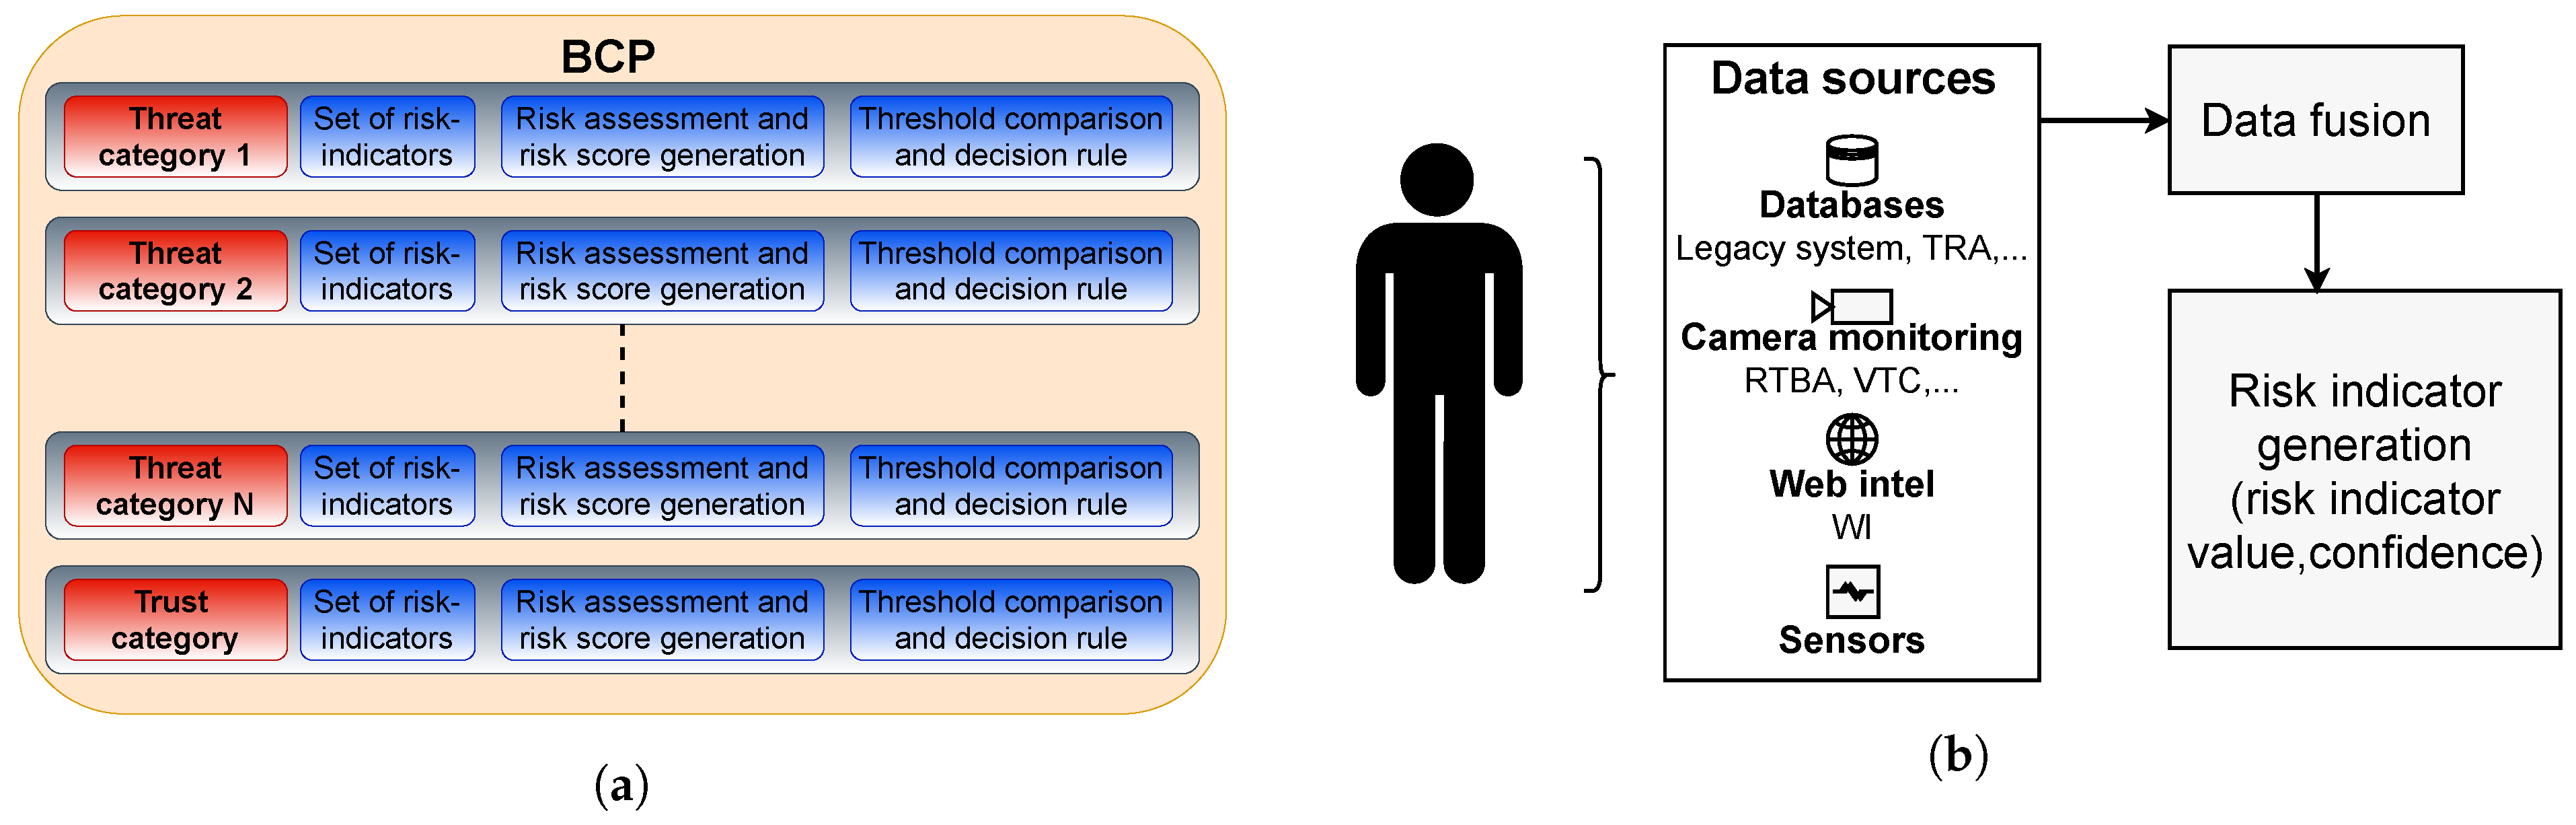
3.1. Threat and Risk Information Encapsulation

The purpose of a BCP is to minimize the risk posed by a set of threat categories which are prioritized based on the geographical and political position of a country. For some BCPs, threats like irregular migration and cross-border crime are more important, and, for others, the smuggling of goods could be more important. It is important to mention that “public health hazard” is another important threat, for instance, as a consequence of a pandemic such as COVID-19, which affected almost all countries around the globe [54].
To minimize the overall risk, it is important to minimize the risk posed by all entities (travelers and cargo) individually. In the context of this article, we have excluded the cargo. In a rule-based BCP, the minimization of risk posed by each entity is achieved by establishing the policy “same check for everyone”. An upgrade to rule-based BCPs is risk-based BCPs. They are meant to increase the flow performance of the BCP while establishing an ethically convenient process for travelers to cross the border.
As can be seen in Figure 1a, each threat is characterized by a set of risk indicators, which themselves are derived from the fusion of basic information. A few of the already existing data sources are Passenger Name Record (PNR, [55]), Schengen Information System (SIS, [56]), and Visa Information System (VIS, [57]). Another information type is behavioral information obtained through cameras, security guards (or border guards), sensors, etc. when the traveler is in proximity to the physical border. All this information is profiled and combined (see Figure 1b) to generate risk indicators. A trust category is also identified, which is characterized by all the indicators that represent that a specific traveler is bona fide. These indicators are then used to evaluate the risk and trust score for each threat and trust category, and then compared to the threshold associated with each category for each traveler (see also [25] for a first, mainly graphical, overview).
Based on the evaluation, each traveler is classified into one of the four risk groups, as shown in Figure 2. The initial classification is mala fide and bona fide passenger. Within the presented approach, the following risk groups were identified, and the same is replicated within the simulation of the distributed risk-based border control system:
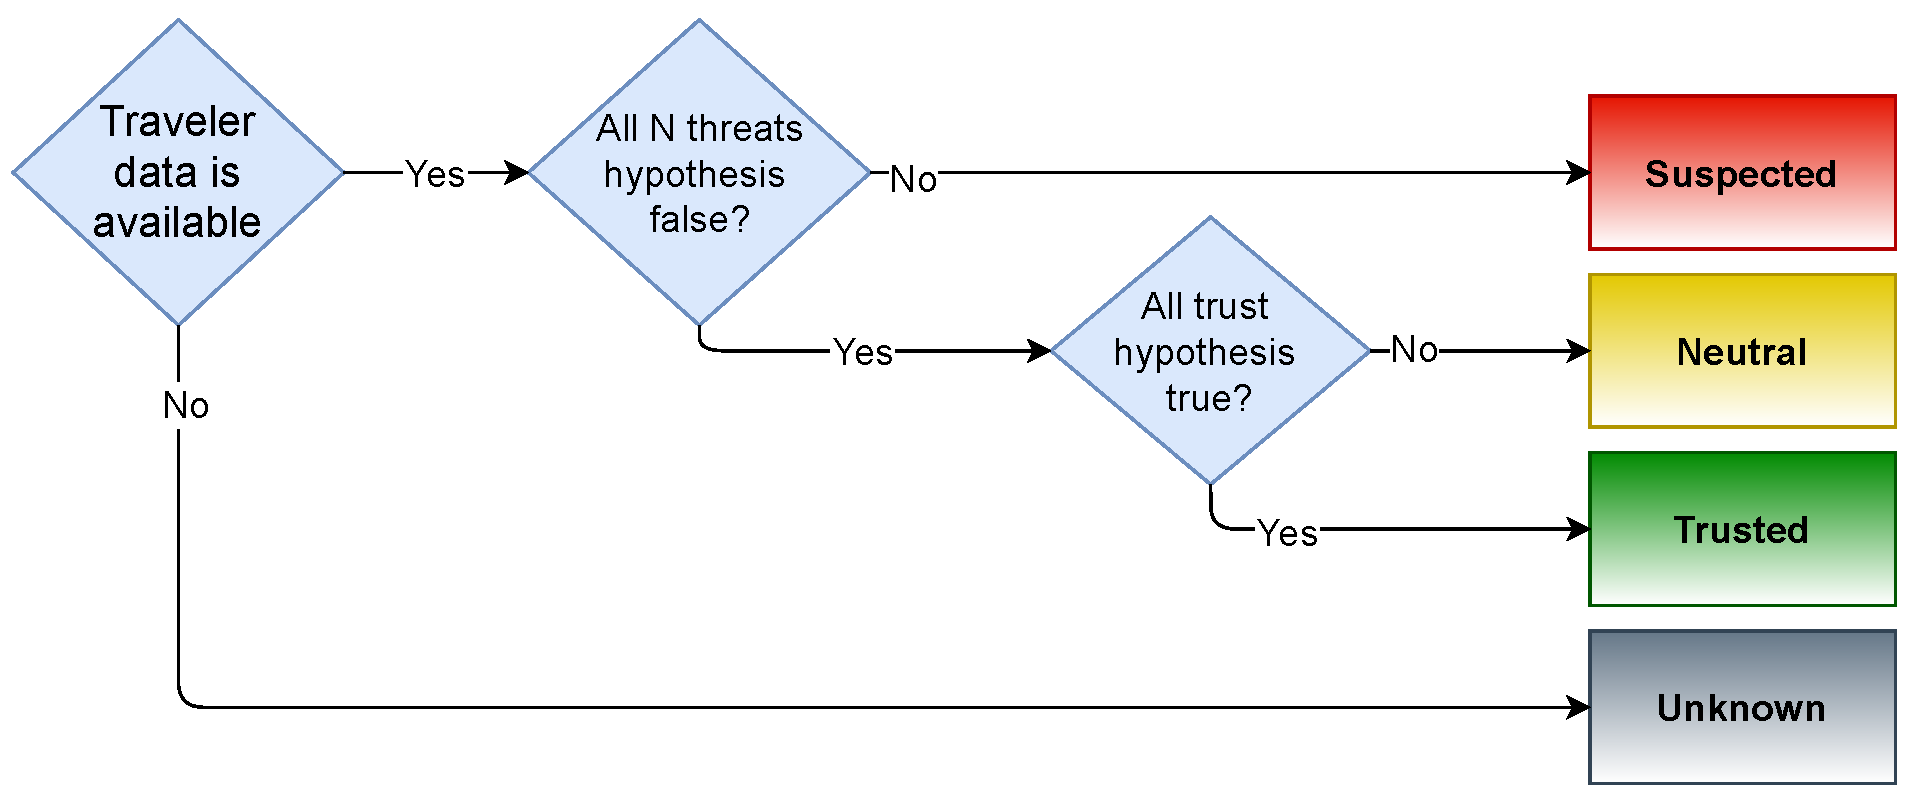
  • Unknown: Not enough traveler data are available to generate indicators, including passengers that did not consent to voluntary data sharing;
  • Trusted: Traveler not exceeding any threshold in the threat categories and also scoring higher than thresholds in the trust category;
  • Neutral: Travelers not exceeding any threshold in the threat categories, who also score lower than the threshold in the trust category;
  • Suspicious: Travelers exceeding a threshold in one of the threat categories.
Based on this classification, BCP operators can decide what kind of check should be established for each risk group. This also allows them to control the amount of acceptable risk at a BCP.

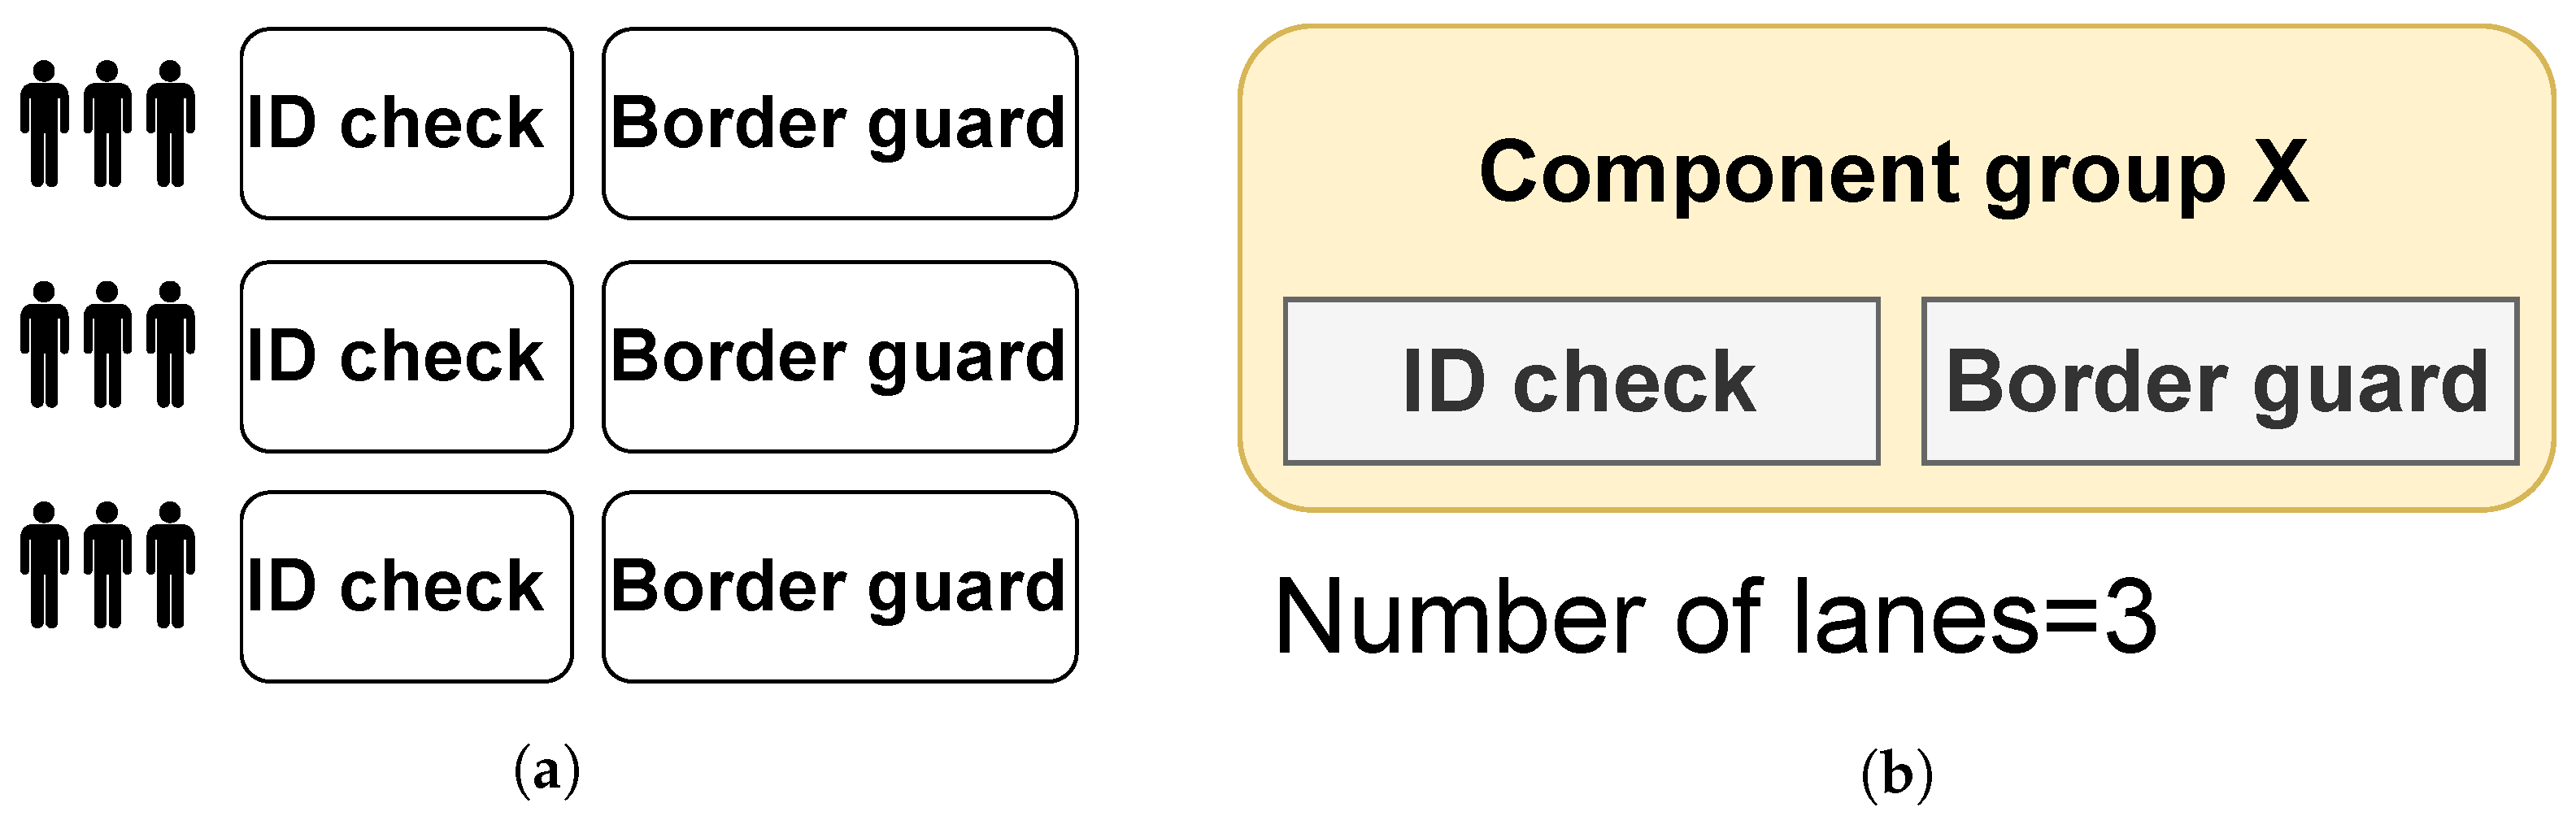
3.2. Design of a Risk-Based BCP

The underlying idea of risk-group classification (Figure 2) is used to build up the configuration of a BCP, where the risk group defines the traveler flow within the BCP process. These different parts of the BCP are called stages [24]. Each stage dynamically updates the risk group of the traveler based on which next stage is decided.
In order to perform this classification, each stage is characterized by components that perform the functionality of collecting a specific piece of information from the traveler profile. For example, the PNR database is a component that collects information related to the travel dates, itinerary, travel agent, payment method, baggage, nationality, etc. associated with the traveler. On the other hand, these components could also be a sensor like a camera or a border guard, representing the information gathered by the border guard, either during the border control checks or random interviews within the area of BCP.
To replicate the functionality of a number of lanes or service points, the term component group is defined. A component group encapsulates one or more components together. An example scenario is shown in Figure 3a, where, at a BCP, there are three operational lanes, each with a border guard (component) and an identity (ID) check system (component), e.g., passport or ID scanner and related database ecosystem. To replicate this functionality in the simulator, the two components (ID check and border guard) are grouped together in one component group (component group X), and the parameter number of lanes is assigned a value of 3. Essentially, this parameter affects the throughput of the stage.
Keeping the above-mentioned concept in mind and going beyond the example in Figure 3, a simple distributed risk-based BCP is created (shown in Figure 4):
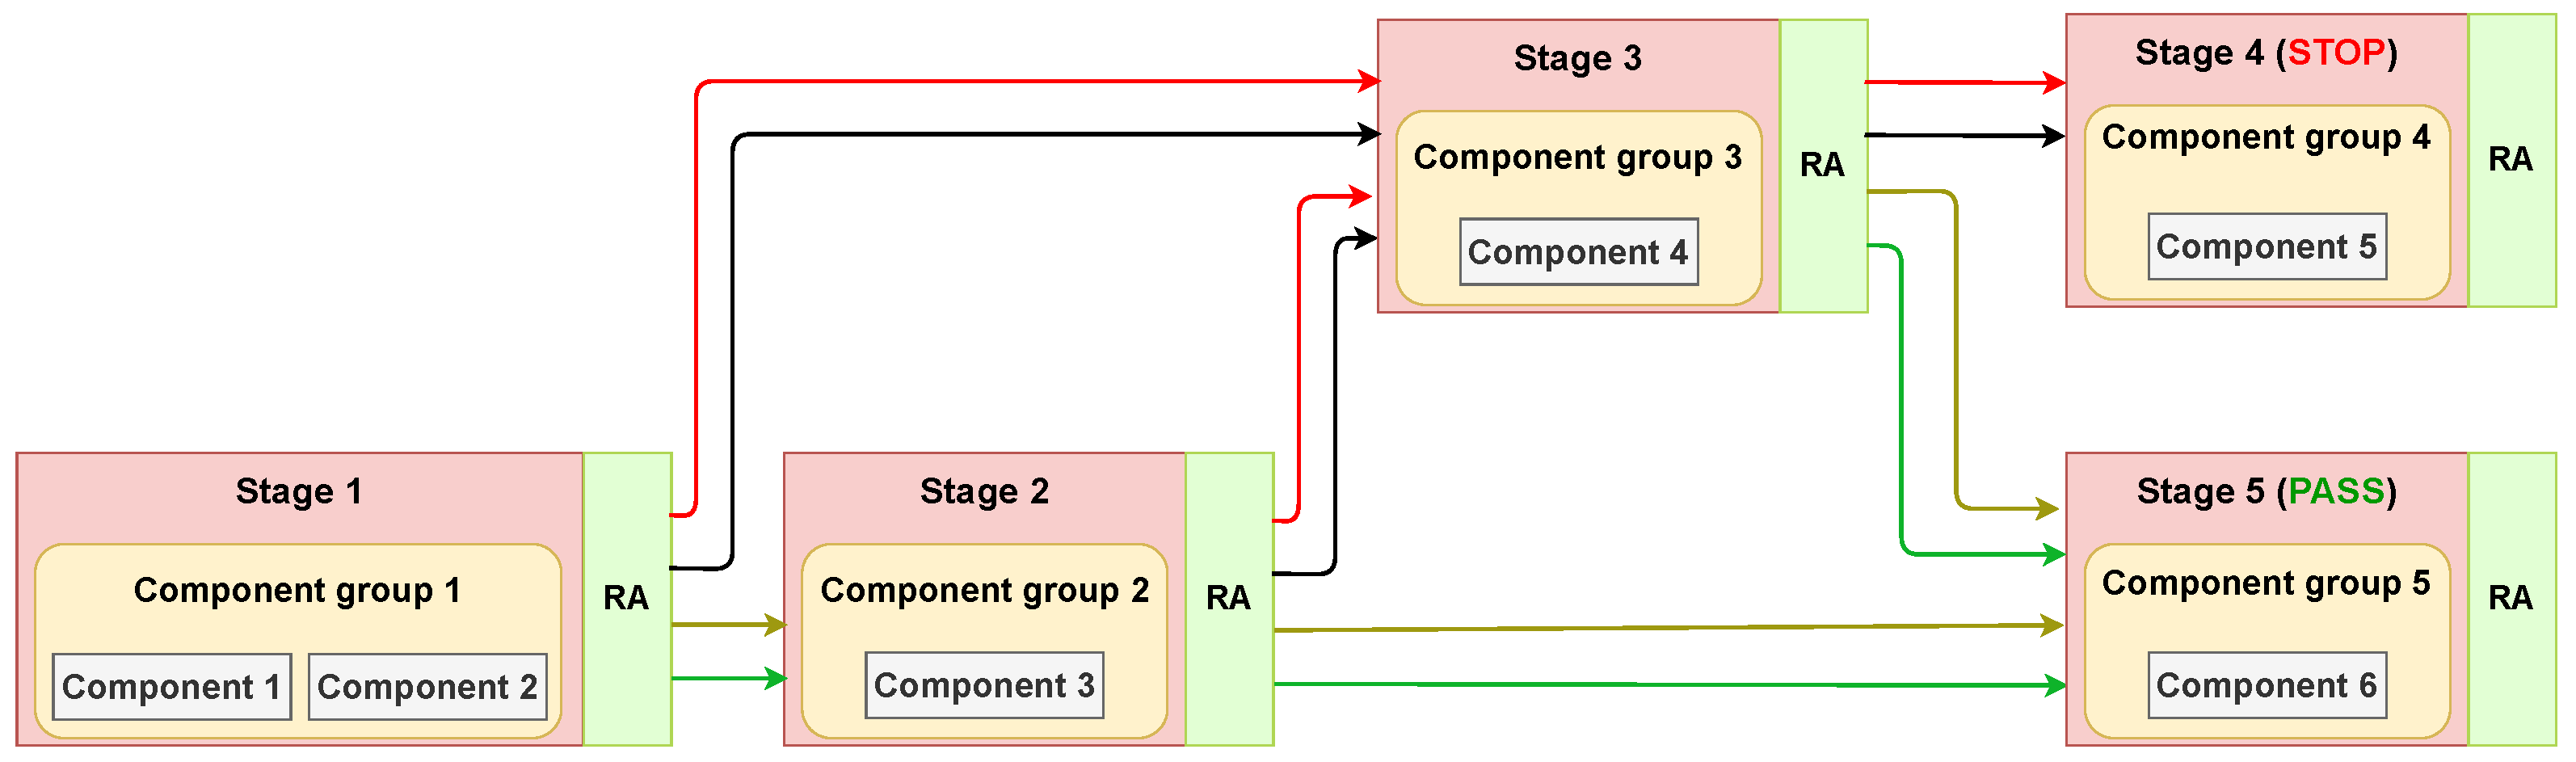
  • Stage 1: This stage represents the pre-travel or the planning phase when the journey has not yet started. Associated components 1 and 2 do not require the physical presence of travelers and have zero service time, thereby not introducing any queues into the system. After Stage 1, the risk of all travelers is evaluated and corresponding risk groups, as shown in Figure 2, are determined. Travelers who are classified as Unknown (represented by black arrow), which also includes travelers not providing any personal information voluntarily, and Suspected (represented by red arrow) are navigated to Stage 3, while, on the other hand, travelers classified as Trusted (represented by green arrow) and Neutral (represented by yellow arrow) are navigated to Stage 2;
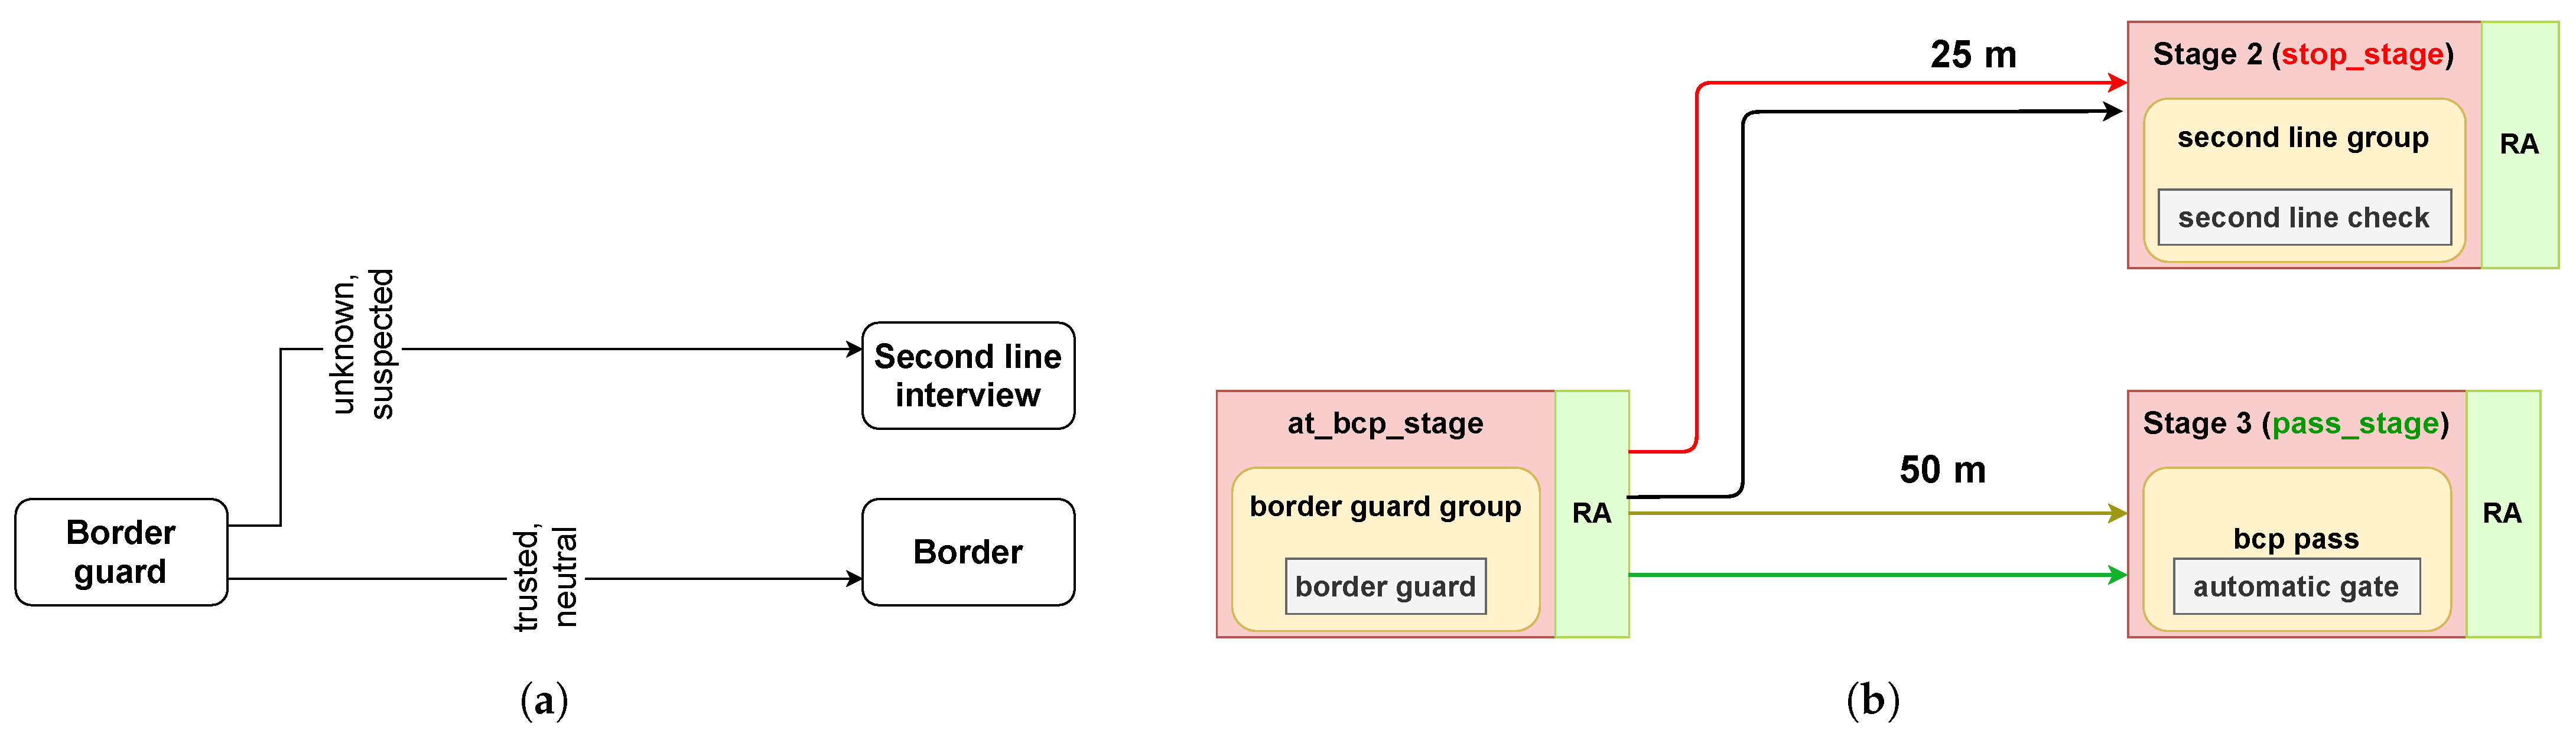
  • Stage 2: All the neutral and trusted travelers after Stage 1 are navigated to Stage 2. As described in Section 3.1, this stage could have several components like real-time behavioral analytics (RTBA) (e.g., [58,59,60]), face recognition of consented travelers [61], and web intelligence [62]. After this stage, all the travelers who are classified as “Unknown” and “Suspected” are navigated to Stage 3. The other travelers proceed to cross the border at stage 5.
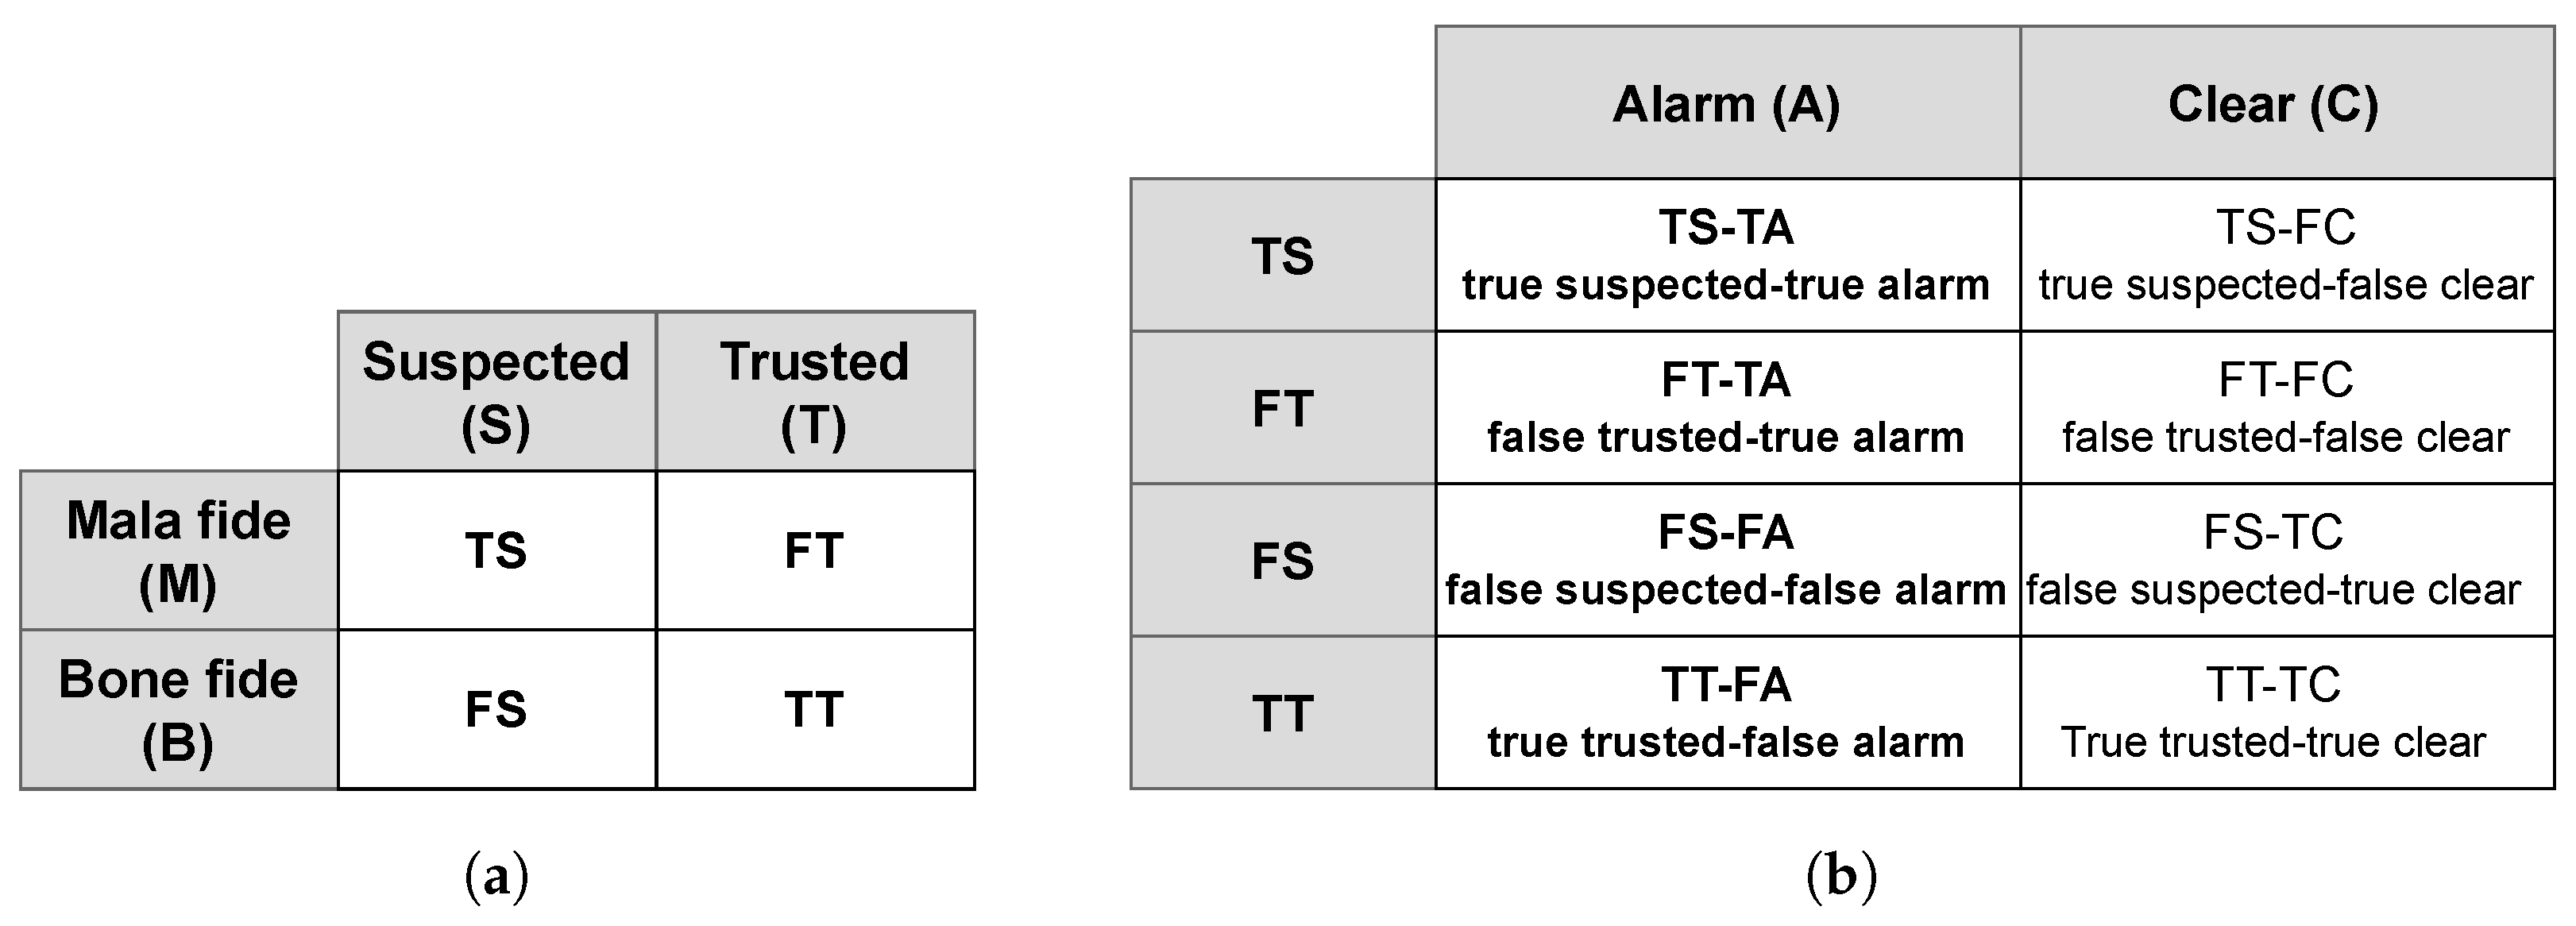
  • Stage 3: At this stage, all the travelers classified as Suspected or Unknown are interviewed by the border guards, including the passengers not consenting to any monitoring or data transmission, i.e., rule-based standard border check. The components at this stage could be, e.g., a border guard interviewing travelers and checking their travel documents and history thoroughly. Border guards could be supplemented with other legacy devices which can be represented by adding additional components in Component group 3. Ideally, all the travelers after the assessment of Stage 3 should be classified in one of the four risk groups, but, since this stage is accompanied by a border guard with a binary decision, the travelers are only classified into two groups, i.e., Alarm, which is equivalent to Suspected, or Clear, which is equivalent to Trusted. Travelers with Alarm status are navigated to Stage 4, which is equivalent to travelers being stopped or denied crossing the border. Travelers with Clear status after Stage 3 are navigated to Stage 5, representing travelers who are allowed to cross the border;
  • Stage 4: This stage is the sink for all the travelers with Suspected or Alarm status. Travelers at Stage 4 could either be denied crossing the border or could also be investigated further during a detailed interview process. This latter process is referred to as a second-line check in the context of border control and is out of scope in the current scheme;
  • Stage 5: At some BCPs, there is no physical existence of this stage, meaning that the traveler is allowed to cross the BCP, for example, at the external EU land border at the Poland–Belarus land border. But, in some places, it is an electronic gate, for example, at the external EU air border at Schiphol airport with a very small service time. Thus, effectively, this stage does not contribute to the risk assessment of the traveler but only affects the flow of the travelers.
It is important to note that the classical distinction of passengers is only Bona fide and Mala fide. Hence, within the above scheme, Suspected and Unknown passengers are treated similarly to Mala fide passengers, and trusted and neutral as Bona fide.

4. MC Models and Algorithms

This section describes, in detail, the simulated entities used in the model. The Monte Carlo (MC) sampling methods were used to estimate the target values. Pseudo-algorithms are also described, which were used to perform the risk assessment and flow simulations.

4.1. Agent Model

The model uses instantiations of agents based on a person model. The person model attributes, to each agent, a predefined traveler behavior associated with the threat category. These detailed traveler profiles were built during the project TRESSPASS, with strong involvement from end users of land, sea, and air border checkpoints. The data for different types of traveler profiles defined within the simulation allow for covering illegal migration, terrorism, cross-border crime, and smuggling in different modalities. Generalized profiles were also developed representing suspected, trusted, and neutral travelers. These behavioral traits consist of discrete values like gender, age group, etc., and continuous values like age, the unemployment rate in the country of origin, visa date, etc. Values are estimated using the probability density functions with a known prior as the threat category. Each simulation run generates multiple agents with a predefined distribution of agent type, i.e., bona fide or mala fide, and, if mala fide, then the threat category to which the agent belongs. The agent data are generated at the beginning of each simulation. This also acts as simulated ground truth to perform the final evaluation of the effectiveness of the BCP process simulation.

4.2. Risk Indicator Model

In the hierarchy of risk assessment, the risk indicators are the base entity to assess the risk of an agent (see Figure 1b). Each indicator value is identified by fusing one or more parameters of the agent profiles. Within the simulator, the fusion operators for each indicator are pre-defined using the expert knowledge gathered during the project. Within the risk-based identification approach, as described in Section 3.1 (see Figure 2), all the risk indicators are further organized into groups as per their occurrence rate and the confidence for each traveler profile. This grouping creates a threat profile for the BCP.

4.3. Sensor, Data Gathering, and Border Guard Component Models

The sensor and data gathering models, or general component models, as introduced in Section 3.2, describe how, at different stages within the BCP configuration, simulation data are gathered for each agent as the agent moves through the BCP. The information collected by these components is further used for the risk assessment of each traveler at each stage using the risk indicators. The aim is to assess the intent of the agent and to classify it in any of the four risk groups in Figure 2, based on the data collected by the components within the BCP process. It should be noted that, even if the agent is initialized with the data having accurate information of the mala fide intent, this information is not considered within the risk-based assessment until a relevant component is present within the infrastructure of the BCP to extract and process that specific information. In general, several generalized sensors or components are involved. Each component’s performance is characterized by a confusion matrix (see, e.g., [63]), generated using the experimental data from TRESSPASS. If the data are not available, they are assumed to be a perfect component with zero false positives and negatives.
The functionality of the border guard in a classic rule-based scenario is quantified based on their experience [22], which is essentially reflected in the interview questions they tailor for each individual traveler [64]. Each border guard is characterized by a detection rate (DR) and false alarm rate (FAR), where DR is their capability to correctly identify a mala fide traveler, and FAR corresponds to the false identifications of bona fide travelers. For an ideal border guard, the DR is one and the FAR is zero.
In a risk-based configuration, the border guard has a priori information based on the classification of risk-based evaluations, as shown in Figure 2. Based on this a priori information and their experience, they make their decision. To model the border guard, this a priori information is also considered, as shown in Figure 5. Using this methodology a border guard’s performance can be quantified by four values highlighted in Figure 5b. These values are renamed as per the ontology used by the border control operators and are shown in Table 1. In the current article, due to the lack of publicly available data, D R 1 is the same as D R 2 , and F A R 1 as F A R 2 .

4.4. Effectiveness and Flow Algorithm

The risk assessment starts by initializing all agents and assigning them to the start stage—see Figure 4. The current stage which, is the start stage, performs the risk assessment based on the information collected by the components grouped within this stage, as described in Section 4.2. Based on the risk assessment, each agent is classified into one of the four risk groups, as shown in Figure 2, i.e., trusted, neutral, suspected, or unknown. Based on this classification, the next stage is identified and assigned to the agent. The assignment process continues until the agent is either assigned to the stop stage or the pass stage—see again Figure 4.
Flow is simulated using a discrete event model. Each agent is generated at a discrete arrival time representing the first interaction with the BCP. Arrival time is estimated using the arrival rate of the travelers at the BCP. This parameter has a huge impact on the performance of the BCP. In the current framework, the arrival rates are static, but, for feasible real-time operation, the arrival rates should be estimated for each time frame [65]. As soon as the agent is generated, it is assigned to the start stage which marks the start of the simulation. Waiting time is identified based on the occupancy of the server (component group) and the next stage is identified as explained previously. Stages are separated by a distance that is equivalent to the physical distance between the interaction points in a BCP. Hence, in addition to the interaction delay for each stage, a further delay is added based on the distance to the next stage and a predefined velocity of the agent. The simulation will terminate as soon as the agent reaches either the pass stage or stop stage stage nodes.

5. Performance Assessment

The performance of a BCP is estimated in four different dimensions, as shown in Table 2. Effectiveness corresponds to the capability of a BCP to identify mala fide travelers. As explained in Section 3.1 (see Figure 1), each BCP observes several threat categories and, thus, a separate detection rate (DR) can be assessed for each category along with an overall detection rate (ODR). For the scope of this paper, we only use the overall detection rate (ODR):
O D R = N m s N m ,
where N m is the number of agents initially generated as mala fide and N m s is the number of mala fide agents who are classified as Suspected by the risk assessment system and are stopped at the BCP.
Flow performance is assessed by analyzing the flow rate, i.e., the number of agents leaving the BCP per unit time. The average flow rate f r is calculated as
f r = N T T ,
where N T is the number of agents processed by the BCP within time T. The average waiting time of normal travelers and queuing behavior are also important to analyze the flow performance of the system. Normal travelers are assumed to pose no risk and should be allowed to cross the BCP without delay. An ideal BCP should allow all bona fide travelers to cross the BCP and should stop all mala fide travelers.
Resources used at a BCP are, by convention, classified into operational costs and overhead or investment costs. A trade-off exists between resources and the flow performance of the BCP, but a user decides the optimal distribution of resources to maintain a desired flow rate:
O P B C P = i = 1 N C n i O P i , O V B C P = i = 1 N C n i O V i ,
where n i is the number of components of the i-th type (specified by number of lanes parameter, as shown in Figure 3), and O P i and O V i are average operational and overhead costs, respectively.
Traveler experience, ethics false alarm rate (FAR), and average waiting time (AWT) are evaluated to estimate the performance of the BCP. The F A R is
f a r = N b s N b ,
where N b is the total number of agents who are initially generated as bona fide and N b s is the total number of bona fide agents stopped at the BCP. A higher FAR implies that a high number of bona fide travelers have been assigned to the evaluation process meant for mala fide agents, which certainly does not contribute to a positive traveler experience.
Average waiting time is the time spent by travelers while waiting in several queues. The average waiting time for bona fide travelers is
T w b = i = 1 N b t i w N b ,
where N b is the total number of bona fide agents and t i w is the total waiting time for the i-th agent.

6. Case Study Setup, Simulation Results, and Discussion

6.1. Simulation Setup

The setup is essentially a comparison study between risk-based and rule-based scenarios. The test cases were created using the BCP arrangement of Schiphol Airport. In the rule-based scenario (Figure 6), travelers are first interviewed by the border guards. Based on the border guard’s assessment, the traveler is either sent for a longer second-line interview or is allowed to cross the border through automatic gates. Queues could appear either at the border guard or at the automatic gate. Border guard performance is characterized as described in Section 4.3. The distance between the stages represents the actual physical distance between different stages at Schiphol Airport. The detailed layout of the border control process at Schiphol airport is proprietary and, therefore, cannot be shown in the paper. However, a detailed arrangement of the resources, which comes close to Schiphol’s ongoing innovative border control implementation plans, is presented in [66,67].
Risk-based configuration (Figure 7) is essentially a rule-based configuration (see the grey box in Figure 7a), appended with information-gathering components to perform a risk assessment. Enrollment kiosk is a mandatory process to register the arrival of individual travelers in the vicinity of BCP and correlate the traveler’s identity with their risk profile. Enrollment kiosk, like the border guard in a rule-based configuration, is a mandatory process. But the enrollment kiosk has a lower service time, thus resulting in an increased flow performance. Random selection, being a logical process, introduces no additional queuing and mimics the functionality of random checks of bona fide travelers by selecting, at random, a fraction of travelers to undergo a detailed check similar to those for Suspected or Unknown categories. Having a higher fraction results in reduced overall throughput and increased FAR, but with increased security.
It is to be noted that the Unknown category also comprises those travelers who opt not to pre-declare their personal information, like social media account, and, therefore, web-intelligence also does not generate any risk information for them. They will eventually undergo a conventional rule-based evaluation. This is an example where other information agreement choices of travelers could be requested because of current legal requirements, also depending on EU member states. However, travelers who decide not to provide this information will still be able to cross the border by undergoing conventional rule-based checks.
In the risk-based configuration shown in Figure 7, there are three travel stages, appr_bcp_stg, at_bcp_stg, and pass_stg, with “enrollment kiosk”, “border guard”, and “automatic gate” components having non-zero service time. All the service time values are listed in Table 3. In terms of the spatial geometry of the BCP, both border guard and automatic gate are placed at a distance of 50 m from the enrollment kiosk. Furthermore, the distance between the border guard and the automatic gate is also 50 m. The distances determine the time required to walk between stages. The interaction times at stages are determined by their components.
The simulator was used in the three pilot use cases of TRESSPASS and has been validated for the applicability of the risk-based methodology. The high-level scenario for the three pilots is described in [66] and the results (excluding the classified information) are presented in [67].
All the simulations were performed on a standard computer without using multithreading and distributive computing. The complexity of the simulation increases with the number of interaction points (stages) or the number of agents. There are other parameters like the number of risk indicators used for traveler profiling that also increase the complexity of the simulation, but these parameters were kept constant for all the simulations. Each simulation took between 2 and 5 min to complete.

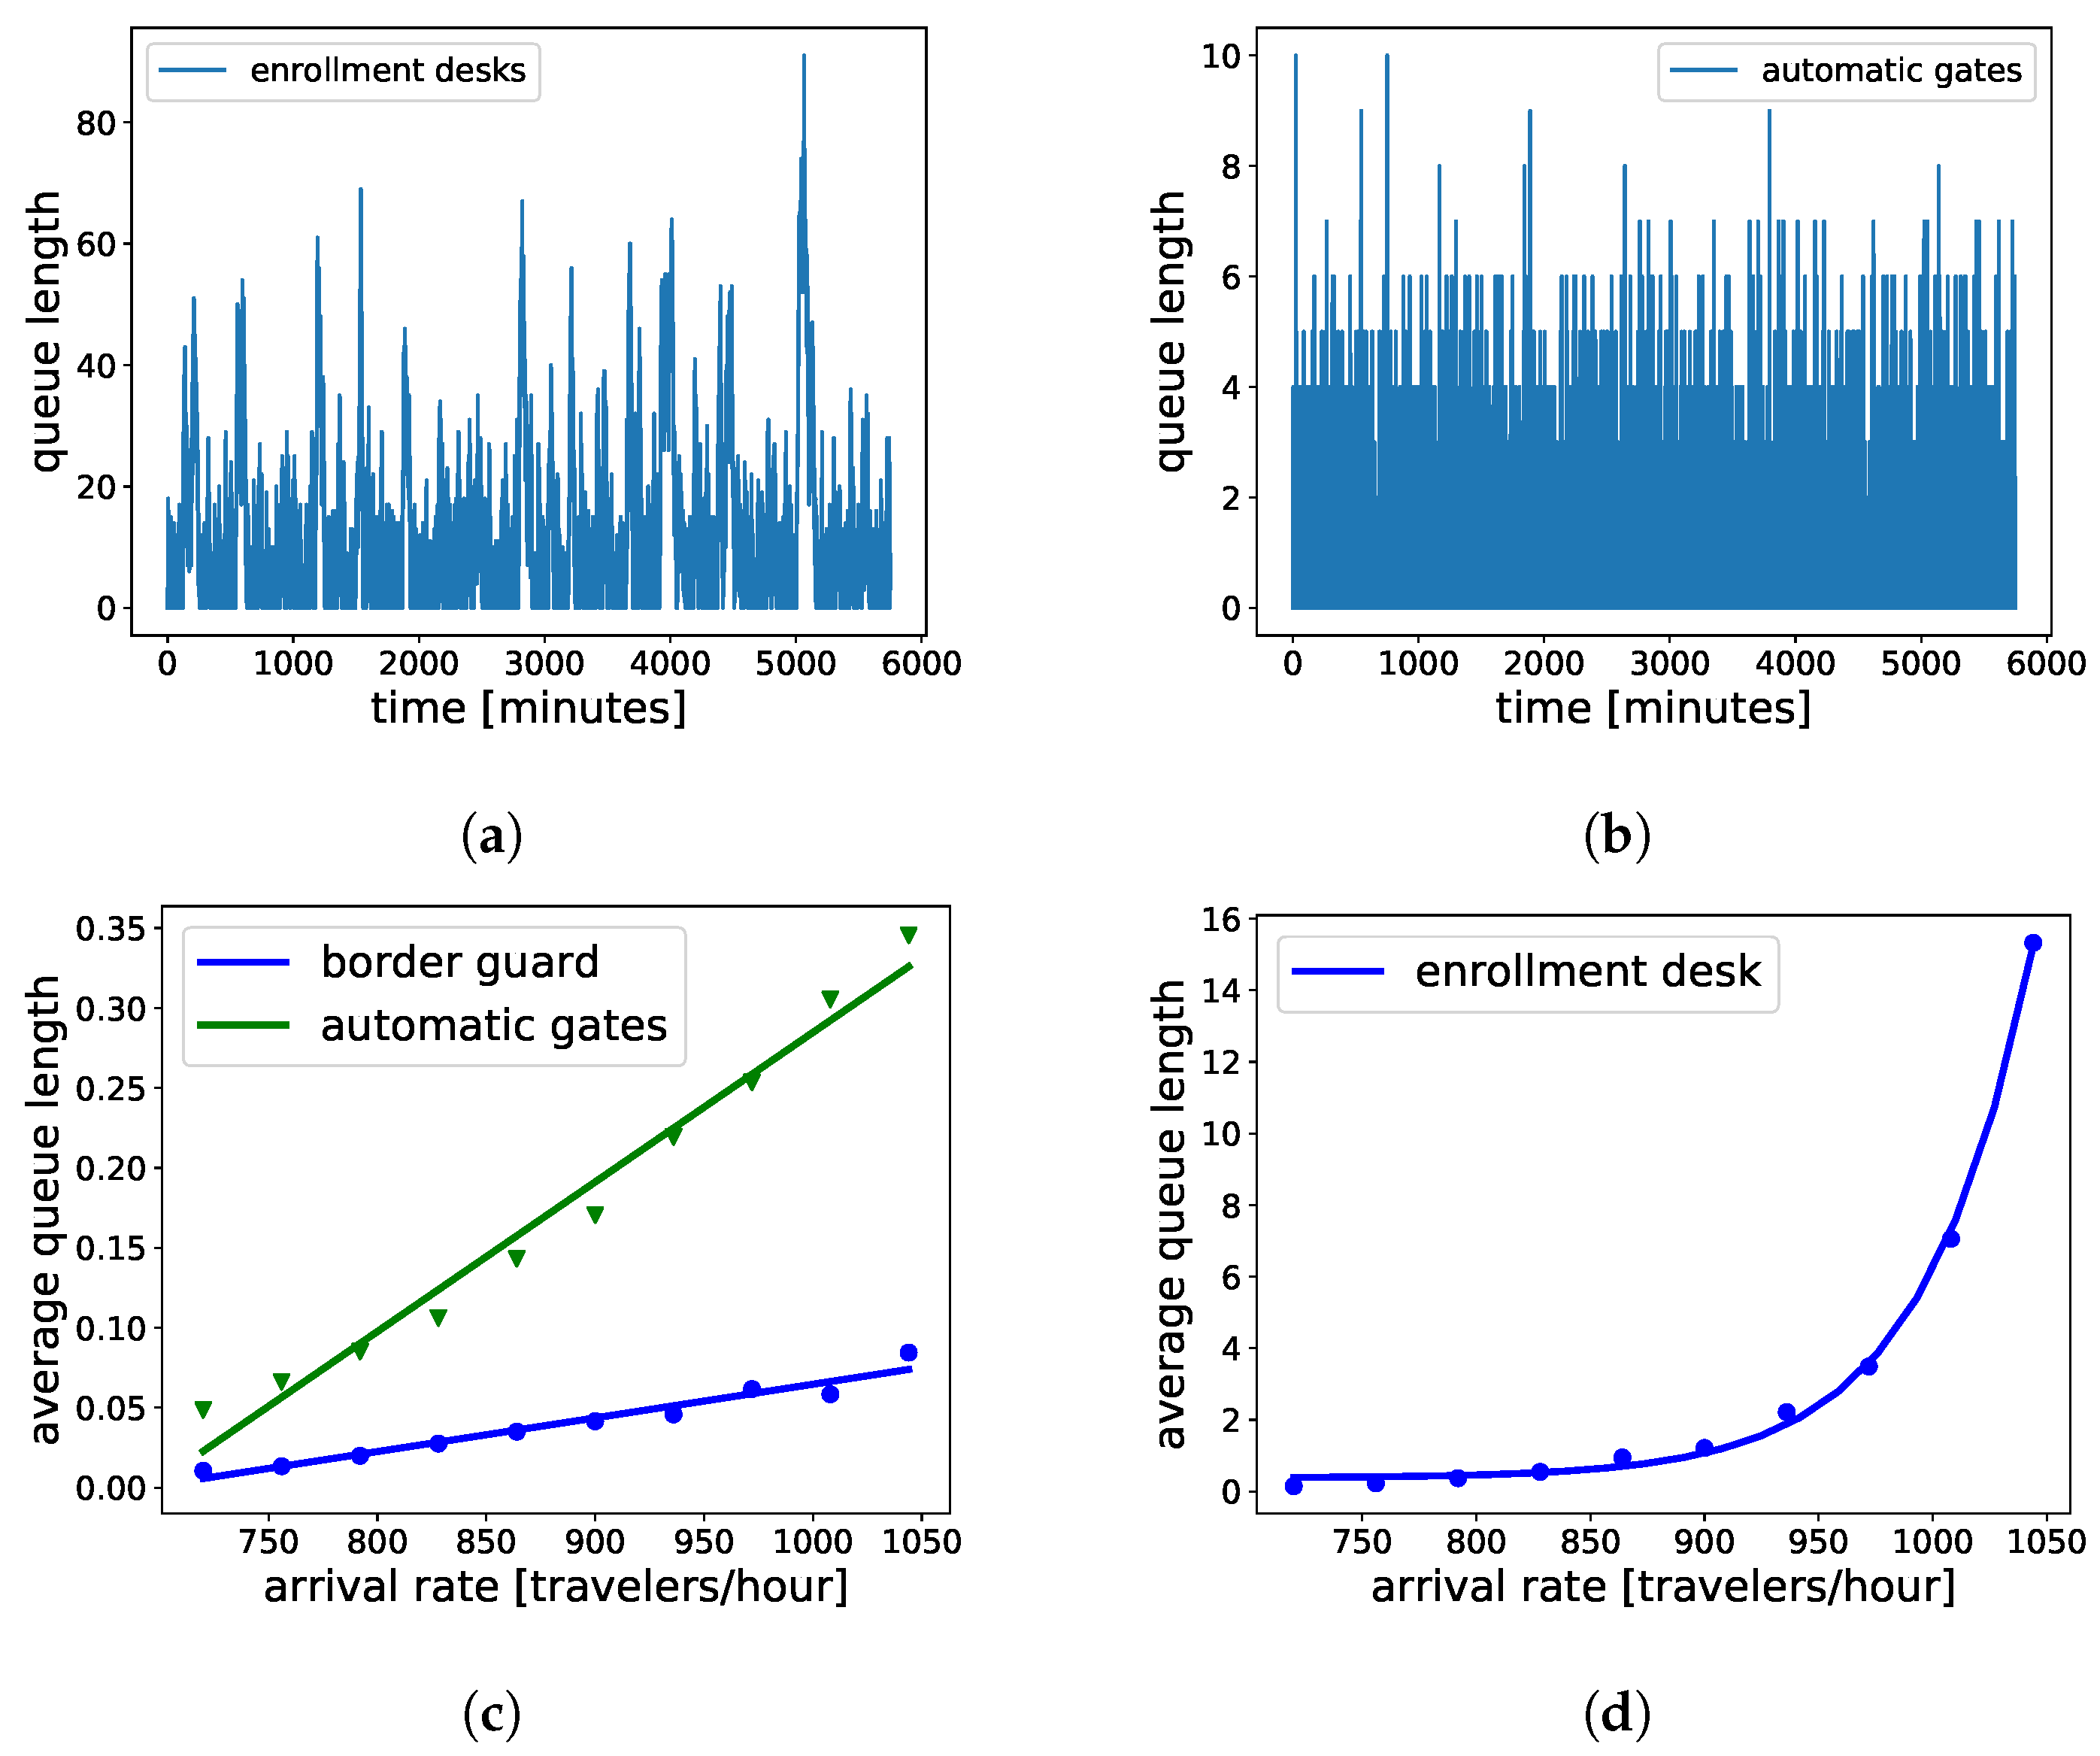
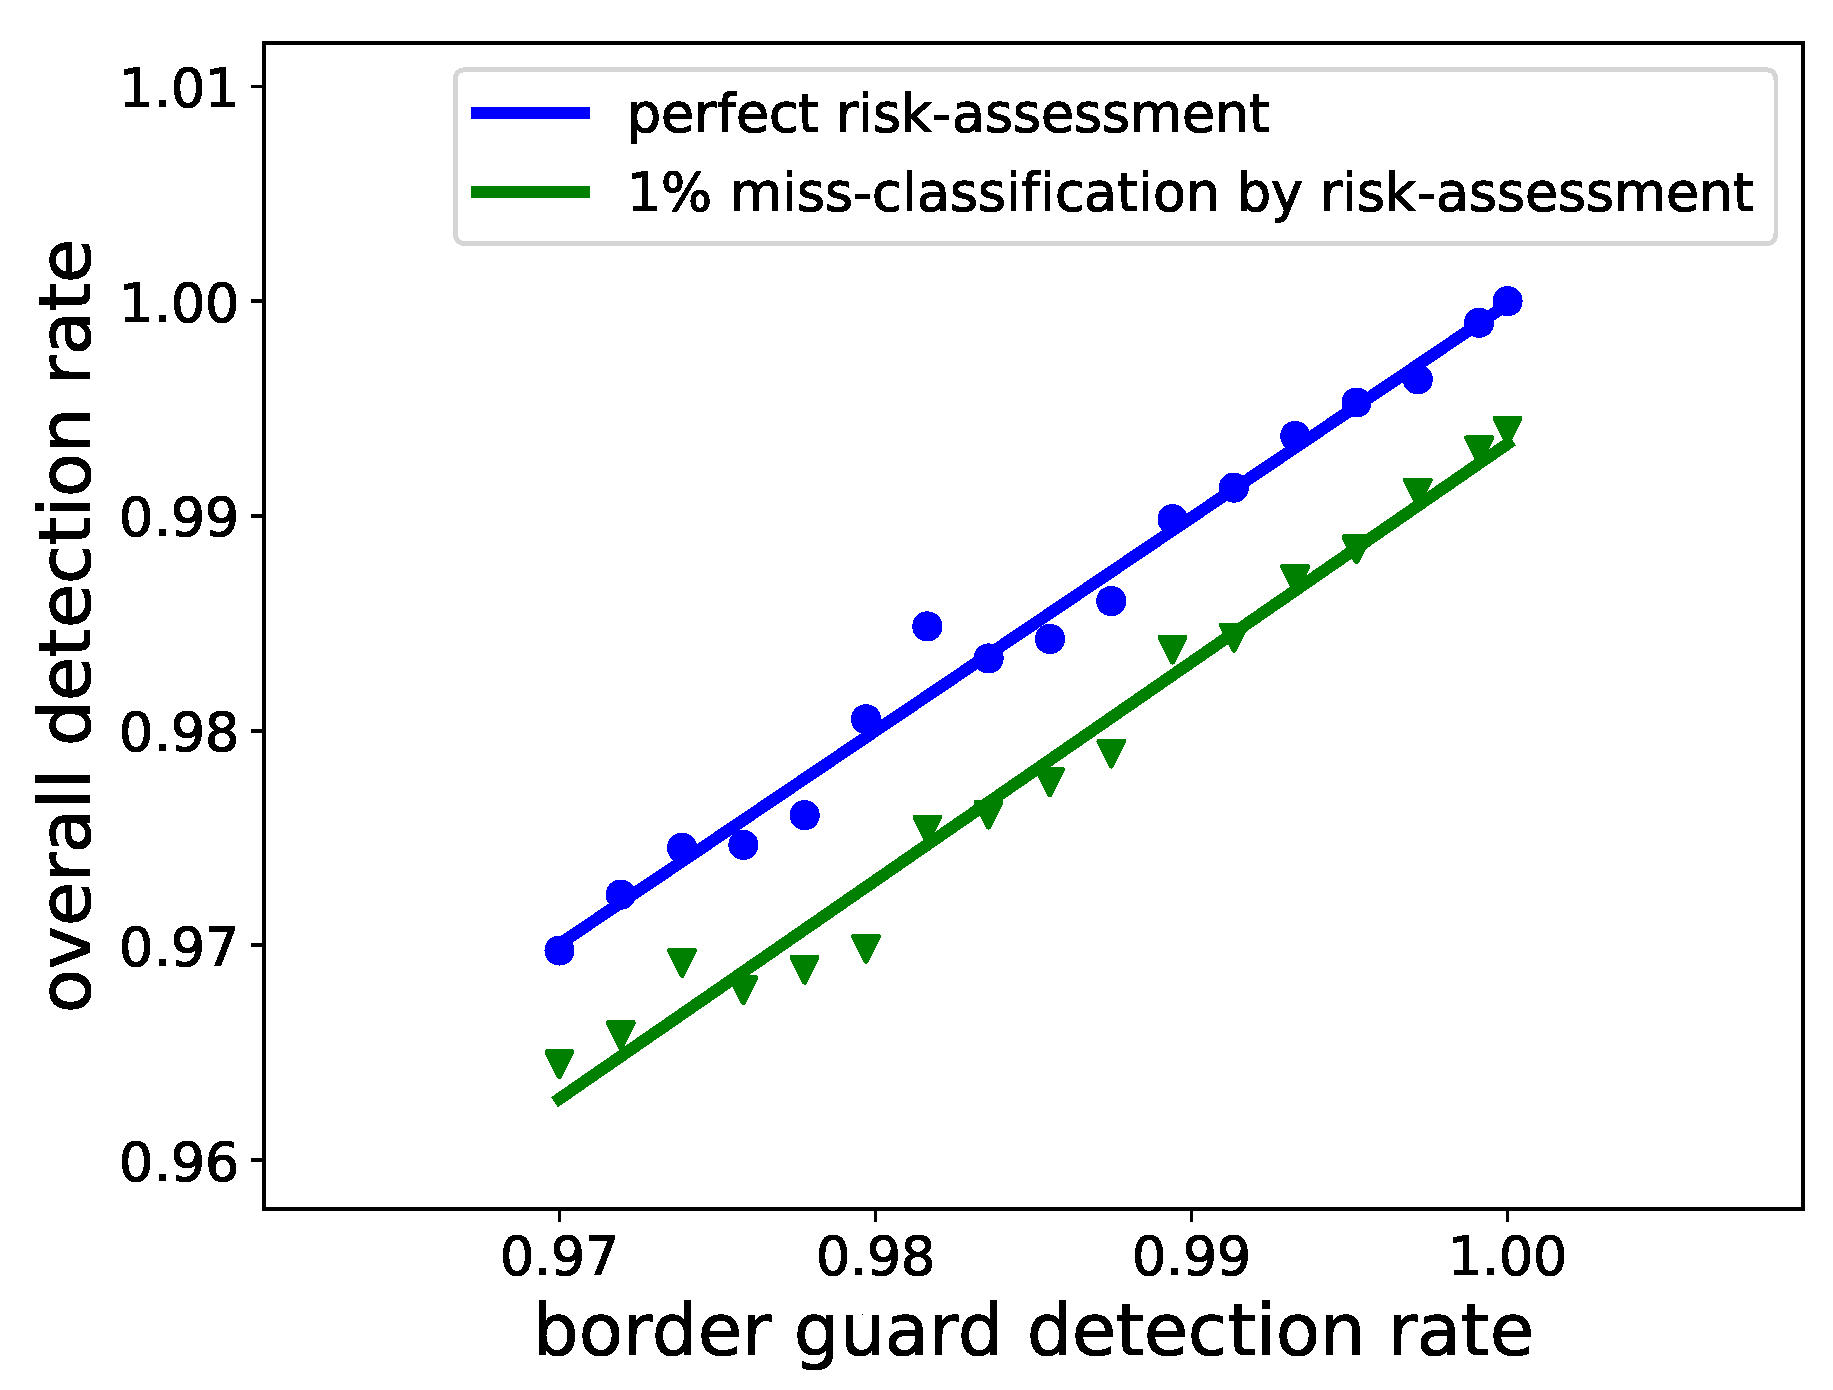
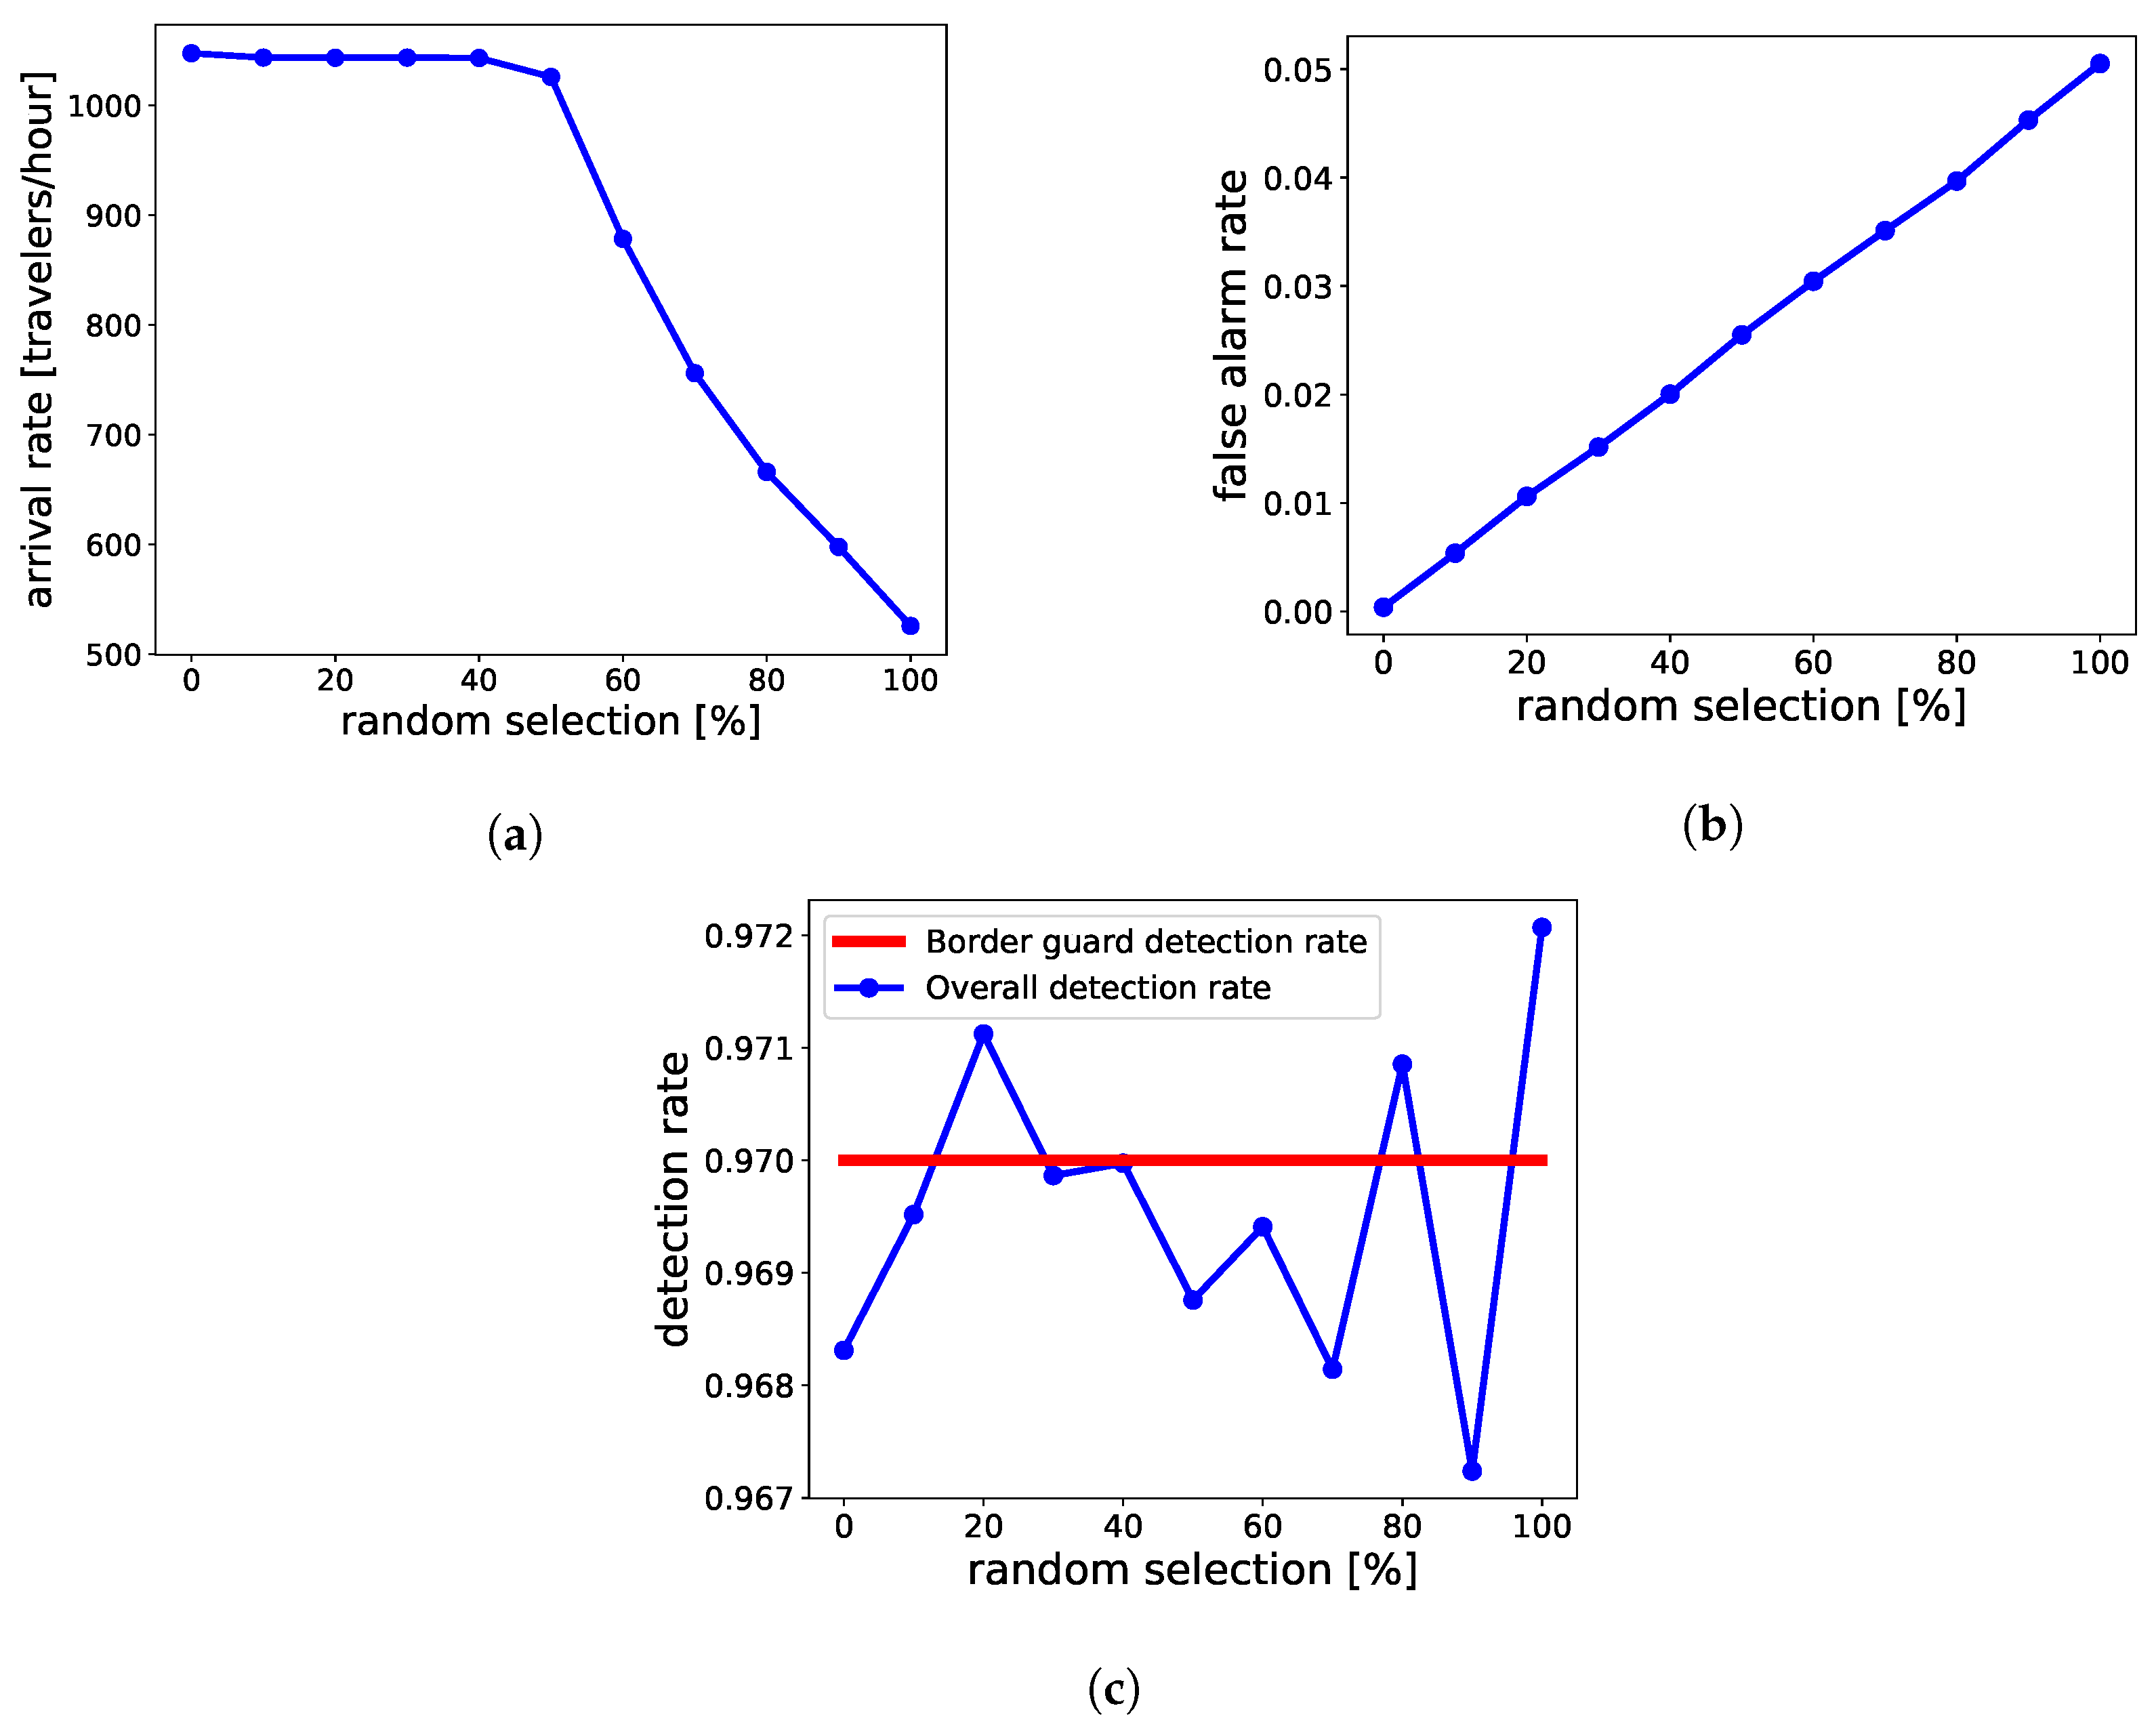
6.2. Results and Discussion

At border control, border guards are the most critical and expensive resource, in particular after the COVID-19 pandemic [68]. In order to estimate the flow performance, Figure 8 compares the maximum arrival rate of travelers that a configuration can handle while keeping the average waiting time of travelers under one minute. Three different types of configurations are compared: rule-based, risk-based, and risk-based with no other bottlenecks, i.e., zero service time for enrollment kiosks.
In the rule-based configuration shown in Figure 6, border guards are the flow bottleneck. This can be avoided either by increasing the number of resources or by reducing the service time of the border guards. To estimate this, the service time of each border guard is kept fixed and the number of resources i.e., border guards, are increased. It can be seen that the risk-based configuration can handle higher traveler flows than the rule-based configuration, assuming the same number of resources are used. Since the risk-based configuration pre-classifies the travelers into a specific risk group, all the travelers lying within Neutral and Trusted profiles cross the border without being interviewed, as long as they are not randomly selected (see Figure 7). This ensures a higher flow rate, according to Equation (2), at the risk-based BCP in comparison to the rule-based equivalent which scrutinized every traveler equally.
In risk-based BCP, the improved flow rate comes at the cost of introducing more queues at enrollment desks. Our scenario has 15 enrollment desks with service time parameters as shown in Table 3. The number of automatic gates is optimized so that no major queue will appear at the gates. In such a configuration, maximum arrival rate handling capacity of the BCP stagnates beyond six border guards (see the gray line in Figure 8). This behavior is due to the extensive queuing at the enrollment desks for arrival rates higher than 1040 travelers per hour, as seen in Figure 9a, which plots the queue length in terms of the number of agents waiting at enrollment desks in the case of 6 border guards and an arrival rate of 1040 travelers/hour. Figure 10 shows the queue plots for the rule-based scenario with six border guards and six automatic gates for comparison. It can be seen that there are almost no queues at the automatic gates because, in this case, the flow bottleneck is the border guards with an ever-increasing queue. Figure 9d shows that the enrollment queues for the risk-based scenario increase exponentially with arrival rate, making it become the flow bottleneck rather quickly. In comparison to this, the queues at the border guard and automatic gates increase linearly (Figure 9c). Extensive queuing at enrollment can be resolved by adding more enrollment desks. The blue line in Figure 8 plots this behavior while assuming that enrollment kiosks introduce no queuing. In the future, enrollment can also take place online before entering the airport using appropriate mobile phone apps [69]. This would reduce the need for airports to provide an ever-increasing number of self-enrollment desks.
Another aspect of the risk-based design is to increase the security effectiveness at the border. This can be facilitated by increasing the service time of the border guards, implying that the border guards spend more time interviewing each traveler, thereby increasing the decision confidence while negatively affecting the flow rate. A better way is to provide the border guard with structured pre-analyzed information about each traveler. This is expected to increase the DR and reduce the false alarms. This hypothesis is tested and plotted in Figure 11. It compares the scenarios of a perfect risk-based system and a risk-based system with 1% mis-classification. A perfect system, even though unrealistic, still gives a baseline for the ODR. The ODR increases linearly with the border guard detection rate (BGDR), implying intelligence gained by them due to the risk-based system. The BGDR in a rule-based system is mostly influenced by the experience of border guards in organizing the traveler-specific interview in a short time. In the risk-based BCPs, the improvement is presumably due to a less training-intensive means and through efficient organization and presentation of the intelligence gained through the risk-based components.
Another parameter that controls the performance of the BCP is the random statistical selection (RS), shown as rand_sel_stg in Figure 7b. It selects a fraction of travelers and sends them in the direction of the red arrow, essentially to the checks meant for the Suspected travelers. This parameter allows the BCP to dynamically adapt to varying arrival patterns of the travelers, e.g., during passenger peak hours [70], when BCP operators can vary this parameter to maintain a fast flow of travelers. Figure 12 shows the effect of RS on arrival rates, ODR, and FAR, i.e., all three performance areas mentioned in Table 2. Figure 12a shows that, up to 50% of RS, the maximum arrival rate is around 1044 travelers/hour. Beyond 50%, the arrival rate reduces almost linearly as more queues appear at border guards, and, to avoid this, the maximum arrival rate has to be reduced. Figure 12b shows that FAR increases linearly with RS; this observation is obvious, as increasing RS of normal travelers leads to increased flow to, and, consequently, increased inspections by, border guards. On the other hand, ODR, instead of increasing, stays rather the same. We assumed a perfect risk assessment, thereby identifying all the mala fide travelers for the border guard inspection. This is visible in Figure 13, where all the mala fide travelers enter at_bcp_stg with border guards due to the perfect risk assessment at pre_travel_stg and appr_bcp_stg, without even entering rand_sel_stg. Since the detection rate of border guards is 0.97 throughout the simulations, the overall detection rate also lies in the proximity of 0.97 with Monte-Carlo-induced randomness.
For a risk-based system to be efficient, it should be socially acceptable. Figure 14 shows the effect of social acceptance on several aspects of the BCP where social acceptance is the percentage of travelers voluntarily agreeing to the risk-based assessment. As per these estimations, a 30% acceptance drops the FAR by 29%, average waiting time by 80%, and queues at border guards by 84%. However, this drop comes at the price of increasing queues at automatic gates (see Figure 14b), which follows an almost linearly increasing trend, but the queue length is still insignificant as compared to the queues at border guards.

7. Conclusions

We conclude that risk-based BCPs provide scalable advantages compared to rule-based systems for increasing passenger flow, although the scalability is achieved at the expense of introducing additional queuing points within the BCP.
Somewhat less obvious are the results regarding achievable detection rates of risk-based BCPs compared with rule-based BCPs. As the border guard is not only confronted with travelers that were assessed to be of high risk or unknown risk, but also a statistically added fraction of travelers from the travelers already assessed as low risk, it can be assumed that the border guard’s decision-making is improving due to more information being made available. This improved detection rate of the border guard proves to have a proportional effect on the overall detection rate of the BCP assuming all other detection rates are not changed. This conclusion holds if the risk classification identifies all mala fide passengers, i.e., assuming that it conservatively overestimates the risk, but does so successfully. The overestimation ensures that all the mala fide travelers are identified but with an added effect of increased false alarm rates, i.e., the increased mis-classification of the bona fide travelers.
It was shown that, for reasonable and even for very high detection rates of border guards, the overall detection rate of the risk-based BCP is counteracted by the mis-classification of the risk-assessment process. However, the risk-based classification can be calibrated during the operation of the checkpoint by proposing a feedback loop to recalibrate the risk classification. This includes a long-term update loop of the risk indicators that constitute the traveler profile. This update should be based on the available intelligence of the modus operandi of mala fide travelers. Another possible way would be to reduce the risk acceptance threshold, which will eventually push the BCP performance towards the rule-based scenario, as more bona fide travelers will undergo the interview by border guards. The effect would be similar to the effects of random sampling, as the process will catch the mala fide travelers who are actually classified as bona fide by the risk assessment.
The dynamic nature of the risk-based BCP enables the user to enhance the flow performance of BCP in real-time during operation. Higher statistical or random selections of bona fide travelers can drastically affect the maximum arrival rate handling capacity of the BCP. As described, this random selection fraction can be reduced during peak travel times to avoid queuing. This also positively affects the false positives. Since the described risk-assessment process is assumed to be perfect, random selection has no effect on the overall detection rate of the BCP.
Finally, we conclude that, if the system will have a higher acceptance among regular travelers, the overall waiting time of bona fide travelers can be reduced drastically. This also reduces the queues at the border guards, enabling them to have a higher service time when needed, i.e., when interviewing mala fide travelers, in turn making better and more informed decisions.
For the follow-up research, the impact of calibration loops on the performance of BCP would be crucial. Currently, the simulator is only restricted to the border control process, but it is also possible to design other processes like customs checks and check-ins within the simulator. The scope would be to study the performance of the complete infrastructure rather than just the border control process, while focusing on all performance areas.

Author Contributions

Conceptualization, A.K.J., J.d.R. and I.H.; methodology, A.K.J. and I.H.; software, A.K.J.; formal analysis, A.K.J. and J.d.R.; writing—original draft preparation, A.K.J.; writing—review and editing, A.K.J., I.H., M.F.-K., A.S. and J.d.R.; visualization, A.K.J. All authors have read and agreed to the published version of the manuscript.

Funding

The authors would like to express their gratitude to the TRESSPASS project (Grant agreement ID: 787120), funded by the EU under the call H2020-SEC-2016-2017, for providing valuable research that supported this work.

Institutional Review Board Statement

Not applicable.

Informed Consent Statement

Not applicable.

Data Availability Statement

Data are contained within the article.

Acknowledgments

The authors extend their thanks to the TRESSPASS consortium and the reviewers for their insightful comments, which played a crucial role in enhancing the quality of this manuscript.

Conflicts of Interest

The authors declare no conflict of interest.

Abbreviations

The following abbreviations are used in this manuscript:
HEUhorizon Europe
EUEuropean Union
TSATransportation Security Administration
EDSexplosive detection systems
BCPborder control point
CONOPSconcept of operations
PNRpassenger name record
BGborder guard
DRdetection rate
ODRoverall detection rate
FARfalse alarm rate

References

  1. FRONTEX. Mission Statement. 2022. Available online: https://frontex.europa.eu/about-frontex/our-mission/ (accessed on 1 April 2023).
  2. DHS. Secure U.S. Borders and Manage Safe, Orderly, and Humane Immigration Processes. 2022. Available online: https://www.dhs.gov/secure-us-borders-and-approaches (accessed on 1 April 2023).
  3. Singh, S.; Singh, M. Explosives detection systems (EDS) for aviation security. Signal Process. 2003, 83, 31–55. [Google Scholar] [CrossRef]
  4. Renger, P.; Siebold, U.; Kaufmann, R.; Häring, I. Semi-Formal Static and Dynamic Modeling and Categorization of Airport Checkpoints; Taylor and Francis Group: London, UK, 2014; pp. 1721–1731. [Google Scholar] [CrossRef]
  5. Chawdhry, P.K. Risk modeling and simulation of airport passenger departures process. In Proceedings of the 2009 Winter Simulation Conference (WSC), Austin, TX, USA, 13–16 December 2009; pp. 2820–2831. [Google Scholar] [CrossRef]
  6. Çelik, G.; Sabuncuoglu, I. Simulation Modeling and Analysis of a Border Security System. Eur. J. Oper. Res. 2007, 180, 1394–1410. [Google Scholar] [CrossRef]
  7. Gkritza, K.; Niemeier, D.; Mannering, F. Airport security screening and changing passenger satisfaction: An exploratory assessment. J. Air Transp. Manag. 2006, 12, 213–219. [Google Scholar] [CrossRef]
  8. Noviantoro, T.; Huang, J.P. Investigating airline passenger satisfaction: Data mining method. Res. Transp. Bus. Manag. 2022, 43, 100726. [Google Scholar] [CrossRef]
  9. Robert, W.P.; Passantino, G. A Risk-Based Airport Security Policy. 2003. Available online: https://reason.org/wp-content/uploads/files/359408528b992e7d0804df1b590dd424.pdf (accessed on 15 April 2023).
  10. EC. Shengen Area. 2022. Available online: https://ec.europa.eu/home-affairs/what-we-do/policies/borders-and-visas/schengen_en (accessed on 15 April 2023).
  11. Drugas, D. Are there good smugglers? Solutions to migrants smuggling into europe. In Analele Universităţii din Oradea. Relaţii Internationale şi Studii Europene (RISE); Editura Universitatii din Oradea: Oradea, Romania, 2018; pp. 71–85. [Google Scholar]
  12. Bove, V.; Böhmelt, T. Does Immigration Induce Terrorism? J. Politics 2016, 78, 572–588. [Google Scholar] [CrossRef]
  13. Lai, K.; Kanich, O.; Dvořák, M.; Drahanský, M.; Yanushkevich, S.; Shmerko, V. Biometric-enabled watchlists technology. IET Biom. 2018, 7, 163–172. [Google Scholar] [CrossRef]
  14. Ceccorulli, M. Back to Schengen: The collective securitisation of the EU free-border area. West Eur. Politics 2019, 42, 302–322. [Google Scholar] [CrossRef]
  15. Štimac, I.; Vidović, A.; Mihetec, T.; Drljača, M. Optimization of Airport Capacity Efficiency by Selecting Optimal Aircraft and Airline Business Model. Sustainability 2020, 12, 3988. [Google Scholar] [CrossRef]
  16. Henke, I.; Esposito, M.; della Corte, V.; del Gaudio, G.; Pagliara, F. Airport Efficiency Analysis in Europe Including User Satisfaction: A Non-Parametric Analysis with DEA Approach. Sustainability 2022, 14, 283. [Google Scholar] [CrossRef]
  17. Lehtonen, P.; Aalto, P. Smart and secure borders through automated border control systems in the EU? The views of political stakeholders in the Member States. Eur. Secur. 2017, 26, 207–225. [Google Scholar] [CrossRef]
  18. Martin-Mazé, M.; Perret, S. Designs of borders: Security, critique, and the machines. Eur. J. Int. Secur. 2021, 6, 278–300. [Google Scholar] [CrossRef]
  19. Stachowitsch, S.; Sachseder, J. The gendered and racialized politics of risk analysis. The case of Frontex. Crit. Stud. Secur. 2019, 7, 107–123. [Google Scholar] [CrossRef] [PubMed]
  20. Casiraghi, S.; Burgess, J.P.; Lidén, K. Social acceptance and border control technologies. In Border Control and New Technologies; ASP Academic and Scientific Publishers: Brussels, Belgium, 2021; pp. 99–115. [Google Scholar]
  21. Calvi, A. Border management law in the European Union. In Border Control and New Technologies; ASP Academic and Scientific Publishers: Brussels, Belgium, 2021; pp. 117–141. [Google Scholar]
  22. XP-DITE. Accelerated Checkpoint Design Integration Test and Evaluation. EU Project, 2012–2017, Grant Agreement ID: 285311. 2017. Available online: https://cordis.europa.eu/project/rcn/104801/factsheet/en (accessed on 25 April 2023).
  23. TRESSPASS. Robust Risk-Based Screening and Alert System for Passengers and Luggage. EU Project, 2018–2021, Grant Agreement ID: 787120. 2021. Available online: https://cordis.europa.eu/project/id/787120 (accessed on 25 April 2023).
  24. Jain, A.K.; Satsrisakul, Y.; Fehling-Kaschek, M.; Häring, I.; Rest, J.V. Towards Simulation of Dynamic Risk-Based Border Crossing Checkpoints. In Proceedings of the 30th European Safety and Reliability Conference and the 15th Probabilistic Safety Assessment and Management Conference, Venice, Italy, 1–5 November 2020; pp. 4446–4452. Available online: https://www.rpsonline.com.sg/proceedings/esrel2020/html/4000.xml (accessed on 25 April 2023).
  25. Thomopoulos, S.C.A. Risk-based security: From theory to practice. In Proceedings of the Signal Processing, Sensor/Information Fusion, and Target Recognition XXX, 2021; Society of Photo-Optical Instrumentation Engineers (SPIE) Conference Series; Kadar, I., Blasch, E.P., Grewe, L.L., Eds.; SPIE Digital Library: Orlando, FL, USA, 2021; Volume 11756, p. 117560M. [Google Scholar] [CrossRef]
  26. Thomopoulos, S.C.A. NARRATION: A platform for curation and scenario creation with application to vulnerability and risk assessment. In Proceedings of the Signal Processing, Sensor/Information Fusion, and Target Recognition XXXI, 2022; International Society for Optics and Photonics, SPIE; Kadar, I., Blasch, E.P., Grewe, L.L., Eds.; SPIE Digital Library: Orlando, FL, USA, 2022; Volume 12122, p. 121220Q. [Google Scholar] [CrossRef]
  27. van der Brinck, M. Final Report Summary—XP-DITE (Accelerated Checkpoint Design Integration Test and Evaluation). 2017. Available online: https://cordis.europa.eu/docs/results/285/285311/final1-xp-dite-final-report-publishable-summary.pdf (accessed on 1 June 2023).
  28. Homeland Security. INS Passenger Accelerated Service System (INSPASS). 2011. Available online: https://www.globalsecurity.org/security/systems/inspass.htm (accessed on 1 April 2023).
  29. Leese, M. Standardizing security: The business case politics of borders. Mobilities 2018, 13, 261–275. [Google Scholar] [CrossRef]
  30. Přihodová, K.; Hub, M. Biometric Privacy through Hand Geometry—A Survey. In Proceedings of the 2019 International Conference on Information and Digital Technologies (IDT), Zilina, Slovakia, 25–27 June 2019; pp. 395–401. [Google Scholar] [CrossRef]
  31. DOJ. Immigration and Naturalization Services Passenger Accelerated Service System (INSPASS) Pilot Program. Audit Report 95-8. 1995. Available online: https://oig.justice.gov/reports/immigration-and-naturalization-service-passenger-accelerated-service-system-pilot-program# (accessed on 1 May 2023).
  32. CBP. APIS: Advance Passenger Information System. 2018. Available online: https://www.cbp.gov/travel/travel-industry-personnel/apis2 (accessed on 1 May 2023).
  33. CBP. Expedite Cross-Border Travel with NEXUS. 2021. Available online: https://www.cbp.gov/newsroom/local-media-release/expedite-cross-border-travel-nexus (accessed on 1 May 2023).
  34. CBP. FAST: Free and Secure Trade for Commercial Vehicles. 2022. Available online: https://www.cbp.gov/travel/trusted-traveler-programs/fast (accessed on 1 May 2023).
  35. Lalonde, P.C. Border Security Meets Black Mirror: Perceptions of Technologization from the Windsor Borderland. J. Borderl. Stud. 2021, 36, 1–22. [Google Scholar] [CrossRef]
  36. SCHIPOL. PRIVIUM. 2001. Available online: https://www.schiphol.nl/en/privium/ (accessed on 15 May 2023).
  37. Paul, R. Harmonisation by risk analysis? Frontex and the risk-based governance of European border control. J. Eur. Integr. 2017, 39, 689–706. [Google Scholar] [CrossRef]
  38. Balzacq, T. Security Versus Freedom? A Challenge for Europe’s Future, 1st ed.; Routledge: New York, NY, USA, 2016. [Google Scholar]
  39. Lindblom, S.; Castren, J. Implementation of European Union security strategies in the context of Integrated Border Management. In Remapping Security on Europe’s Northern Borders; Routledge: London, UK, 2021; p. 15. [Google Scholar] [CrossRef]
  40. Sagrera, R.H. Exporting EU integrated border management beyond EU borders: Modernization and institutional transformation in exchange for more mobility? Camb. Rev. Int. Aff. 2014, 27, 167–183. [Google Scholar] [CrossRef]
  41. Riya, S. Linking Land Borders: India’s Integrated Check Points. CSEP Woriking Paper-9. 2001. Available online: https://csep.org/wp-content/uploads/2021/06/WP_Linking-land-borders-ICP-1.pdf (accessed on 1 May 2023).
  42. EC. Automated Border Control (ABC). CSEP Woriking Paper-9. 2022. Available online: https://home-affairs.ec.europa.eu/pages/glossary/automated-border-control-abc_en (accessed on 1 May 2023).
  43. Zawadzka, S. Biometric technology in European Union border management after 2015. Przegląd Geopolityczn 2022, 39, 93–113. [Google Scholar]
  44. Lin, I.C.; Hung, W.H. Establishment of Biometric Verification System Based on Design Science Research Methodology and Sensing System for Smart Border Control. Sens. Mater. 2021, 33, 1897. [Google Scholar] [CrossRef]
  45. IATA. One iD, Concept Paper. 2018. Available online: https://www.iata.org/contentassets/1f2b0bce4db4466b91450c478928cf83/oneid-concept-paper.pdf (accessed on 13 May 2023).
  46. TRESSPASS. TRESSPASS: Robust Risk Based Screening and Alert System for PASSengers and Luggage. D1.2a Conceptual Model. 2023. Available online: http://resolver.tudelft.nl/uuid:99683d0b-36ea-4941-bc8e-1bd527a9c614 (accessed on 13 May 2023).
  47. Zhang, Z.G.; Luh, H.P.; Wang, C.H. Modeling Security-Check Queues. Manag. Sci. 2011, 57, 1979–1995. [Google Scholar] [CrossRef]
  48. Nie, X.; Parab, G.; Batta, R.; Lin, L. Simulation-based Selectee Lane queueing design for passenger checkpoint screening. Eur. J. Oper. Res. 2012, 219, 146–155. [Google Scholar] [CrossRef]
  49. Ruiz, N.; Giret, A.; Alvarado, O.; Perez, V.; Rodriguez, R.M.; Julián, V. Agent-Based Simulation For Border Crossing Modeling. Cybern. Syst. 2014, 45, 650–670. [Google Scholar] [CrossRef]
  50. McLay, L.A.; Lee, A.J.; Jacobson, S.H. Risk-Based Policies for Airport Security Checkpoint Screening. Transp. Sci. 2010, 44, 333–349. [Google Scholar] [CrossRef]
  51. McLay, L.A.; Jacobson, S.H.; Kobza, J.E. A multilevel passenger screening problem for aviation security. Nav. Res. Logist. (NRL) 2006, 53, 183–197. [Google Scholar] [CrossRef]
  52. Nikolaev, A.G.; Lee, A.J.; Jacobson, S.H. Optimal Aviation Security Screening Strategies With Dynamic Passenger Risk Updates. IEEE Trans. Intell. Transp. Syst. 2012, 13, 203–212. [Google Scholar] [CrossRef]
  53. Janssen, S.; Sharpanskykh, A.; Curran, R. AbSRiM: An Agent-Based Security Risk Management Approach for Airport Operations. Risk Anal. 2019, 39, 1582–1596. [Google Scholar] [CrossRef]
  54. Radil, S.M.; Pinos, J.C.; Ptak, T. Borders resurgent: Towards a post-COVID-19 global border regime? Space Polity 2021, 25, 132–140. [Google Scholar] [CrossRef]
  55. EU. Directive (eu) 2016/681 of the European Parliament and of the Council: On the Use of Passenger Name Record (PNR) Data for the Prevention, Detection, Investigation and Prosecution of Terrorist Offences and Serious Crime. 2016. Available online: http://data.europa.eu/eli/dir/2016/681/oj (accessed on 13 May 2023).
  56. EU. Schengen Information System. 2022. Available online: https://ec.europa.eu/home-affairs/policies/schengen-borders-and-visa/schengen-information-system_en (accessed on 1 May 2023).
  57. EU. Visa Information System. 2022. Available online: https://home-affairs.ec.europa.eu/policies/schengen-borders-and-visa/visa-information-system_en (accessed on 1 May 2023).
  58. Arroyo, R.; Yebes, J.J.; Bergasa, L.M.; Daza, I.G.; Almazán, J. Expert video-surveillance system for real-time detection of suspicious behaviors in shopping malls. Expert Syst. Appl. 2015, 42, 7991–8005. [Google Scholar] [CrossRef]
  59. Rezaee, K.; Rezakhani, S.; Khosravi, M.; Moghimi, M.K. A survey on deep learning-based real-time crowd anomaly detection for secure distributed video surveillance. Pers. Ubiquitous Comput. 2021, 25, 1–17. [Google Scholar] [CrossRef]
  60. Mudgal, M.; Punj, D.; Pillai, A. Suspicious Action Detection in Intelligent Surveillance System Using Action Attribute Modelling. J. Web Eng. 2021, 20, 129–146. [Google Scholar] [CrossRef]
  61. Shi, Y.; Zhou, X.; Cheng, J.; Wang, L.; Luo, D.; Guo, Y.; Yang, E.; Zhang, L.; Han, L.; Li, Z.; et al. “One-Time Face Recognition System” Drives Changes in Civil Aviation Smart Security Screening Mode; Springer: Singapore, 2021; pp. 399–425. [Google Scholar] [CrossRef]
  62. Sverdrup-Thygeson, B.; Engesæth, V. Intelligence Analysis in the Digital Age; Chapter Open-Source and Social Media Intelligence; Taylor and Francis Group: Abingdon, UK, 2023; Chapter 5. [Google Scholar]
  63. Valdivia, A.; Serrajòrdia, J.; Swianiewicz, A. There is an elephant in the room: Towards a critique on the use of fairness in biometrics. AI Ethics 2022, 2, 1–16. [Google Scholar] [CrossRef]
  64. Gariup, M.; Soederlind, G. Document Fraud Detection at the Border: Preliminary Observations on Human and Machine Performance. In Proceedings of the 2013 European Intelligence and Security Informatics Conference, Uppsala, Sweden, 12–14 August 2013; pp. 231–238. [Google Scholar] [CrossRef]
  65. Jain, A.; Grumber, C.; Gelhausen, P.; Häring, I.; Stolz, A. A Toy Model Study for Long-Term Terror Event Time Series Prediction with CNN. Eur. J. Secur. Res. 2020, 5, 1–21. [Google Scholar] [CrossRef]
  66. TRESSPASS. TRESSPASS: Robust Risk based Screening and Alert System for PASSengers and Luggage. D1.3 High-Level Scenarios. 2023. Available online: http://resolver.tudelft.nl/uuid:aa0f20a4-809c-4770-a40e-792f7a39f348 (accessed on 13 May 2023).
  67. TRESSPASS. TRESSPASS: Robust Risk based Screening and Alert System for PASSengers and Luggage D8.5 Lessons Learnt from Pilots KEMEA Report. 2023. Available online: http://resolver.tudelft.nl/uuid:3040bf47-5750-4c02-96cc-9fb059ab580e (accessed on 13 May 2023).
  68. The Guardian. Germany Looks to Temporary Foreign Workers to Ease Airport Staff Shortages. 2022. Available online: https://www.theguardian.com/world/2022/jun/27/germany-temporary-foreign-workers-ease-airport-staff-shortages-turkey (accessed on 13 May 2023).
  69. Heiets, I.; La, J.; Zhou, W.; Xu, S.; Wang, X.; Xu, Y. Digital transformation of airline industry. Res. Transp. Econ. 2022, 92, 101186. [Google Scholar] [CrossRef]
  70. Di Mascio, P.; Moretti, L.; Piacitelli, M. Airport Landside Sustainable Capacity and Level of Service of Terminal Functional Subsystems. Sustainability 2020, 12, 8784. [Google Scholar] [CrossRef]
Figure 1. (a) Each border control point (BCP) considers several threat categories corresponding to identified threats and a trusted category that are composed of a set of risk indicators. These indicators are used to generate a risk score which is compared with a threshold by a decision rule; (b) Each risk indicator is determined from heterogeneous data sources (e.g., databases, cameras, the world wide web, sensors, etc.) along with a confidence value using data fusion.
Sustainability 15 12991 g001
Figure 2. Risk group categorization of travelers according to N factors for threat categories and a trustworthy factor.
Sustainability 15 12991 g002
Figure 3. Sample checkpoint with three lanes. (a) A real scenario representing three queues consisting of ID checks and border guards, i.e., same components. (b) The equivalent behavior is replicated in a simulation using a component group, which itself consists of the components (ID check system and border guard in this case). The component group X is associated with a stage where the number of queuing points is defined by the parameter number of lanes.
Sustainability 15 12991 g003
Figure 4. A simple BCP with five travel stages and component groups, with six different types of components The color scheme of the arrows is the same as the color scheme of the risk groups shown in Figure 2.
Sustainability 15 12991 g004
Figure 5. Modeling of the border guard: (a) The confusion matrix represents the classification of travelers as suspected and trusted by the risk-assessment method. The possible classifications are True suspected (TS), False trusted (FT), False suspected (FS), and True trusted (TT). These classes act as the a priori for the border guard evaluation; (b) Border guards are considered as binary components, with the output class either to be “Alarm (A)” or “Clear (C)”; based on the a priori and the output class, there are eight possibilities, as shown in the figure.
Sustainability 15 12991 g005
Figure 6. Rule-based configuration. (a) The logical flow of travelers with different risk categories between the travel stages. (b) The equivalent representation used within the simulation, where the risk categories are color coded as in Figure 2.
Sustainability 15 12991 g006
Figure 7. Risk-based BCP configuration with 7 stages and 10 components, where (a) shows the logical flow and (b) is equivalent simulation flow. The color coding of the arrows uses the same convention as in Figure 2.
Sustainability 15 12991 g007
Figure 8. Comparison of the maximum arrival rate of travelers that a border control process can handle. The results are extracted while ensuring that the average waiting time of the travelers for each configuration is around one minute.
Sustainability 15 12991 g008
Figure 9. Queue length in terms of the number of waiting agents plotted for risk-based configuration with 6 border guards, 15 enrollment desks, and 6 automatic gates for (a) automatic gates, and (b) enrollment desks. Average queue length plotted for the same configuration with increasing arrival rate at (c) border guard desks and automatic gates, and (d) enrollment gates.
Sustainability 15 12991 g009
Figure 10. Queue length in terms of the number of waiting agents plotted for rule-based configuration for (a) automatic gates and (b) border guards. The configuration has 6 border guards, 6 automatic gates, and an arrival rate of 1040 travelers/hour, and was simulated for 50,000 agents.
Sustainability 15 12991 g010
Figure 11. Overall detection rate (ODR) plotted against the border guard detection rate (BGDR) in a risk-based paradigm. The increase in BGDR is due to the intelligence gained by the risk-based system. The interpolation is plotted using linear regression.
Sustainability 15 12991 g011
Figure 12. Effect of changing the random selection of travelers for border guard checks on (a) Maximum arrival rate handling capacity of the BCP; (b) FAR of the BCP; and (c) ODR of the BCP. The red line indicates the detection rate of the border guards used for the simulations.
Sustainability 15 12991 g012
Figure 13. The movement of travelers among BCP stages. It can be seen that all the mala fide travelers (orange) visited the border guard desk (bg_desk_stg) after the enrollment desk (appr_bdk_stg), as depicted by the red arrow in Figure 7b.
Sustainability 15 12991 g013
Figure 14. Social acceptance pattern of the risk-based BCPs on (a) average queue length at the border guard desk, (b) average queue length at automatic gates, and (c) false alarm rate and average waiting time of travelers.
Sustainability 15 12991 g014
Table 1. Mapping of border guard performance model to the ontology used by the border control operators.
ParameterBorder Control Ontology
TS–TADetection rate 1 ( D R 1 )
FT–TADetection rate 2 ( D R 2 )
FS–FAFalse alarm rate 1 ( F A R 1 )
TT–FAFalse alarm rate 2 ( F A R 2 )
Table 2. Dimensions of BCP performance.
BCP Performance Dimensions
Security EffectivenessFlowResourceTraveler Experience and Ethics
1. Overall detection rate1. Flow rate1. Operation cost1. False alarm rate
2. Average waiting time2. Overhead cost2. Average waiting time
Table 3. Service time parameters of the components with non-zero service time for the simulated configurations. The distributions are assumed to be Gaussian.
Component NameMean Service Time (s)Standard Deviation (s)
Rule-based configuration
Border guard527
Automatic gate155
Risk-based configuration
Enrollment kiosk5020
Border guard527
Automatic gate155
Risk-based config. with no bottlenecks
Enrollment kiosk00
Border guard527
Automatic gate155
Disclaimer/Publisher’s Note: The statements, opinions and data contained in all publications are solely those of the individual author(s) and contributor(s) and not of MDPI and/or the editor(s). MDPI and/or the editor(s) disclaim responsibility for any injury to people or property resulting from any ideas, methods, instructions or products referred to in the content.

