1. Introduction
In 1950, 33% of the world’s population was urban and 67% was rural. Since then, these percentages have almost been inverted: by 2050, 72% of Earth’s inhabitants are expected to be living in urban centres and just 28% in rural areas [
1,
2]. Latin America and the Caribbean is the developing region with the highest level of urbanisation. According to projections, between the years 2000 and 2025, the urban population will grow 1.5% higher than the total population rate year on year [
3]. By 2050, 86% of Latin American inhabitants will reside in urban centres [
4]. This prospect is not so remote from current settlement patterns in the region; at present, 82% of people dwell in urban sites [
1,
3]. However, the development process in Latin American cities has been marked by particularly chaotic and dispersed growth in ecologically vulnerable zones, a reduction in space for food production, and amplified inequalities in social and territorial respects [
5].
In Colombia, approximately 85% of the national GDP is produced in urban centres [
6]. This reveals a strong positive relationship between urbanisation and per capita income in the country’s regions. This speaks to the importance of mid-sized cities for Colombia’s future development and urban sustainability [
7] insofar as urbanisation is most pronounced in settlements of this size.
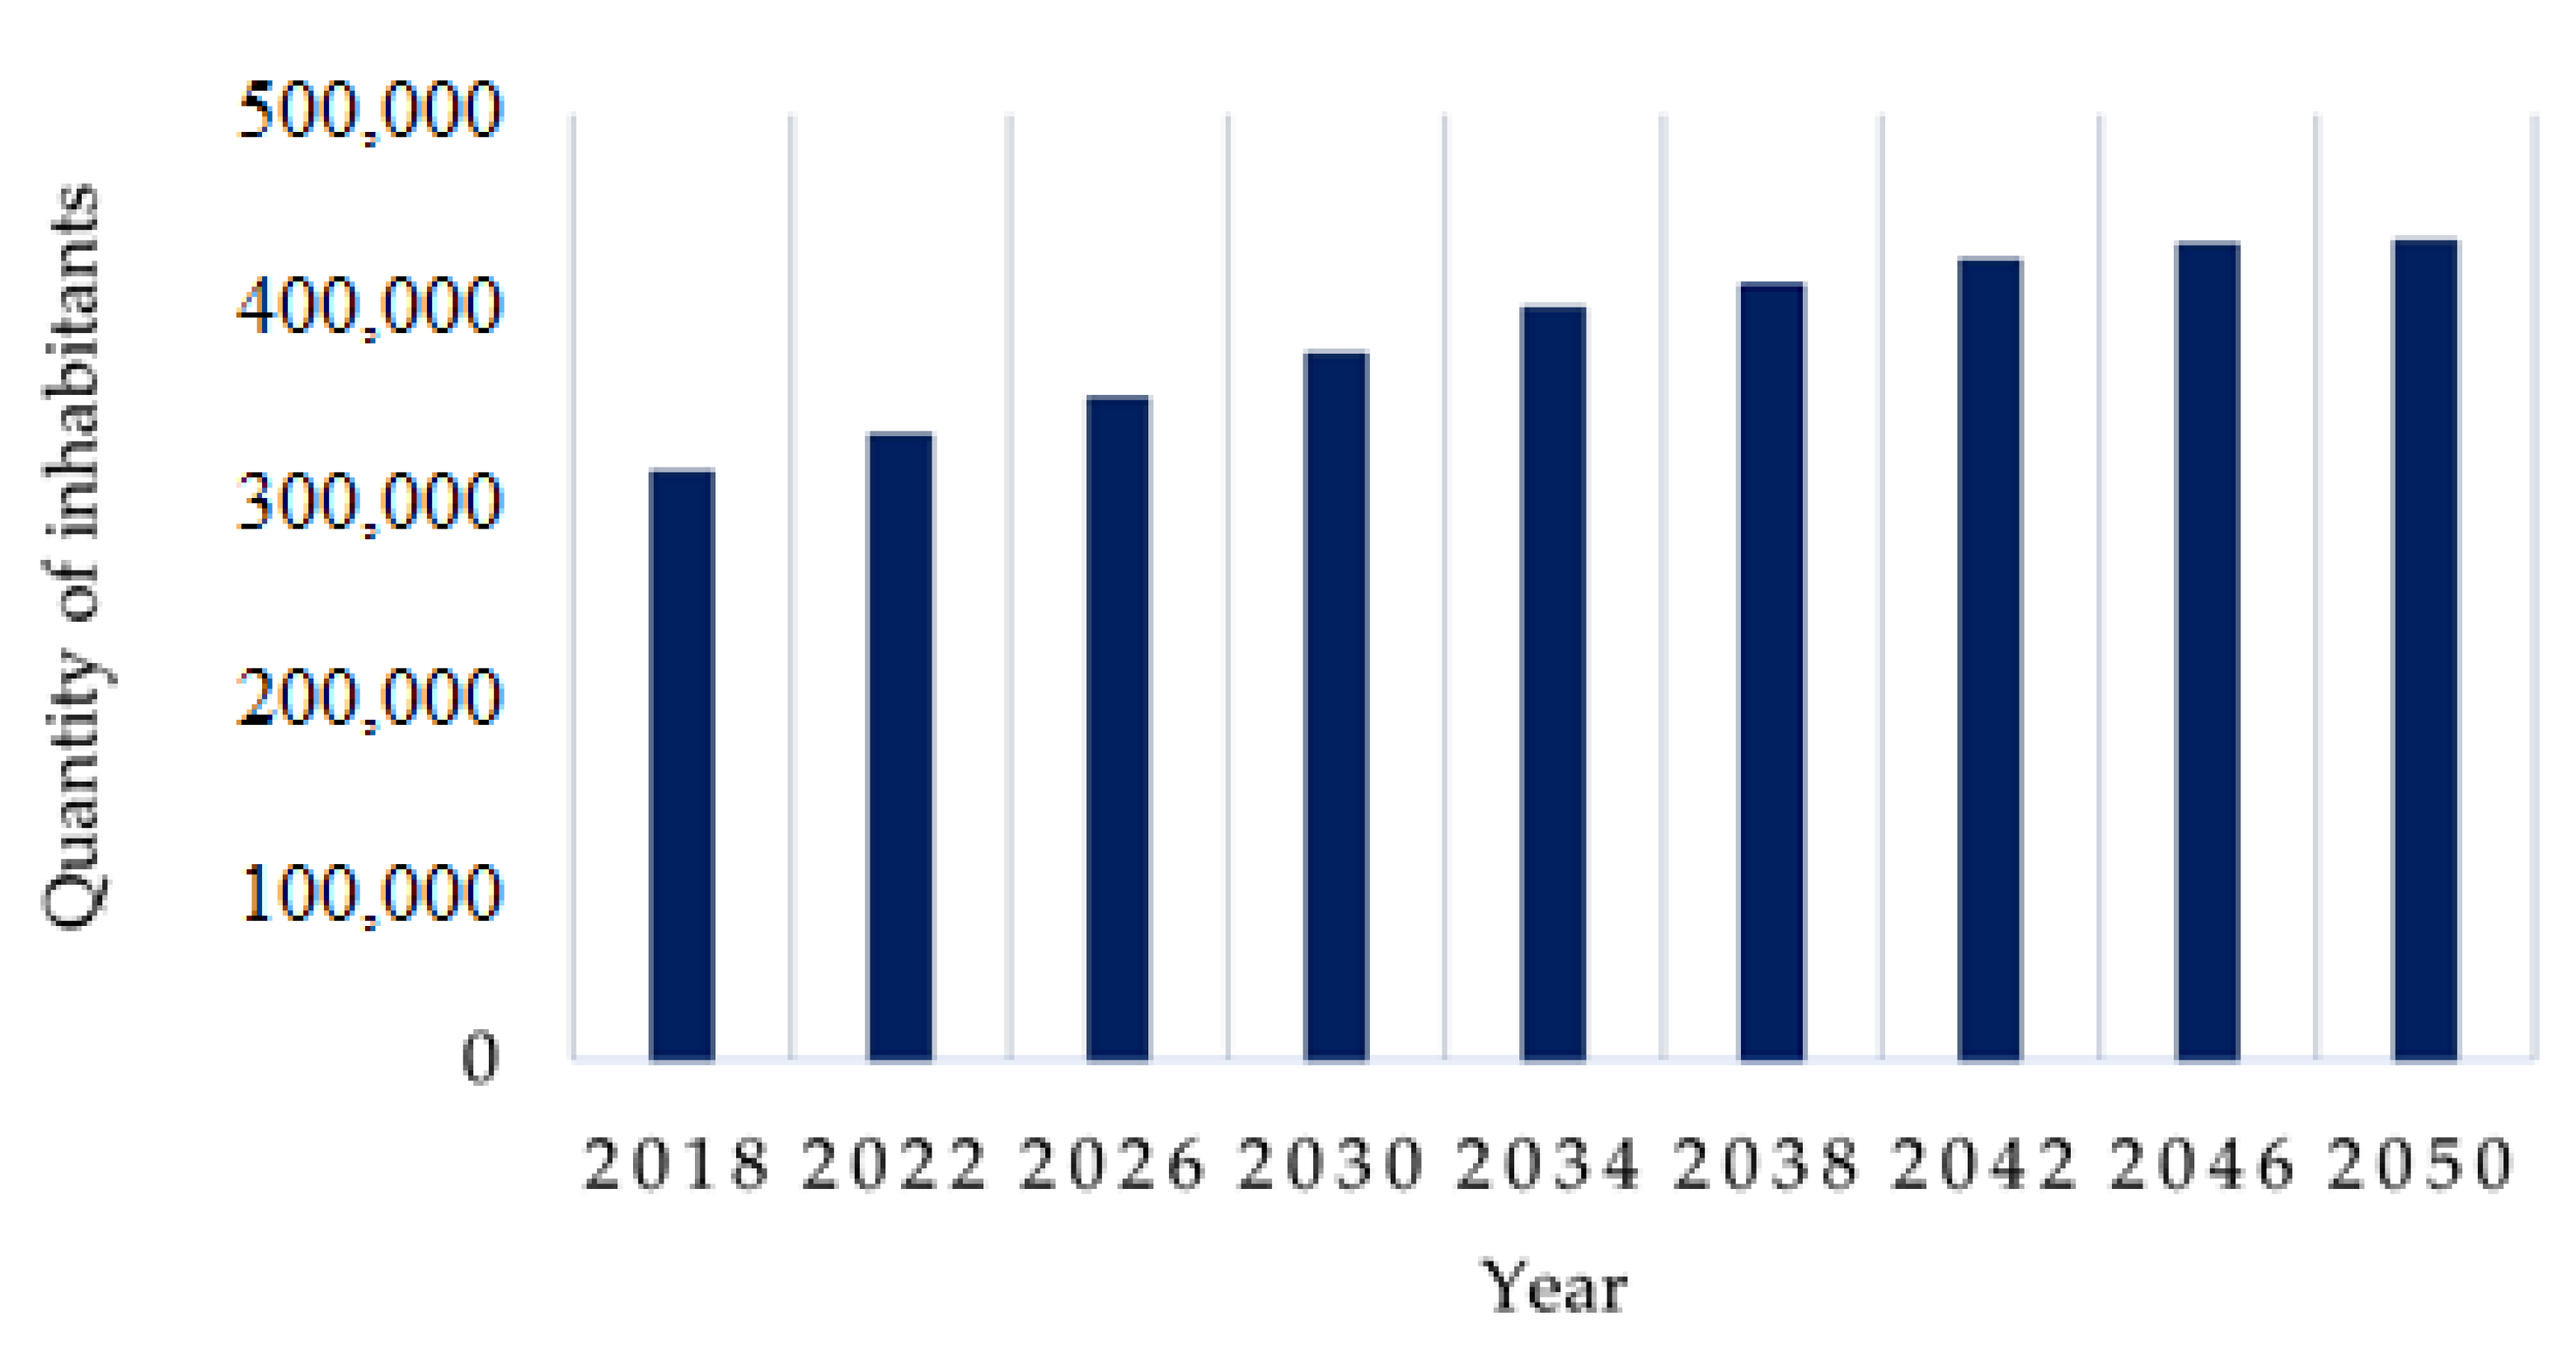
One such example is Popayán, home to more than 80% of the current urban population of the Cauca Department, which continues to grow amid patterns of urbanisation, e-commerce, and the fragmentation of traditional supply chains. According to data from DANE [
8], as of 2023, the city’s population density is equivalent to 49.97 inhabitants/km
2 with a total population of 333,328 inhabitants; by 2050, this population is projected to rise by 23% (432,631 inhabitants) (
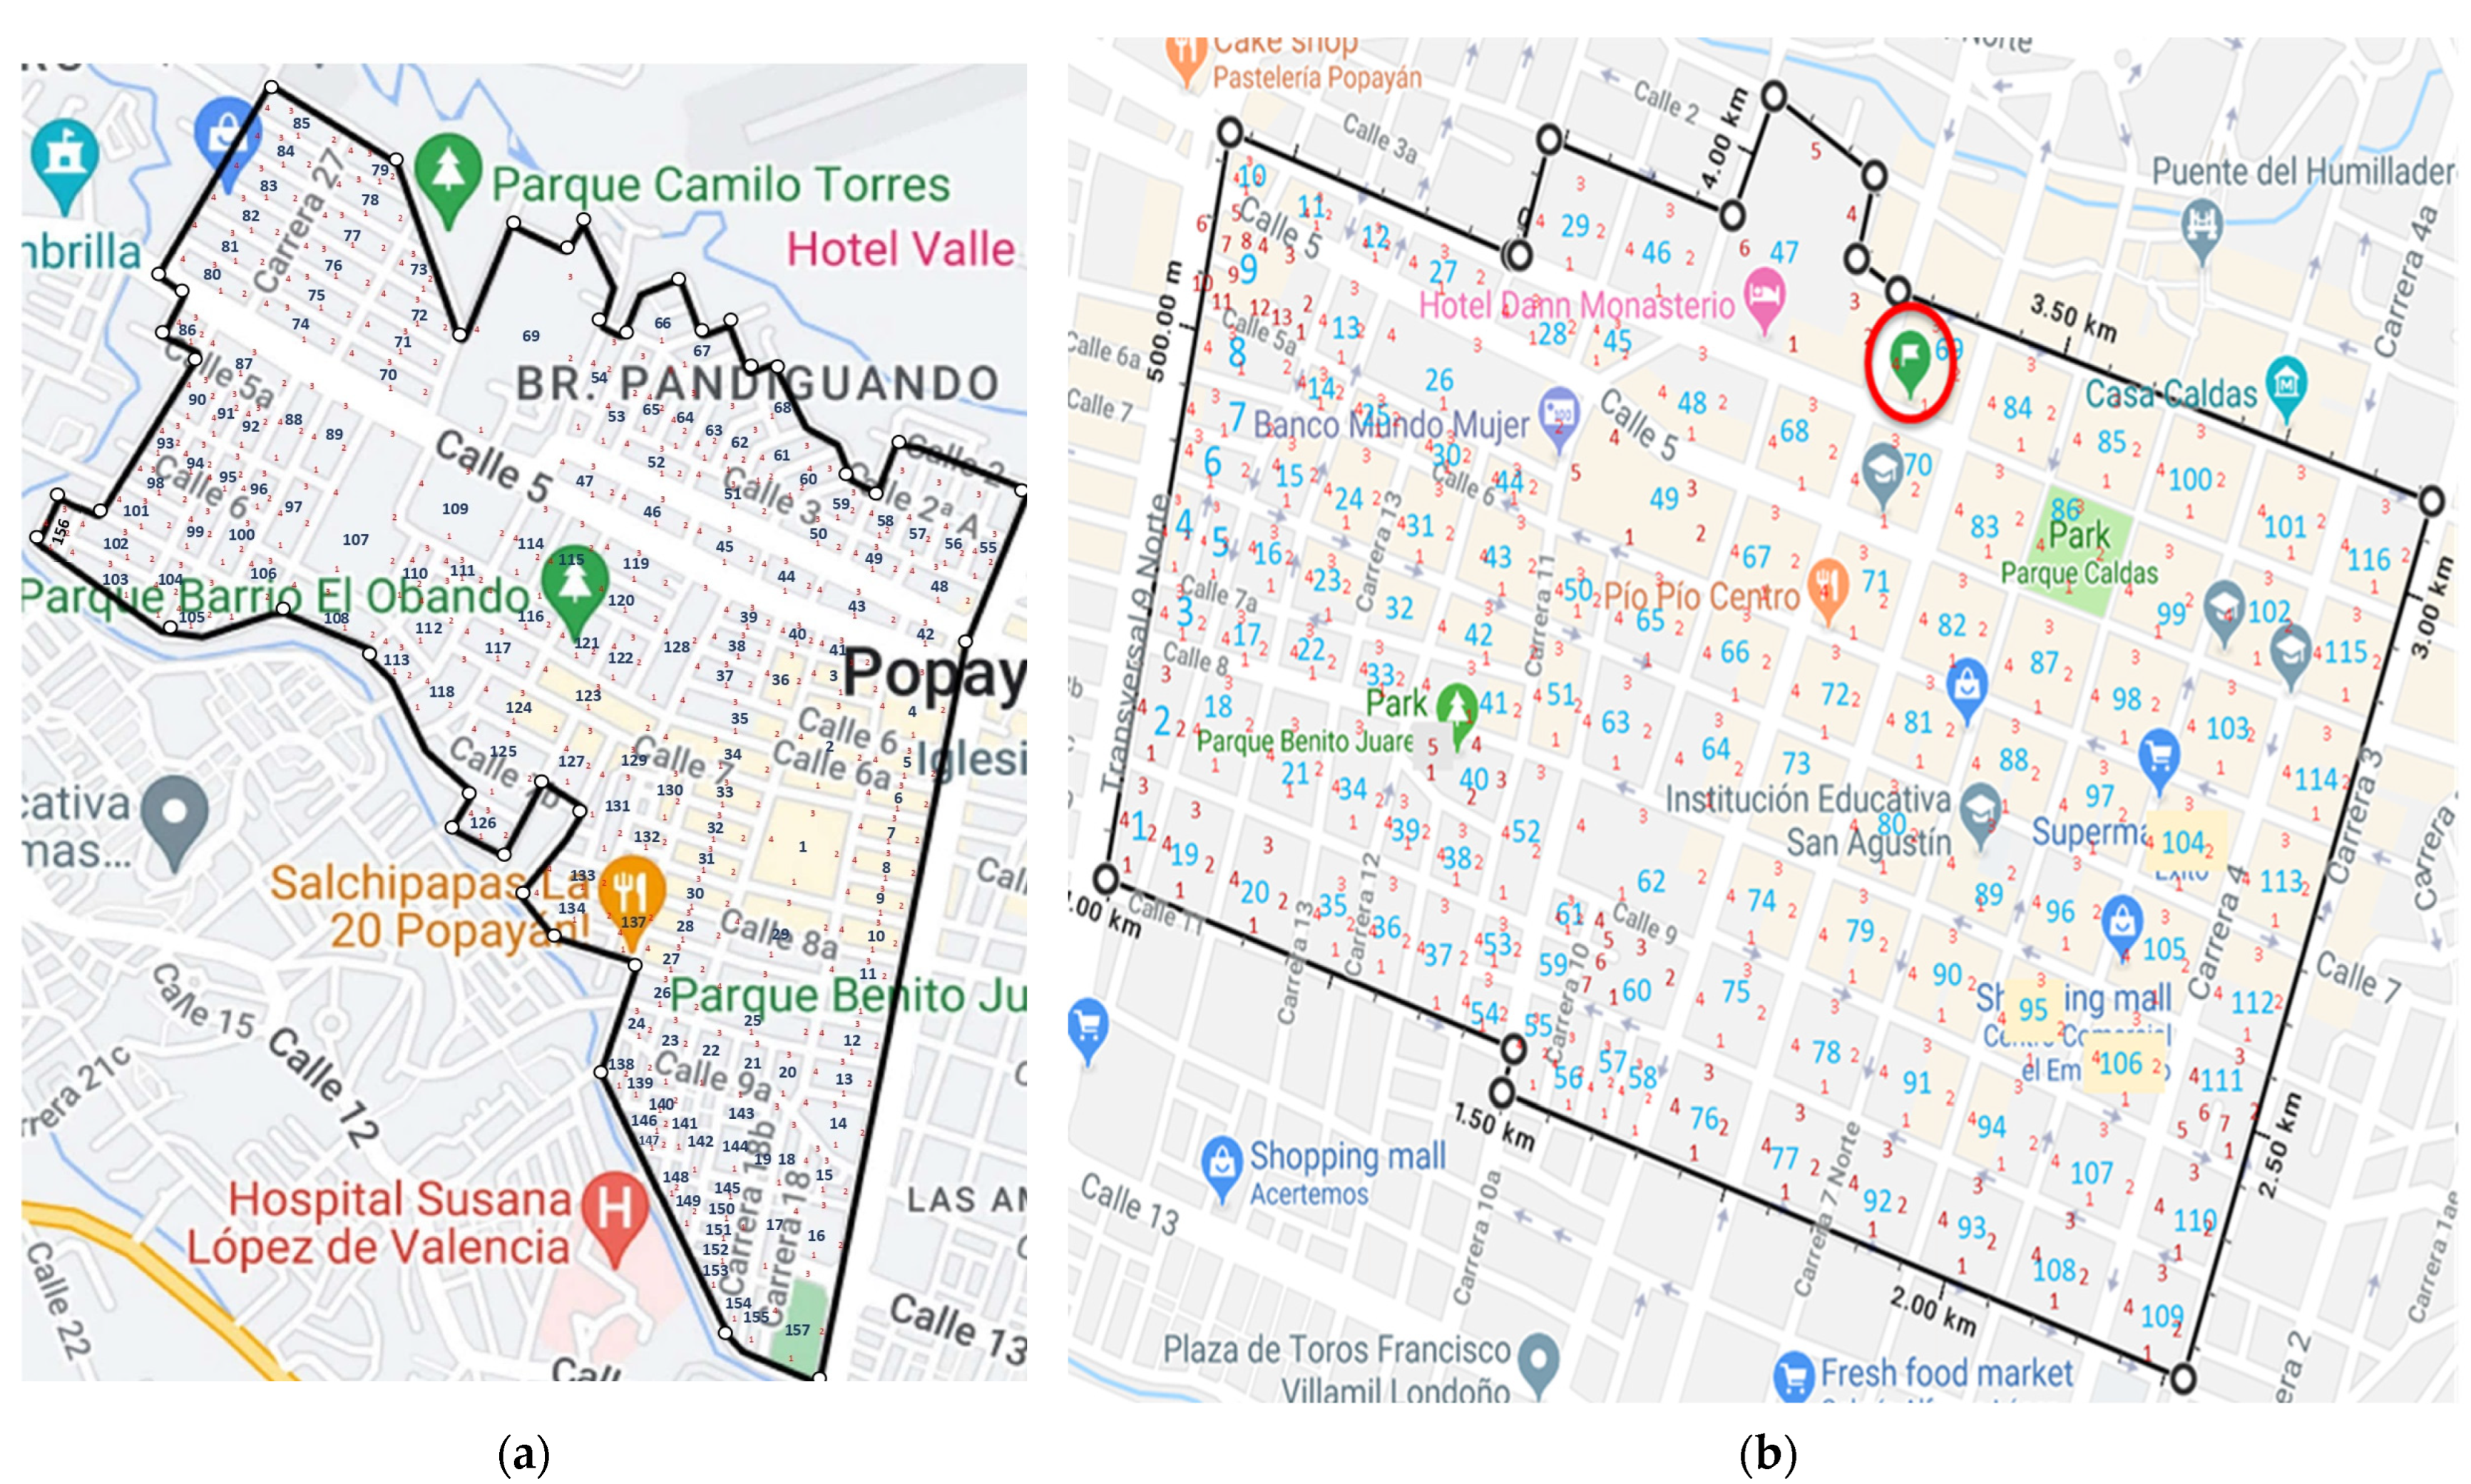
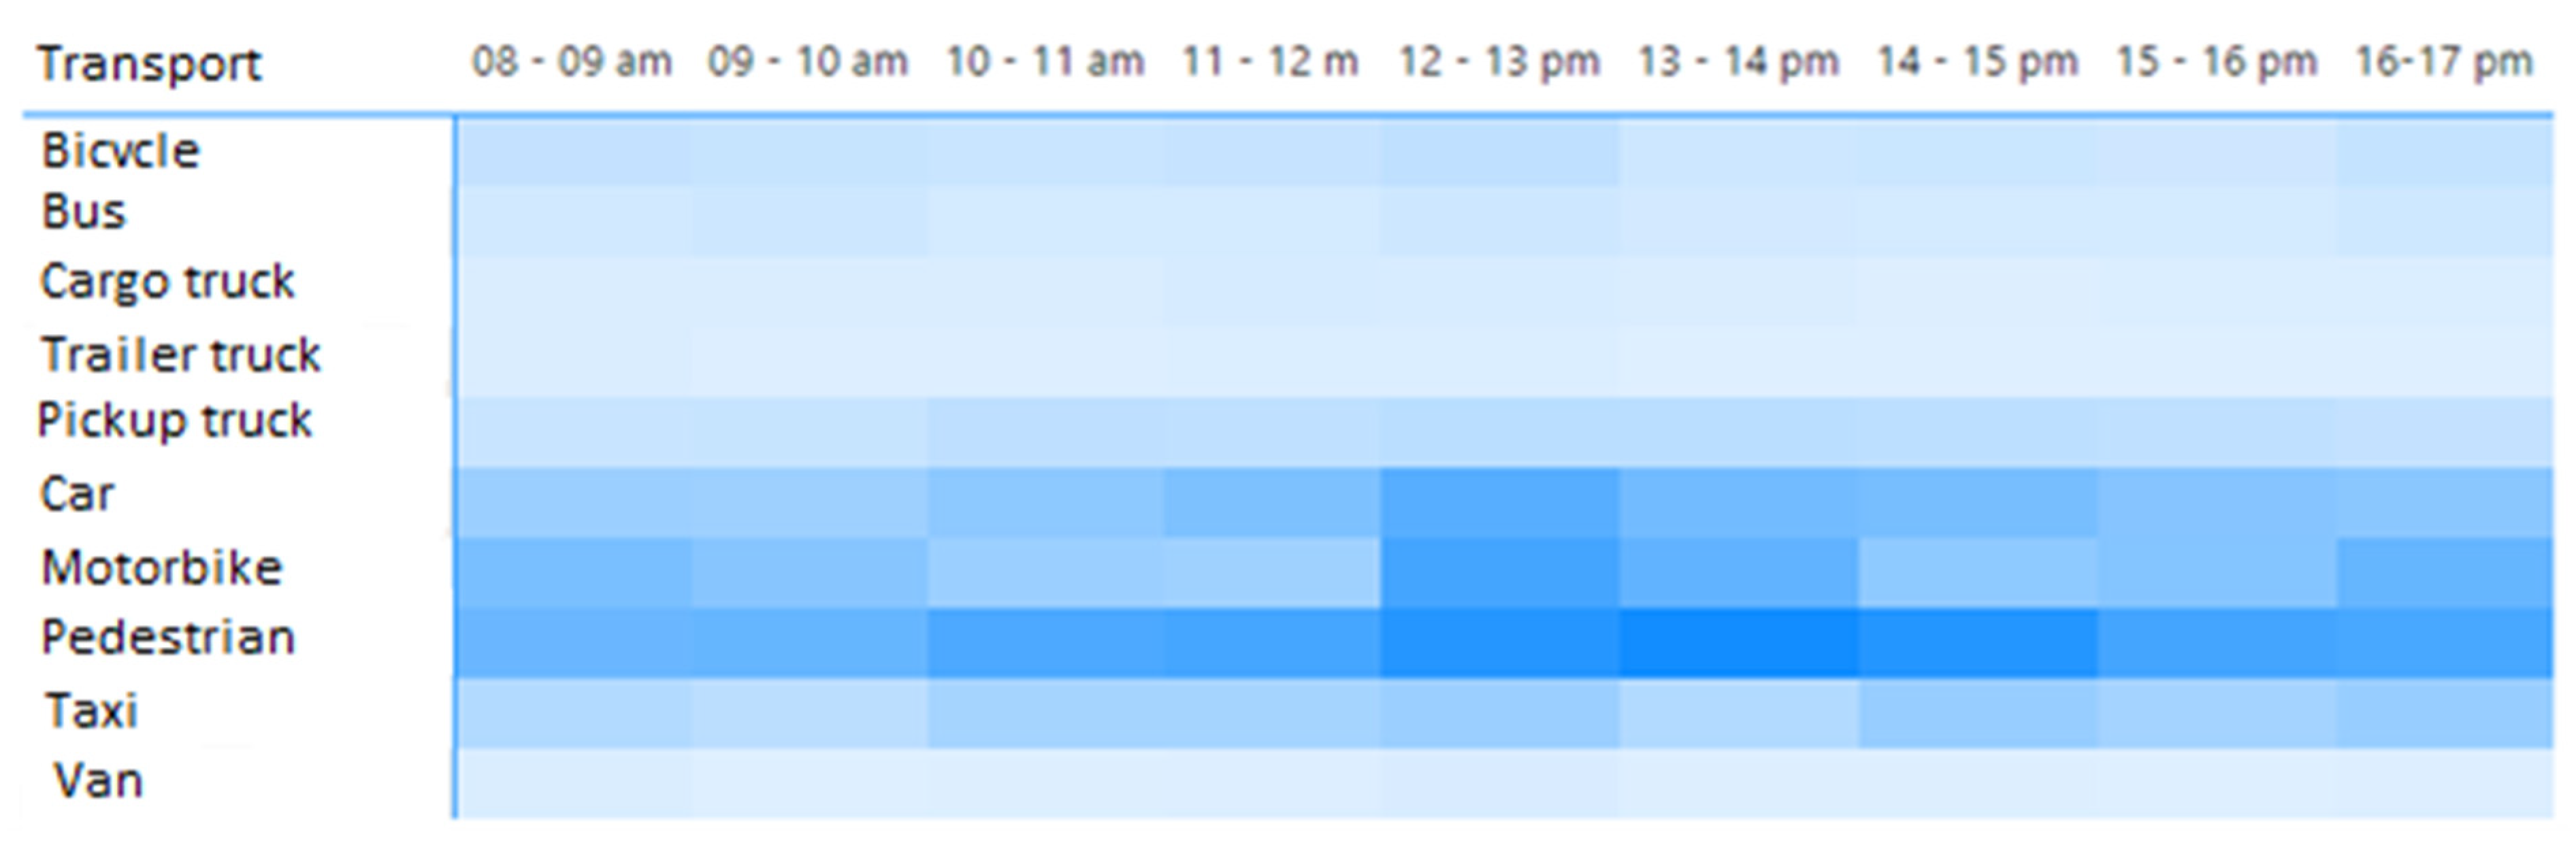
Figure 1). As a result of the city’s urban development, in 2020 there were 29,297 registered vehicles; by 2021, this had increased by 44.2% (66,192). This affects mobility in the city [
9] (
Figure 2) as well as logistics operations, which depend on and compete within the limited and congested transportation systems and infrastructure [
10].
In many Latin American cities, logistics operations must adapt to the road infrastructure characteristics and the restrictions of each urban area.
Figure 2 shows the current conditions of logistics operations in the historic sector of the city due to the lack of dedicated areas for loading and unloading merchandise and the limitations of the road infrastructure. In particular, two types of activities are observed: operations carried out by commercial establishments, which opt to load and unload on the street, and the activities of transporters who, given the characteristics of the products sold by businesses in the area (such as household products, hardware, and furniture), must park and wait until they receive an order; that is, they work on demand. In addition, although urban freight vehicles constitute a small share of all road traffic, they generate many negative externalities, such as congestion on local streets and roads, infrastructure damage, pollution, greenhouse gases, and noise [
10]. This context is similar to those of many Latin American cities, where a lack of control gives rise to such logistics practices.
To minimise the negative externalities of freight transport distribution, city logistics initiatives have been developed to coordinate the activities associated with freight operations in the city [
11]. According to De Carvalho et al. [
12], a logistics performance assessment system should provide information to assist stakeholders in decision making. Its process requires four steps: designing, facilitating, encouraging, and intensifying performance [
12]. In designing performance, there are three types of related components: models, measures, and methods for measurement [
13]. In this study, we propose a decision model and provide a structure to measure the overall urban freight logistics performance of a mid-sized Latin American city, and draw on existing urban parameters to propose improvements for freight distribution.
Popayán’s main logistical problems stem from a paucity of urban planning, a limited road infrastructure poorly equipped for modern multimodal transportation, a growing population, and limited citizen participation in the public policy process. Therefore, urban progress guided by well-established policies is required to improve distribution planning. Given the aforementioned opportunities and challenges, in the present study, we seek to analyse the logistics activities of two highly commercial zones in Popayán: Commune 4 (C4) and Commune 8 (C8). We consider stakeholders’ perceptions regarding urban logistics and focus on citizen participation, thus defining initiatives to minimise the negative externalities caused by freight operations while supporting the urban planning process of a sustainable, efficient, and competitive city.
Decision makers in mid-sized cities have tended to adopt the initiatives of megacities. However, such public policies have proven inefficient when it comes to today’s freight operations, increasing negative externalities in cities of these dimensions. Therefore, we propose a decision model that aims to provide a structure with which to analyse an urban freight system focused on the last-mile distribution of products sold in commercial establishments in a Latin American mid-sized city. Our research methodology will enable data collection and a logistics operations diagnosis based on three attributes: stakeholders’ perceptions, characteristics of commercial establishments, and urban parameters. The resultant model, with its measurement and structural sub-models, constitutes the scientific contribution of our research. We use surveys and the Km
2 methodology to collect the perceptions of stakeholders (the actors involved in an urban logistic system: citizens, wholesalers, and retailers) on issues related to city logistics elements through surveys [
11,
12,
14]. We then proceed with a first strategic and theoretical proposal for cargo distribution in Popayán’s commercial areas.
Most of the literature covering the relevant issues on urban logistics focuses on megacities and identifies key actors, but falls short when it comes to identifying citizens’ perceptions about urban freight transport systems and logistics operations [
11] in mid-sized cities. As such, it is hoped that the findings presented in this paper can guide planners and decision makers in cities and urban areas interested in defining initiatives to address the issues generated by freight operations that consider the perceptions of the citizens served by the system [
11,
12,
15]. Our research motivation is to enrich the literature on urban logistics and stakeholder participation in mid-sized cities by proposing a zonal categorisation that encompasses stakeholders’ perceptions. As a complement, the Km
2 methodology with PLS-SEM data analysis allows us to present a decision model based on quantity data (obtained from the Km
2 methodology) and validate a qualitative hypothesis related to stakeholders’ perceptions. Together, this constitutes a comprehensive approach to the city of Popayán’s urban freight system.
This paper contains five sections in addition to this introduction.
Section 2 presents a review of the literature review covering issues related to urban logistics and stakeholders’ perceptions;
Section 3 describes the methodology used to analyse the data, the experimental design, the data collection process, and the analysis techniques;
Section 4 presents the hypotheses proposed for this study as well as the modelling results and analysis; and
Section 5 sets out and discusses our findings before offering the chief conclusions.
2. Literature Review
Since the start of the 2010s, the urban logistics literature has witnessed a marked increase in the number of studies conducted and the diversity of topics discussed [
16,
17,
18,
19]. There is a current trend for published research related to sustainability, public policies, stakeholder involvement, last-mile optimisation, and e-commerce in urban freight logistics [
20,
21,
22]. However, while urban logistics has received increased attention, the bulk of the research and innovation has been conducted in developed countries where the focus is on sustainability and optimisation. The freight transport landscape differs greatly in emerging markets and developing countries [
11,
16] where issues such as last-mile distribution and stakeholder participation converge. Although urban logistics would appear a sound basis for issues related to freight transport activities, its implementation in the developing world is hampered by two main factors. First, urban logistics are highly dynamic due to the interaction between multiple agents. Second, there is a lack of understanding of urban logistics problems and a lack of methods with which to address them [
21]; this is particularly true in mid-sized cities, where initiatives are oriented towards vehicle restriction and optimising public space without taking into account freight operations.
It has been estimated that 28% to 75% of total supply chain costs occur in last-mile operations [
23,
24]. In this context, several researchers have studied and proposed improvements for logistics optimisation in last-mile distribution [
25], while others have employed the Km
2 methodology to characterise areas according to urban parameters for logistics improvement [
10]. This method has made it possible to determine the best location for distribution points, seeking alternatives that contribute to improving the mobility of megacities [
5]. Its application in the Americas is evident in megacities with high population density, large numbers of commercial establishments, and heavy vehicular flow. There have been several notable case studies. For Bogotá DC (Colombia), Merchán [
26] characterised the unloading operations in an area with a high number of establishments, allowing the analysis of these operations and the proposal of improvements. For Quito (Ecuador), Chicaiza [
27] proposed possible public policies for freight transportation based on the city’s urban parameters. For Lima (Peru), Chong [
5] illustrated the importance of urban parameters in a public policy decision-making process oriented towards the optimisation of last-mile deliveries. For Córdoba (Argentina), Heckman [
28] identified a clear relationship between the different commercial activities and their location, allowing for urban logistic analysis and the application of specific best practices that fit with freight operations. For Montevideo (Uruguay), Tanco [
29] concluded that the choice of a multi-perspective study is desirable to address the complexity of loading processes. For São Paulo (Brazil), Yosizaki [
30] showed that the use of GPS data can be key to an urban planning process. Finally, for Seattle (USA), Caplice [
31] utilised the same form of data to locate cargo loading and unloading areas.
However, the impact of freight transport on mid-sized cities must also be measured. Thus, Orozco et al. [
32] applied the Km
2 methodology to Popayán (Colombia) in order to simulate loading and unloading strategies. This study helped to minimise negative externalities by proposing public policies [
5,
10], presenting simulation strategies (loading and unloading bays) [
31], and showing stakeholder integration [
28], leading to improvements in improving last-mile distribution in that city: specifically, an 8% improvement in loading and unloading zones (L/U zones) and a 16% reduction in negative externalities produced by urban freight transport.
Previous research has demonstrated the paucity of stakeholder participation in the urban planning process, while revealing how collaborative logistics development allows for the integration of all actors toward sustainability-oriented public policy formulation based on citizen participation. Thus, the present study supports previously published research on how stakeholders directly impact urban planning for urban freight transport, especially in the Latin American region [
11,
15,
21]. A key context for the engagement of urban freight actors is stakeholder perception. De Oliveira et al. [
33] analysed stakeholder perceptions of urban freight transport issues in Belo Horizonte (Brazil), including residents’ perceptions, and their results revealed divergent perceptions among stakeholders. For their part, local inhabitants perceived that freight transport and private cars contributed to congestion and noise pollution, and also concluded that restricting freight cargo traffic in the city centre could contribute to urban mobility [
33]. Amaya et al. [
34] assessed the perception of certain stakeholders (carriers, receivers, and residents) regarding sustainable urban freight policies in Barranquilla and Cartagena (Colombia). They found that residents indicated that off-street parking was the most effective freight transport policy [
34].
A range of different perception analysis methods have been used, including multi-criteria techniques such as cluster analysis [
35], multi-actor multi-criteria analysis (MAMCA) [
36], and structural equation modelling (SEM) analysis [
11,
12]. The latter methodology allows for evaluating multivariate causal relationships [
37]; its application to Latin American cities, such as Cartagena (Colombia) [
11] and Brasilia (Brazil) [
12], have aided the understanding of how stakeholders perceive freight and logistics operations in urban areas. Amaya et al. [
11] analysed the relationship between infrastructure, negative externalities, and urban freight transport from the residents’ perspectives in three regions of Cartagena (Colombia). They concluded that the problems are heterogeneous, and that infrastructure perception influences insight into externalities [
11].
In addition, the occurrence of extreme global events such as the COVID-19 pandemic, climate change, exceptional supply chain disruptions, and geopolitical conflicts have posed significant challenges to transportation systems [
14,
20]. Such phenomena can prompt behavioural changes that, if they persist, significantly alter mobility in cities. In this context, and given the importance of the city as a field of study, urban logistics research presents a unique opportunity to re-imagine urban transport systems towards sustainable mobility transitions [
21]. This study seeks to influence public policy formulation by emphasising sustainability based on urban parameters and previous studies on Latin American cities.
3. Materials and Methods
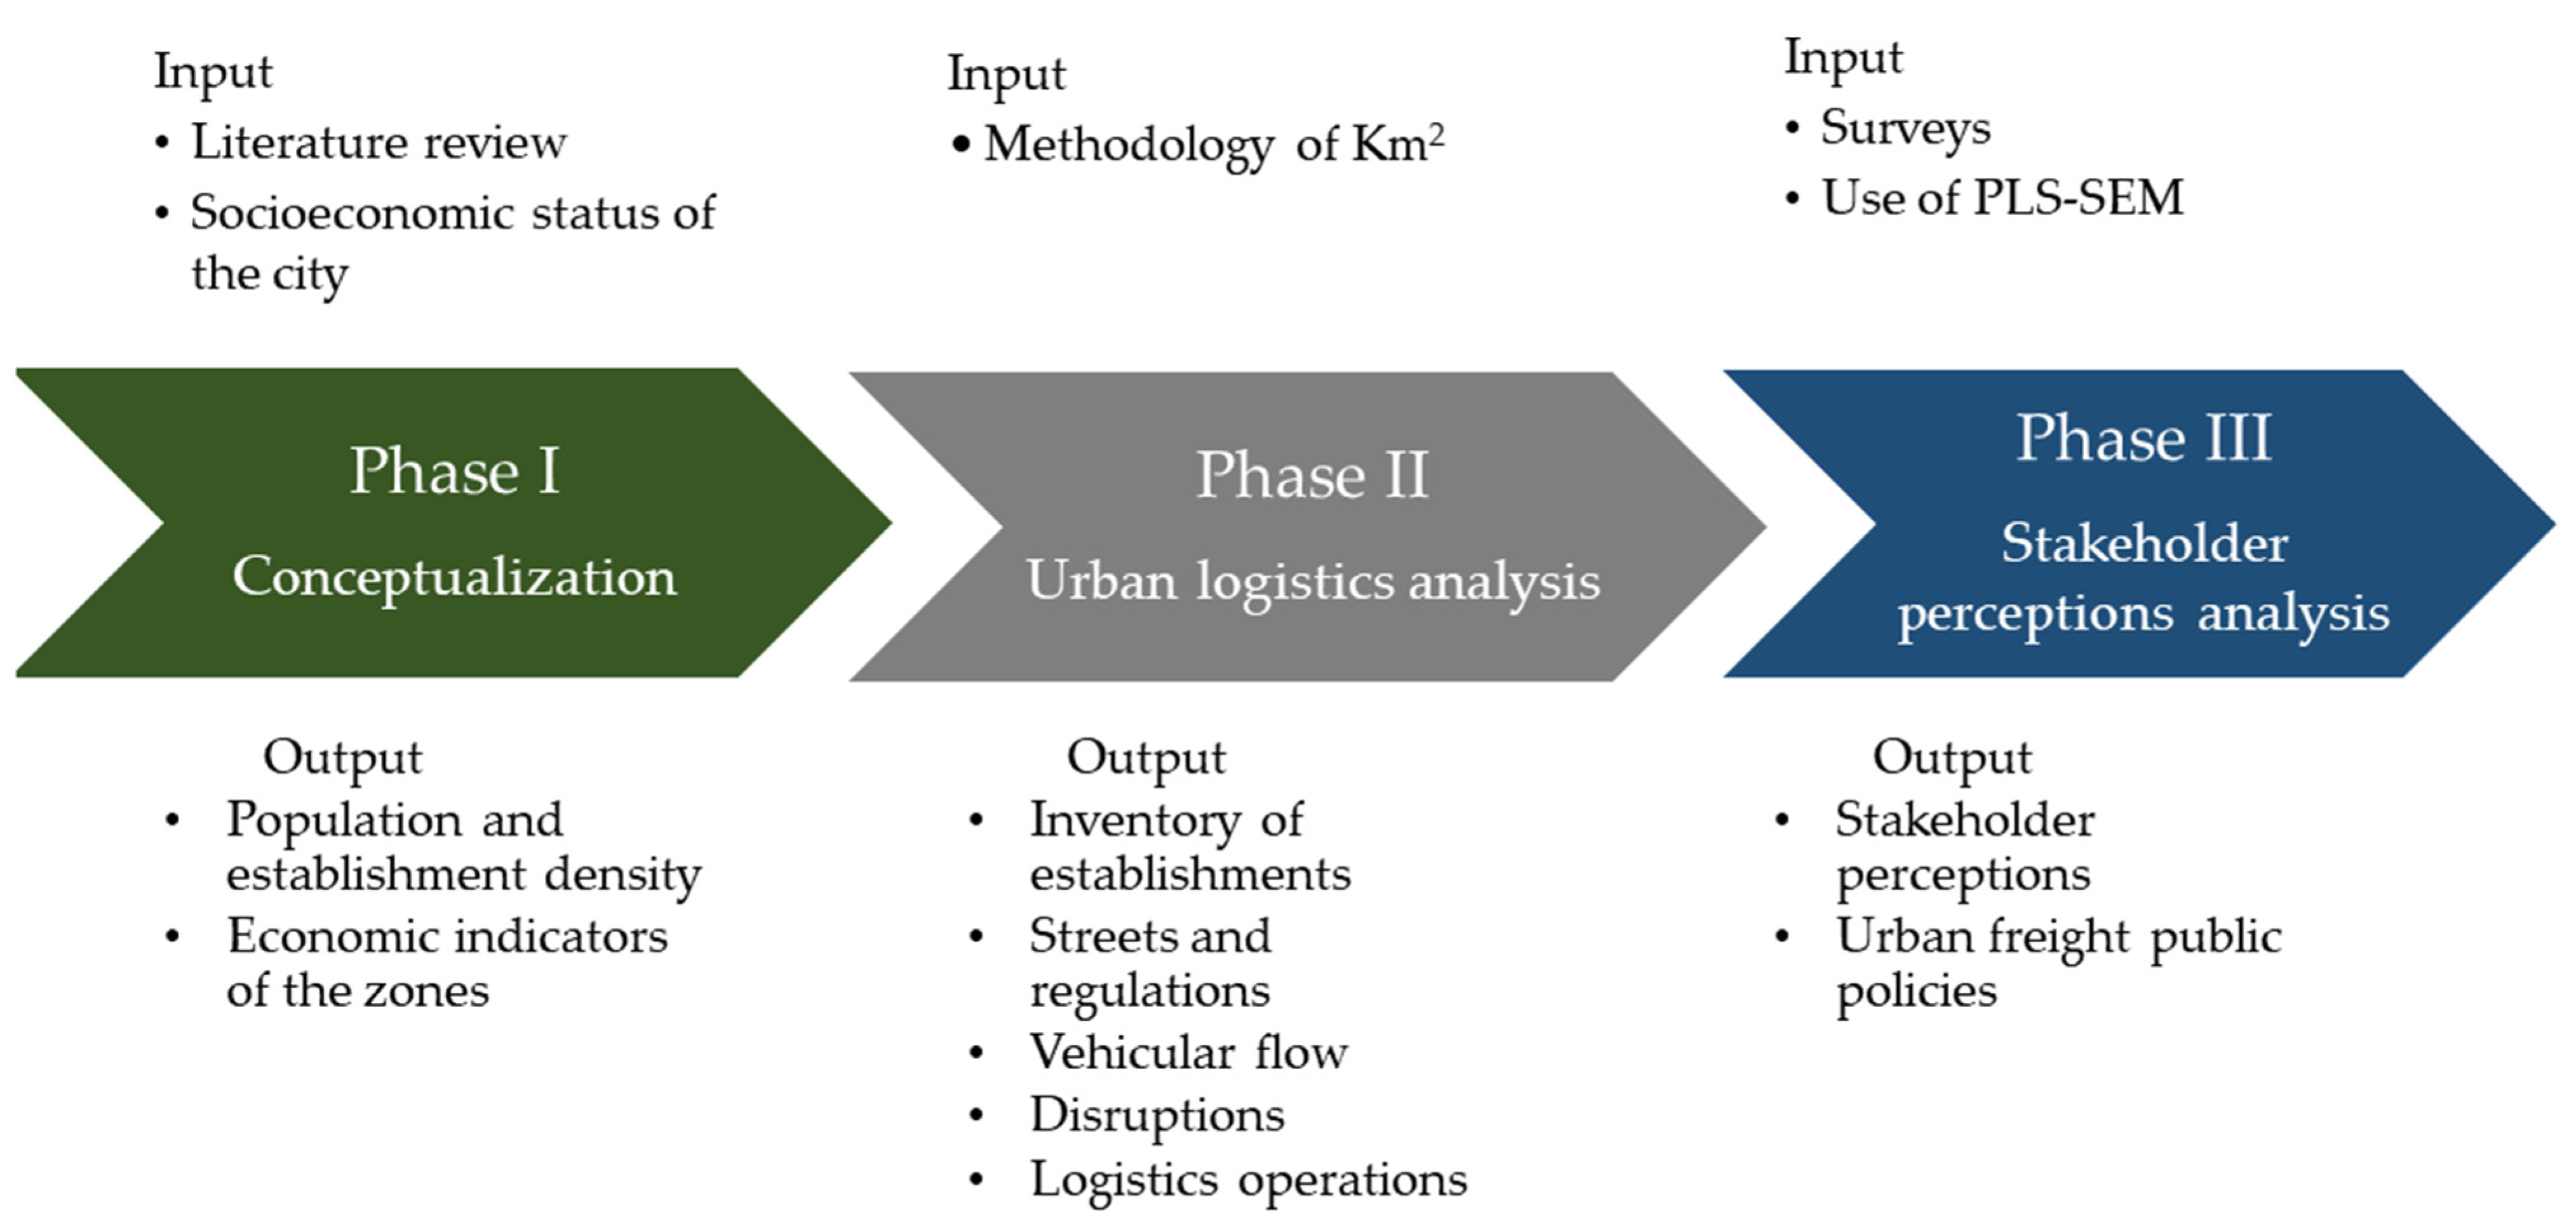
The comprehensive method that we propose is intended to identify the challenges associated with the urban freight transport system in the city of Popayán. We defined the relevant variables from the perspective of the research: population density, retail density, and stakeholder perception. The research entailed three main phases (see
Figure 3). Initially, we conducted a conceptualisation of the city studied. We then analysed the urban logistics freight system in each selected zone [
5,
10,
31]. In the third instance, we collected and analysed stakeholders’ perceptions to identify indicators that guide decision-making processes as part of the urban logistics policies in Popayán.
Our methodology seeks to be as comprehensive as possible by taking into consideration the relevant aspects of the public policies planning process for freight transportation using the Km2 methodology, which allows the logistics practices of an urban area to be characterised. However, we also propose to use these quantitative data and validate a series of qualitative assumptions through PLS-SEM analysis, thus obtaining a broader and more robust overview of Popayán’s freight transportation system based on stakeholder perceptions.
Phase I: Conceptualisation
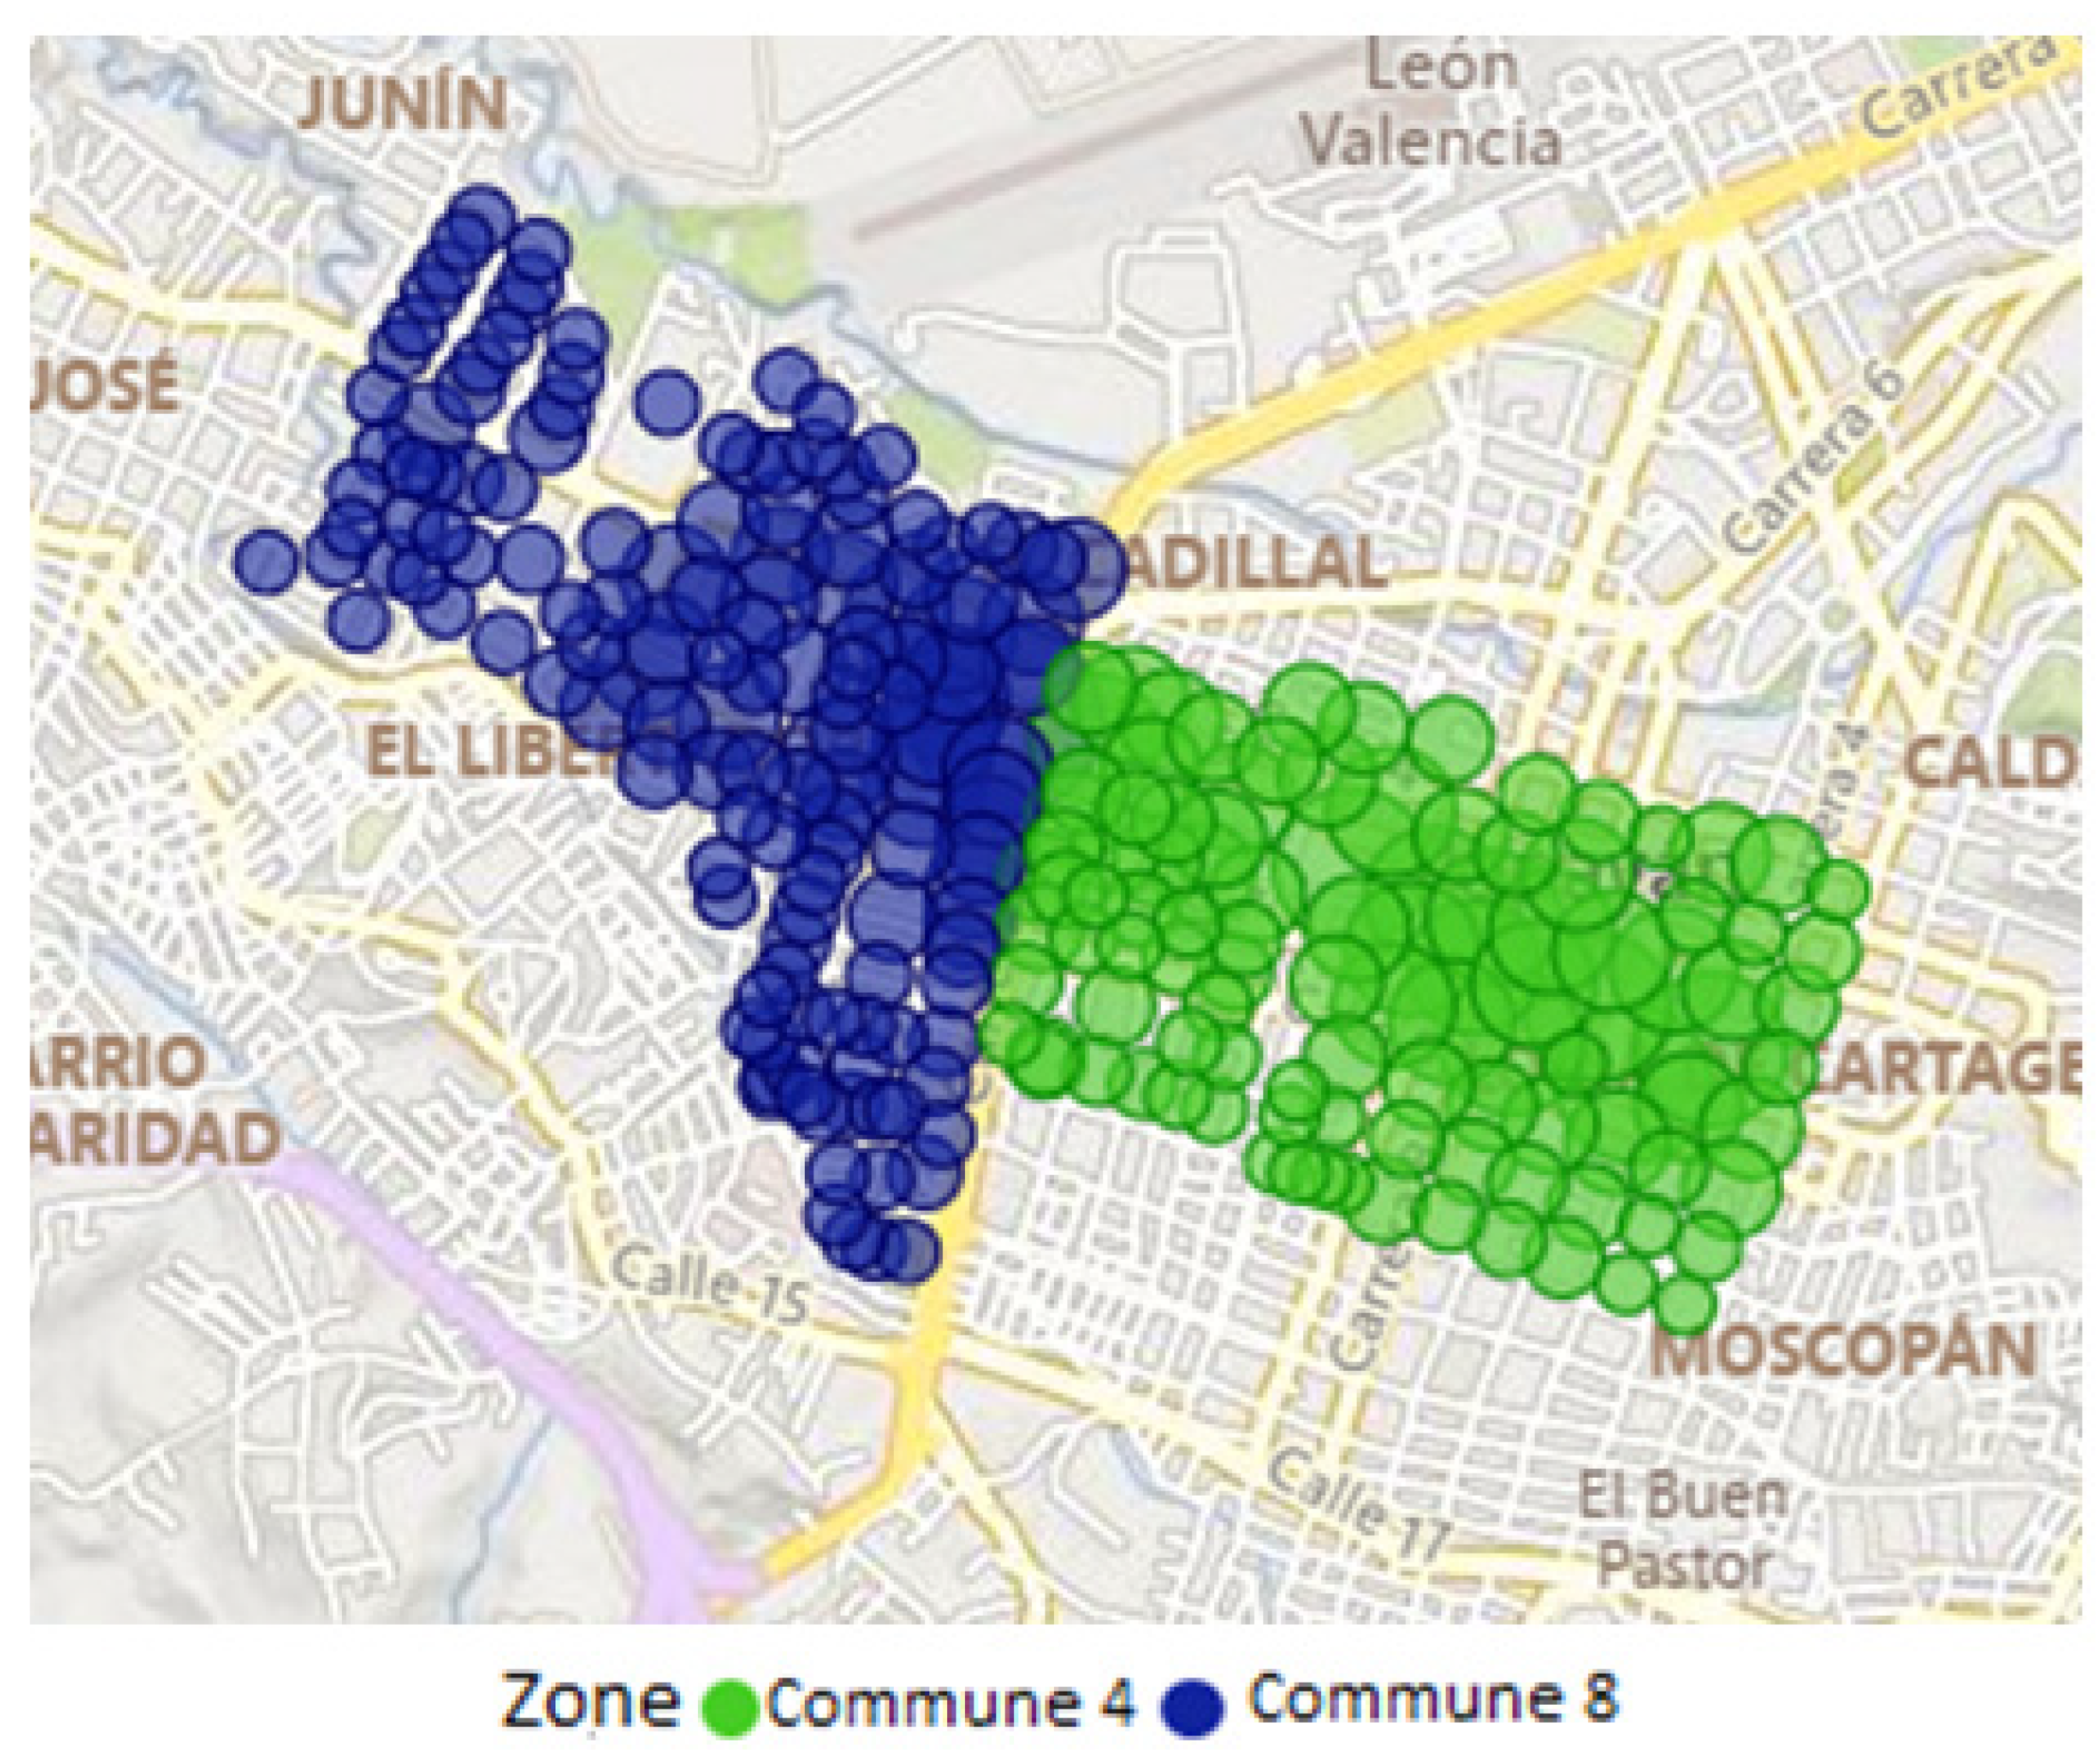
We selected the two commercial zones, C4 and C8, by compiling data from secondary sources, such as the Cauca Chamber of Commerce [
32]. We also made our decision based on the studies by Fajardo [
38] and Chará [
39], who identified these as the areas of greatest vehicular traffic and public mobility. In C8, the flow is most evident in the direction of the La Esmeralda marketplace: one of the busiest sites in the city and a point of attraction for people from the city and the surrounding municipalities who go there to buy and sell agricultural products. In turn, C4 contains the city’s historic sector, where government buildings, private offices, higher education institutions, and goods and services retail premises are located, reflecting the city’s centralisation and its increase in vehicular flow and freight operations.
Phase II: Urban logistics analysis
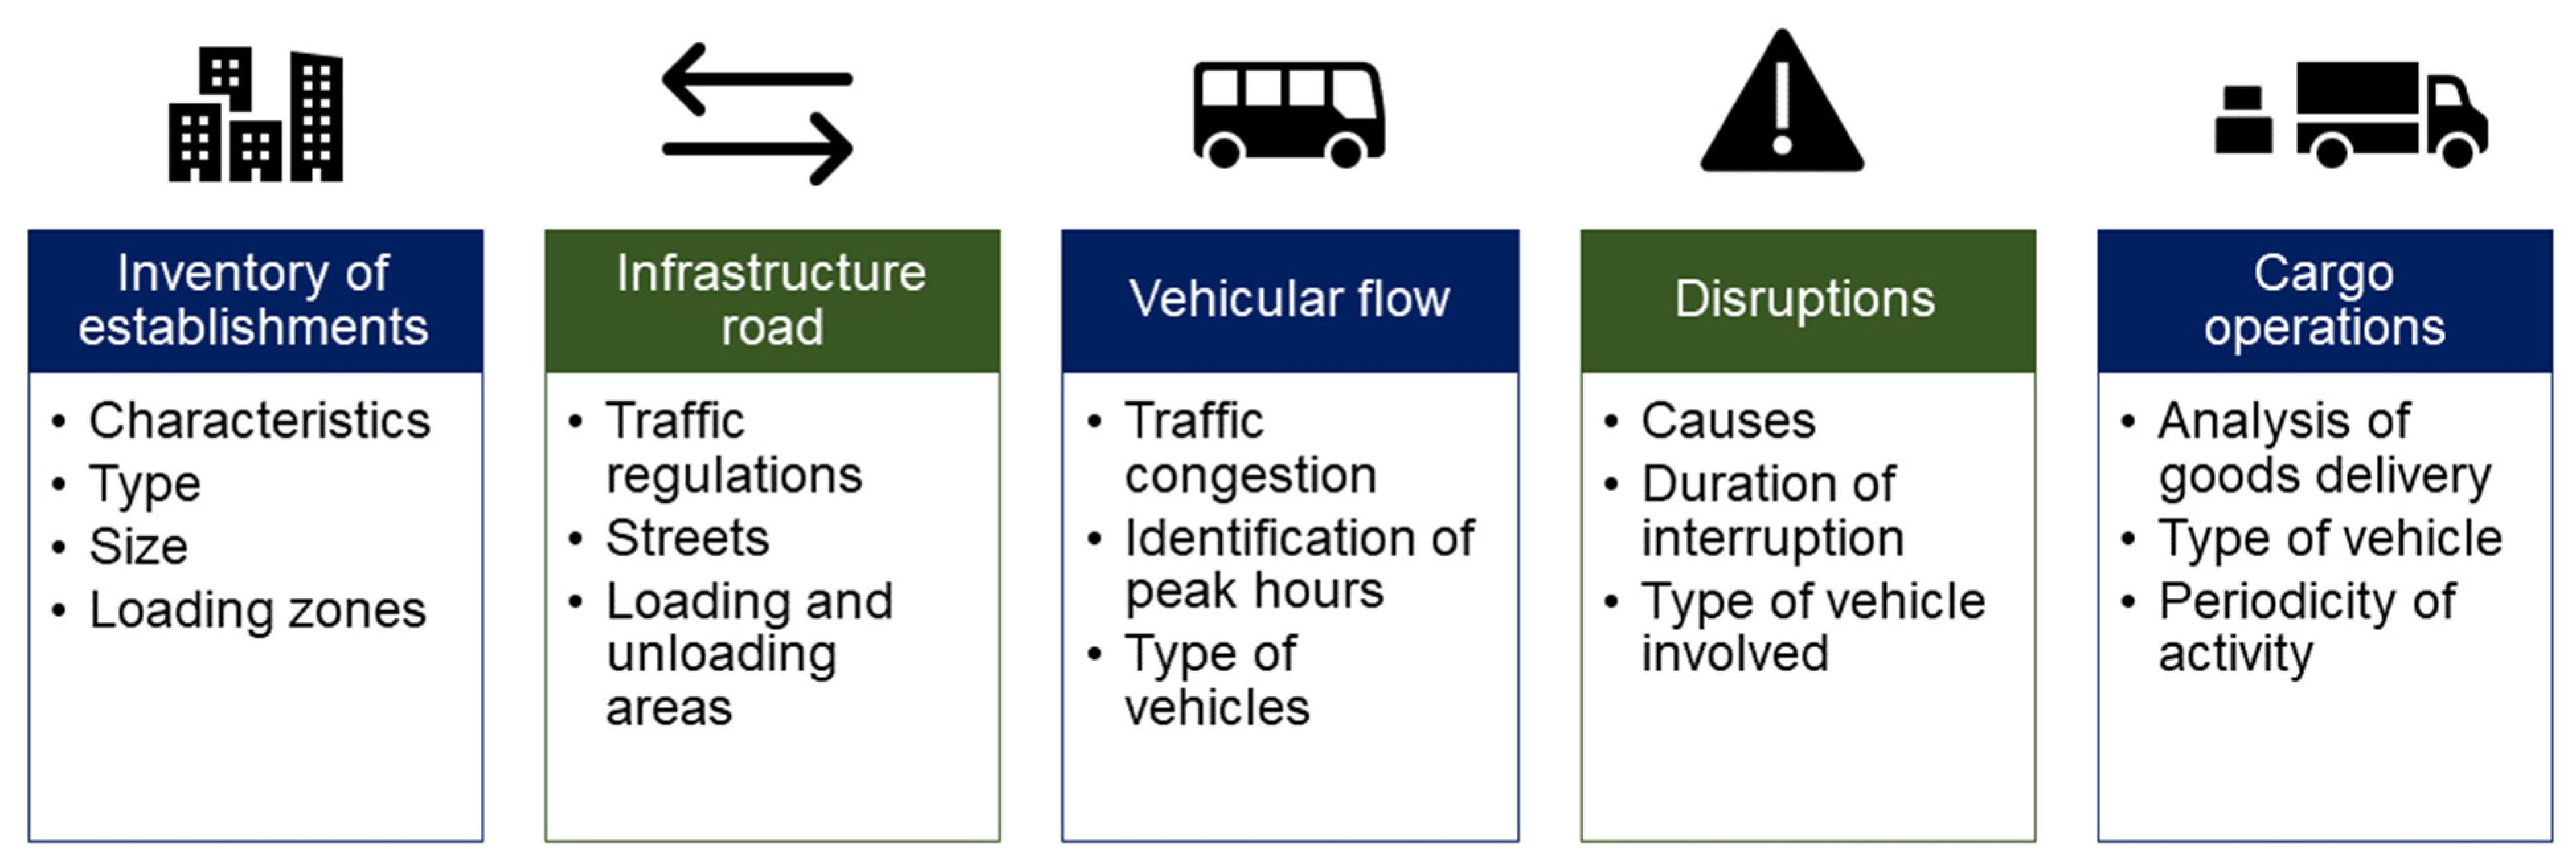
During this phase, we used logistics indicators to represent and characterise the sectors and construct a logistics profile. After identifying the city’s two most commercial sectors, we collected the data using the method proposed by the MIT Megacity Logistics Lab to characterise 1 Km
2 per city zone [
5,
10]. The main advantage of this method is that a large amount of information can be obtained through observation. It is therefore suited for use as an input for public policy proposals: in particular, to generate mobility, logistics, and urban planning strategies. Examples of previous application of the Km
2 methodology in Latin American cities include Bogotá DC (Colombia) [
27], Popayán (Colombia) [
15], Quito (Ecuador), and Lima (Peru) [
5]. The procedure comprises five information indicators to be collected during fieldwork: establishment inventory, road infrastructure, vehicular traffic volume, freight disruptions, and delivery operations in each sector (
Figure 4).
Phase III: Urban logistics stakeholder perceptions analysis
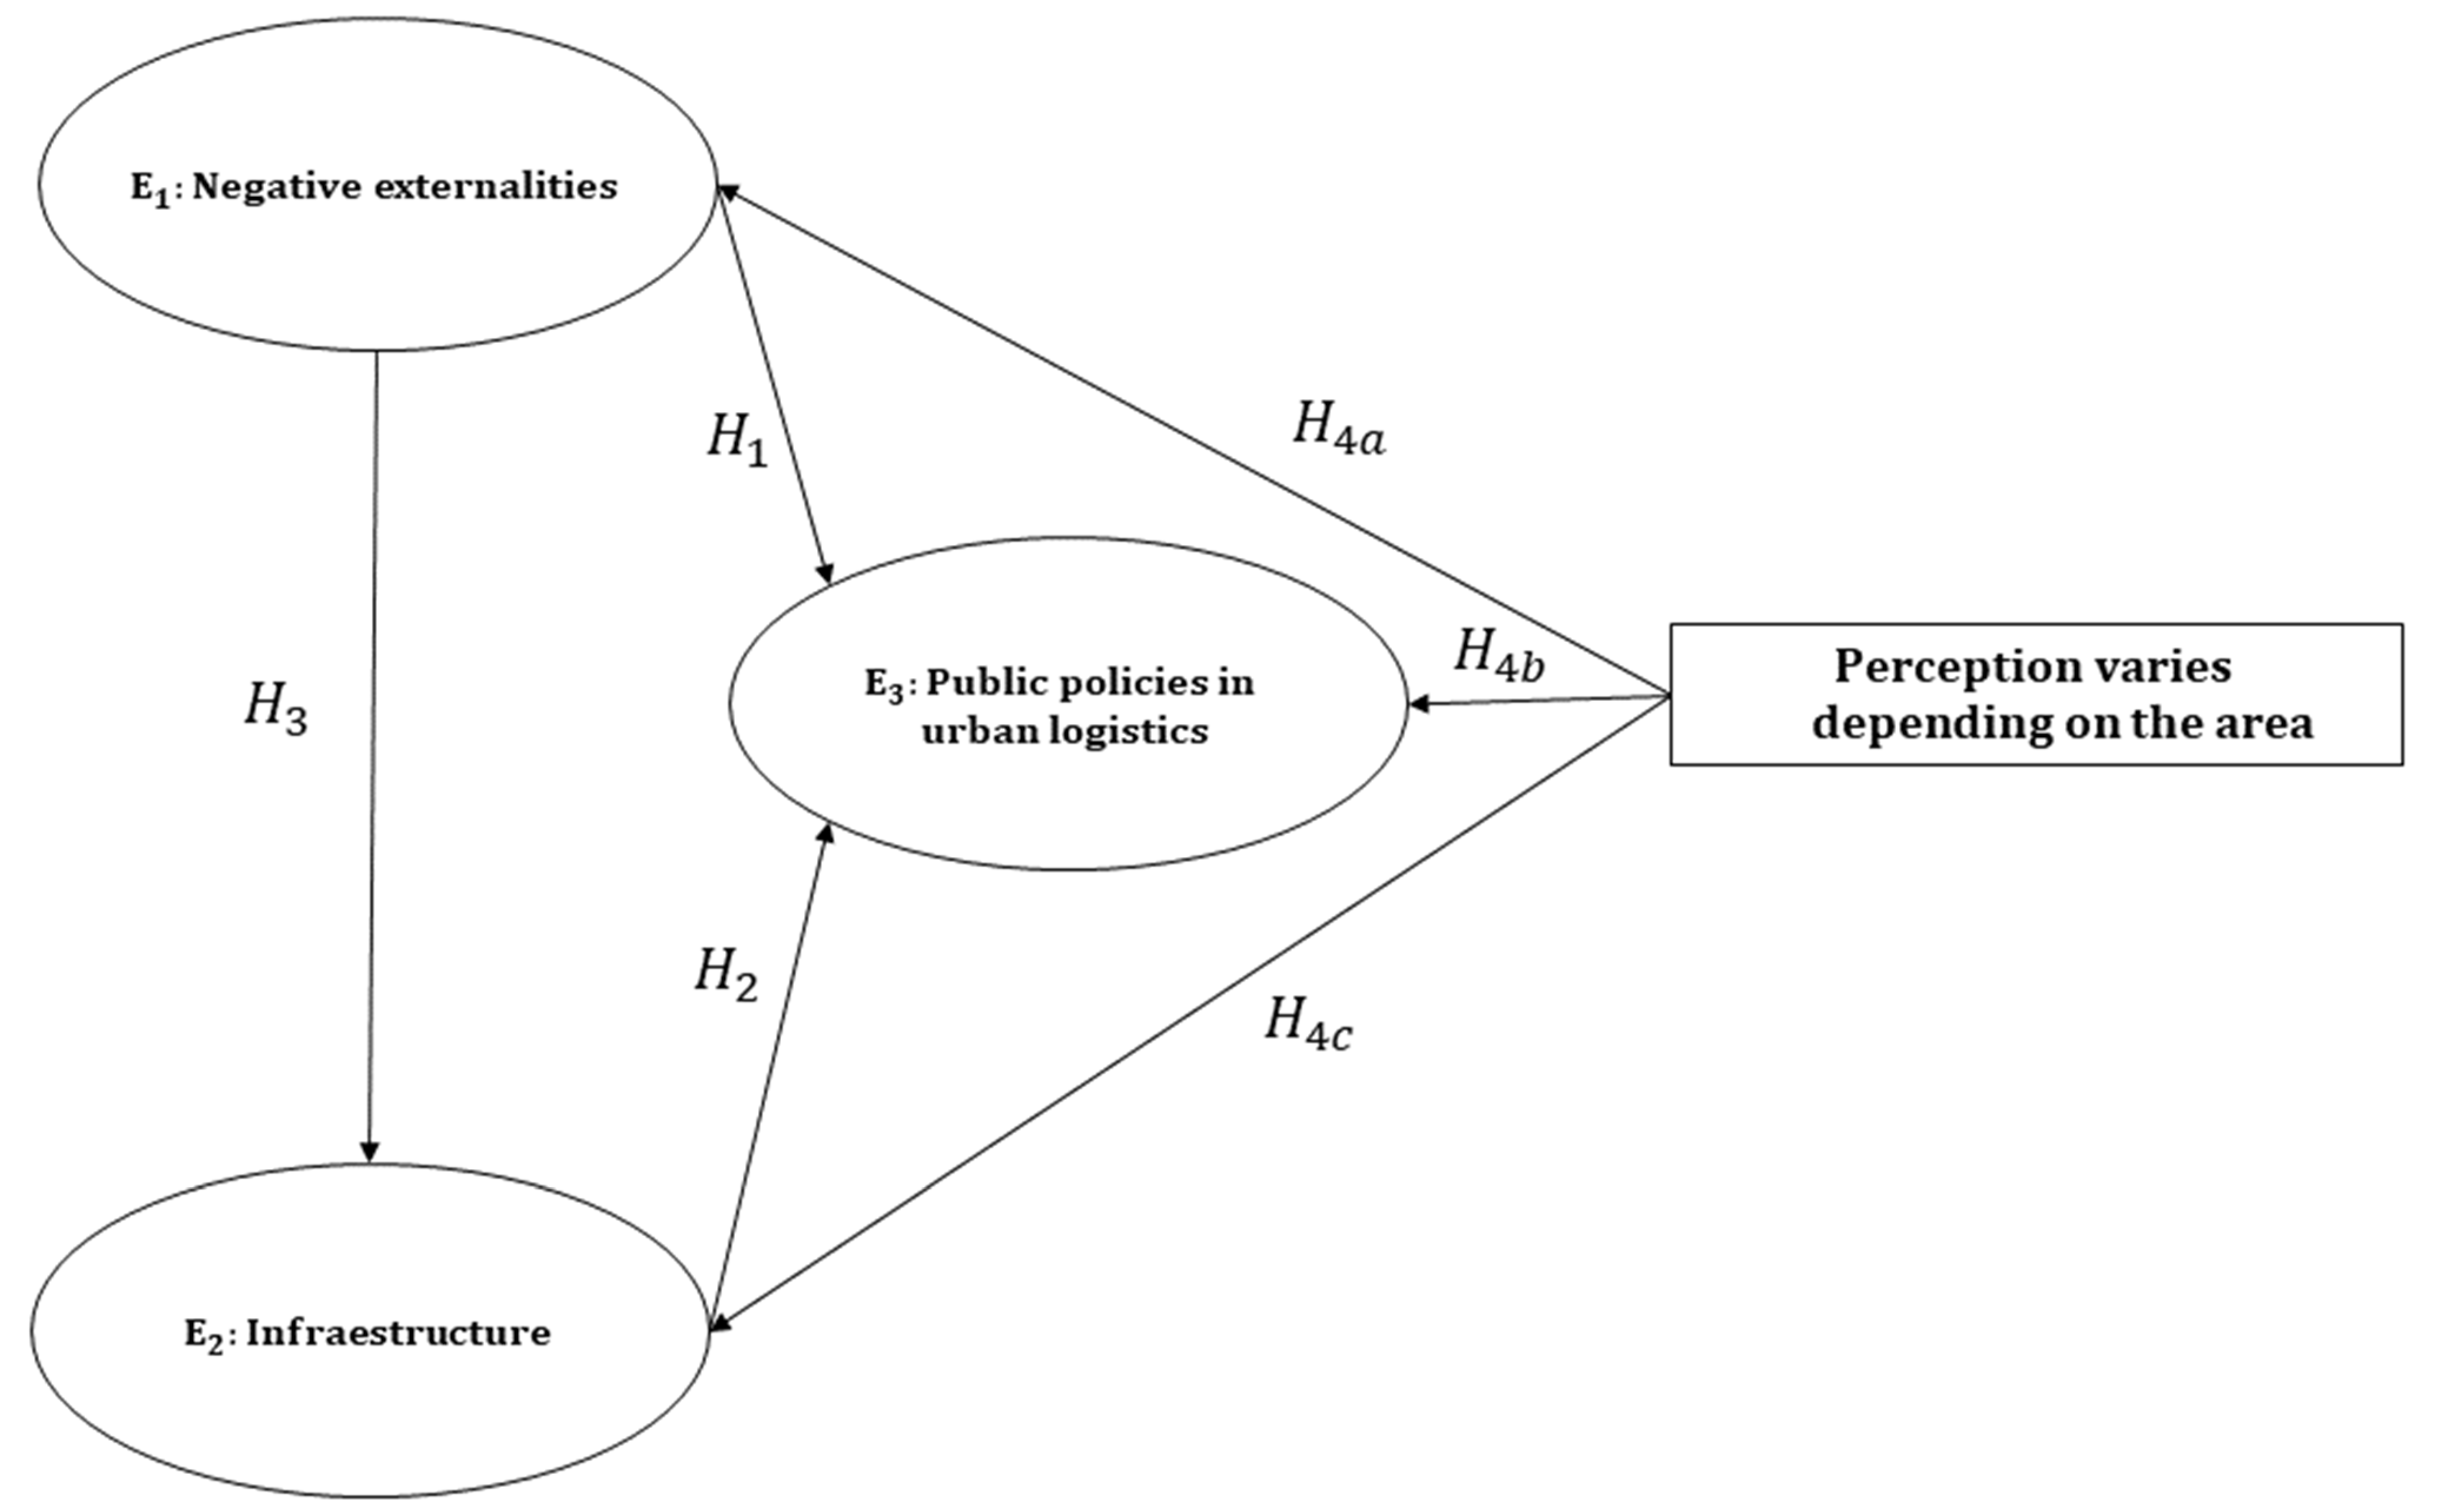
The involvement of actors in urban freight logistics is crucial in urban planning to achieve a sustainable city. Therefore, the collection and analysis of stakeholders’ perceptions about urban logistics operations in Popayán can be used as an opportunity to promote citizen participation by raising awareness of their importance to public policy processes that affect their daily activities [
27,
41]. This phase tests a series of assumptions related to infrastructure, negative externalities [
11,
12], public policies, and location. The resultant information is then compiled through the administration of surveys [
11,
12,
14]. To construct the survey, we used cluster analysis based on the number of blocks per Km
2, which allowed us to identify the block number in which to administer the survey. For its design, we drew on the studies of De Oliveira [
15] for Brazil and Amaya [
34] for Colombia, among other research.
The survey contained four stages to understand four urban parameters that compromise the logistics system in the two zones. In the first phase, the survey enquired about stakeholders’ demographic and socioeconomic circumstances (age, gender, occupation, family status, and income). It then explored their habitual means of transport. One of the questions sought to identify the extent of awareness about sustainability based on the use of non-motorised vehicles with low CO2 emissions, and about whether the respondents thought that the alterations to the road infrastructure had been effective.
The following three stages encompassed the PLS-SEM model variables, which were used to identify the logistics performance of the two study areas. In the second stage, the survey investigated people’s perceptions about the negative externalities, especially in terms of their impacts on mobility and the environment (five alternatives were presented). The third phase covered road infrastructure perceptions (five statements were deployed to determine whether the current infrastructure can support the actual demand for vehicles and logistics activities). Finally, the third stage proposed five public policy initiatives (based on the literature review and utilising a selection criteria according to the logistics needs identified in the Km2 methodology), as well as further initiatives already applied in different Latin American cities.
For the data analysis, we adopted a structural equation modelling (SEM) approach based on partial least squares (PLS), which is used to develop theories by maximising the variance of endogenous constructs [
42]. This technique has several advantages: non-normal data distribution, complex model analysis, and formative indicator use [
12]. There are two types of SEM models: a formative model and a reflective model. In this study, we use the latter, which directs arrows from the construct to the indicator variables, pointing out the assumption that the construct is the measurement cause (more precisely, the covariation) of the indicator variables. When using the PLS-SEM reflective model, it is necessary to follow a multi-stage process (see
Figure 5) involving the evaluation of the external and internal models [
37,
43].
After stipulating the measurement and structural models, the next step was to run the PLS-SEM model [
12]. In the first instance, this allowed us to assess whether the measurement model was reliable and valid. Assessing reflective measurement models involves evaluating the reliability of the measures on both an indicator level (indicator reliability) and a construct level (internal consistency reliability). Validity assessment focuses on each measure’s convergent validity using the average variance extracted (AVE) [
37]. This exercise confirmed, at this stage, that the structural model accurately represented the relationships [
37]. Moreover, we employed the heterotrait–monotrait (HTMT) ratio of correlations, which allows us to assess the discriminant validity of a reflectively measured construct’s discriminant validity in comparison with other construct measures in the same model [
37].
The first indicator to analyse corresponded to the individual reliability of each item, and evaluated the loadings (λ, or loading), or simple correlations, between the indicators and their respective construct. Hair and Ringle [
37] stated that λ ≥ 0.708 is acceptable. To ascertain the construct reliability, an analysis must be performed based on Cronbach’s alpha coefficient (CA) and the composite construct reliability (CR) as measures of internal consistency. For both indexes, 0.7 is accepted for modest reliability in the early stages of the research and 0.8 for basic research [
12,
37]. The AVE represents the proportion of the observed data in the variables and is explained by each latent variable within their respective groups of variables. The mean considers the variables to correlate positively with their latent variables [
42]. According to Fornell [
44], the values of the AVE must be greater than 0.5. The following criteria correspond to the heterotrait–monotrait ratio (HTMT) of correlations to assess discriminant validity. Hair and Ringle [
37] proposed a threshold value of 0.90 for the structural model. Finally, collinearity must be measured to calculate the variance values of the inflation factor (VIF). VIF values above 5 are indicative of probable inter-predictor collinearity problems [
43].
The third stage consisted of the structural model evaluation. The explained variance value is used to determine whether the dispersion measure of the endogenous variable is explained by the constructs that predict it;
R2 is representative of this variance [
37].
R2 values of 0.75, 0.50, and 0.25 are considered substantial, moderate, and weak, respectively [
37]. However,
R2 values must be interpreted in the context of the model and its complexity. Excessive
R2 values indicate that the model overfits the data [
37]. The global fit index (GoF) must also be calculated to determine the model fit. This index is obtained by multiplying the square root of the average AVE by the square root of the average
R2 [
37]. According to Ramirez et al. [
43], for the reliability and fit of the model to be checked, the GoF must be ≥ 0.5. Subsequently, the hypotheses must be tested by examining the path coefficient (β) and Bootstrapping analysis.
As Hair and Ringle [
37] noted, the coefficient allows us to ascertain whether the predictor variables contribute to the explained variance of the endogenous variable. The β value represents the standardised regression weights. The β ≥ 0.2 are considered significant, although ideally, β ≥ 0.3 are expected [
12,
45]. The bootstrapping analysis allows for examination of the stability of the estimates offered by the PLS analysis [
46]. This analysis considers the research data as a population through a resampling procedure. Bootstrapping calculation requires two values: samples corresponding to the number of subsamples (according to Hair and Ringle [
37], 10,000 should be used), and cases corresponding to the number of the sample. The evaluation model recommended in the literature involves calculating the two-tailed Student’s t-distribution with n-1 degrees of freedom, where n is the number of subsamples in which significance levels of α < 0.005, α < 0.01, and α < 0.00 are applied. The bootstrapping results should be compared with Student’s t-value; this allows it to be stated that there is a causal relationship between two latent variables of the model if the β value between them is greater than or equal to 0.2 and is also statistically significant [
37,
43].
Having conducted this procedure, we discuss the results and propose solutions to optimise the efficiency of goods delivery and reduce the negative externalities in the study areas. In so doing, we hope to support the city’s urban planning process by considering citizen participation as a basis for urban freight policies and a sustainable competitive city.
5. Discussion
Urban freight logistics issues are difficult to address and require a deep understanding of the stakeholders affected by freight distribution in urban areas [
11]. This study sheds light on citizens’ perceptions of urban freight logistics in a mid-sized Latin American city. It confirms the importance of decision makers considering the involvement of citizens in freight planning [
34]. Prior research has been conducted in Latin American cities with a view to improving logistics practices, urban planning, and supply chain optimisation. However, recent global events have exposed the volatility of urban planning in little-studied spheres, such as stakeholders’ perceptions and sustainable initiatives in mid-sized cities, reinforcing the need for collaborative planning to improve logistics conditions in the Latin American region.
Popayán, like many mid-sized Latin American cities, has a high population growth rate reflected in an increasing population density (16,905 inhabitants/km2). Likewise, the city’s economic activities are concentrated in the trade and services sector (83.2% of value added), and this is reflected in the increase in commercial establishments in the city—particularly in C4 and C8. This trend is making ever-greater demands on the city’s logistics operations, which are limited by a road infrastructure that is inadequate for modern multimodal transportation.
In this context, the present study research analysed the logistics operations in the city of Popayán through an exploratory research approach. Two methodologies were integrated, which allowed us to analyse logistics practices in C4 and C8 based on the characteristics of the commercial, regulations, vehicular traffic congestion, freight disruptions, and stakeholders’ perceptions in the two areas with a focus on citizen participation in the planning of urban freight transportation public policies. We observed that the predominant type of commercial establishments is nano-stores (87%). These businesses present a high level of informality, posing great challenges in terms of public space use and L/U activities. However, only 20% of these businesses in Popayán have L/U zones, causing high levels of disruption to both freight operations and mobility.
As regards the infrastructure characteristics, Popayán is a colonial city that in recent years has undergone disorderly growth. This kind of urban archetype is particularly vulnerable to contemporary freight transportation, i.e., there is an opportunity to propose the use of non-motorised vehicles for the distribution of merchandise and mobility in the city, to adopt sustainable ecological mobility strategies suited to the current infrastructure conditions, and to explore optimal locations for last-mile logistics hubs to deliver merchandise using non-motorised vehicles.
Thus, citizens who participated in the survey recognised the importance of their involvement when interacting directly or indirectly with freight activities. As noted by Amaya et al. [
11,
34], stakeholders’ perceptions are an expression of the freight movement impacts on their daily activities and could be used by decision makers to maximise the potential for public policy implementation about the leading actor’s perceptions in the urban system. Therefore, by considering the insights of citizens, new points of view and solutions to mobility and freight problems can be obtained, since these stakeholders are among the most affected by each zone’s cargo operations.
The results of our PLS-SEM model show that urban indicators are the most important factor for good urban freight logistics planning, followed by stakeholder collaboration. This corroborates the findings to avoid inadequate logistics initiatives and to observe plurality, rationality, and relevant stakeholders strategies; the search for combined solutions is an important condition for good city logistics [
11,
12,
14,
50,
51]. At the indicator level, most contribute to the endogenous reliability construct to correlate positively even though the PLS-SEM model limitations result from the sample size.
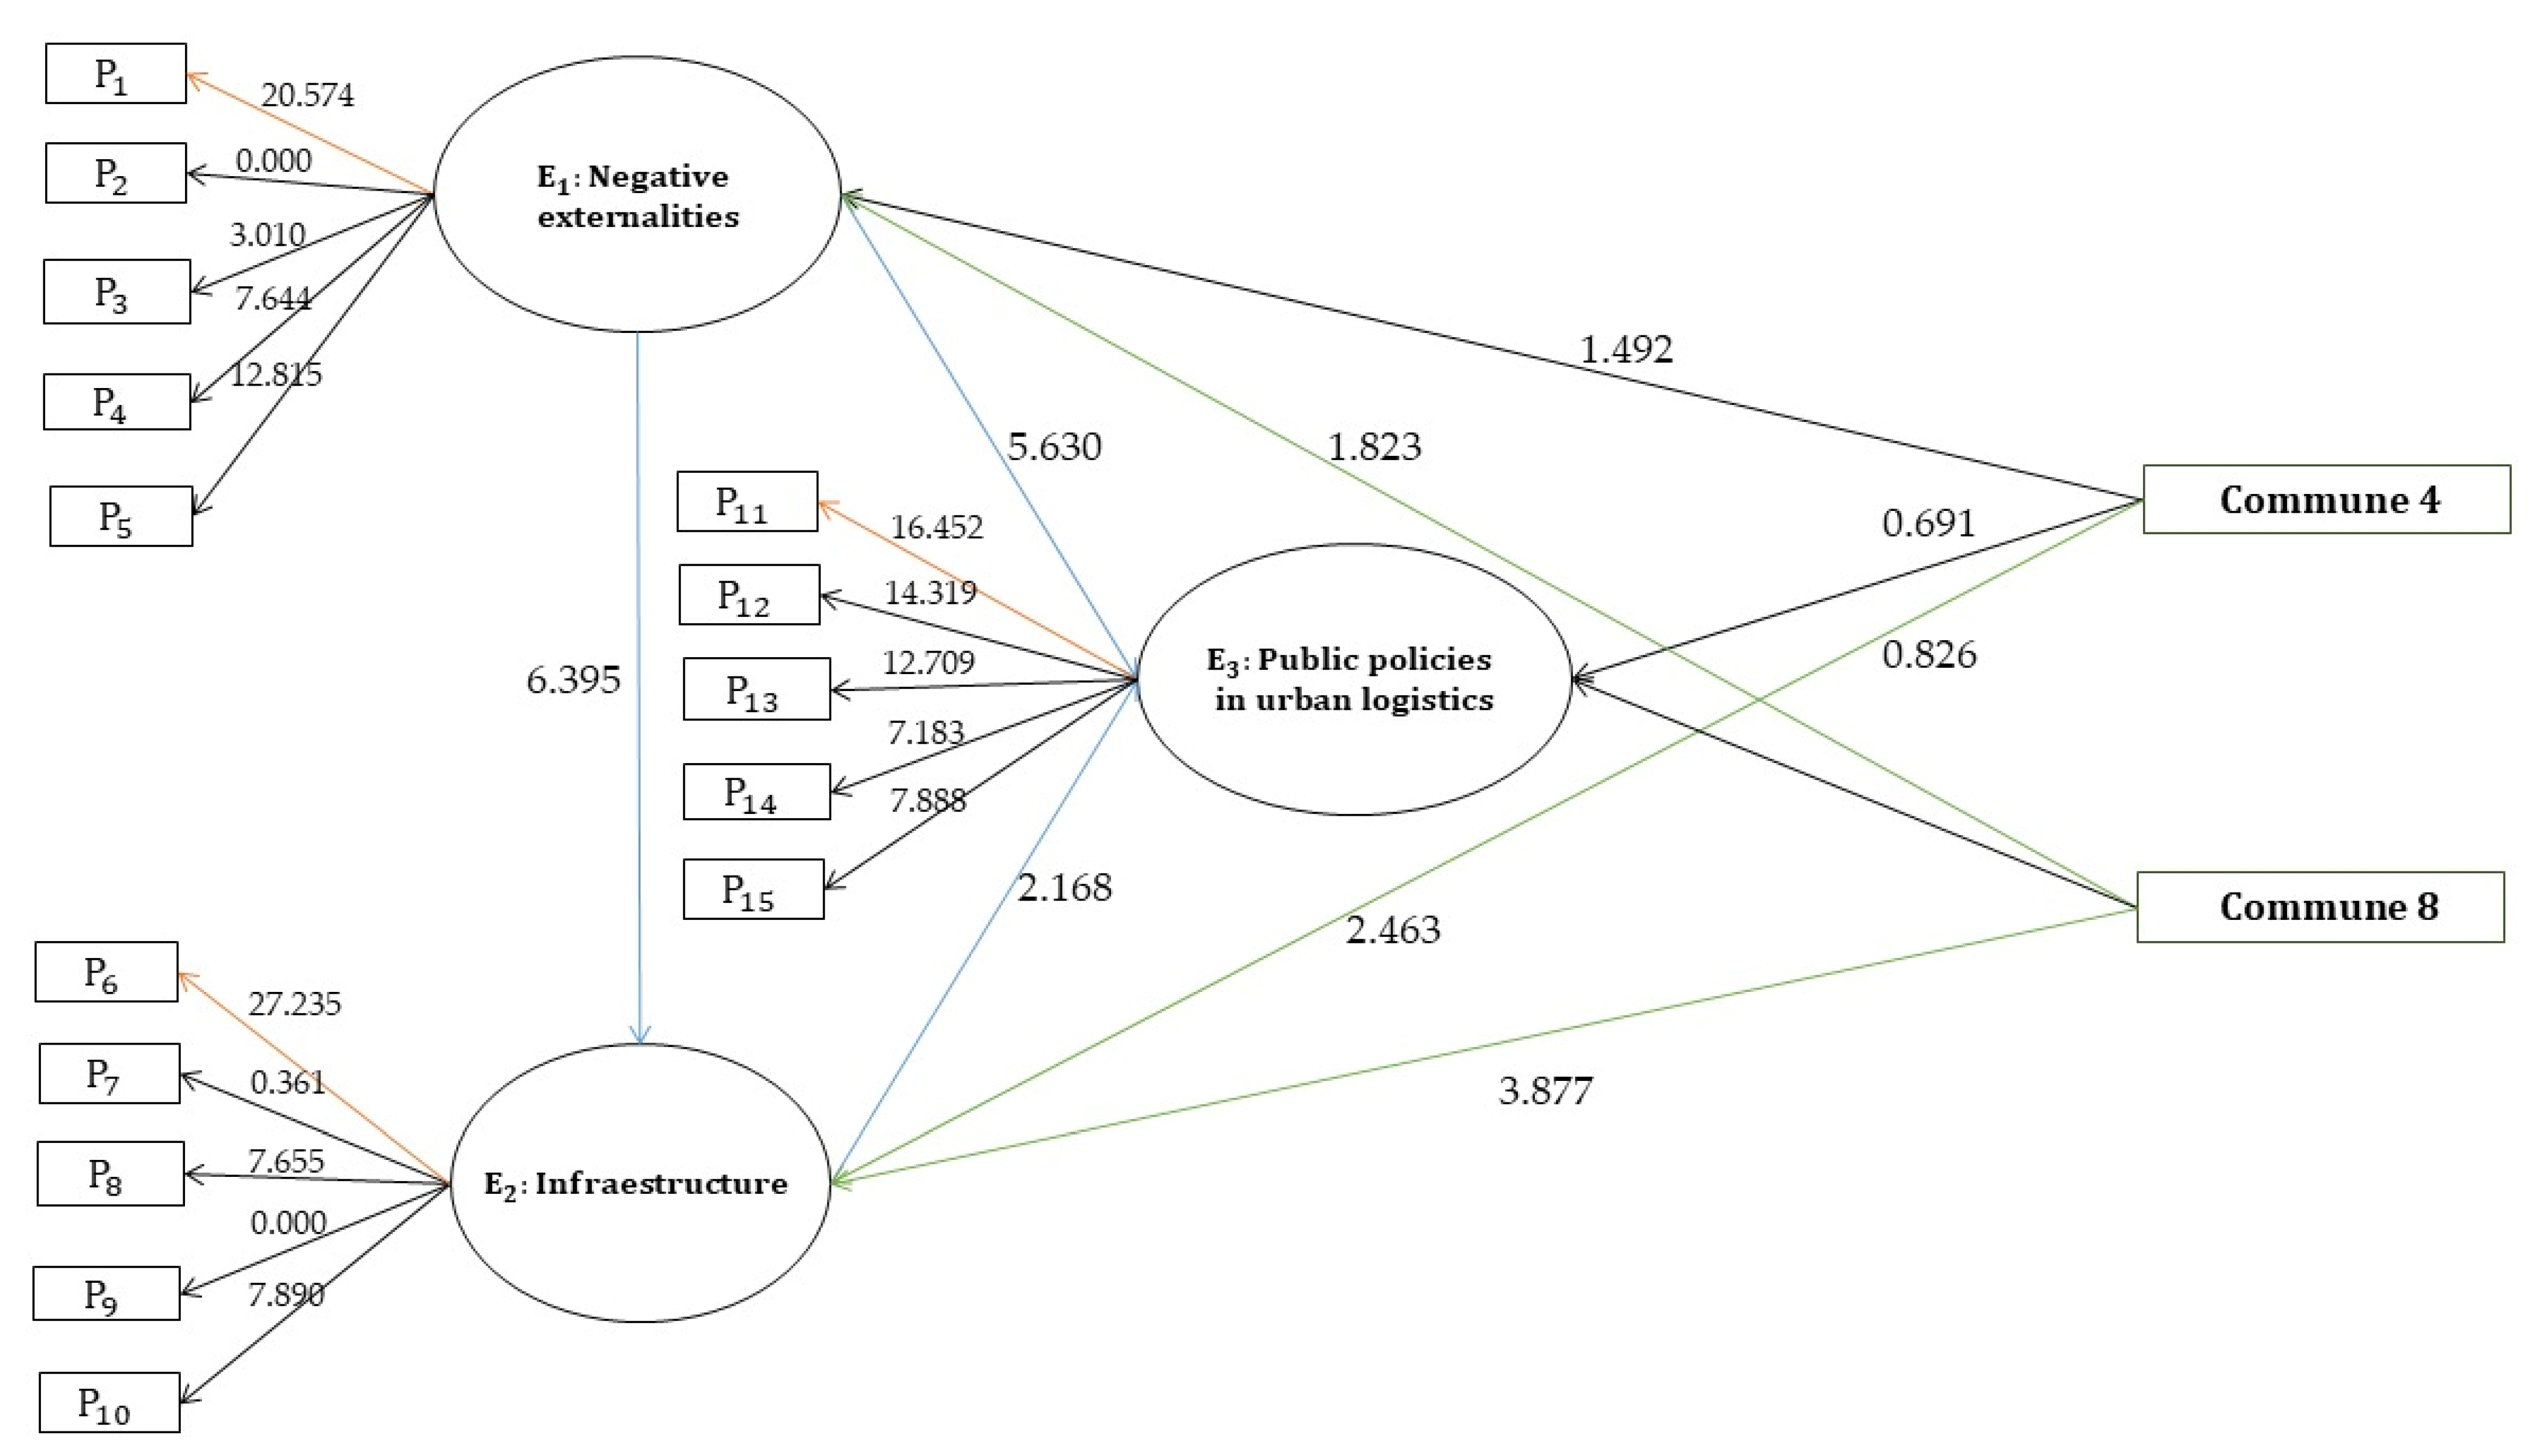
Based on the PLS-SEM model results, it is possible to confirm that stakeholder perception of urban freight transport public policies is negatively influenced by the freight operations’ negative externalities (H1). In turn, infrastructure perception positively influences urban logistics public policy formulation (H2). However, road infrastructure is negatively associated with the negative externalities caused by urban freight operations (H3). This value correlates with the perception by location: in C4, infrastructure is negatively associated with the activities associated with urban freight transport, possibly because of the small space available for these operations and the lack of dedicated areas; in C8, negative externalities are perceived as negatively influencing L/U operations. In addition, we verified that the infrastructure is limited for urban freight transport.
This information will allow a focus on sustainable public policies given the current conditions of Popayán. This might include, in the medium and long term, simulating, validating, and executing initiatives geared toward sustainable logistics practices, such as the use of environmentally friendly non-motorised vehicles in the last-mile distribution of merchandise, load-sharing strategies, and a restructuring of the urban freight logistics system with a view to optimising public space, minimising negative externalities, and maximising sustainable urban freight logistics [
52,
53,
54]. In so doing, progress can be made in the integration of stakeholders into collaborative planning oriented towards a sustainable, competitive, and efficient city.
6. Conclusions
This research sought to learn about logistics activities in the city of Popayán based on stakeholders’ perceptions about urban freight operations, and to characterise the logistics profiles of two highly commercial areas: C4 and C8. The objective was to analyse the relationship between infrastructure, negative externalities, and urban logistics public policies. We aimed to validate four hypotheses that we tested following a partial least square structural equation modelling (PLS-SEM) approach. The main contribution of the study is to lay the foundations for sustainable public policies that can have a positive impact on logistics conditions in a mid-sized Latin American city by confirming the importance that decision makers should place on stakeholder participation in the urban planning process.
The logistics profiles of the two study areas allowed us to identify 1209 commercial establishments in C8 and 1817 in C4 (i.e., 33.46% more than C8), of which retail stores predominated as approximately 87% of the total. Similarly, a lack of freight transportation signage was evident in the 1201 streets present in these two square kilometres of study. On average, only 29% have adequate vehicular and pedestrian traffic signs; i.e., 71% do not comply with these requirements, which is proportional to the increasing levels of disruption and accidents caused by logistics operations and vehicular traffic in the city. The survey results show that traffic congestion (87%) is the most important cause of negative externalities. Likewise, 93% of citizens think the city needs L/U zones. As to public policies, 89% of respondents agree with the idea of night-time hours for L/U to improve mobility and optimise freight logistics operations in the city.
This study sought to analyse and evaluate Popayán logistic operations in C4 and C8. It is the first research of this type using PLS-SEM to be conducted in the city. The results of our analysis attest to the research model’s good predictive capacity. The findings also confirmed the relationship between negative externalities and infrastructure in the planning process for urban freight public policies. The initiative with the highest level of acceptance was [P11], referring to overnight L/U operations. The findings also validate the difference in perceptions by location, in that respondents in C4 place greater importance on public policies oriented toward infrastructure, whereas those in C8 felt that planning should prioritise externalities related to road infrastructure. In other words, logistics optimisation initiatives should consider local characteristics according to the predominant negative externalities type caused by freight activities in each area.
This research does have certain limitations. First, the study areas only span a portion of the city, with economic activities limited to that zone. Therefore, it is advisable to carefully consider this before directly applying the findings to different urban areas [
11]. Second, the Km
2 methodology is limited by the city’s recent economic and social changes, given the need to ensure an up-to-date time interval of no more than 12 months. Third, although the sample is representative of the studied area, it does not represent the entire city’s population. The sample includes only freight activities such as deliveries, L/U operations, and stakeholder interactions. Fourth, to ensure collaborative and sustainable logistics in the city, future research must involve more stakeholders to support the decision-making process. Finally, it would be of interest to apply the PLS-SEM model to more mid-sized Latin American cities and to compare the results with those presented here in order to strengthen the evidence and bolster the literature on stakeholder participation within urban areas.


