Review

Perceived Usability Evaluation of Educational Technology Using the Post-Study System Usability Questionnaire (PSSUQ): A Systematic Review

by
Prokopia Vlachogianni
and
Nikolaos Tselios
*
Department of Educational Sciences and Early Childhood Education, University of Patras, 26504 Rion, Greece
*
Author to whom correspondence should be addressed.
Sustainability 2023, 15(17), 12954; https://doi.org/10.3390/su151712954
Submission received: 27 June 2023 / Revised: 2 August 2023 / Accepted: 22 August 2023 / Published: 28 August 2023

Abstract

:
Given that educational technology has increased tremendously, usability testing is a necessity to maximize the efficiency of technological tools in education. The findings of a systematic review including 42 research papers that evaluated the educational technologies’ perceived usability with the Post-Study System Usability Questionnaire (PSSUQ) and the Computer System Usability Questionnaire (CSUQ) are presented in this article. The results were categorized according to the following factors: (a) score derived from evaluating usability with PSSUQ/CSUQ, (b) type of educational technology employed, (c) subject studied, (d) educational stage, (e) participant type, (f) age, and (g) participant count in each survey. The usability levels were found to be satisfactory (M = 72.75, SD = 15.12) from the statistical analysis of all surveys (N = 58). The mobile applications category showed a very good mean PSSUQ/CSUQ score (M = 81.53, SD = 12.61) followed by the multimedia category with 73.89 (SD = 19.69) and internet platforms (M = 73.23, SD = 7.74). The educational stage (p = 0.01) and the participant type (p = 0.005) seem to relate to the obtained PSSUQ/CSUQ scores. However, the participants’ age, the subject being studied, or the participant count in each study did not exhibit any significant correlation with the PSSUQ/CSUQ scores. Over the course of time, a marginal non-statistically significant improvement was noted in terms of perceived usability (p = 0.136).

1. Introduction

In a rapidly evolving world, the integration of technology has revolutionized many aspects of our everyday lives, including education. Both educators and learners face the challenge to embrace successfully technological means to unlock interactive learning experiences and personalized instruction. In this context, the term educational technology emerged as well as the subsequent need for its interpretation. The Association for Educational Communications and Technology (2008) defines educational technology as “the study and ethical practice of facilitating learning and improving performance by creating, using and managing appropriate technological processes and resources” [1]; the systematic application of teaching methods, instructional techniques, multimedia, tools, and technology to continuously enhance learning, teaching, and academic outcomes. Huang [2]—giving emphasis to the various context learning might take place—states that educational technology encompasses the utilization of tools, technologies, processes, resources, and methods aimed at enhancing learning encounters across diverse settings, including formal, informal, non-formal, lifelong, on-demand, workplace, and just-in-time learning. This field has progressed from early adoption of teaching tools to a rapid expansion in recent times, now incorporating a wide range of devices and approaches such as mobile technologies, virtual and augmented realities, simulations, immersive environments, collaborative learning, social networking, cloud computing, flipped classrooms, and various other innovations. A simple, concise, recent definition of educational technology refers to the application of technology in diverse educational environments, aiming to optimize learning and enhance educational achievements [3].
Educational technology is widely employed in every aspect of the learning process since it seems more appealing to students and teachers than using traditional means. It is met at all educational stages, from preschool to universities in many types and forms. Specifically, technology usage in education is proved to be beneficial to: students’ motivation and engagement [4,5,6,7], self-confidence [4], increased student understanding [4], increased instructional differentiation [4,5], increased exposure to more current content material [4,6], accessible and located learning [5].
However, the use of technological tools is not a panacea for achieving every single learning objective. Even though it is often referred as a means of maximizing the learning outcomes, while reducing costs, further research is needed to estimate the true cost-effectiveness in each context [8]. The “technology usage–improved learning outcomes” relationship is mediated and influenced by many factors, such as users’ learning styles [9,10], frequency of technological system’s use [11], instructional methods [12,13], information and communication technologies (ΙCT) competency, and the technological system’s usability.
In 1998, the International Organization for Standardization established a widely accepted definition of usability. According to this definition, usability pertains to the level to which a product or system can be effectively, efficiently, and satisfactorily used by its users aiming to achieve specific objectives in a particular environment [14]. Bevan et al. [15] give emphasis to usability as a result of interaction rather than an intrinsic characteristic of a product itself. Researchers’ primary focus were the first two objective dimensions initially, but afterwards the need of evaluating the third subjective dimension arose [16].
At this point, it is of paramount importance to highlight the distinction between usability and perceived usability. Even though they are strongly related concepts, they have some key differences. On the one hand, perceived usability indicates how easy to use a technology is perceived by its intended users. It is a subjective measure, and it can be influenced by many factors such as user expectations, ICT competency, past experiences, personal characteristics, and preferences. Contrarily, the level of usability is linked to the tangible, actual degree of convenience and user-friendliness exhibited by a technological system, while perceived usability is a measure of how easy the technology is perceived to be by the users. Thus, perceived usability is more related to the user’s perception and experience, while usability is more related to the technical aspects of the technology.
Perceived usability (satisfaction) seems to play an important role to students’ learning gain [17,18,19,20,21]. A user-friendly interface enables students and teachers to interact directly and effectively with a technological system without having to spend cognitive resources on learning the system thus focusing on the learning content. Hence, the perceived usability primarily hinges on the user’s subjective perception and experiential encounters, whereas usability primarily revolves around the intricate technical facets of the technology at hand.
Literature findings highlight the disconnection between human computer interaction research and technology enhanced learning as it is reflected upon the lack of usability frameworks [18]. This paper is an attempt to systematically review the current body of scholarly works regarding the utilization of educational technology and how it is assessed in terms of perceived usability. Given that benchmarks for educational technology have already been created using the System Usability Scale (SUS) [22], the predominant instrument employed to gauge the perceived usability, this paper contributes to this effort by complementing it with the PSSUQ/CSUQ accordingly. By conducting a systematic review using PSSUQ/CSUQ, researchers can compare the results and findings from multiple studies that have used PSSUQ and CSUQ in educational technology. This comparison allows for a deeper understanding of the factors affecting usability and user experience across different technological interventions. It is noteworthy that SUS and PSSUQ/CSUQ scores are proved to be highly correlated in recent studies [11,23].
Consequently, the significance of usability in educational technology is underscored, and all parties involved are aware of its meaning for the technology-enhanced learning. In addition, access is now provided to a concentrated framework which includes many variables such as: educational stage, type of participant, study’s date, age of participants, subject being learned. A comprehensive review of existing literature using PSSUQ and CSUQ ensures that decisions related to the implementation and improvement of educational technology are based on evidence and empirical data rather than anecdotal or subjective assessments. Consequently, the development and improvement of technological tools and systems used for educational purposes can now be relied on solid research data.
Furthermore, the current systematic review’s findings can have implications for educational technology policies and practices. The abovementioned solid research data gathered can inform policy makers, institutions, universities, professors, and teachers about the most effective ways to integrate technological means into their teaching practices and enhance the overall learning experience for learners at all educational stages.
In summary, a systematic review of PSSUQ and CSUQ for educational technology is crucial for establishing their validity and reliability, identifying best practices, and informing evidence-based decision making to enhance the usability and overall effectiveness of technology in educational settings.

2. Literature Review

The Post-Study System Usability Questionnaire (PSSUQ) is an evaluation tool used to assess perceived usability, and it does not require a license for its usage. Its first version consists of 19 items (short version: 16 items) and utilizes a 7-point Likert scale where lower ratings signify greater degrees of perceived usability (satisfaction). In numerous studies, factor analysis has consistently identified three distinct factors (subscales) known as System Usefulness, Information Quality, and Interface Quality. It is highly reliable with a Cronbach’s alpha that spans from 0.83 to 0.96 [24]. The Computer System Usability Questionnaire (CSUQ) was developed afterwards with identical items and similar wording using the present tense instead of PSSUQ’s past tense. It is sensitive both concerning many variables (type of participant, age of participant, type of technology assessed, user’s extensive years of experience and wide-ranging exposure to computer systems) and small sample sizes. The PSSUQ/CSUQ covers all aspects of usability: effectiveness, efficiency, satisfaction, and learnability [25]. They have been referred as tools that are used in various applications and provide a good validation in order to evaluate the usability of educational technology systems [26].
There are several tools, techniques, and methodologies for evaluating usability. The rationale for using the PSSUQ (Post-Study System Usability Questionnaire) and CSUQ (Computer System Usability Questionnaire) scales in this review paper lies in their effectiveness and extensive use as reliable tools for evaluating usability. Specifically, researchers employing these scales can measure users’ satisfaction levels about the interaction with a technology system and they are able to identify precisely the areas that need improvement in terms of usability.
Standardized usability questionnaires are widely accepted. However, they add value only when an interpretive framework is provided. Regarding PSSUQ/CSUQ scales, Sauro and Lewis [27] aggregated 21 studies using PSSUQ and provided benchmarks regarding the three subscales and the overall score. The scores for system usefulness, information quality, interface quality, and overall score are as follows: system usefulness scored 2.80, information quality scored 3.02, interface quality scored 2.49, and the overall score was 2.82. Researchers and Human–Computer Interaction (HCI) experts can interpret a system’s perceived usability by examining the PSSUQ/CSUQ score in light of the benchmarks mentioned above. Since it is highly correlated with SUS scores, it can support the originally published norms for SUS after converting them to a 0–100-point scale [28].
Tullis and Stetson [29] found that 12 participants produced equivalent results to a larger sample size in 90% of the cases. It has also been referred [30] that as a questionnaire CSUQ seem to have a positive aspect in its statements. This may simplify the answer procedure but also causes a kind of response bias.
As PSSUQ is a common and widely used usability tool it has been translated into many languages, mainly European [31]. There are versions in Greek [32], Arabic [31], Portuguese [33], Turkish [34], French [35], Spanish [36].
Regarding demographics, gender does not seem to significantly affect PSSUQ scores in a dataset of 21 studies on dictation systems [24]. Alhadreti [11] examined possible correlation between CSUQ ratings of the Blackboard platform and the age of participants in a dataset of 187 scholars affiliated with Umm Al-Qura University in Saudi Arabia. He found no statistically significant correlation between CSUQ score and age (p = 0.820, ns). Sonderegger et al. [37] employed a 2 × 2 between-subjects design in a quasi-experiment using PSSUQ, with two age groups (old and young). Between the two age groups, in a sample of 60 subjects, no significant difference was found (F < 0). In conclusion, the PSSUQ/CSUQ tools seem to be easy generalizable and able providing a stable reliability through different implementations [38].
In this article, the findings of a systematic review of usability of educational technology systems are presented. The research involved a comprehensive analysis of 42 research papers that evaluated the perceived usability of different educational technologies in various settings. The Post-Study System Usability Questionnaire (PSSUQ) and the Computer System Usability Questionnaire (CSUQ) were utilized to assess perceived usability. While the PSSUQ/CSUQ scale exhibits strong validity and reliability for evaluating usability, it is worth noting that there are numerous other questionnaires for usability assessment and their utilization in evaluating educational technologies has only recently gained prominence.

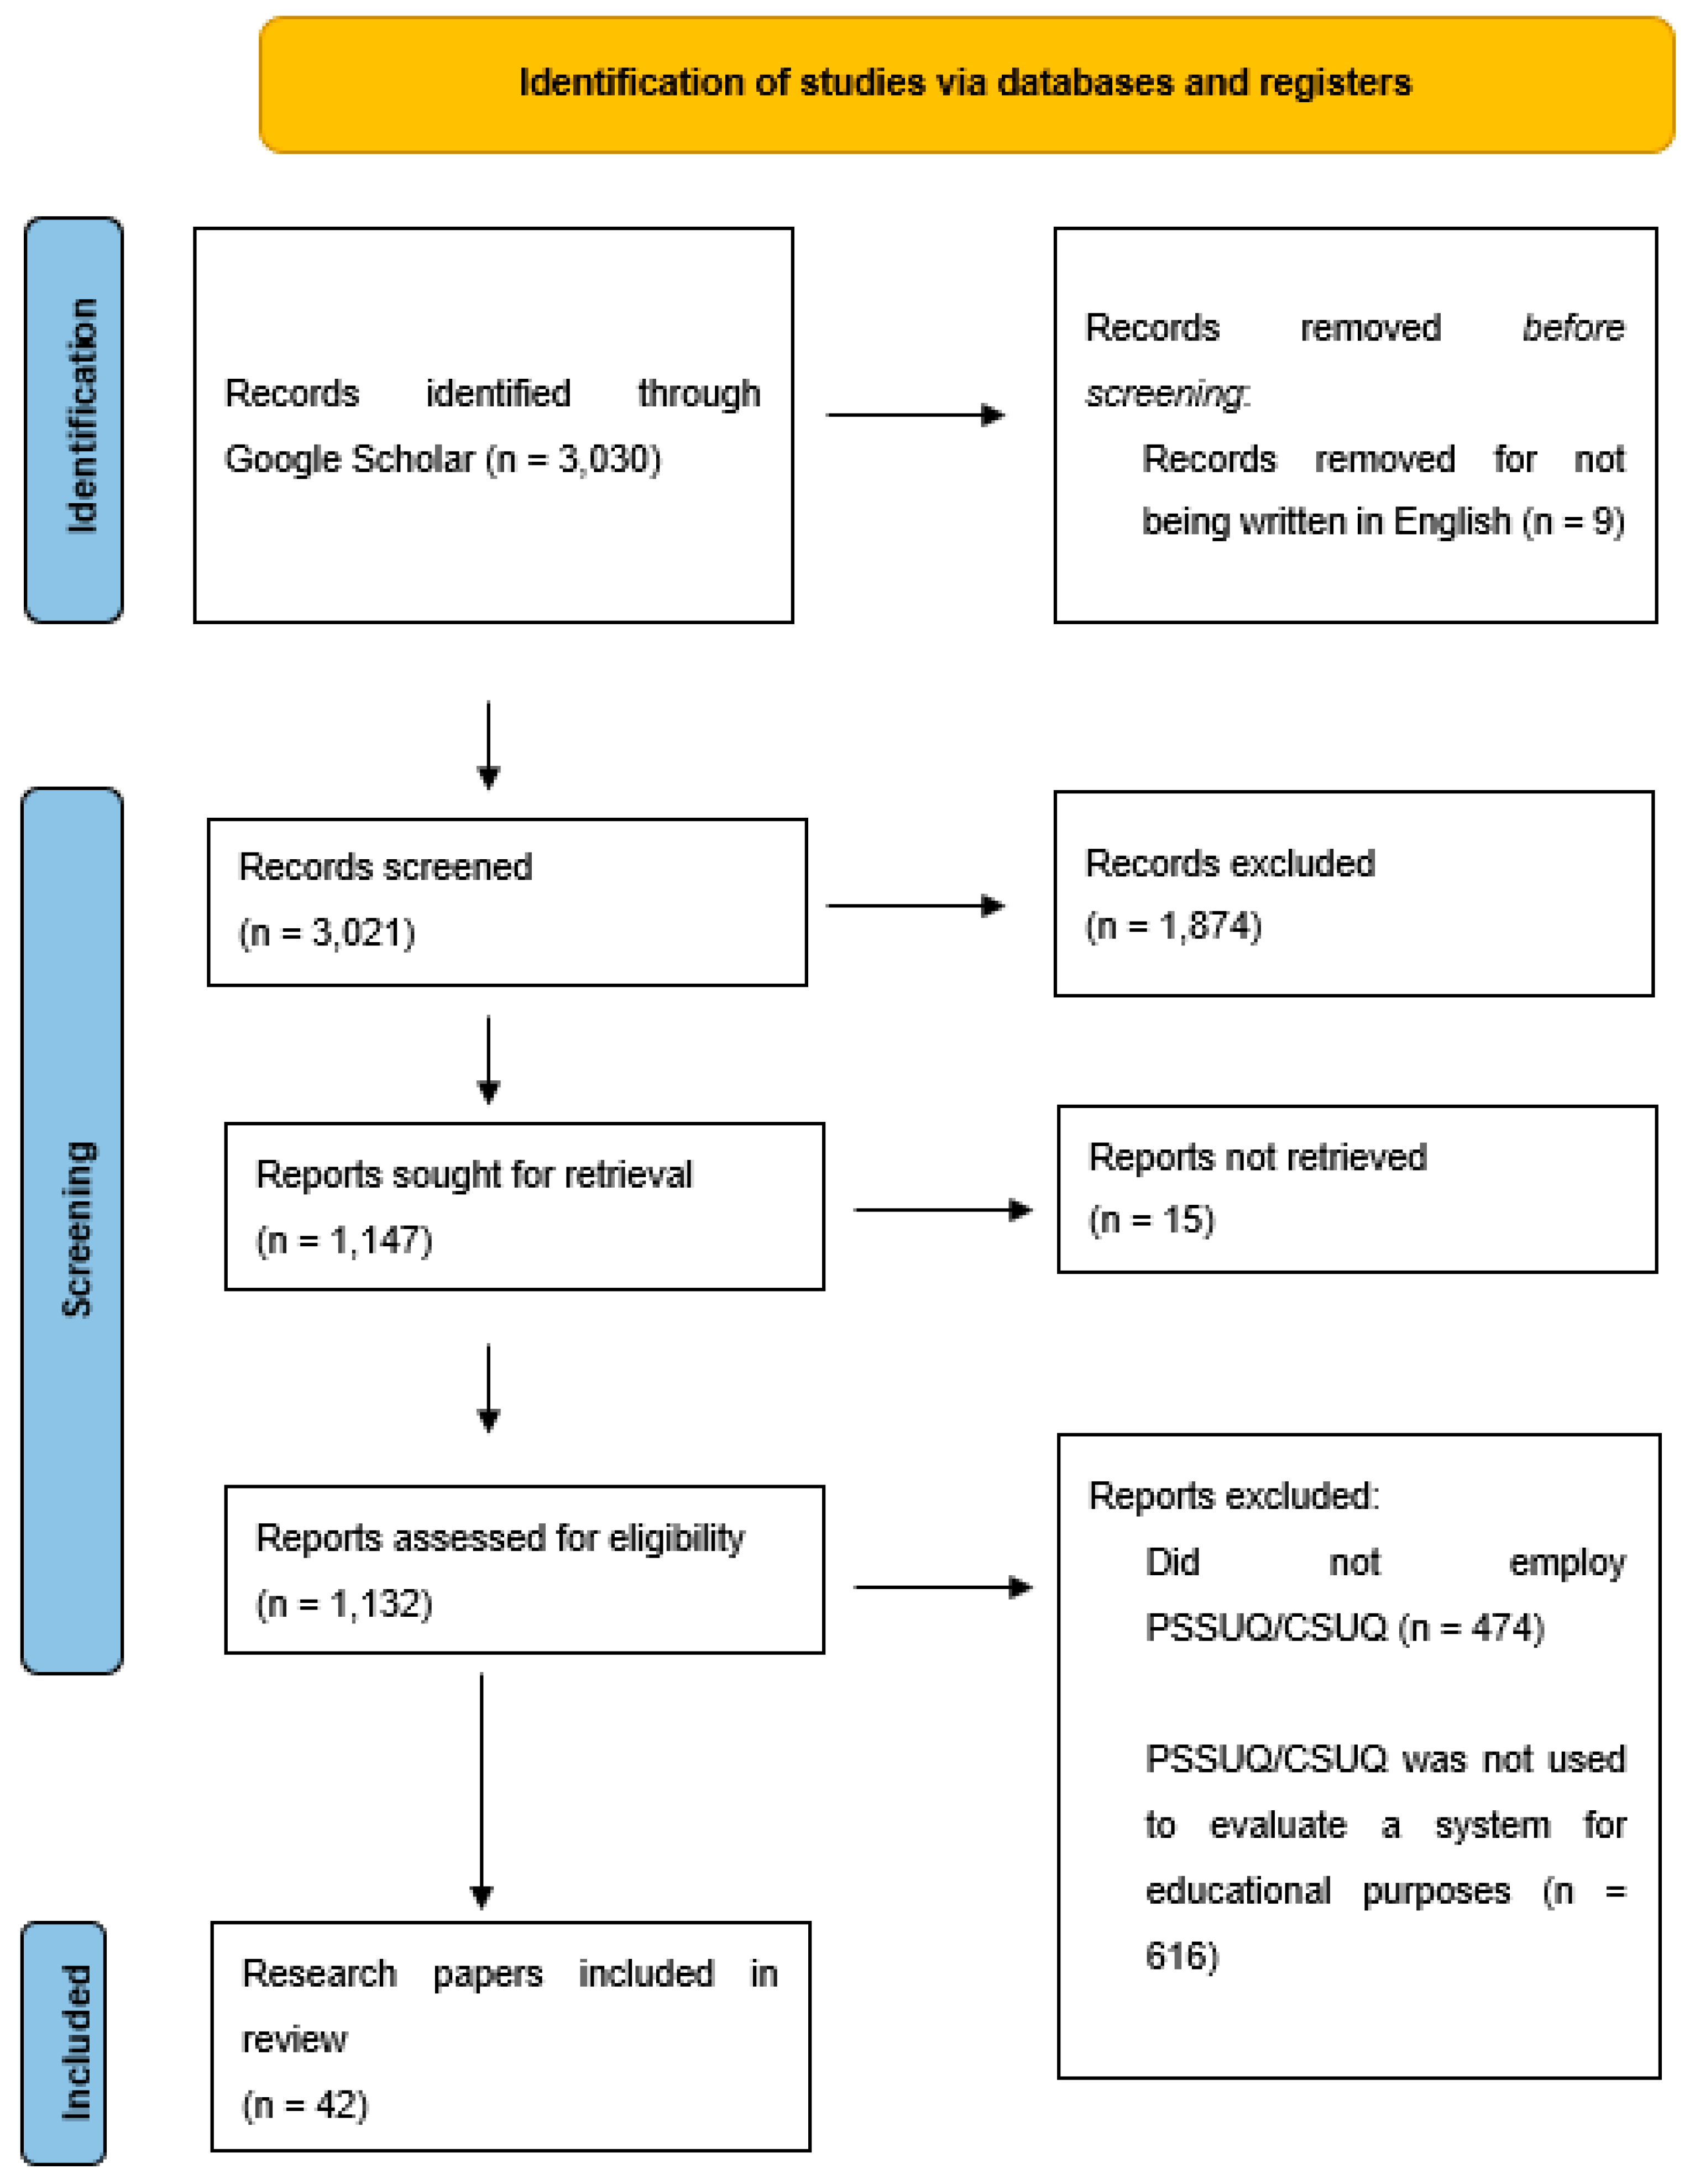
3. Materials and Methods

A systematic review methodology was followed for this research. Its main goals were (a) to gather and synthesize findings from previous research studies regarding the use of PSSUQ/CSUQ for educational purposes and (b) to establish benchmarks for the usability of educational technology by relying on quantitative data derived from research. This work builds upon our prior research endeavor, in which the System Usability Scale was utilized to assess the perceived usability of educational technology [22].
This study intends to be of paramount importance to the concerned parties, such as administrators, developers, and educators. On the one hand, its purpose is to provide a framework for the design and assessment of educational technology systems. On the other hand, awareness is raised to more learner-centered approaches shifting the focus from the technology system to how the system is perceived by its users. Consequently, the future educational technology systems are expected to become more user-friendly, and the existing ones will be improved.
This article unveils the results of an extensive examination of educational technology through a systematic review concerning systems usability evaluation using PSSUQ and CSUQ. A total of 42 research papers were used assessing the perceived usability of diverse educational technologies in different contexts. It encompassed a thorough examination, organization, and analysis of the results obtained.
The current systematic review followed the PRISMA method, consisting of a 27-item checklist and a flow diagram shown below (see Figure 1). Google Scholar was employed as a database using the keywords “PSSUQ/CSUQ, usability, educational technology”.
The research papers used were published from 2006 to 2022 based on the availability of the literature and the fulfilment of inclusion and exclusion criteria. This study employed the specific keywords on Google Scholar during the search process: “PSSUQ/CSUQ, usability, educational technology”. Data collection commenced in October 2021 and concluded in September 2022.
At the outset of this study, the following criteria were applied for inclusion and exclusion purposes:
Inclusion criteria:
  • Research papers that assess the usability of educational technology systems using PSSUQ/CSUQ.
  • Each educational technology system should be specifically designed for educational use.
Exclusion criteria:
3.
Research papers written in languages other than English.
4.
Studies that did not employ the PSSUQ/CSUQ scale.
5.
Evaluations of educational software that did not utilize the PSSUQ/CSUQ for usability assessment.
The search procedure was carried out in the following manner: The keywords “PSSUQ/CSUQ, usability, educational technology” were entered into Google Scholar, resulting in 1600 hits for PSSUQ/CSUQ and 1430 hits for usability, respectively. This was followed by a thorough check in accordance with the criteria for both inclusion and exclusion. Specifically, we identified a total of 3030 publications for detailed evaluation. After eliminating 9 records which were not written in English, we performed an initial screening 3021 publications. A total of 1874 of them were excluded because they were not relevant to our research topic and 15 of them could not be retrieved. The rest of 1132 reports were assessed for eligibility and 474 research papers did not employ the PSSUQ/CSUQ tools for perceived usability evaluation and 616 of them did use PSSUQ/CSUQ but not for educational purposes. Finally, a total of 42 research papers that satisfied the eligibility criteria were consolidated into Microsoft Excel. The findings of the literature review were systematically organized according to the following categories: (a) survey date, (b) the category of educational technology utilized, (c) subject matter being studied, (d) targeted educational level, (e) participant type, (f) age, (g) participant count, (h) participant gender, (i) usability score derived from PSSUQ/CSUQ, (j) scores in the three subscales (System Usefulness, Information Quality, and Interface Quality), and (k) the specific items included in each questionnaire.
It is not always straightforward to distinguish technology categories, because of the rapid technology advancements. The rough characteristics of each technology were therefore identified. After careful review of these research studies, a pattern emerged. Most of the educational technology used in the studies demonstrated common characteristics. Based on the collected data and our previous work categorization [22] three generic categories occurred: internet platforms, mobile applications, and multimedia (see Table 1). Specifically, the category of internet platforms encompasses learning management systems (LMS), content management systems (CMS) and any platform used for learning purposes. The multimedia category contains any kind of visualization (Augmented Reality, Virtual Reality).
IBM SPSS Statistics v27.0 was employed to conduct a statistical analysis after a first processing of the data (all cases checked to be positively reversed and converted to percentages). To address the research questions, potential correlations between different variables and the PSSUQ/CSUQ score were investigated. Additionally, weighted means were utilized to account for any potential variations in the PSSUQ/CSUQ score attributable to varying sample sizes. In terms of learning disciplines, three distinct categories were identified, which are as follows: (a) history/languages, (b) informatics/engineering, and (c) medicine. Regarding the participant type, three additional categories occurred: (a) university students (undergraduate, postgraduate, college students), (b) teachers (primary education teachers, secondary education teachers and professors) and (c) students (primary and secondary education students).
To this end, it would be essential to make a distinction between the two terms that may be confusing. When the term Research paper is referred it means that a published manuscript is presenting the results of an original research. A research paper can be consisted of one or more research studies/surveys.
The subsequent research questions provided the guiding framework for this current review paper.
  • What are the usability levels, as measured by the Post-Study System Usability Questionnaire (PSSUQ) and Computer System Usability Questionnaire (CSUQ), for different types of technology employed in education?
  • Is there a significant variation in usability among these different types of technology?
  • Is there a relationship between age, subject being studied, educational level targeted by the technology, stakeholders involved, type of educational technology used, participant count in each sample, and the PSSUQ/CSUQ score?
  • Which level of education predominantly utilizes each evaluated type/category of educational technology?
  • Does the perceived usability of the educational technology systems exhibit significant differences over time?

4. Results

4.1. Levels of Perceived Usability in Educational Technology Systems

Statistical analysis conducted across all surveys (N = 58) extracted from 42 research papers unveiled a slightly below-average level of usability (M = 72.75, SD = 15.12). The potential impact of sample size variations on perceived usability scores was taken into account. The weighted mean score derived from the PSSUQ/CSUQ was found to be 68.66.

4.2. Benchmark Data for Various Categories of Educational Technology Based on PSSUQ/CSUQ

The analysis of the collected data unveiled the perceived usability levels associated with each category of educational technology.
Τhe internet platforms category, as depicted in Table 2, encompassed 21 surveys, with a mean PSSUQ/CSUQ score of 73.23 (SD = 7.74). The mobile applications category comprised 12 surveys, with a mean PSSUQ/CSUQ score of 81.53 (SD = 12.61). The multimedia category consisted of 8 surveys, with a mean PSSUQ/CSUQ score of 73.89 (SD = 19.69).
A one-way analysis of variance (ANOVA) was performed, indicating no statistically significant variation (p = 0.184) across the different educational technology categories. The distribution of the dependent variable, PSSUQ/CSUQ mean score, was assessed for normality. Both the Kolmogorov–Smirnov and Shapiro–Wilk tests confirmed a normal distribution.

4.3. Age of Participants and PSSUQ/CSUQ Score

In a total of 16 surveys, a Pearson correlation coefficient was computed to examine the potential correlation between participant age and the average PSSUQ/CSUQ score. However, no significant correlation was observed (r = 0.296, p = 0.266, ns).

4.4. Subject Being Studied and PSSUQ/CSUQ Score

In 15 surveys, a one-way ANOVA was conducted to explore the potential correlation between the subject being studied (e.g., history/languages, informatics/engineering, and medicine) and the average PSSUQ/CSUQ score. However, no significant difference was found (p = 0.174, ns).

4.5. Educational Stage and PSSUQ/CSUQ Score

To examine the potential correlation between educational stages (i.e., primary/secondary and higher education) and the average PSSUQ/CSUQ score, an independent samples t-test was utilized with a total of 43 surveys. The data for primary and secondary education were combined into a single category to facilitate meaningful comparisons with the university level. The results revealed that the mean PSSUQ/CSUQ scores of higher education (M = 69.38, SD = 13.8) were significantly lower than those of primary/secondary education (M = 82.88, SD = 11.2) (p = 0.01, s).

4.6. Participant Type and PSSUQ/CSUQ Score

An analysis using a one-way ANOVA was conducted to examine the potential relationship between participant type (such as university students, teachers, and students) and the average PSSUQ/CSUQ score. A total of 37 surveys were analyzed. The results indicated a statistically significant difference (p = 0.005, s). Further analysis employing independent samples t-tests between various categories revealed significant differences in the mean PSSUQ/CSUQ scores between university students and teachers (p = 0.016, s), as well as between university students and students in primary/secondary education (p = 0.008, s).

4.7. Number of Participants and PSSUQ/CSUQ Score

In 58 surveys, a Pearson correlation coefficient was computed and no statistically significant relationship between the number of participants and the PSSUQ/CSUQ score was observed (r = −0.206, p = 0.122, ns).
The outcomes of the aforementioned statistical analyses, including the correlations between the PSSUQ/CSUQ score and other variables such as participant age, subject being studied, educational stage, participant type, participant count in each study, are condensed and presented in Table 3.

4.8. Educational Stage and the Category of Educational Technology

Within a dataset comprising 29 surveys, we investigated the usage of various educational technologies, assessing their perceived usability across three educational stages (as indicated in Table 4). The findings demonstrate that higher education employs 84.6% of internet platforms, whereas secondary education utilizes 15.4%. Regarding mobile applications, 55.6% are utilized in higher education, while 44.4% are employed in secondary education. Furthermore, it was discovered that 71.4% of multimedia technologies are utilized in higher education, with an equal distribution of 14.3% each in primary and secondary education.

4.9. PSSUQ/CSUQ Scores over Time

In order to explore how the perceived usability changes over time, a one-way repeated-measures analysis of variance (ANOVA) was conducted, using reference time points in 2013, 2017, and 2021 (refer to Figure 2). The analysis indicated a non-significant improvement in usability across time (Wilks’ lambda = 0.019, F(2, 1) = 26.519, p = 0.136, ns). Similarly, no significant improvements were observed for any of the categories over the designated time period.

5. Discussion

The main goal of this systematic review is to provide a thorough and in-depth overview of the existing research findings related to assessing the perceived usability of educational technology systems. This will be achieved by examining the data gathered through the utilization of two questionnaires: the Post-Study System Usability Questionnaire (PSSUQ) and the Computer System Usability Questionnaire (CSUQ). The PSSUQ/CSUQ scale, being technology agnostic according to Sauro [28], allows for its use in evaluating the usability of various interfaces and hardware. This enables meaningful comparisons to be made when the same scale is employed across different systems. The aim of this paper is to provide usability benchmarks for educational technology that cater to all stakeholders involved.
These benchmarks will enable all stakeholders (e.g., educators, policy makers) to make evidence-based, informed decisions on allocating resources and implementing educational technology initiatives. In addition, a systematic review of the perceived usability evaluation has two main advantages. First, many individual researchers may find it challenging to keep up with the growing volume of studies and a systematic review proves to be a comprehensive summary of their field of interest. Second, given that usability of educational technology is of paramount importance for enhanced learning outcomes, a systematic review pinpoints the specific areas where improvements are needed, leading to more user-friendly educational tools.
Even though usability is often a rather overlooked concept in the educational settings, literature findings highlight the impact of perceived usability on students’ learning outcomes [21]. Consequently, it is vital for usability to be set at the foreground of educational research. Researchers and Human–Computer Interaction (HCI) experts are now aware of usability benchmarks using PSSUQ/CSUQ at main categories of educational technology. Furthermore, this study explores potential correlations between the PSSUQ/CSUQ score and factors such as age, educational stage, subject being studied, as well as the type and number of participants in each study. Lastly, the investigation extends to the examination of evolving perceptions of usability trends in educational technology systems as time progresses.
The perceived usability of the assessed educational technology systems (N = 58) appears to be reasonably satisfactory, with a mean score of 72.75 and a standard deviation of 15.12. This finding aligns with previous research papers that suggest an average PSSUQ/CSUQ score of approximately 74 [27]. Additionally, considering the weighted mean, the score is determined to be 68.66. This range can be explained by the small number of usability studies using PSSUQ/CSUQ for educational purposes. Since PSSUQ/CSUQ scores highly correlate with SUS scores, prior benchmarks using SUS can be used to make comparisons [22]. An average SUS score is about 68 [78,79,80].
Based on the analysis of the results, it was found that the mobile applications category demonstrated very good mean PSSUQ/CSUQ score (M = 81.53, SD = 12.61) followed by the multimedia category with 73.89 (SD = 19.69) and internet platforms (M = 73.23, SD = 7.74). Regarding the internet platforms and mobile applications categories, the results are corroborated by [22] in which they found average usability scores with some issues (M = 66.25, SD = 12.42) and good usability scores, respectively (M = 73.62, SD = 13.49). Even though internet platforms are maybe the most widely used educational technology as it is derived from the available research data, it seems to fail to provide satisfactory usability levels for its users. A differentiation is detected concerning the multimedia category. In the current study, the multimedia category seems to have average usability scores 73.89 (SD = 19.69). On the contrary, in [22] using the SUS multimedia category revealed satisfactory levels of usability (M = 76.43, SD = 9.45). This result needs to be interpreted with caution since multimedia scores using PSSUQ/CSUQ obtained from the results of 8 studies instead of 21 where SUS scale was used. We strongly suggest that further investigation is required to approach more definitive conclusions for this educational technology category.
Additional analysis revealed no statistically significant correlation between age and the PSSUQ/CSUQ score (r = 0.296, p = 0.266, ns). This result is in line with [11,37]. A possible explanation is that educational technology is aimed at younger ages who are more familiar with its use. Another explanation is that everyone is more familiar nowadays to the use of technology as it is undoubtedly an integral part of our daily routine.
In addition, educational stage (p = 0.01, s), and the type of participants (p = 0.005, s) seem to relate to the obtained PSSUQ/CSUQ scores. PSSUQ/CSUQ scores at higher education are statistically significantly lower than those at primary/secondary education. This result is not anticipated since the educational technologies in tertiary education were used much earlier comparing to the other two levels of education. One would therefore expect these technological systems to be more sophisticated in terms of usability. However, perhaps more attention has been paid to the lower levels of education because of the younger age of attendance and the importance usability has on the learning outcomes. In addition, university students give higher ratings PSSUQ/CSUQ than teachers (p = 0.016, s) and primary/secondary education students (p = 0.008, s). One possible reason could be that university students, in comparison to the other two participant types, exhibit greater familiarity with a variety of educational technologies over the years. Consequently, their extensive experience may contribute to higher ratings being assigned.
Regarding the subject being studied (p = 0.174, ns) and participant count in each study (r = −0.206, p = 0.122, ns), no statistically significant correlations were observed with the PSSUQ/CSUQ score. We believe that the relationship between subject being studied and perceived usability is a complex interplay of several factors: cognitive, experiential, psychological and more. So, we suspect that these other unexplored factors are influencing perceived usability scores, which are not directly related to the subject being studied and the participant count in each study but mediating the abovementioned relationships.
Furthermore, when considering the educational level at which educational technology categories were used, the majority of usability studies were conducted in higher education settings, followed by secondary education. It is of interest to explore why the perceived usability levels of educational technology systems in primary education remains relatively low.
Lastly, a minor non-statistically significant advancement was noted in the perceived usability ratings through the years for the three examined categories of educational technology (p = 0.136, ns). This was also spotted at previous review using SUS [22]. The results would be an encouraging sign, indicating an awareness trend regarding perceived usability.

6. Conclusions

This systematic review summarizes published findings regarding perceived usability evaluation of educational technology using PSSUQ/CSUQ. The primary objectives of this study were twofold: firstly, to gather and summarize the outcomes of prior research studies that focused on the utilization of PSSUQ/CSUQ for educational purposes, and secondly, to establish a reference framework for the usability of educational technology based on quantitative research-based data. This endeavor aimed to benefit all relevant stakeholders involved in the educational technology domain, including developers, administrators, and educators, who will now have access to an unprecedented guide for designing and evaluating technology systems for educational purposes. In addition, the focus from the technology system is shifted to how the system is perceived by its users. Therefore, awareness is raised to more learner-centered approaches, improving the usability of the existing systems, and creating more user-friendly learning environments in the future. In pursuit of this objective, the analysis of 42 research papers was conducted to present the findings pertaining to the PSSUQ/CSUQ scores of the technology systems employed in education.
The acknowledgment of varying levels of perceived usability among the different technology categories is now established. The mobile applications category exhibited very good usability levels. The multimedia and internet platforms categories seem to have average usability levels with some weaknesses.
Regarding the third research question, the educational stage (p = 0.01, s), and the participant type (p = 0.005, s) seem to relate to the obtained PSSUQ/CSUQ scores. However, no significant relationship was observed between PSSUQ/CSUQ scores and participants’ age (r = 0.296, p = 0.266, ns), the subject being studied (p = 0.174, ns) or the participant count in each study (r = −0.206, p = 0.122, ns).
In relation to the fourth research question, a majority of the evaluated educational technologies primarily target the higher education sector in terms of their usability. Specifically, 84.6% of internet platforms, 55.6% of mobile applications, and 71.4% of multimedia are used in tertiary education. Lastly, a slight, non-statistically significant improvement was observed in the perceived usability over the years (p = 0.136, ns) regarding the three categories of educational technology that were investigated.
Nevertheless, it is important to acknowledge that the current study does have certain limitations. For instance, several studies encompassed in this review employed the 16-item questionnaire while others employed the 19-item questionnaire. In addition, the data used in this research were exclusively sourced from Google Scholar. Although Google Scholar is sufficiently comprehensive for conducting systematic reviews on its own [81], it is highly advisable to supplement this study with data from additional databases through further investigation. The number of surveys is quite small for generalization of the results. However, it is a useful and necessary first step for raising awareness and a solid base for future research. An additional hypothesis was formulated, suggesting that the timing of the research aligns with the publication time of each survey.
Furthermore, technology advancements may influence user experience and streamline interactions that could greatly affect perceived usability. These advancements may highlight other dimensions of usability and even alternative conceptions of it. As technology advances and develops, it often introduces novel methods of interacting with digital systems, leading to varied viewpoints on what defines optimal usability. Consequently, designers and developers must remain attentive to evolving user behaviors, preferences, and expectations to design digital systems that genuinely offer usability and benefits to users.
In subsequent studies, it would be intriguing to explore potential variations in PSSUQ/CSUQ scores across cultures or nations. As it occurred from this systematic review, there is need for evaluating perceived usability of educational technology used in primary and secondary education. Shifting research to the lower levels of education will have a multiplier effect on both improving the usability of technology systems and students’ learning gain. Focusing on the lower educational stages the benefits to tertiary education will be clearly greater. Previous research using SUS found that individual characteristics such as personality traits had an impact on perceived usability evaluation of educational technology [82]. It would be useful to examine this relationship using PSSUQ/CSUQ too. Furthermore, it is recommended to explore other factors that may exhibit correlations with the PSSUQ/CSUQ (e.g., ICT competency, gender, prior experience with the system, task success, time on task).

Funding

This research received no external funding.

Conflicts of Interest

The authors declare no conflict of interest.

References

  1. Januszewski, A.; Molenda, M. (Eds.) Educational Technology: A Definition with Commentary; Routledge: New York, NY, USA, 2008; Available online: http://www.aect.org/publications/EducationalTechnology/ (accessed on 2 August 2023).
  2. Huang, R. Educational Technology a Primer for the 21st Century; Springer Nature Singapore Pte Ltd.: Singapore, 2019. [Google Scholar]
  3. Chugh, R.; Turnbull, D.; Cowling, M.A.; Vanderburg, R.; Vanderburg, M.A. Implementing educational technology in Higher Education Institutions: A review of technologies, stakeholder perceptions, frameworks and metrics. Educ. Inf. Technol. 2023, 1–27. [Google Scholar] [CrossRef]
  4. Carver, L.B. Teacher Perception of Barriers and Benefits in K-12 Technology Usage. Turk. Online J. Educ. Technol.-TOJET 2016, 15, 110–116. [Google Scholar] [CrossRef]
  5. Criollo-C, S.; Guerrero-Arias, A.; Jaramillo-Alcázar, Á.; Luján-Mora, S. Mobile Learning Technologies for Education: Benefits and Pending Issues. Appl. Sci. 2021, 11, 4111. [Google Scholar] [CrossRef]
  6. Mathew, I.R.; Ebelelloanya, J. Open and distance learning: Benefits and challenges of technology usage for online teaching and learning in Africa. In Proceedings of the Pan-Commonwealth Forum. Botswana. Commonwealth of Learning and Open University of Malaysia, Kuala Lumpur, Malaysia, 15–30 November 2016. [Google Scholar]
  7. Nikolopoulou, K. Secondary education teachers’ perceptions of mobile phone and tablet use in classrooms: Benefits, constraints and concerns. J. Comput. Educ. 2020, 7, 257–275. [Google Scholar] [CrossRef]
  8. Luschei, T.F. Assessing the Costs and Benefits of Educational Technology. In Handbook of Research on Educational Communications and Technology; Spector, J.M., Merrill, M.D., Elen, J., Bishop, M.J., Eds.; Springer Science+Business Media: New York, NY, USA, 2014; pp. 239–248. [Google Scholar] [CrossRef]
  9. Bajaj, R.; Sharma, V. Smart Education with artificial intelligence based determination of learning styles. Procedia Comput. Sci. 2018, 132, 834–842. [Google Scholar] [CrossRef]
  10. Ha, N.T.T. Effects of learning style on students achievement. Linguist. Cult. Rev. 2021, 5, 329–339. [Google Scholar] [CrossRef]
  11. Alhadreti, O. Assessing Academics’ Perceptions of Blackboard Usability Using SUS and CSUQ: A Case Study during the COVID-19 Pandemic. Int. J. Hum.-Comput. Interact. 2021, 37, 1003–1015. [Google Scholar] [CrossRef]
  12. Nicolaou, C.; Matsiola, M.; Kalliris, G. Technology-enhanced learning and teaching methodologies through audiovisual media. Educ. Sci. 2019, 9, 196. [Google Scholar] [CrossRef]
  13. Wetzel, K.; Buss, R.; Foulger, T.S.; Lindsey, L. Infusing Educational Technology in Teaching Methods Courses: Successes and Dilemmas. J. Digit. Learn. Teach. Educ. 2014, 30, 89–103. [Google Scholar] [CrossRef]
  14. ISO 9241-11; Ergonomic Requirements for Office Work with Visual Display Terminals (VDTs): Part 11: Guidance on Usability. International Organization for Standardization: Geneva, Switzerland, 1998.
  15. Bevan, N.; Carter, J.; Harker, S. ISO 9241-11 revised: What have we learnt about usability since 1998? In Proceedings of the International Conference on Human-Computer Interaction, Bamberg, Germany, 14–18 September 2015; pp. 143–151. [Google Scholar]
  16. Lewis, J.R. The System Usability Scale: Past, Present, and Future. Int. J. Hum.-Comput. Interact. 2018, 34, 577–590. [Google Scholar] [CrossRef]
  17. Alghabban, W.G.; Hendley, R. Perceived Level of Usability as an Evaluation Metric in Adaptive E-learning. SN Comput. Sci. 2022, 3, 238. [Google Scholar] [CrossRef]
  18. Law, E.L.-C.; Heintz, M. Augmented reality applications for K-12 education: A systematic review from the usability and user experience perspective. Int. J. Child-Comput. Interact. 2021, 30, 100321. [Google Scholar] [CrossRef]
  19. Meiselwitz, G.; Sadera, W.A. Investigating the connection between usability and learning outcomes in online learning environments. J. Online Learn. Teach. 2008, 4, 234–242. [Google Scholar]
  20. Orfanou, K.; Tselios, N.; Katsanos, C. Perceived usability evaluation of learning management systems: Empirical evaluation of the System Usability Scale. Int. Rev. Res. Open Distrib. Learn. 2015, 16, 227–246. [Google Scholar] [CrossRef]
  21. Vlachogianni, P.; Tselios, N. The relationship between perceived usability, personality traits and learning gain in an e-learning context. Int. J. Inf. Learn. Technol. 2022, 39, 70–81. [Google Scholar] [CrossRef]
  22. Vlachogianni, P.; Tselios, N. Perceived usability evaluation of educational technology using the System Usability Scale (SUS): A systematic review. J. Res. Technol. Educ. 2021, 54, 392–409. [Google Scholar] [CrossRef]
  23. Berkman, M.I.; Karahoca, D. Re-Assessing the Usability Metric for User Experience (UMUX) Scale. J. Usability Stud. 2016, 11, 89–109. [Google Scholar]
  24. Lewis, J. Psychometric Evaluation of the PSSUQ Using Data from Five Years of Usability Studies. Int. J. Hum.-Comput. Interact. 2002, 14, 463–488. [Google Scholar] [CrossRef]
  25. Hodrien, A.; Fernando, T. A Review of Post-Study and Post-Task Subjective Questionnaires to Guide Assessment of System Usability. J. Usability Stud. 2021, 16, 203–232. [Google Scholar]
  26. Schnall, R.; Cho, H.; Liu, J. Health Information Technology Usability Evaluation Scale (Health-ITUES) for Usability Assessment of Mobile Health Technology: Validation Study. JMIR mHealth uHealth 2018, 6, e4. [Google Scholar] [CrossRef]
  27. Sauro, J.; Lewis, J.R. Quantifying the User Experience: Practical Statistics for User Research. Morgan Kaufmann; Elsevier: Amsterdam, The Netherlands, 2016. [Google Scholar]
  28. Sauro, J. 10 Things to Know About the Post Study System Usability Questionnaire. 2019. Available online: https://measuringu.com/pssuq/ (accessed on 2 August 2023).
  29. Tullis, T.S.; Stetson, J.N. A comparison of questionnaires for assessing website usability. In Usability Professional Association Conference; 2004; Volume 1, Available online: https://citeseerx.ist.psu.edu/viewdoc/download?doi=10.1.1.396.3677&rep=rep1&type=pdf (accessed on 2 August 2023).
  30. García-Peñalvo, F.J.; Vázquez-Ingelmo, A.; García-Holgado, A. Study of the usability of the WYRED Ecosystem using heuristic evaluation. In Learning and Collaboration Technologies. Designing Learning Experiences: 6th International Conference, LCT 2019, Held as Part of the 21st HCI International Conference, HCII 2019, Orlando, FL, USA, 26–31 July 2019, Proceedings, Part I 21; Springer International Publishing: Cham, Switzerland, 2019; pp. 50–63. [Google Scholar] [CrossRef]
  31. Al-Tahat, K.S. Arabic Translation, Cultural Adaptation and Psychometric Validation of the Post-Study System Usability Questionnaire (PSSUQ). Int. J. Hum.-Comput. Interact. 2021, 37, 1815–1822. [Google Scholar] [CrossRef]
  32. Katsanos, C.; Tselios, N.; Liapis, A. PSSUQ-GR: A First Step Towards Standardization of the Post-Study System Usability Questionnaire in Greek. In Proceedings of the CHI Greece 2021: 1st International Conference of the ACM Greek SIGCHI Chapter, Athens, Greece, 25–27 November 2021. [Google Scholar] [CrossRef]
  33. Rosa, A.F.; Martins, A.I.; Costa, V.; Queiros, A.; Silva, A.; Rocha, N.P. European Portuguese validation of the Post-Study System Usability Questionnaire (PSSUQ). In Proceedings of the 2015 10th Iberian Conference on Information Systems and Technologies (CISTI), Aveiro, Portugal, 17–20 June 2015; pp. 1–5. [Google Scholar] [CrossRef]
  34. Erdinç, O.; Lewis, J.R. Psychometric Evaluation of the T-CSUQ: The Turkish Version of the Computer System Usability Questionnaire. Int. J. Hum.-Comput. Interact. 2013, 29, 319–326. [Google Scholar] [CrossRef]
  35. Gronier, G.; Johannsen, L. Proposition d’une adaptation française et premières validations de l’échelle d’utilisabilité Computer System Usability Questionnaire (F-CSUQ) Proposal for a French adaptation and first validations of the Computer System Usability Questionnaire (F-CSUQ). In Proceedings of the 33rd Conference on l’Interaction Humain-Machine, Namur, Belgium, 5–8 April 2022; pp. 1–11. [Google Scholar] [CrossRef]
  36. Aguilar, M.I.H.; González, A.D.l.G.; Miranda, M.P.S.; Villegas, A.A.G. Adaptación al español del Cuestionario de Usabilidad de Sistemas Informáticos CSUQ/Spanish language adaptation of the Computer Systems Usability Questionnaire CSUQ. RECI Rev. Iberoam. De Las Cienc. Comput. E Informática 2015, 4, 84–99. [Google Scholar] [CrossRef]
  37. Sonderegger, A.; Schmutz, S.; Sauer, J. The influence of age in usability testing. Appl. Ergon. 2016, 52, 291–300. [Google Scholar] [CrossRef]
  38. Lewis, J.R. Measuring perceived usability: The CSUQ, SUS, and UMUX. Int. J. Hum.-Comput. Interact. 2018, 34, 1148–1156. [Google Scholar] [CrossRef]
  39. Abd Aziz, A.; Yusoff, N.; Siraj, F. C-Man: Course management assistant. In Master Projects Seminar; Fakulti Teknologi Maklumat, Universiti Utara Malaysia: Kedah, Malaysia, 2006; Unpublished. [Google Scholar]
  40. Ahmad, N.A.N.; Lokman, A.; Ab Hamid, N.I.M. Performing Usability Evaluation on Multi-Platform Based Application for Efficiency, Effectiveness and Satisfaction Enhancement. Int. J. Interact. Mob. Technol. 2021, 15, 103–117. [Google Scholar] [CrossRef]
  41. Alkinani, E.A.; Alzahrani AI, A. Evaluating the Usability and Effectiveness of Madrasati Platforms as a Learning Management System in Saudi Arabia for Public Education. Int. J. Comput. Sci. Netw. Secur. 2021, 21, 275–285. [Google Scholar] [CrossRef]
  42. Hidalgo-Cespedes, J.; Marin-Raventos, G.; Calderon-Campos, M.E. Usability of an Online Judge for Concurrent Programming Education. In Proceedings of the 2021 XVI Latin American Conference on Learning Technologies (LACLO), Arequipa, Peru, 19–21 October 2021; pp. 318–325. [Google Scholar] [CrossRef]
  43. Lai, T.-L.; Chen, P.-Y.; Chou, C.-Y. A user experience study of a web-based formative assessment system. In Proceedings of the 2017 International Conference on Applied System Innovation (ICASI), Sapporo, Japan, 13–17 May 2017; pp. 899–902. [Google Scholar] [CrossRef]
  44. Ma, W.W.A. Usability Test of eHealth Promotion @HKIEd—A Community of Practice Platform to Promote Healthy Lifestyles. Health 2016, 8, 615–622. [Google Scholar] [CrossRef]
  45. McArdle, G. Exploring the Use of 3D Collaborative Interfaces for E-Learning. In Intelligent Systems and Technologies: Methods and Applications; Teodorescu, H.-N., Watada, J., Jain, L.C., Eds.; Springer: Berlin/Heidelberg, Germany, 2009; pp. 249–270. [Google Scholar] [CrossRef]
  46. Pipan, M.; Arh, T.; Blazic, B.J. Evaluation cycle management-model for selection of the most applicable learning management system. WSEAS Trans. Adv. Eng. Educ. 2008, 3, 129–136. [Google Scholar]
  47. Punjabi, D.M.; Tung, L.P.; Lin, B.S. CrowdSMILE: A Crowdsourcing-Based Social and Mobile Integrated System for Learning by Exploration. In Proceedings of the IEEE 10th International Conference on Ubiquitous Intelligence and Computing, UIC 2013 and IEEE 10th International Conference on Autonomic and Trusted Computing, ATC 2013, Vietri sul Mare, Italy, 18–21 December 2013; pp. 521–526. [Google Scholar] [CrossRef]
  48. Setiyawan, A. Assignment and Monitoring Information System of Prakerin Students Based On SMS Gateway with Raspberry Pi. VANOS J. Mech. Eng. Educ. 2020, 5, 19–30. [Google Scholar]
  49. Zapata, A.; Menéndez, V.; Prieto, M.; Romero, C. A framework for recommendation in learning object repositories: An example of application in civil engineering. Adv. Eng. Softw. 2012, 56, 1–14. [Google Scholar] [CrossRef]
  50. Zhang, Y.; Zhao, C.; Liu, G.; Han, T. Cross-Platform Product Usability and Large Screen User Experience: A Teleconference System U&E Research. In Design, User Experience, and Usability. User Experience Design Practice; Marcus, A., Ed.; Springer International Publishing: Cham, Switzerland, 2014; Volume 8520, pp. 469–479. [Google Scholar] [CrossRef]
  51. Utami, I.Q.; Fakhruzzaman, M.N.; Fahmiyah, I.; Masduki, A.N.; Kamil, I.A. Customized moodle-based learning management system for socially disadvantaged schools. Bull. Electr. Eng. Inform. 2021, 10, 3325–3332. [Google Scholar] [CrossRef]
  52. Oliha, F.O. Web portal usability among Nigerian university students: A case study of University of Benin, Nigeria. Niger. J. Technol. 2014, 33, 199–206. [Google Scholar] [CrossRef]
  53. Ikhsanuddin, N.; Santi, R.; Putri, U.M. Usability Analysis of Higher Education Information Systems (SIDIKTI) at Sjakhyakirti University Using Post-Study System Usability Questionnaire (PSSUQ). J. Comput. Sci. Inf. Technol. 2022, 14, 22–26. [Google Scholar] [CrossRef]
  54. Phongphaew, N.; Jiamsanguanwong, A. The usability evaluation concerning emotional responses of users on learning management system. In Proceedings of the 2016 6th International Workshop on Computer Science and Engineering, Tokyo, Japan, 17–19 June 2016; pp. 43–48. [Google Scholar]
  55. Bhakti, D.D.; Putri, S.M.; Nasrulloh, I.; Tetep; Nurkamilah, S. The development of ppdb (admission of new students) application to develop the quality of new students’ recapitulation administration in vocational high school bumi cikajang. J. Phys. Conf. Ser. 2019, 1280, 032041. [Google Scholar] [CrossRef]
  56. Gannon, B.; Davis, R.; Kuhns, L.M.; Rodriguez, R.G.; Garofalo, R.; Schnall, R. A Mobile Sexual Health App on Empowerment, Education, and Prevention for Young Adult Men (MyPEEPS Mobile): Acceptability and Usability Evaluation. JMIR Form. Res. 2020, 4, e17901. [Google Scholar] [CrossRef] [PubMed]
  57. Kopetz, J.P.; Wessel, D.; Jochems, N. User-Centered Development of Smart Glasses Support for Skills Training in Nursing Education. I-Com 2019, 18, 287–299. [Google Scholar] [CrossRef]
  58. Tolle, H.; Hafis, M.; Afif, A.; Arai, K. Perceived Usability of Educational Chemistry Game Gathered via CSUQ Usability Testing in Indonesian High School Students. Int. J. Adv. Comput. Sci. Appl. 2020, 11, 715–724. [Google Scholar] [CrossRef]
  59. Zhang, M.; Hou, G.; Chen, Y.-C. Effects of interface layout design on mobile learning efficiency: A comparison of interface layouts for mobile learning platform. Libr. Hi Tech. 2022. ahead-of-print. [Google Scholar] [CrossRef]
  60. Carrión-Toro, M.; Santorum, M.; Acosta-Vargas, P.; Aguilar, J.; Pérez, M. iPlus a user-centered methodology for serious games design. Appl. Sci. 2020, 10, 9007. [Google Scholar] [CrossRef]
  61. Koowuttayakorn, S.; Taylor, P. Usability and Motivation Study of Mobile Application for English Language Proficiency Test Preparation in Thailand: A Case Study of TU-GET CBT. LEARN J. Lang. Educ. Acquis. Res. Netw. 2022, 15, 625–648. [Google Scholar]
  62. Biabdillah, F.; Tolle, H.; Bachtiar, F.A. Go Story: Design and Evaluation Educational Mobile Learning Podcast using Human Centered Design Method and Gamification for History. J. Inf. Technol. Comput. Sci. 2021, 6, 308–318. [Google Scholar] [CrossRef]
  63. Yi, M.; Bao, D.; Mo, Y. Exploring the role of visual design in digital public health safety education. Int. J. Environ. Res. Public Health 2021, 18, 7965. [Google Scholar] [CrossRef] [PubMed]
  64. Chiang, V.C.L.; Choi, T.K.S.; Ching, S.S.Y.; Leung, K.L.K. Evaluation of a virtual reality based interactive simulator with haptic feedback for learning NGT placement. J. Probl. Learn. 2017, 4, 25–34. [Google Scholar] [CrossRef]
  65. Liu, Z.; Jin, Y.; Ma, M.; Li, J. A Comparison of Immersive and Non-Immersive VR for the Education of Filmmaking. Int. J. Human-Comput. Interact. 2022, 39, 2478–2491. [Google Scholar] [CrossRef]
  66. Mallam, S.C.; Lundh, M.; MacKinnon, S.N. Evaluating a digital ship design tool prototype: Designers’ perceptions of novel ergonomics software. Appl. Ergon. 2017, 59, 19–26. [Google Scholar] [CrossRef]
  67. Santana, R.; Rossi, G.; Rybarczyk, Y.; Méndez, G.G.; Vera, F.; Rodríguez, A.; Mendoza, P. Studying the User Experience of an Educational AR-Based App for Smart Glasses. In Information Systems and Technologies; Rocha, A., Adeli, H., Dzemyda, G., Moreira, F., Eds.; Springer International Publishing: Cham, Switzerland, 2022; pp. 266–275. [Google Scholar] [CrossRef]
  68. Zulkifli, A.N.; Mohamed NF, F.; Qasim, M.M.; Bakar, N.A.A. Prototyping and Usability Evaluation of Road Safety Education Courseware for Primary Schools in Malaysia. Int. J. Interact. Mob. Technol. 2021, 15, 32–47. [Google Scholar] [CrossRef]
  69. Hamdan, M.N.; Ali, A.Z.M. User Satisfaction of Non-Realistic Three-Dimensional Talking-Head Animation Courseware (3D-NR). Int. J. E-Educ. E-Bus. E-Manag. E-Learn. 2015, 5, 23–30. [Google Scholar] [CrossRef]
  70. Saidon, Z.L.; Safian, A.R.; Nasrifan, M.N. Usability Evaluation of a Virtual Reality Interactive Music Appreciation Module (E-Marz) for Secondary School. Int. J. Acad. Res. Progress. Educ. Dev. 2021, 10, 923–937. [Google Scholar] [CrossRef]
  71. Benaida, M.; Namoun, A. An Exploratory Study of the Factors Affecting the Perceived Usability of Algerian Educational Websites. Turk. Online J. Educ. Technol. 2018, 17, 1–12. [Google Scholar]
  72. Biery, N.; Bond, W.; Smith, A.B.; LeClair, M.; Foster, E. Using Telemedicine Technology to Assess Physician Outpatient Teaching. Fam. Med. 2015, 47, 807–810. [Google Scholar] [PubMed]
  73. Maragos, K. Web based Adaptive Educational Games-Exploitation in Computer Science Education. Ph.D. Thesis, National and Kapodistrian University of Athens, Athens, Grace, 2013. Available online: https://www.di.uoa.gr/sites/default/files/documents/grad/phdbook2012_compressed.pdf#page=81 (accessed on 2 August 2023).
  74. Wu, P.-F.; Fan, K.-Y.; Liao, Y.-T. Developing and assessing the usability of digital manipulative storytelling system for school-age children. In Proceedings of the 2016 3rd International Conference on Systems and Informatics (ICSAI), Shanghai, China, 19–21 November 2016; pp. 465–470. [Google Scholar] [CrossRef]
  75. Zapata, A.; Menéndez, V.H.; Prieto, M.E.; Romero, C. Evaluation and selection of group recommendation strategies for collaborative searching of learning objects. Int. J. Hum.-Comput. Stud. 2015, 76, 22–39. [Google Scholar] [CrossRef]
  76. Calleros, C.B.G.; García, J.G.; Rangel, Y.N. UvaMate, a serious game for learning mathematics for children with ADHD: Usability evaluation. Rev. Colomb. Comput. 2020, 21, 20–34. [Google Scholar] [CrossRef]
  77. Vázquez, S.R.; O’Brien, S.; Fitzpatrick, D. Usability of web-based MT post-editing environments for screen reader users. In Proceedings of the Machine Translation Summit XVI: Commercial MT Users and Translators Track, Nagoya, Japan, 18–22 September 2017; pp. 13–25. [Google Scholar]
  78. Bangor, A.; Kortum, P.; Miller, J. Determining what individual SUS scores mean: Adding an adjective rating scale. J. Usability Stud. 2009, 4, 114–123. [Google Scholar]
  79. Brooke, J. SUS: A retrospective. J. Usability Stud. 2013, 8, 29–40. [Google Scholar]
  80. Sauro, J. Measuring Usability with System Usability Scale (SUS). 2011. Available online: https://measuringu.com/sus (accessed on 2 August 2023).
  81. Gehanno, J.F.; Rollin, L.; Darmoni, S. Is the coverage of Google Scholar enough to be used alone for systematic reviews. BMC Med. Inform. Decis. Mak. 2013, 13, 1–5. [Google Scholar] [CrossRef]
  82. Vlachogianni, P.; Tselios, N. Investigating the impact of personality traits on perceived usability evaluation of e-learning platforms. Interact. Technol. Smart Educ. 2022, 19, 202–221. [Google Scholar] [CrossRef]
Figure 1. PRISMA 2020 flow diagram.
Sustainability 15 12954 g001
Figure 2. PSSUQ/CSUQ score over time.
Sustainability 15 12954 g002
Table 1. A summary of the analyzed papers.
Internet Platforms (LMS, MOOC, Wiki, etc.)Mobile ApplicationsMultimediaResearch Papers Documenting Studies That Do Not Fall within the Aforementioned Categories of Educational Technology Systems
[11,30,39,40,41,42,43,44,45,46,47,48,49,50,51,52,53,54][5,55,56,57,58,59,60,61,62,63] [64,65,66,67,68,69,70][71,72,73,74,75,76,77]
Table 2. The mean PSSUQ/CSUQ scores for the three categories of educational technology.
CategoryNMean PSSUQ/CSUQ ScoreSD
Internet Platforms (LMS, MOOC, wiki, etc.)2173.237.74
Mobile applications1281.5312.61
Multimedia873.8919.69
Table 3. PSSUQ/CSUQ scores for each of the variables examined (** indicate significance at 0.01 level).
Age of ParticipantsLearning ObjectEducational StageParticipant TypeParticipant Count
PSSUQ/CSUQ score p = 0.266p = 0.174p = 0.01 **p = 0.005 **p = 0.122
Table 4. The category of educational technology and educational stage.
CategoryNPrimary EducationSecondary EducationHigher Education
Internet Platforms (LMS, MOOC, wiki, etc.)13 15.4%84.6%
Mobile applications 9 44.4%55.6%
Multimedia714.3%14.3%71.4%
Disclaimer/Publisher’s Note: The statements, opinions and data contained in all publications are solely those of the individual author(s) and contributor(s) and not of MDPI and/or the editor(s). MDPI and/or the editor(s) disclaim responsibility for any injury to people or property resulting from any ideas, methods, instructions or products referred to in the content.

