
Coupling Computational Fluid Dynamics and EnergyPlus to Optimize Energy Consumption and Comfort in Air Column Ventilation at a Tall High-Speed Rail Station


Abstract
:1. Introduction
2. Methodology
2.1. Description of EnergyPlus and Fluent
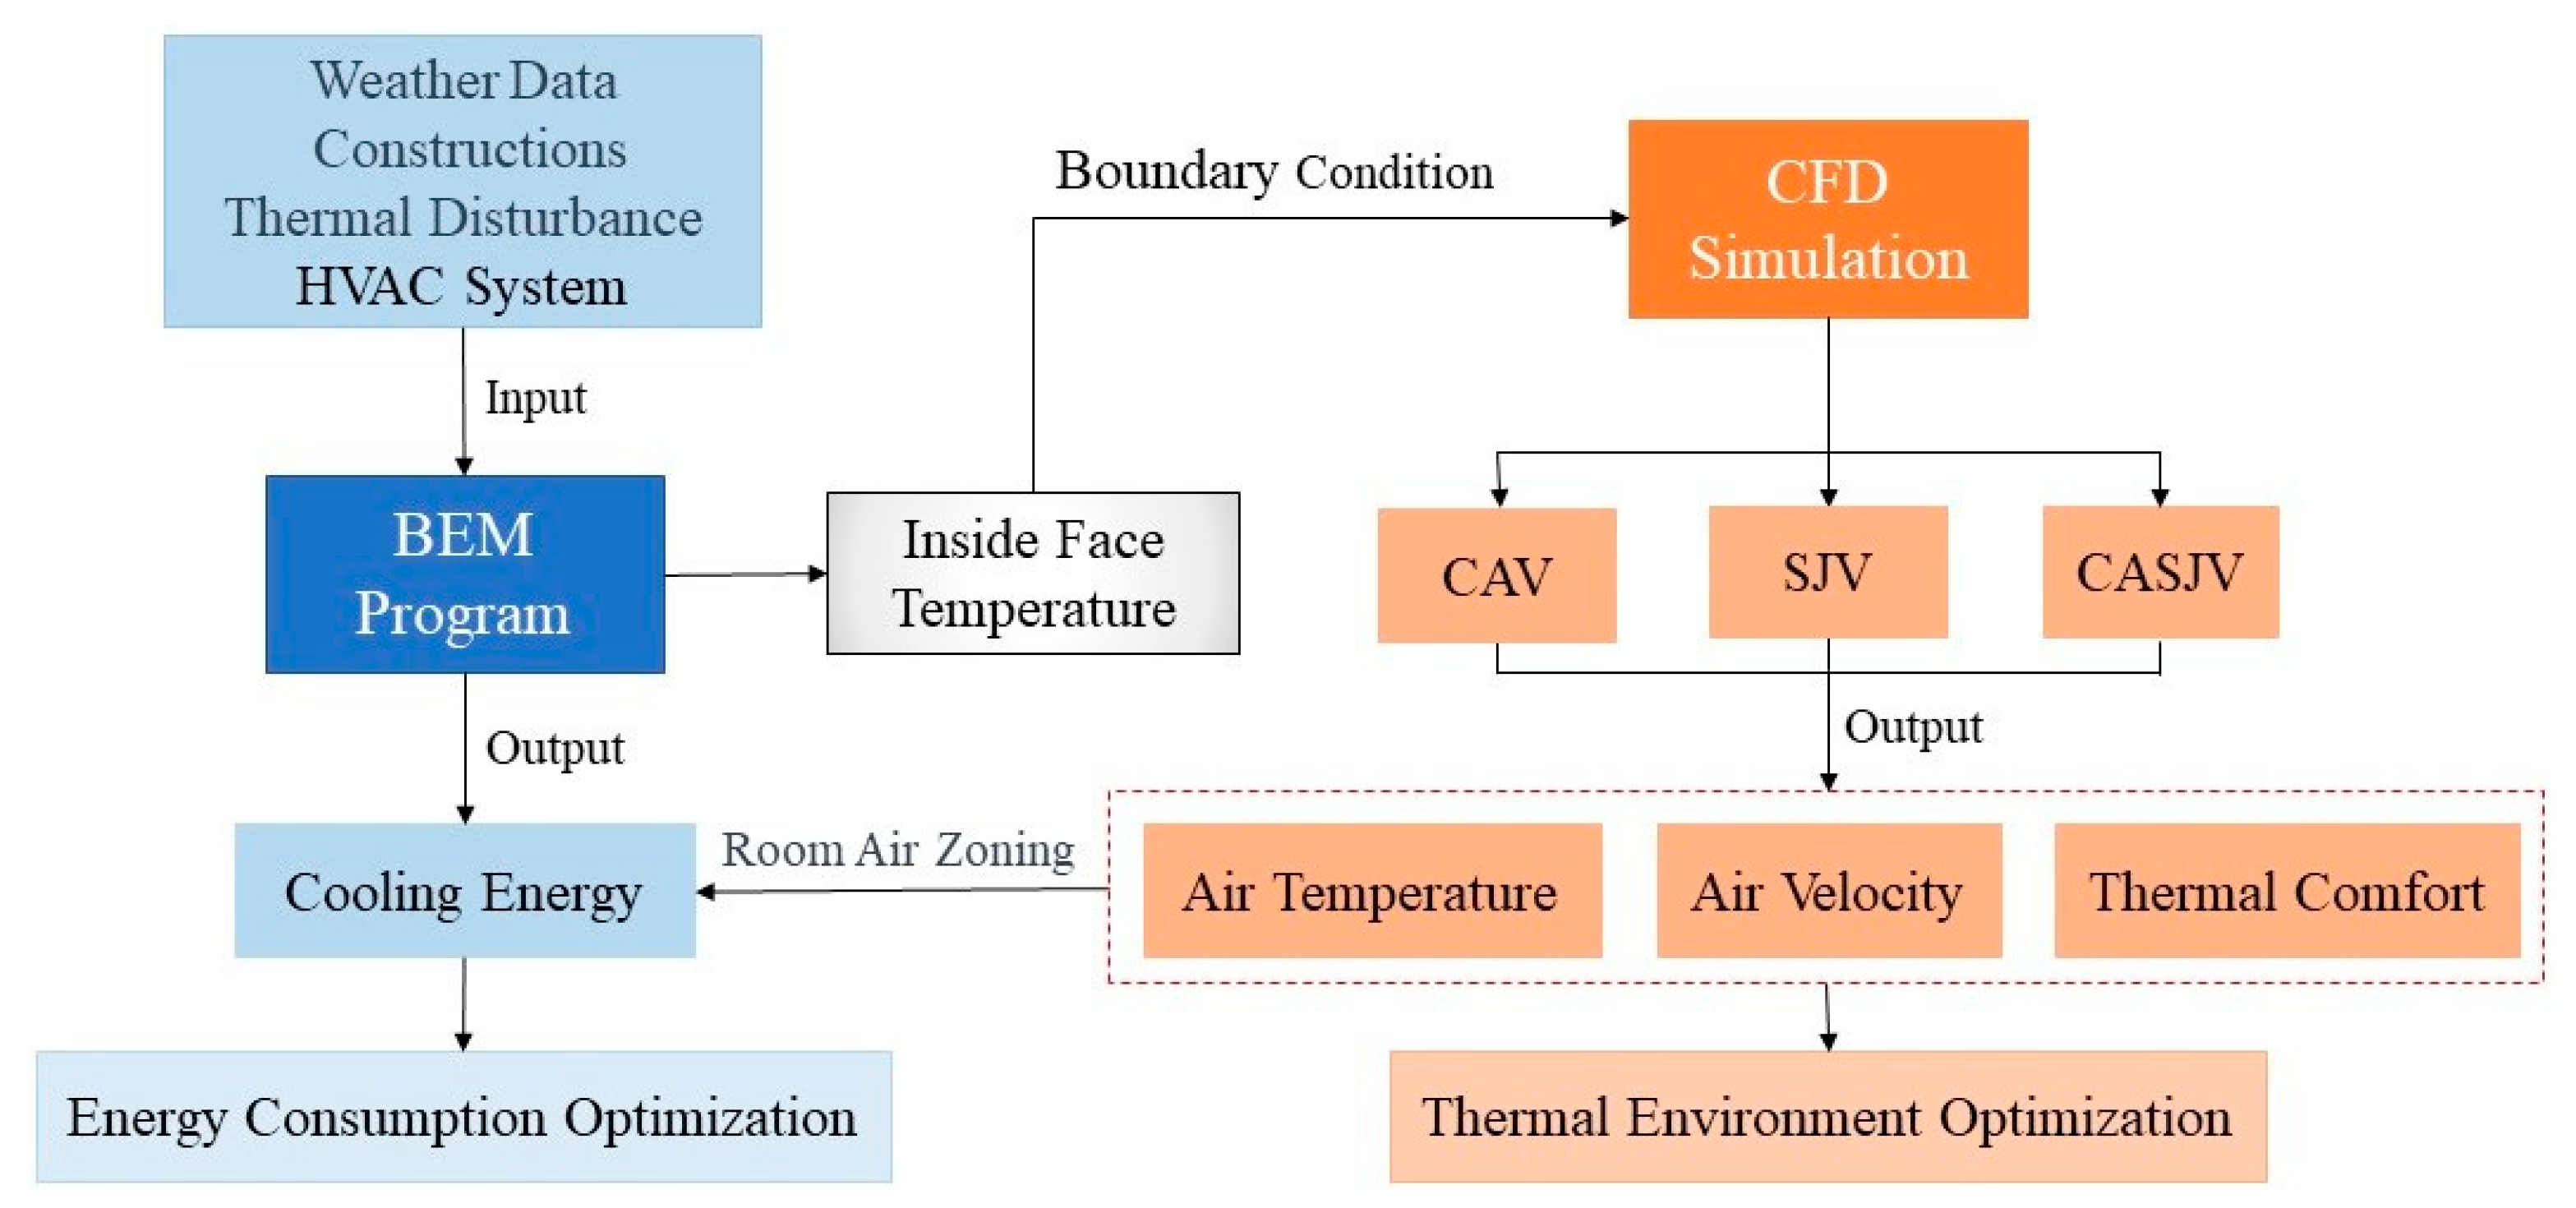
2.2. Coupling Framework of BEM and CFD Programs
2.3. Thermal Comfort Indicators
3. Simulation Case Study
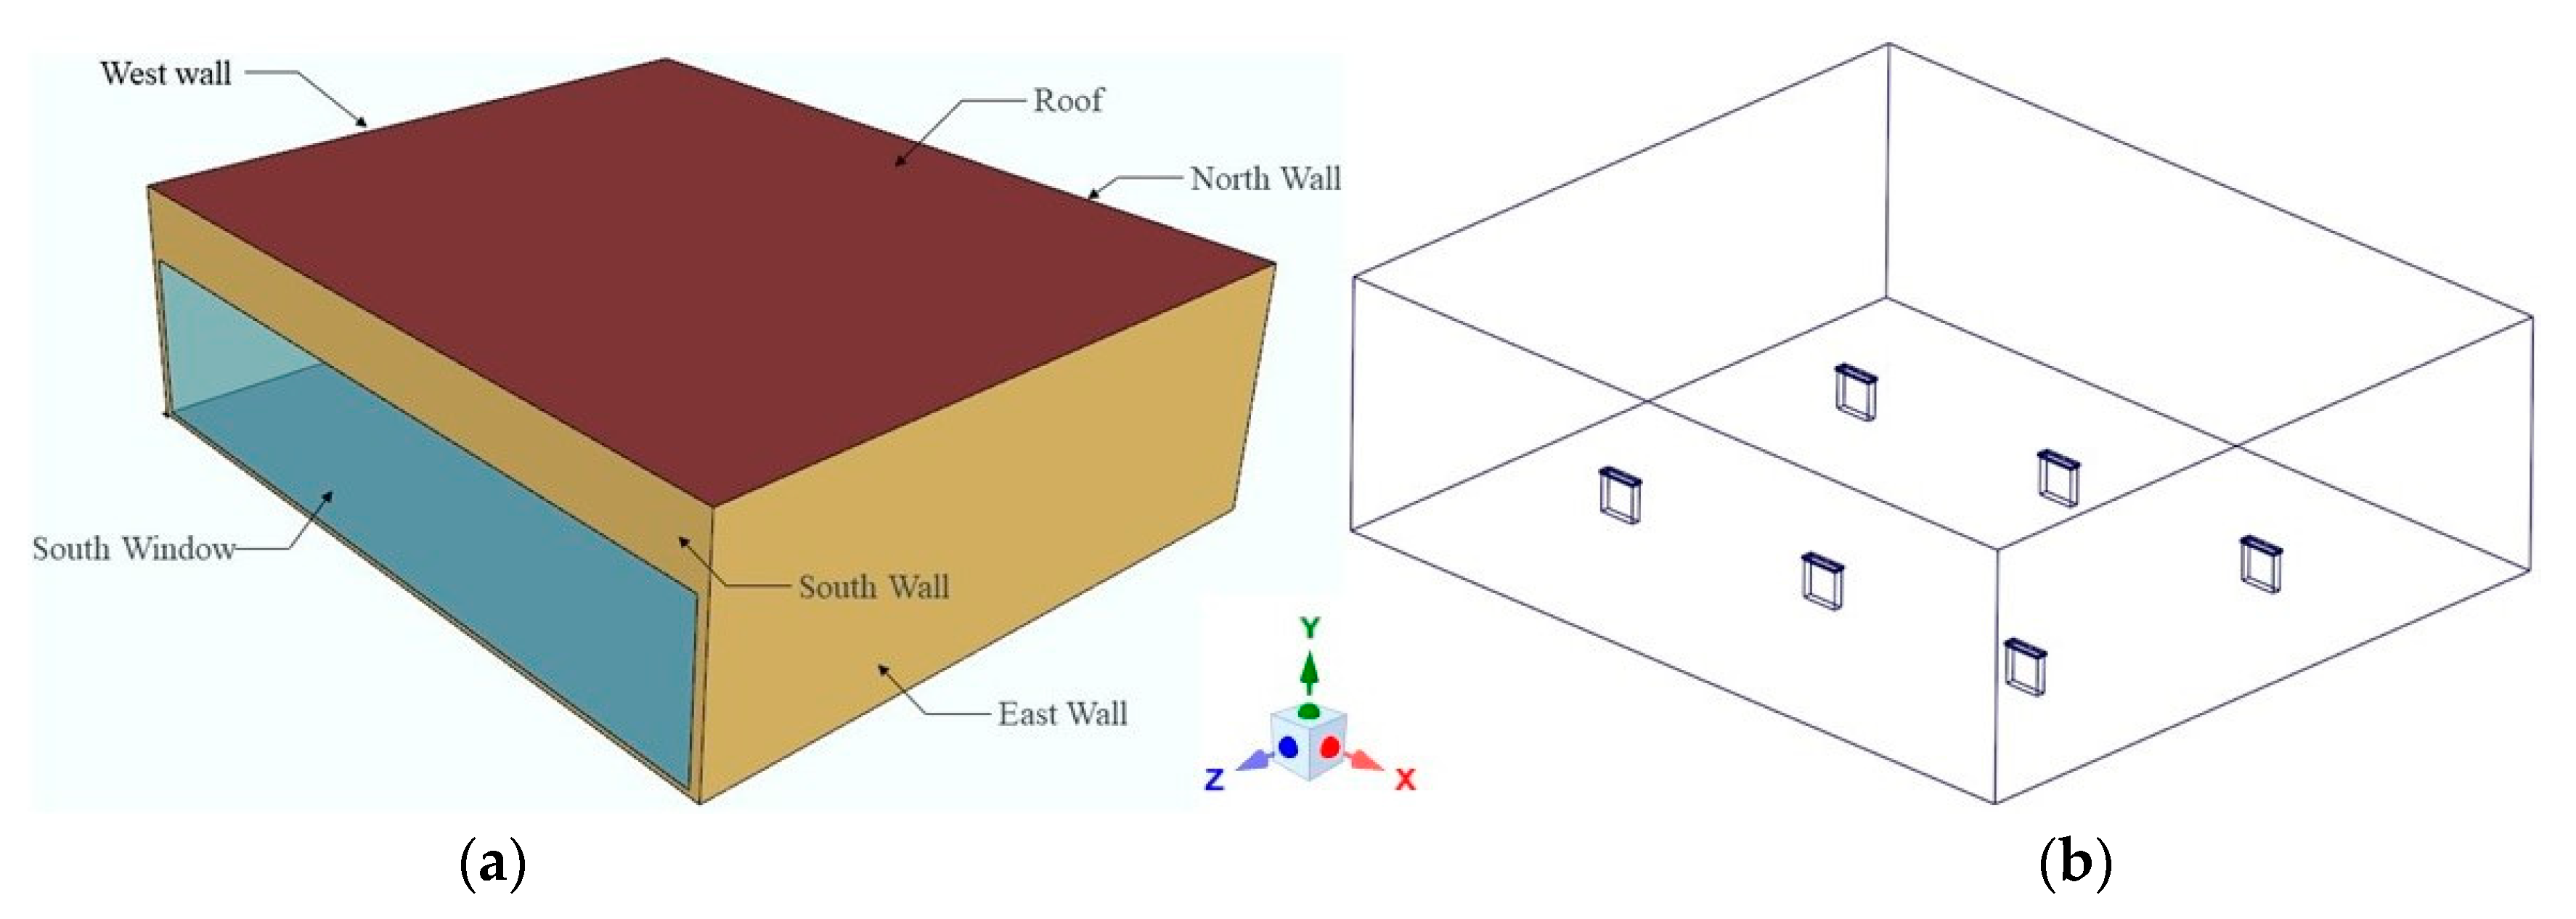
3.1. Description of the Building
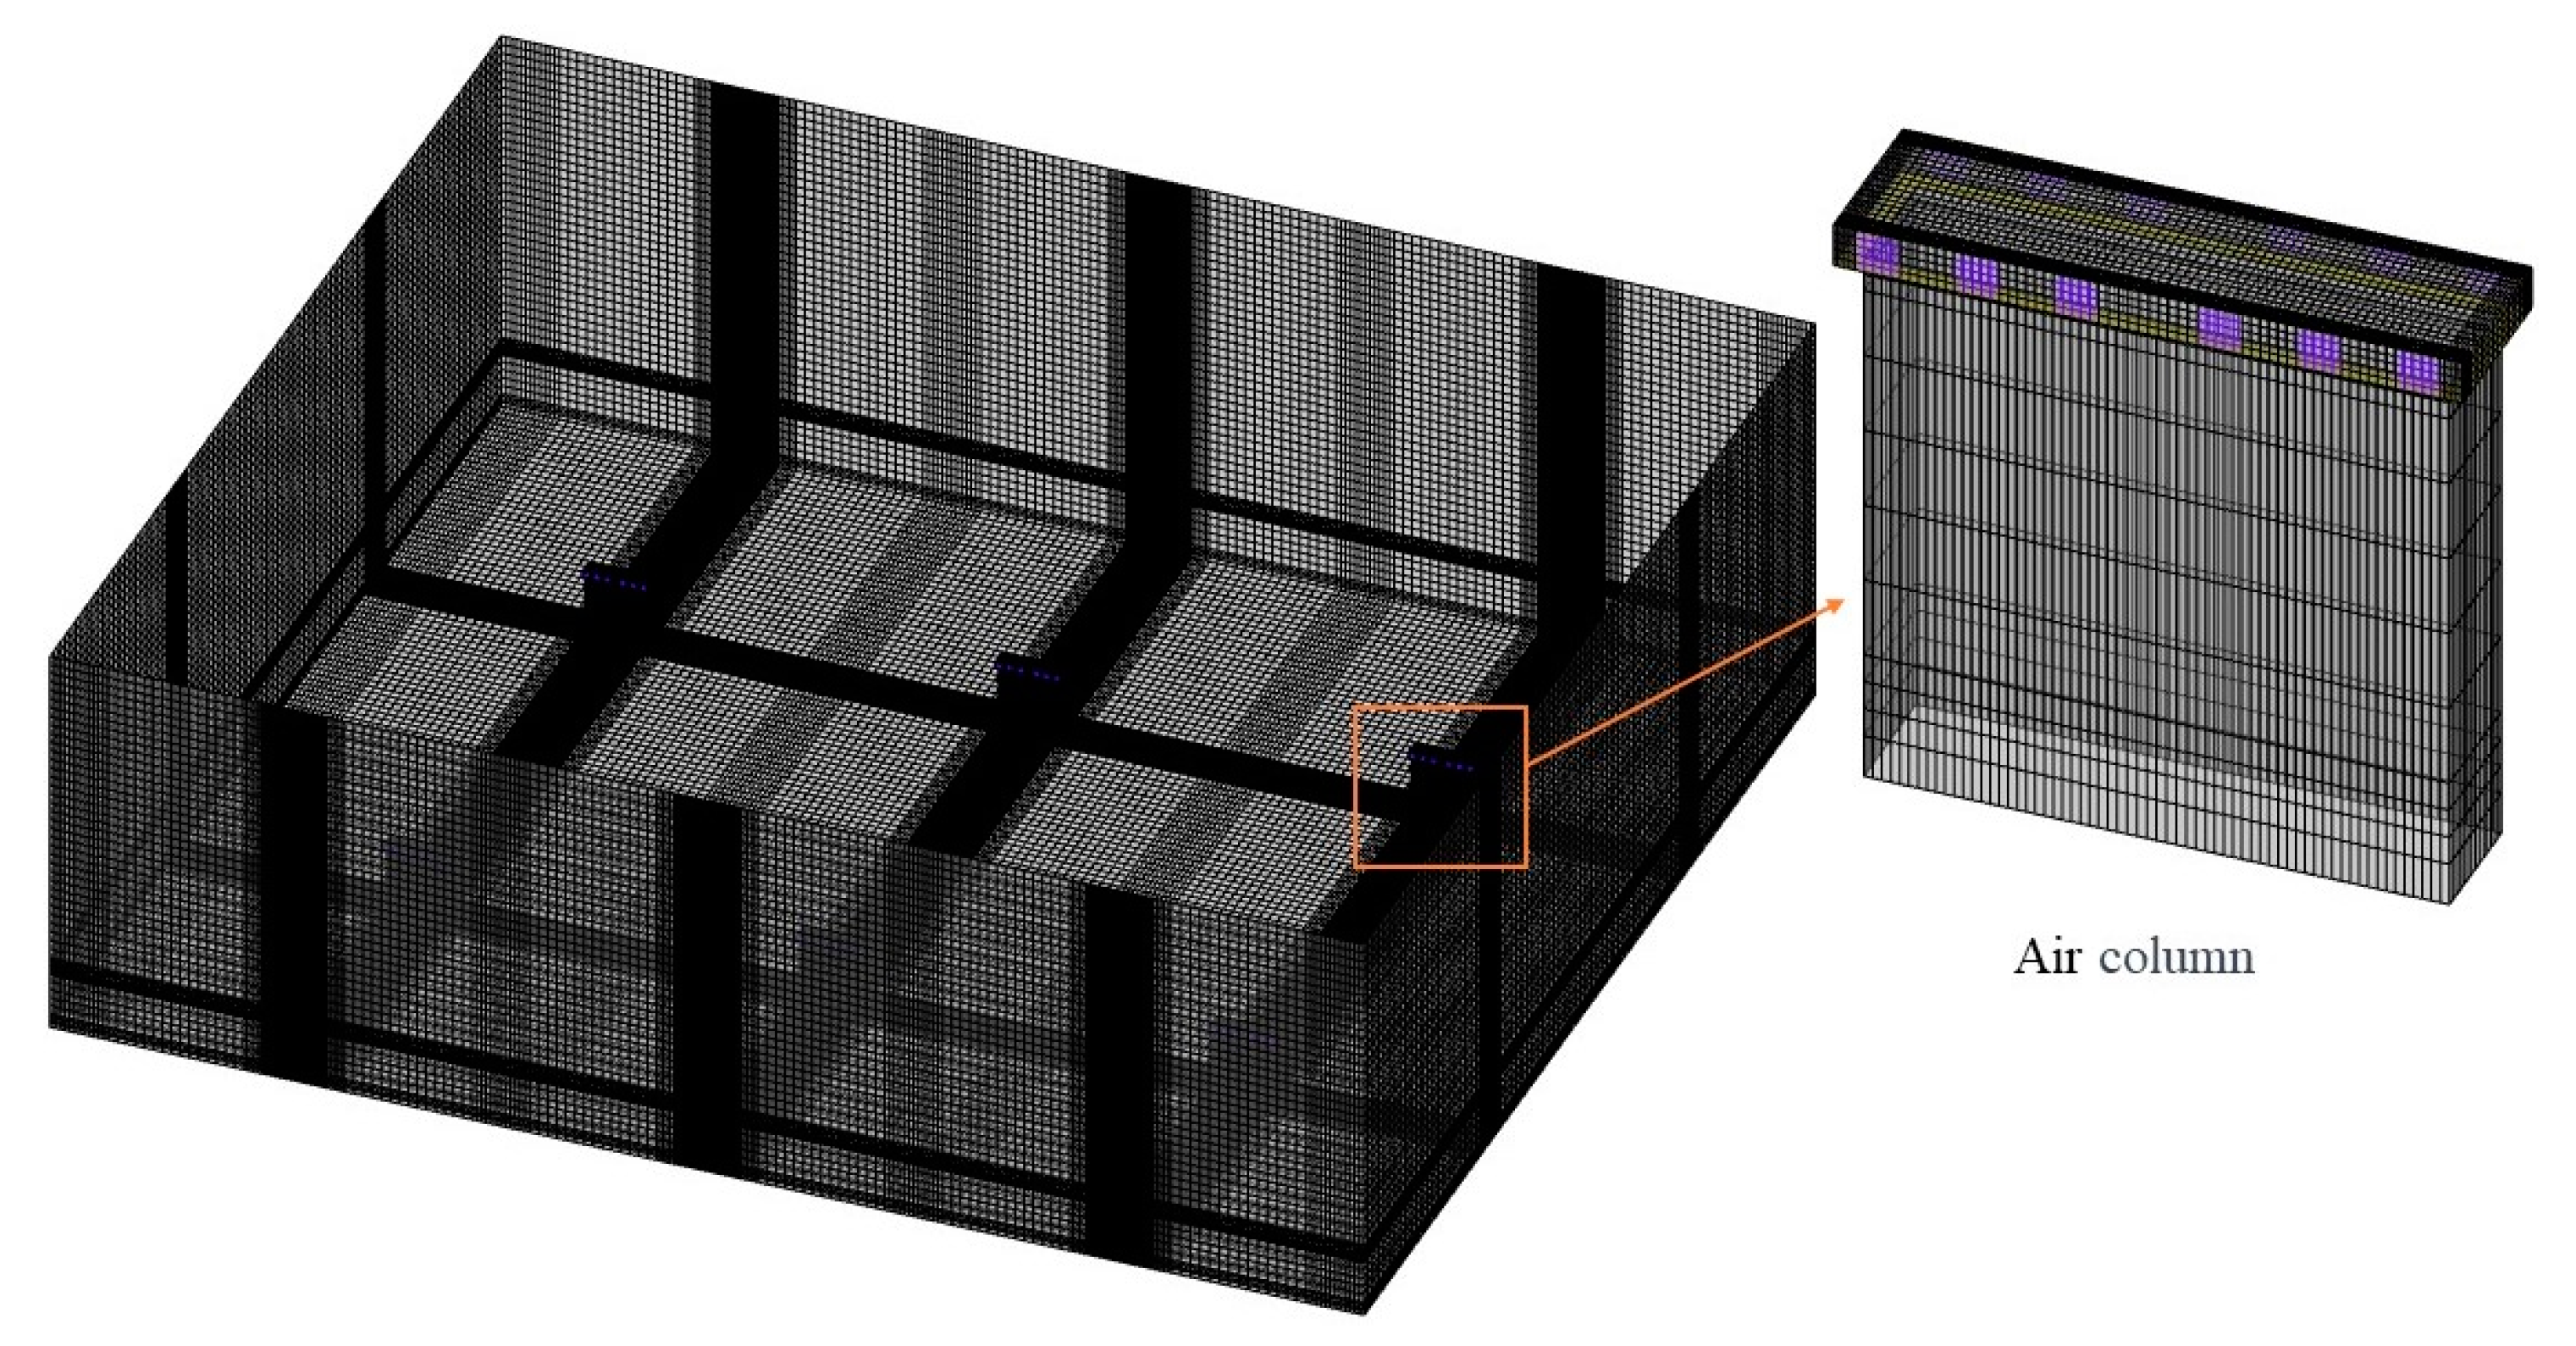
3.2. CFD Modeling
3.2.1. Numerical Process
3.2.2. Boundary Conditions and Settings
3.2.3. Validation
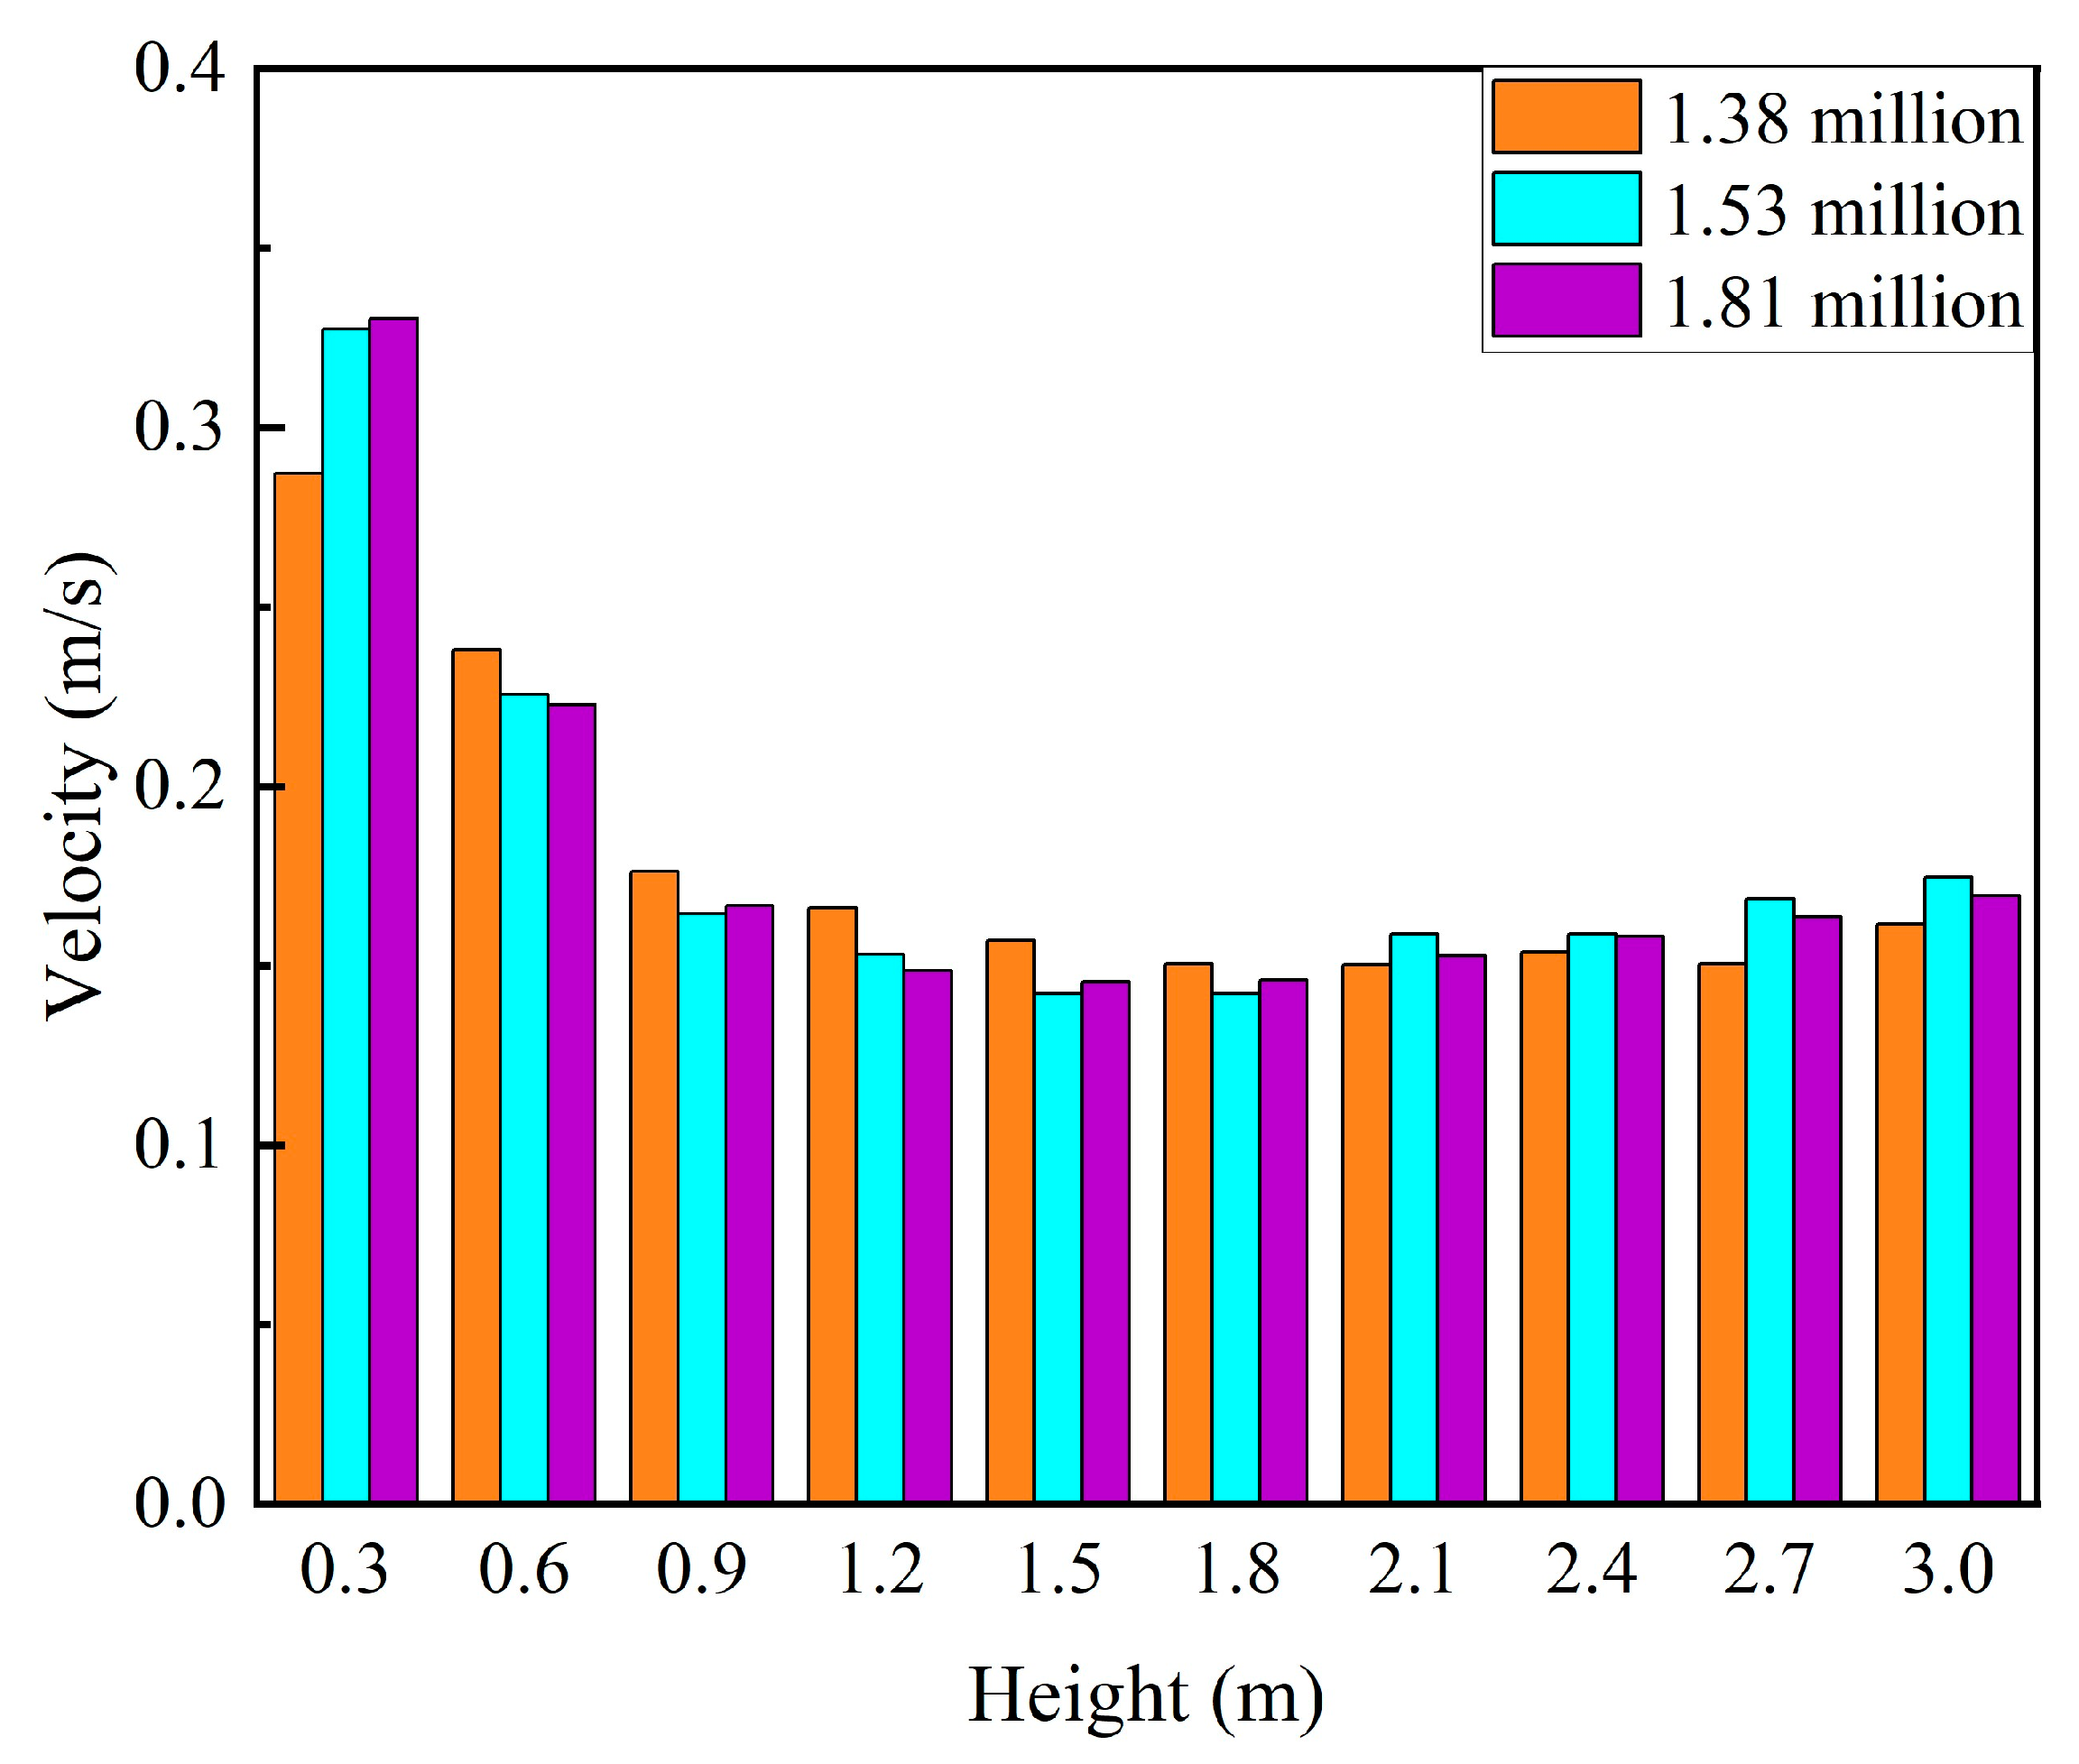
- (1)
- Grid-independence validation
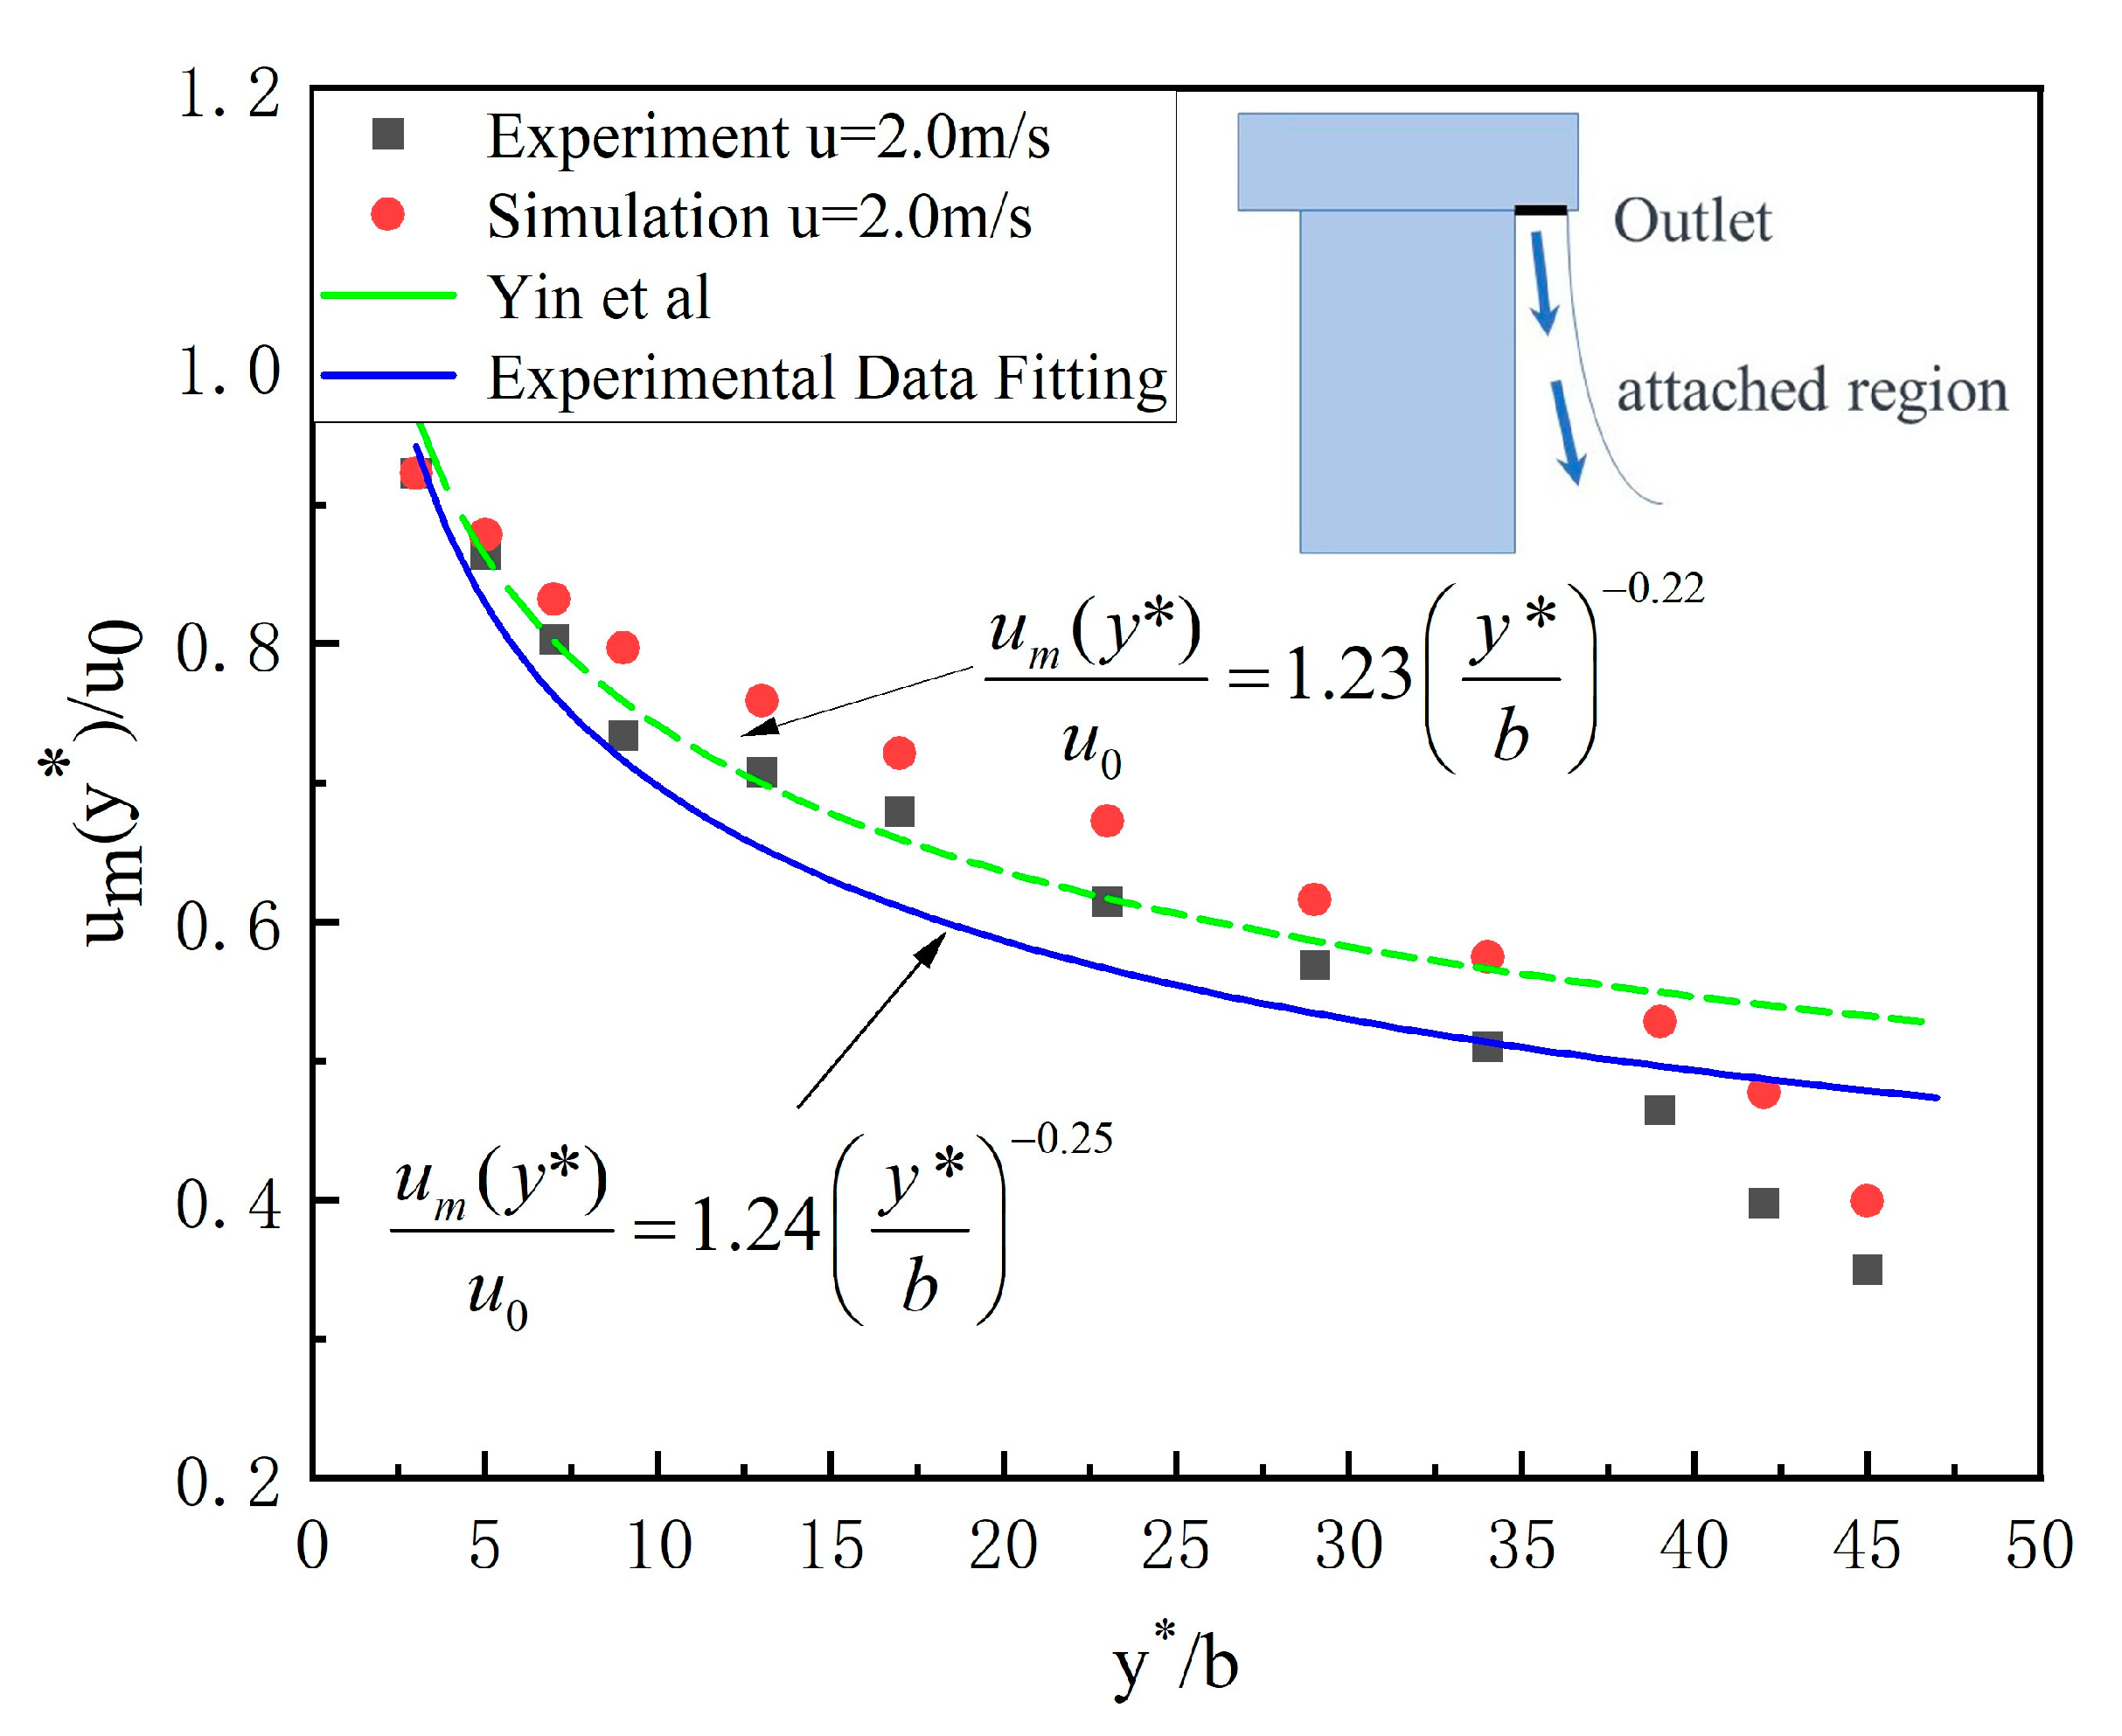
- (2)
- Numerical model validation
3.2.4. Scenario Selection
3.3. Zone Division in Large Space
4. Results and Discussion
4.1. Air Distribution
4.2. Thermal Comfort of Personnel in the Activity Area
- (1)
- Overall evaluation
- (2)
- Local evaluation
4.3. Cooling Energy
5. Conclusions
- (1)
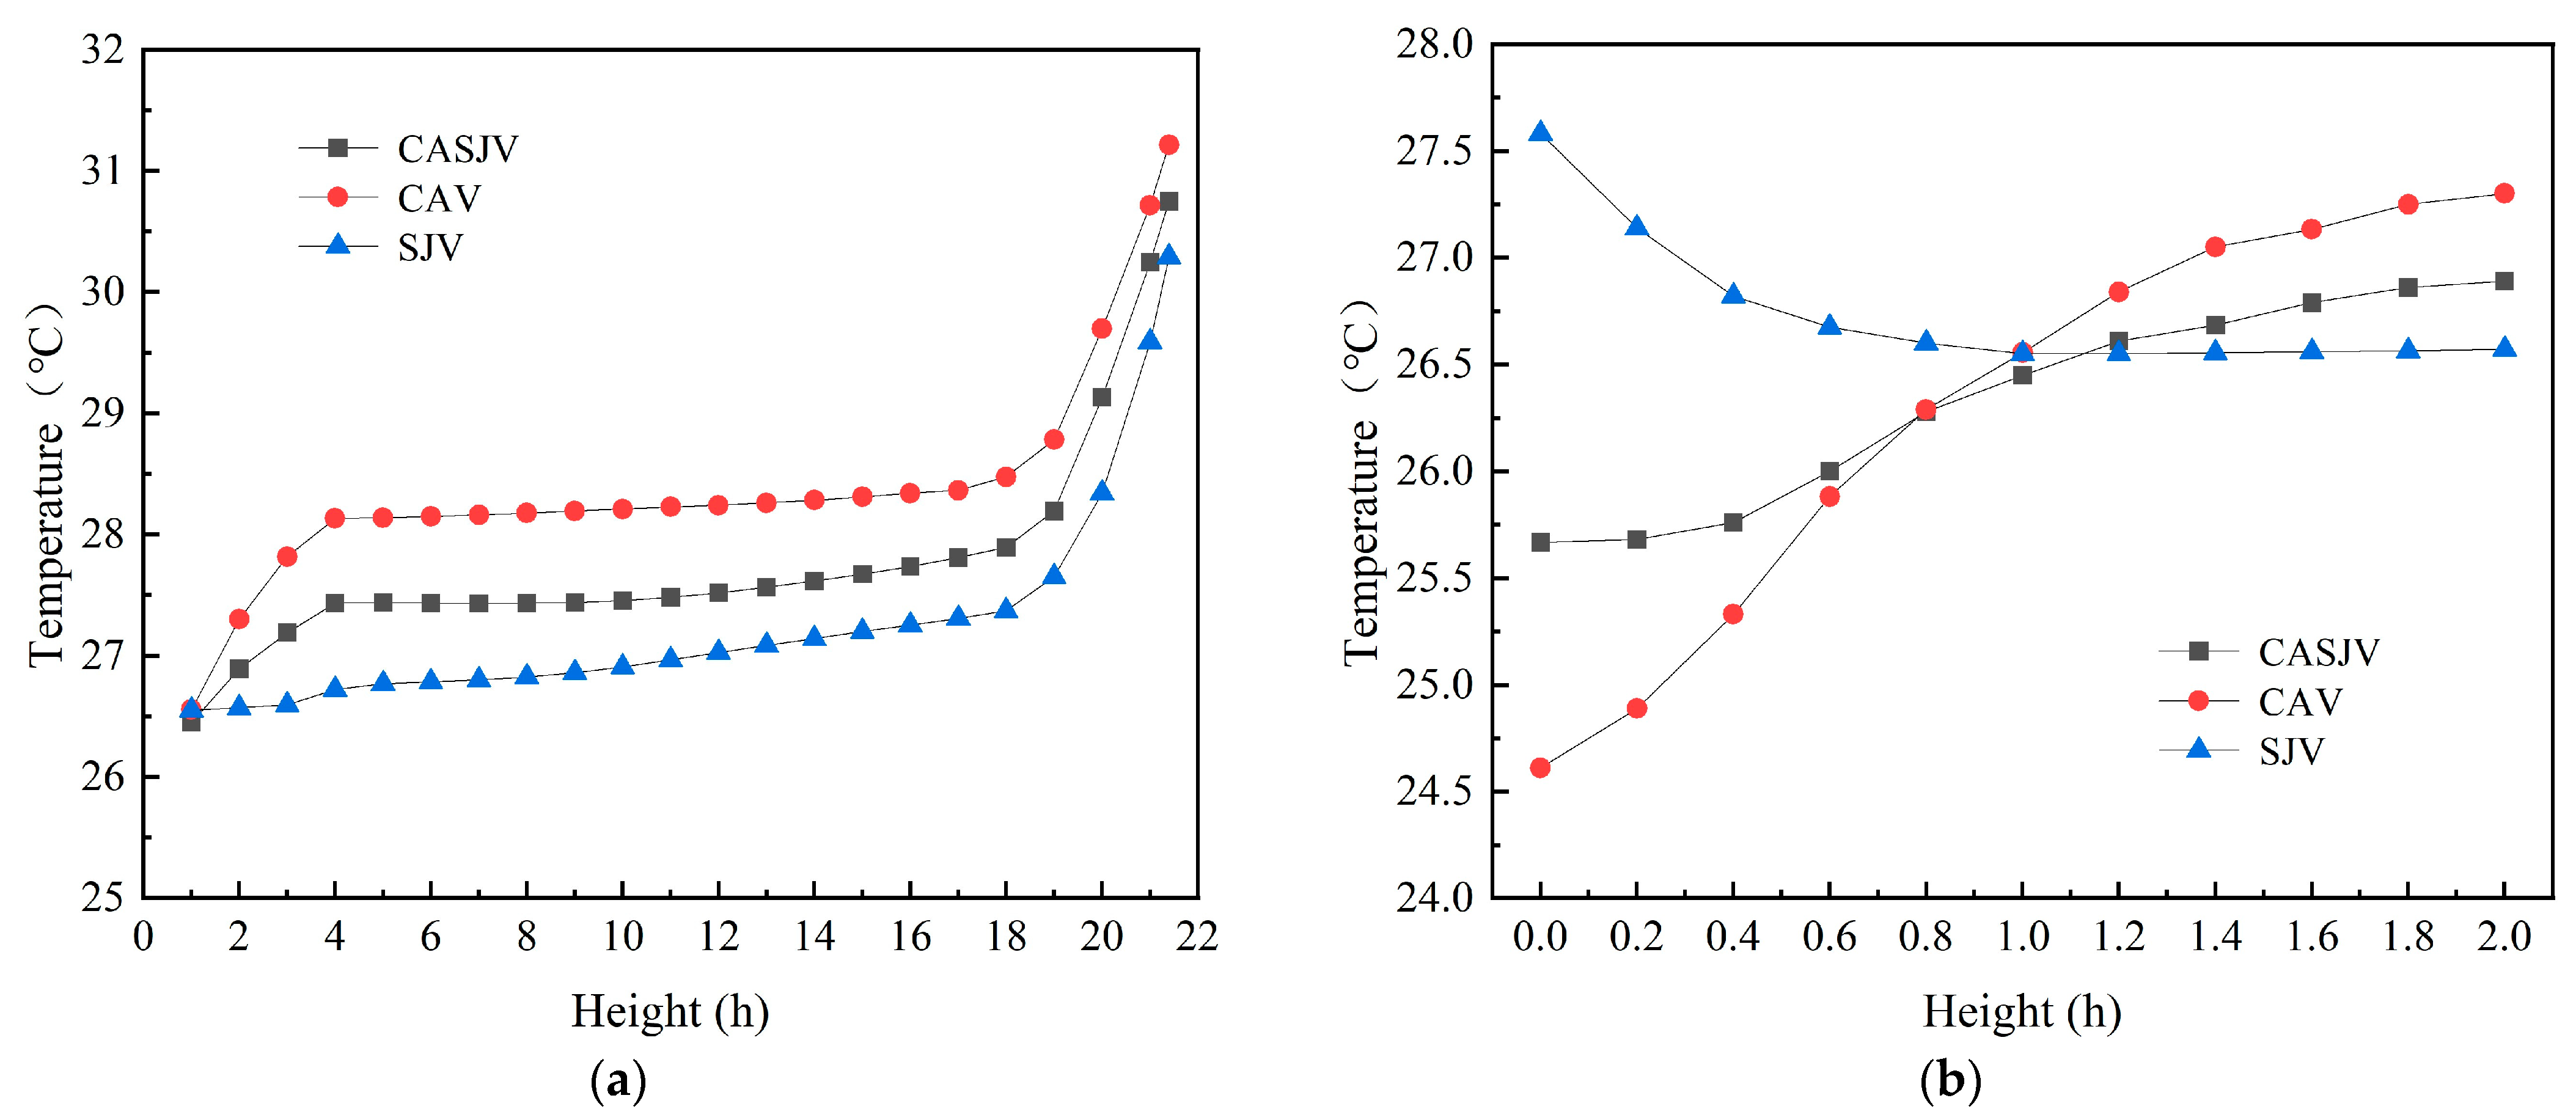
- The summer waiting hall exhibits notable thermal stratification. In comparison to the CAV and SJV, the CASJV proves to be effective in actively circulating and blending air within the occupied area. As a result, the CASJV creates a more comfortable environment for passengers.
- (2)
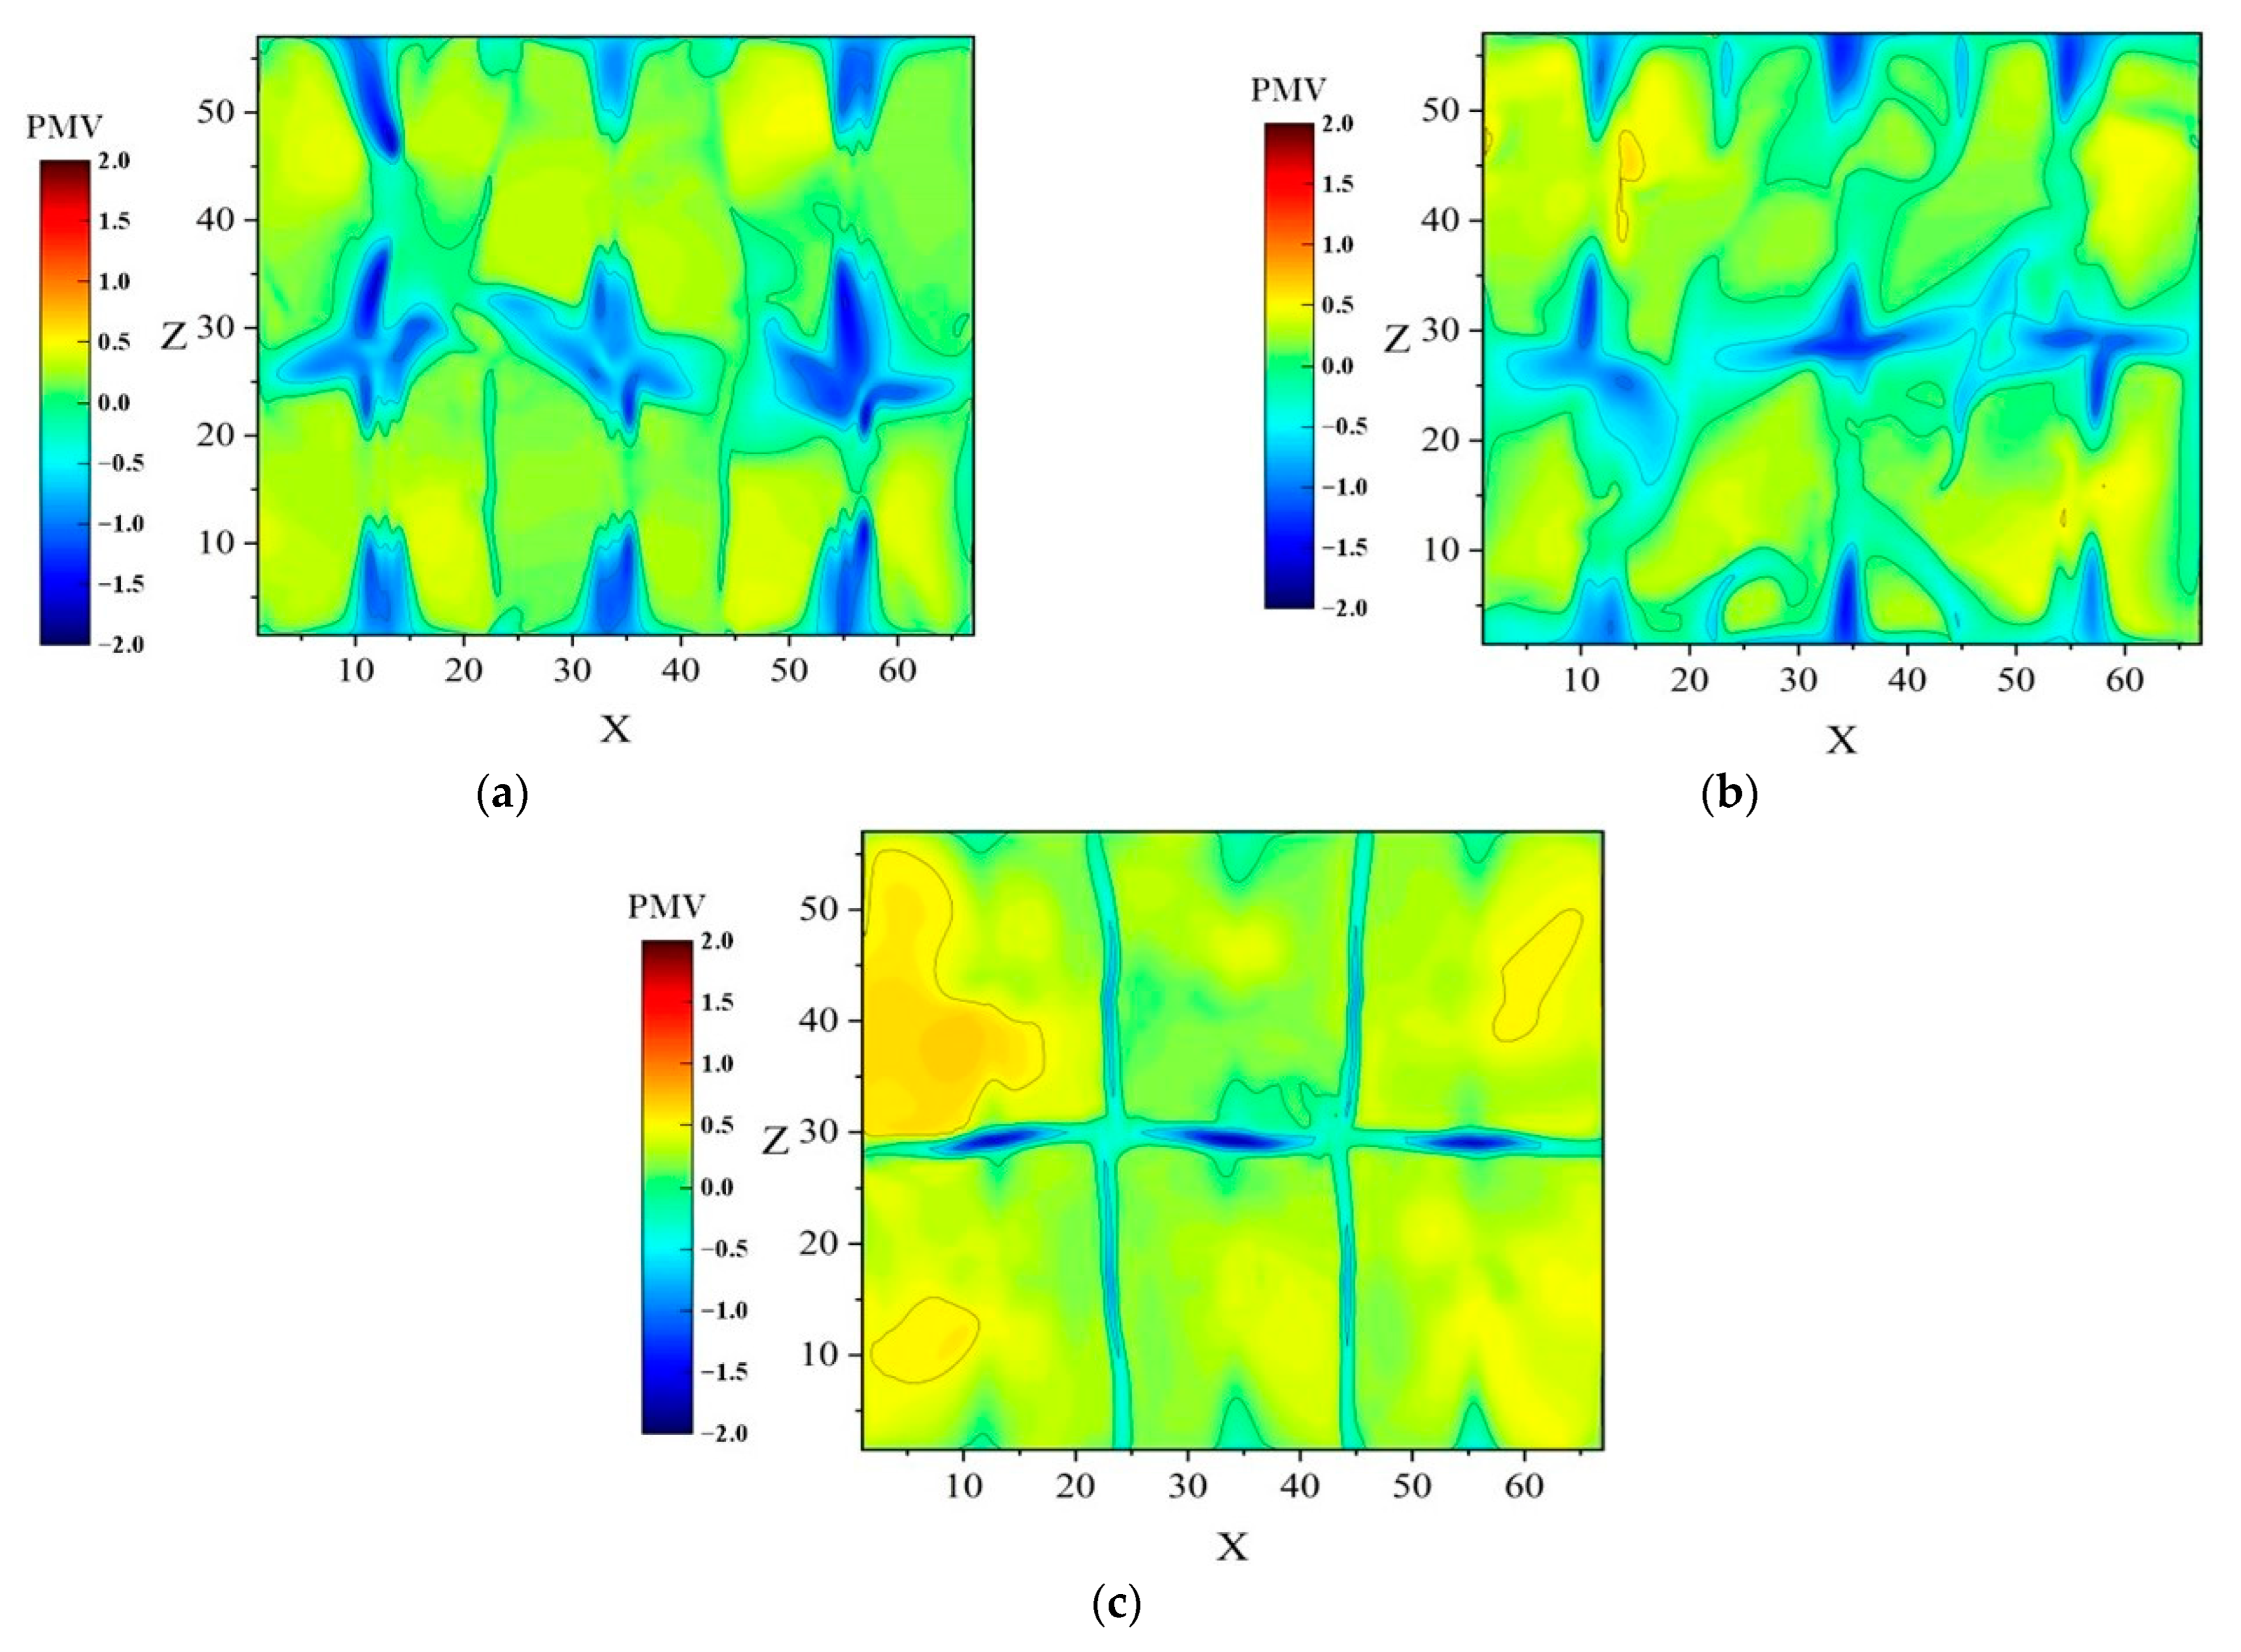
- Compared to the SJV, the PMV distribution of the CAV and CASJV is more uniform, and the PMV of the CASJV is smaller. This indicates that the attached ventilation mode can effectively improve the overall thermal comfort of the waiting hall of the high-speed rail station.
- (3)
- All three ventilation schemes resulted in an LPD2 value of less than 10%, which indicates a comfortable vertical temperature distribution in the activity area. Additionally, compared with the CAV and SJV, the CASJV can effectively reduce the local cold wind feeling.
- (4)
- Under the same temperature distribution characteristics, the CAV and CASJV reduce the cooling energy consumption by 11.89% and 9.25% compared with the SJV. These findings indicate that the CAV and CASJV exhibit improved energy-saving performance in the waiting hall.
Author Contributions
Funding
Institutional Review Board Statement
Informed Consent Statement
Data Availability Statement
Conflicts of Interest
References
- Aldawoud, A. The influence of the atrium geometry on the building energy performance. Energy Build. 2013, 57, 1–5. [Google Scholar] [CrossRef]
- Wang, Y.; Wong, K.K.L.; Du, H.M.; Qing, J.; Tu, J. Design configuration for a higher efficiency air conditioning system in large space building. Energy Build. 2014, 72, 167–176. [Google Scholar] [CrossRef]
- Lv, L.; Wang, X.; Zhang, Q.; Xiang, Y.; Wu, X.; Huang, C. Investigation of vertical thermal stratification and stratified air conditioning load for large space with low-sidewall supply air based on vertical temperature node model. J. Build. Eng. 2023, 69, 106297. [Google Scholar] [CrossRef]
- Wang, H.D.; Zhou, P.Z.; Guo, C.S.; Tang, X.; Xue, Y.; Huang, C. On the calculation of heat migration in thermally stratified environment of large space building with sidewall nozzle air-supply. Build. Environ. 2019, 147, 221–230. [Google Scholar] [CrossRef]
- Huang, C.; Zou, Z.; Li, M.; Wang, X.; Li, W.; Huang, W.; Yang, J.; Xiao, X. Measurements of indoor thermal environment and energy analysis in a large space building in typical seasons. Build. Environ. 2007, 42, 1869–1877. [Google Scholar] [CrossRef]
- Zhao, K.; Liu, X.-H.; Jiang, Y. Application of radiant floor cooling in large space buildings—A review. Renew. Sustain. Energy Rev. 2016, 55, 1083–1096. [Google Scholar] [CrossRef]
- Lu, Y.Y.; Dong, J.K.; Liu, J. Zonal modelling for thermal and energy performance of large space buildings: A review. Renew. Sustain. Energy Rev. 2020, 133, 110241. [Google Scholar] [CrossRef]
- Hu, H.; Wang, H.; Zou, Z.; Zhu, J. Investigation of inter-zonal heat transfer in large space buildings based on similarity: Comparison of two stratified air-conditioning systems. Energy Build. 2022, 254, 111602. [Google Scholar] [CrossRef]
- Chua, K.J.; Chou, S.K.; Yang, W.M.; Yan, J. Achieving better energy-efficient air conditioning—A review of technologies and strategies. Appl. Energy 2013, 104, 87–104. [Google Scholar] [CrossRef]
- Hu, J.H.; Kawaguchi, K.; Ma, J.B.; Nakaso, Y. Improving indoor thermal and energy performance of large-space residential buildings via active approaches. Appl. Energy 2023, 344, 120766. [Google Scholar] [CrossRef]
- Gilani, S.; Montazeri, H.; Blocken, B. CFD simulation of stratified indoor environment in displacement ventilation: Validation and sensitivity analysis. Build. Environ. 2016, 95, 299–313. [Google Scholar] [CrossRef]
- Saïd, M.N.A.; MacDonald, R.A.; Durrant, G.C. Measurement of thermal stratification in large single-cell buildings. Energy Build. 1996, 24, 105–115. [Google Scholar] [CrossRef]
- Müller, D.; Kandzia, C.; Kosonen, R.; Melikov, A.K.; Nielsen, P.V. Mixing Ventilation: Guide on Mixing Air Distribution Design—REHVA: Federation of European Heating and Air-Conditioning Associations; REHVA: Brussels, Belgium, 2013. [Google Scholar]
- Melikov, A.K. Advanced air distribution: Improving health and comfort while reducing energy use. Indoor Air 2016, 26, 112–124. [Google Scholar] [CrossRef] [PubMed]
- Cao, G.Y.; Awbi, H.; Yao, R.M.; Fan, Y.; Sirén, K.; Kosonen, R.; Zhang, J. A review of the performance of different ventilation and airflow distribution systems in buildings. Build. Environ. 2014, 73, 171–186. [Google Scholar] [CrossRef]
- Li, Q.; Yoshino, H.; Mochida, A.; Lei, B.; Meng, Q.; Zhao, L.; Lun, Y. CFD study of the thermal environment in an air-conditioned train station building. Build. Environ. 2009, 44, 1452–1465. [Google Scholar] [CrossRef]
- Zhuang, B.; Shi, J.; Chen, Z. Numerical study on indoor environment and thermal comfort in train station waiting hall with two different air-conditioning modes. In Building Simulation; Springer: New York, NY, USA, 2021; pp. 337–349. [Google Scholar]
- Yin, H.G.; Li, A.G.; Liu, Z.Y.; Sun, Y.; Chen, T. Experimental study on airflow characteristics of a square column attached ventilation mode. Build. Environ. 2016, 109, 112–120. [Google Scholar] [CrossRef]
- Yin, H.; Li, A.; Li, L.; Wu, R. Performance Evaluation of An Innovative Column Attachment Ventilation. E3S Web Conf. 2019, 111, 01028. [Google Scholar] [CrossRef]
- Li, J.X.; Li, A.G.; Hou, Y.C.; Zhang, C.; Yang, C.; Zhang, X.; Che, J.; Guo, J. Air distribution and thermal environment optimization on subway platform using an innovative attached ventilation mode. Build. Environ. 2021, 204, 108226. [Google Scholar] [CrossRef]
- Li, J.; Li, A.; Zhang, C.; Yang, C.; Che, J.; Yin, Y.; Ma, Y.; Hou, Y. Comparative analysis and parametric study of an innovative artificial air column ventilation mode in a high-speed railway station. J. Build. Eng. 2023, 63, 105578. [Google Scholar] [CrossRef]
- Yin, H.; Wu, R.; Chen, T.; Sun, Y.; Li, A. Study on Ventilation Effectiveness of Circular Column Attached Displacement Ventilation Mode. Procedia Eng. 2017, 205, 3511–3518. [Google Scholar] [CrossRef]
- Yin, H.G.; Ji, D.N.; Wang, Y.Y.; Huo, Y.; Deng, X.; Wang, J.; Ma, Z.; Li, A. Numerical study of particle spatial distribution under column attachment ventilation. J. Build. Eng. 2022, 53, 104599. [Google Scholar] [CrossRef]
- Wang, J.L.; Yin, H.G.; Huo, Y.K.; Zhang, J.; Liang, L.; Ji, D.; Chang, Z.; Ma, Z.; Li, A. Numerical investigation on air distribution characteristics and effect of the outlet opening mode on cross-shaped column attachment ventilation. Build. Environ. 2023, 233, 110086. [Google Scholar] [CrossRef]
- Chen, Q.Y. Ventilation performance prediction for buildings: A method overview and recent applications. Build. Environ. 2009, 44, 848–858. [Google Scholar] [CrossRef]
- Harish, V.S.K.V.; Kumar, A. A review on modeling and simulation of building energy systems. Renew. Sustain. Energy Rev. 2016, 56, 1272–1292. [Google Scholar] [CrossRef]
- Pan, Y.Q.; Li, Y.M.; Huang, Z.Z.; Wu, G. Study on simulation methods of atrium building cooling load in hot and humid regions. Energy Build. 2010, 42, 1654–1660. [Google Scholar] [CrossRef]
- Yamamoto, T.; Ozaki, A.; Lee, M.; Kusumoto, H. Fundamental study of coupling methods between energy simulation and CFD. Energy Build. 2018, 159, 587–599. [Google Scholar] [CrossRef]
- Tian, W.; Han, X.; Zuo, W.D.; Sohn, M.D. Building energy simulation coupled with CFD for indoor environment: A critical review and recent applications. Energy Build. 2018, 165, 184–199. [Google Scholar] [CrossRef]
- Zhai, Z.; Chen, Q.; Haves, P.; Klems, J.H. On approaches to couple energy simulation and computational fluid dynamics programs. Build. Environ. 2002, 37, 857–864. [Google Scholar] [CrossRef]
- Zhang, R.; Lam, K.P.; Yao, S.C.; Zhang, Y. Coupled EnergyPlus and computational fluid dynamics simulation for natural ventilation. Build. Environ. 2013, 68, 100–113. [Google Scholar] [CrossRef]
- Wang, L.; Wong, N.H. Coupled simulations for naturally ventilated residential buildings. Autom. Constr. 2008, 17, 386–398. [Google Scholar] [CrossRef]
- Zhang, R.J.; Mirzaei, P.A.; Jones, B. Development of a dynamic external CFD and BES coupling framework for application of urban neighbourhoods energy modelling. Build. Environ. 2018, 146, 37–49. [Google Scholar] [CrossRef]
- Shan, X.F.; Luo, N.; Sun, K.Y.; Hong, T.; Lee, Y.-K.; Lu, W. Coupling CFD and building energy modelling to optimize the operation of a large open office space for occupant comfort. Sustain. Cities Soc. 2020, 60, 102257. [Google Scholar] [CrossRef]
- Fumo, N.; Mago, P.; Luck, R. Methodology to estimate building energy consumption using EnergyPlus Benchmark Models. Energy Build. 2010, 42, 2331–2337. [Google Scholar] [CrossRef]
- Griffith, B.; Chen, Q.Y. Framework for Coupling Room Air Models to Heat Balance Model Load and Energy Calculations (RP-1222). HVAC&R Res. 2004, 10, 91–111. [Google Scholar]
- Matsson, J.E. An Introduction to ANSYS Fluent 2022; SDC Publications: Mission, KS, USA, 2022. [Google Scholar]
- Djunaedy, E.; Hensen, J.; Loomans, M.J.A.T. Toward external coupling of building energy and airflow modeling programs. ASHRAE Trans. 2003, 109, 771–787. [Google Scholar]
- Djunaedy, E.; Hensen, J.L.M.; Loomans, M. Selecting an appropriate tool for airflow simulation in buildings. Build. Serv. Eng. Res. Technol. 2016, 25, 269–278. [Google Scholar] [CrossRef]
- Djunaedy, E.; Hensen, J.; Loomans, M.J.A.T. External coupling between CFD and energy simulation: Implementation and validation. ASHRAE Trans. 2005, 111, 612–624. [Google Scholar]
- Olesen, B.W.; Parsons, K.C. Introduction to thermal comfort standards and to the proposed new version of EN ISO 7730. Energy Build. 2002, 34, 537–548. [Google Scholar] [CrossRef]
- Yu, W.; Cheong, K.; Tham, K.; Sekhar, S.C.; Kosonen, R. Thermal effect of temperature gradient in a field environment chamber served by displacement ventilation system in the tropics. Build. Environ. 2007, 42, 516–524. [Google Scholar] [CrossRef]
- Li, A. Attachment Ventilation Theory; Springer Nature: New York, NY, USA, 2023. [Google Scholar]
- GB/T 50785-2012; Evaluation Standard for Indoor Thermal Environment in Civil Buildings. National Standard of the People’s Republic of China: Beijing, China, 2012.
- GB50189-2015; Energy Saving Design Standard for Public Buildings. China Building Industry Press: Beijing, China, 2015.
- Li, A.G.; Ren, T.; Yang, C.Q.; Xiong, J.; Tao, P. Numerical simulation, PIV measurements and analysis of air movement influenced by nozzle jets and heat sources in underground generator hall. Build. Environ. 2018, 131, 16–31. [Google Scholar] [CrossRef]
- Zhai, Z.J.; Zhang, Z.; Zhang, W.; Chen, Q. Evaluation of Various Turbulence Models in Predicting Airflow and Turbulence in Enclosed Environments by CFD: Part 1—Summary of Prevalent Turbulence Models. HVAC&R Res. 2007, 13, 853–870. [Google Scholar]
- Yin, H.G.; Li, A.G. Study of attached air curtain ventilation within a full-scale enclosure: Comparison of four turbulence models. Indoor Built Environ. 2016, 25, 962–975. [Google Scholar] [CrossRef]
- Liu, C.P.; Li, A.G.; Yang, C.P.; Zhang, W. Simulating air distribution and occupants’ thermal comfort of three ventilation schemes for subway platform. Build. Environ. 2017, 125, 15–25. [Google Scholar] [CrossRef]


| Grade | Overall Evaluation Indicators | Partial Evaluation Indicators | ||
|---|---|---|---|---|
| I | −0.5 ≤ PMV ≤ +0.5 | PPD ≤ 10% | LPD1 < 30% | LPD2 < 10% |
| II | −1 ≤ PMV < 0.5, +0.5 < PMV ≤ +1 | 10% < PPD ≤ 25% | 30% ≤ LPD1 < 40% | 10% ≤ LPD2 < 20% |
| III | PMV < −1, PMV > +1 | PPD > 25% | LPD1 ≥ 40% | LPD2 ≥ 20% |
| Type | Information |
|---|---|
| Weather data | Typical meteorological year data of Guangzhou |
| Architectural models | Figure 3a |
| People | 960 |
| Lights | 10 W/m2 |
| Equipment | 5 W/m2 |
| HVAC | CAV, supply air temperature: 21 °C |
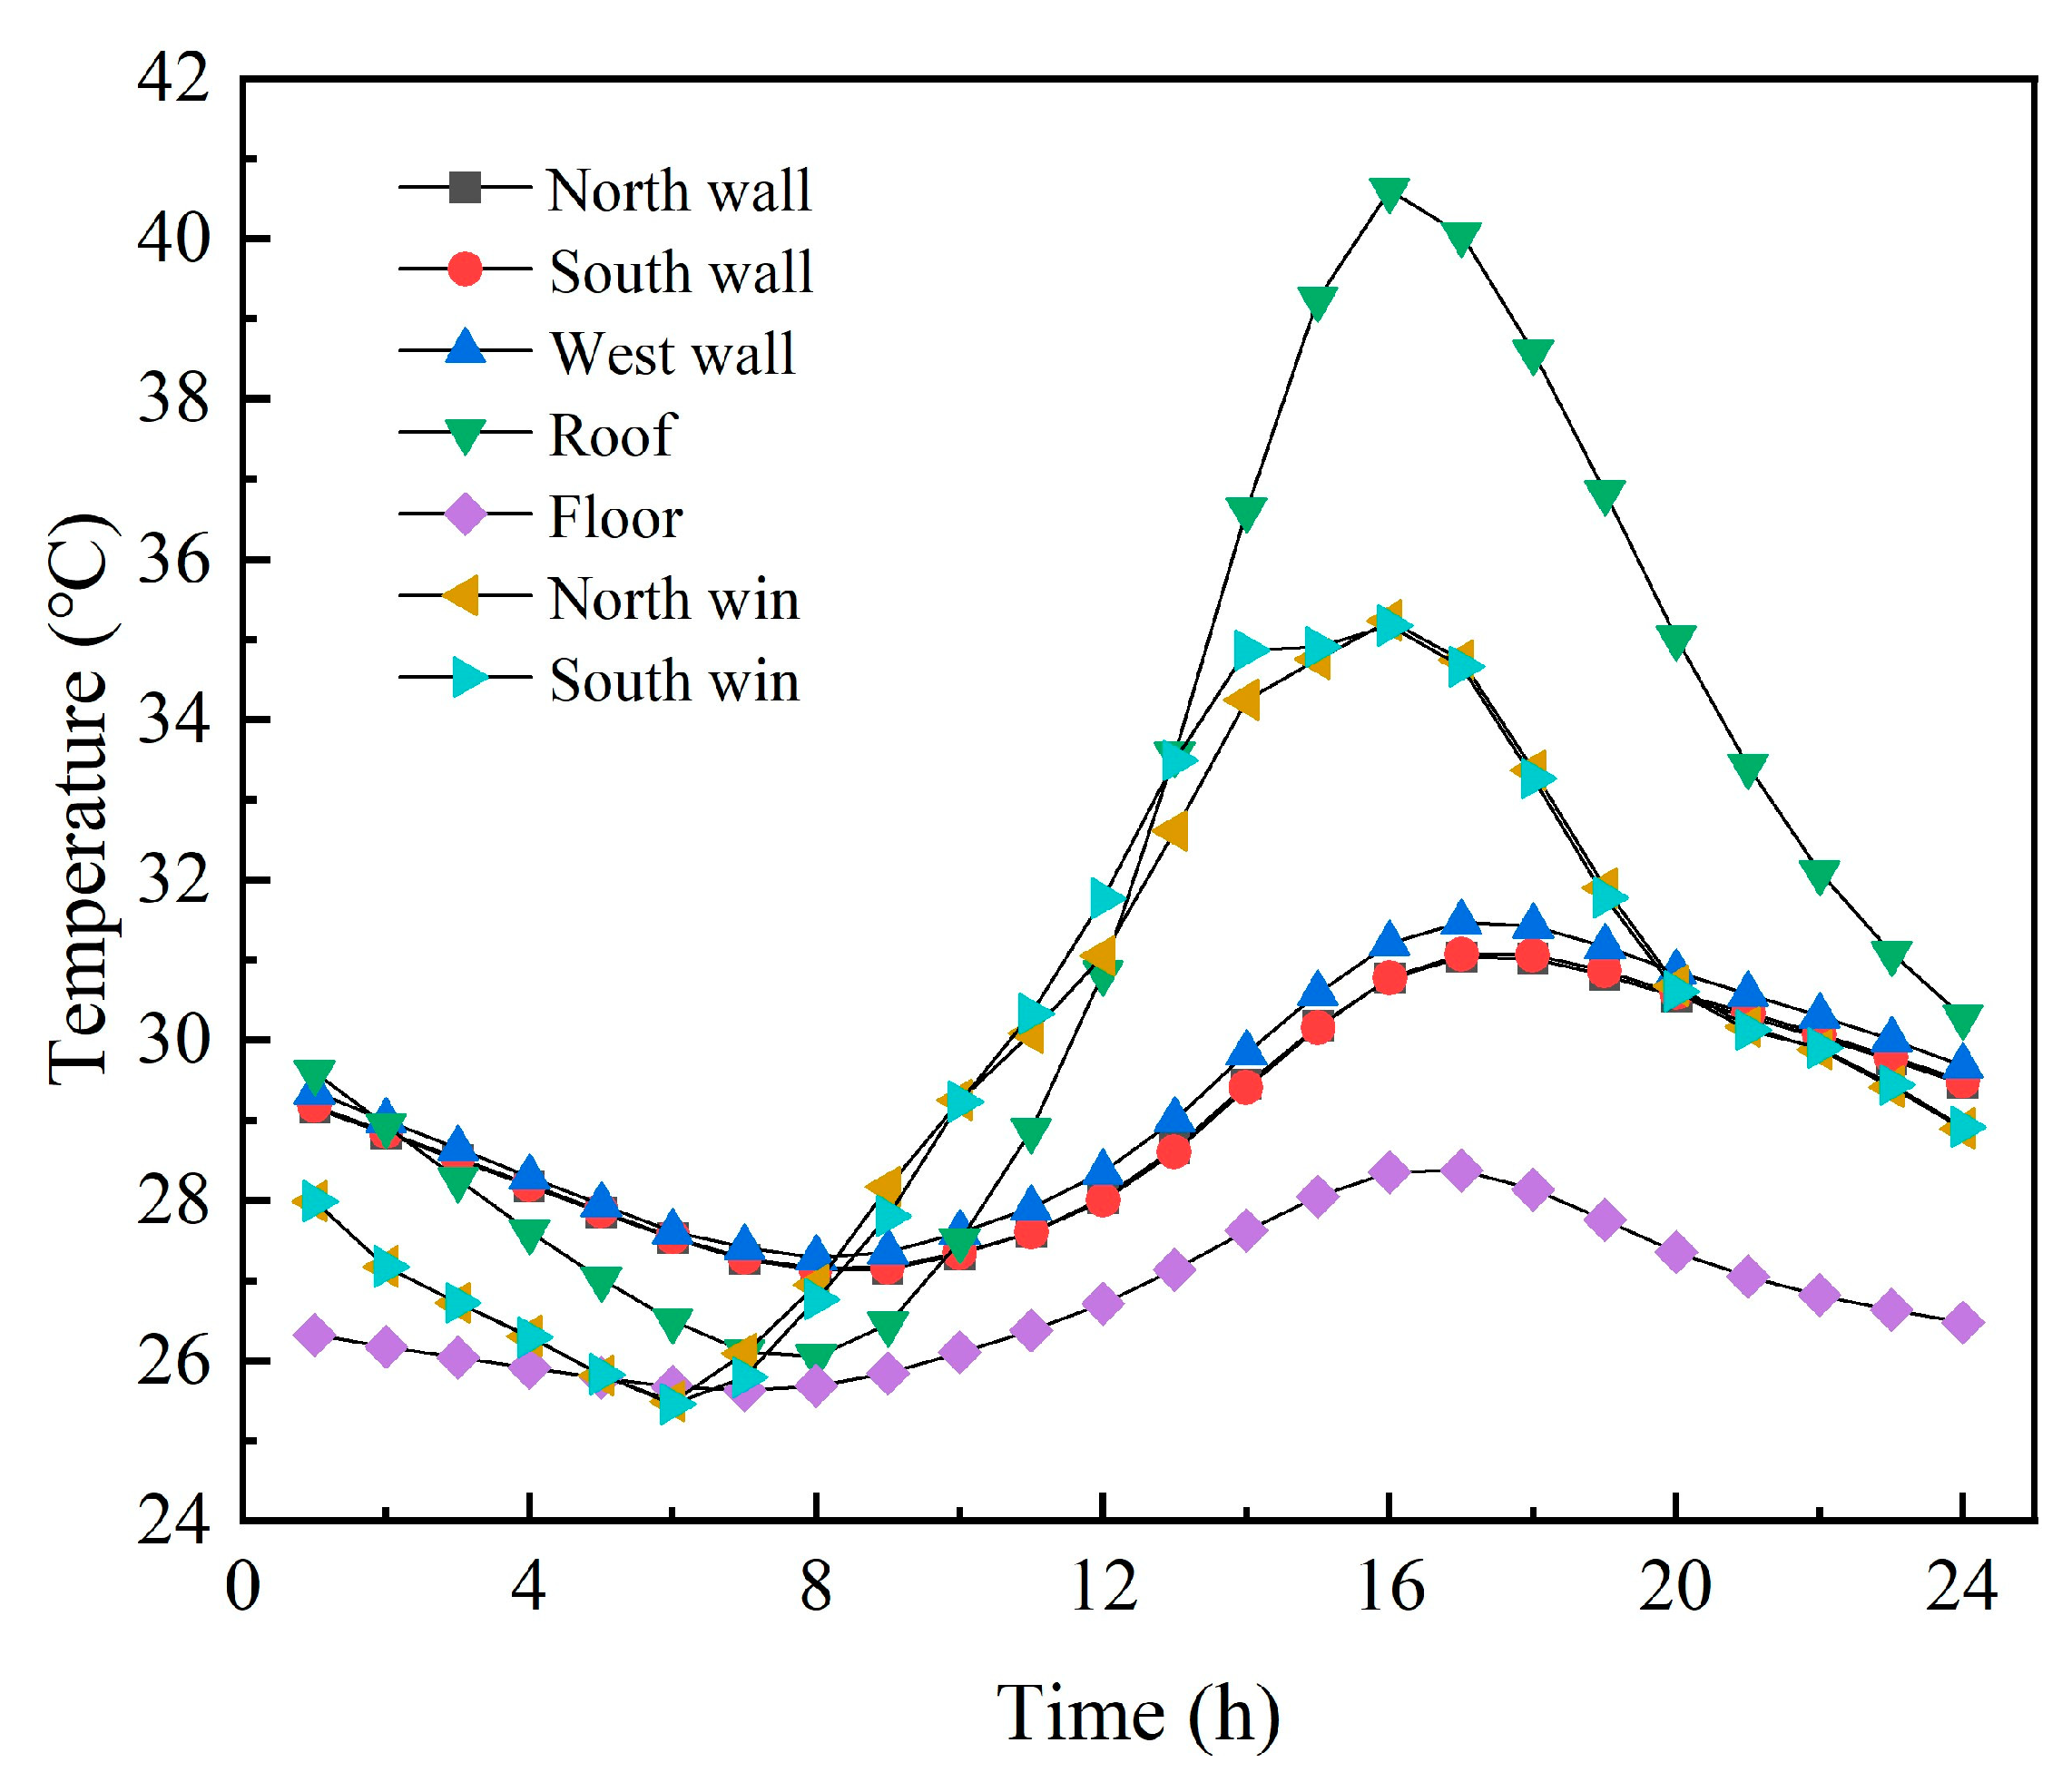
| Name | The Boundary Type | Temperature (°C) |
|---|---|---|
| Floor | 26.70 | |
| Roof | 40.60 | |
| North wall | 31.04 | |
| South wall | Temperature boundary | 31.63 |
| West wall | 31.47 | |
| East wall | Adiabatic | |
| North window | 35.23 | |
| South window | 35.17 |
| Scheme | Type | Supply Air Temperature (°C) | Velocity of the Attached Jet (m/s) | Velocity of the Side Jet (m/s) | Temperature at 1.5 m (°C) | Average Temperature in the Activity area (°C) |
|---|---|---|---|---|---|---|
| 1 | CASJV | 21 | 2 | 2.6 | 26.665 | 26.62 |
| 2 | SJV | 21 | 5 | 27.233 | 27.31 | |
| 3 | 21 | 5.2 | 27.016 | 27.087 | ||
| 4 | 21 | 5.4 | 26.797 | 26.858 | ||
| 5 | 21 | 5.6 | 26.564 | 26.65 | ||
| 6 | 21 | 5.8 | 26.345 | 26.457 | ||
| 7 | 21 | 6 | 26.121 | 26.258 | ||
| 8 | CAV | 21 | 3.6 | 28.205 | 27.541 | |
| 9 | 21 | 3.8 | 27.665 | 27.001 | ||
| 10 | 21 | 4 | 27.125 | 26.581 | ||
| 11 | 21 | 4.2 | 26.594 | 26.036 | ||
| 12 | 21 | 4.4 | 26.063 | 25.506 | ||
| 13 | 21 | 4.6 | 25.532 | 24.976 |
| Area | Type | CASJV | CAV | SJV | |||
|---|---|---|---|---|---|---|---|
| Head | Ankle | Head | Ankle | Head | Ankle | ||
| Area near the air column | Local air temperature (°C) | 26.24 | 24.062 | 27.17 | 23.937 | 26.426 | 26.83 |
| Local average airflow rate (°C) | 0.084 | 0.74 | 0.214 | 1.523 | 0.146 | 0.113 | |
| Local turbulence intensity | 4.33 | 11.08 | 7.134 | 21.43 | 6.723 | 2.77 | |
| The vertical air temperature difference between the head and ankle (°C) | 2.178 | 3.233 | −0.404 | ||||
| LPD1 | 3.123 | 48.745 | 8.249 | 194.677 | 6.206 | 4.205 | |
| LPD2 | 1.993 | 4.776 | 0.223 | ||||
| Air lake area | Local air temperature (°C) | 25.328 | 25.236 | 26.583 | 25.406 | 25.787 | 25.5 |
| Local average airflow rate (°C) | 0.283 | 0.383 | 0.194 | 0.725 | 0.44 | 0.628 | |
| Local turbulence intensity | 10.704 | 4.956 | 7.38 | 11.98 | 18.79 | 16.78 | |
| The vertical air temperature difference between the head and ankle (°C) | 0.092 | 1.177 | 0.287 | ||||
| LPD1 | 14.975 | 17.029 | 8.185 | 42.794 | 28.397 | 42.592 | |
| LPD2 | 0.34 | 0.856 | 0.402 | ||||
Disclaimer/Publisher’s Note: The statements, opinions and data contained in all publications are solely those of the individual author(s) and contributor(s) and not of MDPI and/or the editor(s). MDPI and/or the editor(s) disclaim responsibility for any injury to people or property resulting from any ideas, methods, instructions or products referred to in the content. |
© 2023 by the authors. Licensee MDPI, Basel, Switzerland. This article is an open access article distributed under the terms and conditions of the Creative Commons Attribution (CC BY) license (https://creativecommons.org/licenses/by/4.0/).
Share and Cite
Wang, H.; Lu, N.; Wu, F.; Zhai, J. Coupling Computational Fluid Dynamics and EnergyPlus to Optimize Energy Consumption and Comfort in Air Column Ventilation at a Tall High-Speed Rail Station. Sustainability 2023, 15, 12948. https://doi.org/10.3390/su151712948
Wang H, Lu N, Wu F, Zhai J. Coupling Computational Fluid Dynamics and EnergyPlus to Optimize Energy Consumption and Comfort in Air Column Ventilation at a Tall High-Speed Rail Station. Sustainability. 2023; 15(17):12948. https://doi.org/10.3390/su151712948
Chicago/Turabian StyleWang, Haitao, Ning Lu, Fanghao Wu, and Jianfeng Zhai. 2023. "Coupling Computational Fluid Dynamics and EnergyPlus to Optimize Energy Consumption and Comfort in Air Column Ventilation at a Tall High-Speed Rail Station" Sustainability 15, no. 17: 12948. https://doi.org/10.3390/su151712948
APA StyleWang, H., Lu, N., Wu, F., & Zhai, J. (2023). Coupling Computational Fluid Dynamics and EnergyPlus to Optimize Energy Consumption and Comfort in Air Column Ventilation at a Tall High-Speed Rail Station. Sustainability, 15(17), 12948. https://doi.org/10.3390/su151712948