Article

The Sectoral and Regional Peer Influences on Heavy-Pollution Corporate Environmental, Social, and Governance Performance

1
School of Management and Economics, University of Electronic Science and Technology of China, Chengdu 611731, China
2
School of Business, Guilin University of Electronic Technology, Guilin 541004, China
3
School of Economics, Jiujiang University, Jiujiang 332005, China
*
Author to whom correspondence should be addressed.
Sustainability 2023, 15(17), 12925; https://doi.org/10.3390/su151712925
Submission received: 31 May 2023 / Revised: 10 July 2023 / Accepted: 13 July 2023 / Published: 27 August 2023

Abstract

:
The conception of environmental, social, and governance (ESG) performance has been widely implemented and has become an important indicator of firms’ eco-friendly transformation in heavy-pollution industries. The sectoral and regional peer influences of corporate ESG performance can effectively promote firms’ green sustainable development within an entire industry, district, and market. In this study, our main hypothesis is that corporate ESG performance has a significantly positive peer effect among heavy-pollution industry firms within the same province, industry, and product market. Therefore, by employing novel spatial econometric techniques, we investigate the peer effect of corporate ESG performance among 681 of China’s A-share listed firms within 20 heavy-pollution industries from 2012 to 2021 and explore the impacts from peer indirect effect views, such as public media attention, regulatory pressure, and green innovation. Further, we detect the sectoral and regional peer pulling and dragging effects under the two statuses of firms’ ESG rating changes. The main findings are as follows. First, corporate ESG performance has a significantly positive peer effect, which is the highest among firms within the same industry. Second, the mechanism analysis presents that the increase in other firms’ negative web news, environment-related penalties, and green patents has different peer indirect effects on corporate ESG performance within the same province, industry, and product market. Third, corporate ESG performance has a significantly positive peer-pulling effect among firms when other firms’ ESG levels increase, yet a significantly positive peer-dragging effect only within the same region and industry when other firms’ ESG levels decrease. This study gives empirical contributions that firms can take advantage of the positive peer effect of corporate ESG performance to improve their own ESG practice level and employ it as a competitive strategy for pursuing long-term value, and governments should maintain sustainable supervision measures and an orderly competitive market environment to cultivate a consensus on corporate ESG development in heavy-pollution industries.

1. Introduction

In recent years, the conception of environmental, social, and governance (ESG) performance has been widely promoted in firms’ strategic management and business decision-making processes. ESG is an extension and enrichment of corporate social responsibility (CSR) and green economic development consensus. Today, corporate ESG reports are becoming an important indicator for shareholders and investors, because it can comprehensively reflect a firm’s potential value, management quality, and operational soundness (Huber et al. (2017)) [1]. Moreover, they are frequently used by regulatory authorities and public institutions to measure a firm’s level of sustainable development, which has also been greatly advocated in global society. The China Securities Regulatory Commission (CSRC) has successively issued document guidelines on the principles of A-share listed corporation’s ESG reporting to continuously strengthen the requirements for a firm’s ESG information disclosure. During April of 2022, the CSRC published the Guidelines on Investor Relations Management of Listed Companies, which initially included corporate ESG information (see website: http://www.gov.cn/zhengce/zhengceku/2022-04/16/content_5685513.htm (accessed on 28 May 2023)). As shown in Figure 1, the total number of A-share listed corporations that issued ESG reports increased year by year from 2012 to 2021. Meanwhile, new characteristics of corporate ESG practice around different sectoral backgrounds are emerging. Therefore, there is a necessity to investigate the various situations of the mutual promotion effects of corporate ESG performance among firms in different industries and regions from a green sustainable development perspective.
Heavy-pollution industry firms are the frontier of corporate ESG management practices. With the expansion of environmental protection and sustainable development in public awareness, the Chinese government has begun to adopt many measures to help these firms in green production transformation (Liu and Wang (2017)) [2]. In 2010, the Guidance for Environmental Information Disclosure of Listed Companies, published by the Ministry of Ecology and Environment of China, required the true, accurate, complete, and timely disclosure of environmental information by listed companies, especially those in heavy-pollution industries (see website: https://www.mee.gov.cn/gkml/sthjbgw/qt/201009/t20100914_194484.htm (accessed on 28 May 2023)). This has led to heavy-pollution industry firms enduring a higher degree of public media attention, regulatory pressure, and green innovation competition (Cheng and Liu (2018)) [3]. Consequently, these firms may have a greater impetus to carry out corporate ESG practice together and embed it into their own operational management and business strategies. In addition, the regional and sectoral coordination of corporate ESG practice and development can effectively push forward the green production transformation of the whole industrial chain. This comovement of corporate ESG performance among firms is regarded as a kind of peer effect, which can significantly impact the integrated effect of ESG practice in the different dimensions of region, industry, and market. However, most of the existing literature ignores the peer effect of corporate ESG performance and its exogenous influence factors among heavy-pollution industry listed firms within the same region, industry, or product market. There is also a lack of research on the peer-pulling effect and peer-pushing effect of corporate ESG performance in different statuses when firm’s ESG rating changes.
Motivated by the realistic backgrounds of corporate ESG performance, we address several essential research questions related to this study, which are as follows: (1) Explore the sectoral and regional peer effect of corporate ESG performance and measure its differences among heavy-pollution industry listed firms within the same province, within the same industry, and with the same products. (2) Detect the mechanisms of impact factors on corporate ESG performance from the peer indirect effect perspective, such as public media attention, regulatory pressure, and green innovation capability. (3) Compare differences in the sectoral and regional peer effects of corporate ESG performance under two statuses when the peer-pulling effect and peer-dragging effect exist, respectively.
Therefore, this study uses data from China’s heavy-pollution industry listed firms from the years 2012 to 2021, constructs three types of spatial weight matrices to represent various peer groups, and employs the spatial autoregressive model (SAR) to empirically investigate the existence of the peer effect of corporate ESG performance among firms within the same province, within the same industry, and with the same products. Moreover, by following the partial differential method to decompose the spatial lagged coefficients in the spatial Durbin model (SDM), we engage a mechanism analysis to research the impacts of the peer effect of their counterparts’ levels of negative web news, environment-related penalties, and green patents on corporate ESG performance. Finally, based on the extended estimation form of the SAR model, this paper builds a spatial autoregressive probit model to capture the differences between the peer-pulling effect and peer-dragging effect when other firms’ ESG levels increase or decrease in the section of further analysis.
The existing literature has widely covered peer effects on a firm’s business strategy and operational management. Some studies explore peer influences in a variety of corporate finance and operational fields. Adhikari and Agrawal (2018) give evidence from a large sample of US public companies, showing that firms have strong incentives to imitate other industry peers in payout policies, such as share dividends and repurchases [4]. This motivation from peer firms significantly speeds up a firm’s dividend time and increases the total payments in response to peer changes (Grennan (2019)) [5]. In addition, the characteristics of peer firms are essential for determining corporate capital structures and are more important than other previously identified leverage factors (Leary and Roberts (2014)) [6]. A firm’s capital investment activity is also more easily influenced by its counterparts’ decisions. Kaustia and Rantala (2015) demonstrate that firms are more likely to execute a stock split within a month of their peer firms having done so [7]. Joo et al. (2016) and Chen et al. (2019) both empirically demonstrate that a firm’s cash-holding levels significantly depend on peer firms’ cash ratios [8,9]. On the one hand, by referring to peer firms’ business situations, firms can obtain reliable information to support reducing, to some extent, the cost of uncertain operational mistakes. The harder the acquisition of market information, the more firm managers rely on other enterprises’ conditions to make decisions. Bustamante and Frésard (2021) argue that managers will use peers’ investments as a source of information when firms have less precise information [10]. On the other hand, corporations often choose a conservative strategy when imitating their peer firms in order to maintain their own reputation and market advantage [11]. Therefore, the peer effect is a non-negligible phenomenon in a firm’s business decision making and inside management.
There are many studies that focus on the peer effect in different social groups using spatial econometric techniques, such as Lin (2015) [12], Liu et al. (2018) [13], and Li et al. (2021) [14]. Many of these related studies in the field of corporate business strategy and operational management only discuss the peer effect in a single group of peer firms. By using the product similarity scores between firms to construct the product spatial weight matrix, Grieser et al. (2022) investigate the peer effect of firm’s financial policies in similar product markets, for instance, capital structure decision, asset growth, input of research and development (R&D), and cash holdings [15]. Pan et al. (2022) employ a spatial autoregressive model with the geography distance weight matrix to detect the peer effect of enterprises’ digital transformation in Chinese listed companies [16]. Zhao and Lin (2023) exploit firms’ management discussion and analysis (MD&A) textual comparability to identify peer firm networks and examine peer effects in business strategic disclosure decisions [17]. In contrast with the above literature, the three kinds of spatial weight matrices in this study are built based on the principles of whether the two matched firms are in the same province, in the same industry, or with the same product, respectively.
In recent years, some scholars have also studied the peer effect from the aspect of firms’ environmental performance and development. Zheng and Ye (2023) suggest that firms will directly imitate peers’ strategic behaviors regarding green innovation or reference peers’ environmental information disclosed to correct their own decision making [18]. Yang et al. (2022) investigate the peer effects of an enterprise’s green financing among Chinese A-share listed companies, especially firms in the same industry or the same region [19]. They also notice that the external environment plays an important role in this result, which suggests that the peer effects of an enterprise’s green financing are stronger when the economic policy uncertainty is higher. Siedschlag and Yan (2021) detect that there are significant positive spillover effects in a firm’s investments in environmental protection among firms when they are part of an enterprise group [20]. Moreover, there are also a few studies that focus on the peer effect of corporate social responsibility (CSR). Liu and Wu (2016) empirically find that the CSR behavior of firms is positively impacted by the CSR level of industry peers [21]. Li and Wang (2022) and Dong et al. (2023) obtain the results that corporate social responsibility has significant local and industry peer effects, respectively [22,23]. Based on these studies, we employ the spatial effect decomposition in the SDM model to further detect more external influence factors of corporate ESG performance, which are the peer indirect effects of certain characteristics from other counterparts.
By constructing the spatial autoregressive probit model, we were able to separately estimate the two binary-ordered dependent variables into our empirical models to identify whether a firm’s ESG level increases or decreases. A few researchers apply the spatial autoregressive probit model to explore the peer effect in some social groups. Brasington and Parent (2017) reveal that the endogenous peer effect from neighbors can be a determinant decision element in public school consolidation [24]. Skevas et al. (2022) use this model to examine the peer effect of the adoption behavior of Missouri farmers regarding unmanned aerial vehicles [25]. Similarly to these studies, the spatial autoregressive probit model can help us deal with estimations of ordered dependent variables in both bivariate and multivariate cases, such as corporate ESG ratings in different situations and levels. Overall, this study of peer effect decomposition under various peer connective environments might fill the gaps of two types of the existing literature. The first group concerns the influence factors of corporate ESG practice and development, such as market competition and concentration environment (Long et al. (2020) [26], Tan et al. (2022) [27], Martins (2022) [28]). The second mainly concerns the regional and industrial impacts of the peer effects of corporate ESG or CSR business strategic management (Cao et al. (2019) [29], Chen et al. (2023) [30]).
The main contributions of this paper are as follows. First, we construct three types of spatial weight matrices to represent the various groups of peer firms, which enables us to measure the differences in the peer effects of corporate ESG performance more comprehensively among firms within the same region, within the same industry, and with the same products. Second, we consider not only the direct effect but also the effect decomposition of exogenous impact factors, which results in an in-depth analysis of the peer indirect effects of other firms’ media coverage, regulatory pressure, and green innovation capability on corporate ESG performance. Last, we discuss the differences between the two statuses when other firms’ ESG levels increase or decrease, which allows us to measure the peer-pulling effects and peer-dragging effects of corporate ESG performance more thoroughly among heavy-pollution industry listed firms within the same province, the same industry, or with the same products. This study provides a meaningful empirical addition both in terms of firms’ ESG strategic management and governmental ESG promotion policy implementation. The former enables firms to take advantage of the positive peer effect of corporate ESG performance to improve their own ESG practice level and use it as a competitive strategy for pursuing long-term value. The latter indicates that the government should maintain sustainable supervision measures and an environment of orderly market competition to cultivate a consensus on corporate ESG development in heavy-pollution industries.
Our empirical findings are as follows. (1) The ESG performance of listed corporations in heavy-pollution industries has a significantly positive peer effect that is stronger among firms within the same industry than those within the same province or which produce the same products. (2) The increase in other firms’ negatively perceived web news has a widely positive peer indirect effect on corporate ESG performance, and the peer indirect effect of environment-related penalties on corporate ESG performance is significantly positive among firms within the same industry and with the same products, while the number of other firms’ green patents only negatively influence corporate ESG performance within the same province. (3) When other firms’ ESG levels increase, corporate ESG performance has a significantly positive peer-pulling effect among heavy-pollution industry listed firms within the same province, the same industry, and with the same products; yet when other firms’ ESG levels decrease, a significantly positive peer-dragging effect among firms within the same province and the same industry exists.
The remainder of this paper is organized as follows. Section 2 presents the theoretical framework and proposes the main hypotheses. Section 3 describes the regression model, methodology, and data. Section 4 presents the empirical results and analysis. Section 5 provides a further analysis. Section 6 contains the robustness and heterogeneity tests. Section 7 is the discussion. Additionally, Section 8 provides the conclusions and management implications.

2. Theoretical Framework and Hypotheses Development

2.1. Theoretical Framework

In order to understand the connotation of the peer effect of corporate ESG performance and to obtain theoretical support for the development of our hypothesis, we combine certain related theories from the fields of behavioral finance and corporate strategy management. Specifically, we focus on three main theories to construct the theoretical framework of this paper, which are stakeholder theory, signaling theory, and imitation strategy theory.

2.1.1. Stakeholder Theory

Stakeholder theory emphasizes that the purpose of corporate operation is no longer simply to maximize the interests of shareholders but to reconcile conflicts and interests among stakeholders (Freeman (2010)) [31]. Corporations attach importance to stakeholders so that they will not only be concerned about the improvement of corporate value but will also try to meet the needs of stakeholders, such as investors, buyers, employees, and suppliers. A greater investment of corporations in environmental responsibility will lead to a higher ESG score, which can confirm, to a certain extent, their good operating conditions and present a positive image to the outside market (Benlemlih (2019), Zahid et al. (2023)) [32,33]. The improvement in corporate ESG performance effectively enhances stakeholders’ trust in the enterprise’s development and increases the resource input provided from them. On the other hand, managers of corporations are more inclined to make comparisons on CSR behavior between their firms and other similar types of enterprises to maintain competitive advantages and establish a better impression in the minds of stakeholders (Liu and Wu (2016)) [21]. In addition, stakeholders can observe the situations of each firm and judge them from horizontal and vertical views. As pointed out by Zahid et al. (2022) [34], corporate ESG performance is an instrument used by a firm to manage, influence, or even manipulate stakeholders to gain their support. In short, corporations prefer to comove with their peers on CSR engagement and focus more on their or their counterparts’ environmental responsibility performance, like ESG rating, within the same region or same industry (Li and Wang (2022)) [22].

2.1.2. Signaling Theory

According to Ambarish et al. (1987) [35], signaling theory focuses on the interactions between the players, who are signal senders and receivers. Spence (2002) suggests that signal transmitting can mitigate the asymmetric information of corporations in financial and social aspects [36]. In the case of uncertainty, rational managers and decision makers consider that some corporations may have more (or better) information than themselves, so they may be inclined to adopt imitation behaviors to avoid risks and reduce losses (Banerjee (1992)) [37]. Corporate ESG performance can help to accumulate reputation capital, convey positive signals, and enhance market trust. Corporations pursue long-term interests and future development, which directly leads them to implement the same positivity in corporate ESG performance with their peers to maintain their reputation and competitiveness (Li and Wang (2022), Dong et al. (2023)) [22,23]. Moreover, the quality of signals, that is, the informativeness of corporate disclosed information, for example, some related features about corporate ESG performance, can also heavily draw attention from stakeholders and competitors, thereby affecting corporate profits (Zahid et al. (2023)) [33]. Meanwhile, corporate characteristics, such as media coverage, regulatory pressure, green innovation, and so on, can be regarded as the different factors to directly impact corporate environmental performance (Cheng and Liu (2018), Zheng and Ye (2023)) [3,18]. Based on signaling theory, the signal receiver’s ESG performance may have different reactions that depend on these peer firms’ ESG influential factors.

2.1.3. Imitation Strategy Theory

Imitation strategy refers to the business model of a corporation based on the imitation of the products or services provided by competitors, which is embodied in the implementation of the following strategy and the purpose of obtaining competitive advantages through learning and imitation (Hisrich et al. (1998)) [38]. According to the method of imitation and the degree of improvement in the process of imitation, this strategy can be divided into a reactive imitation strategy and a creative imitation strategy. The imitation behavior of corporations is mainly due to the competition situation within the industry. In such situation, adopting a stable price strategy can help enterprises to maintain their relative positions and reduce the threat of competitors, thus reducing the degree of competition from outside (Chen and MacMillan (1992)) [39]. Institutional theory also suggests that when the outcome of a management practice is uncertain, firms tend to imitate the choices of their peers [40]. As argued by Haunschild and Miner (1997) [41], there are three distinct modes of imitation based on different driving factors. First, frequency-based imitation, in which a firm imitates a behavior or practice that has previously been adopted by many other firms. Second, feature-based imitation, in which a firm imitates a behavior or practice adopted by an organization with certain characteristics. Third, outcome-based imitation, in which a firm imitates a behavior or practice that has previously produced demonstrably better results for other organizations. Zheng and Ye (2023) also found that direct imitation or indirect reference of peers in terms of a corporation’s green behaviors exist [18]. Therefore, according to reactive imitation strategy theory, if other firms in the same region or industry perform well in environmental responsibility and improve their financial performance or social reputation, the target corporation will also perform similar behaviors in order to obtain the same return. Inversely, if peers attempt to reduce their environmental responsibilities, the target corporation may be tempted to fall in line with them even if the actions are environmentally unfriendly.

2.2. The Peer Effect of Corporate ESG Performance in Different Peer Groups

In the above theoretical analysis, stakeholder theory and imitation strategy theory establish support to put forward the hypothesis about the peer effect of corporate ESG performance. The literature shows that firms tend to take the same strategic actions or technology upgrades as their close peers that have similar business modes and organizational structure. Li et al. (2020) suggest that private firms without antecedent experience in private takeovers of state ownership will follow their peers’ activities [42]. Wu et al. (2023) mention that if firms belong to common institutional ownership networks, they have high incentives to mimic others’ green innovation [43]. The interpretations are that the same ownership helps firms obtain green innovation information from each other and contributes to maintaining competitive awareness between them. Park et al. (2017) empirically confirm that the peer effect in firm investment activities and more financially constrained firms depend to a greater degree on peers’ investment policies [44]. From an external environment perspective, Li et al. (2023) argue that firms have positive reactions to their peers’ digital innovation behaviors, which are amplified by firms’ strong social network [45]. Some scholars mainly concentrate their research on firms’ peer effect in two channels, namely information mechanisms and competition mechanisms. As pointed out by Yuan et al. (2022) [46], the tone of the annual reports of peer firms significantly promotes a firm’s innovation investment when the information disclosure of peer firms and the degree of industry complexity are higher. Moreover, firms are inclined to choose their peers as the main strategic focal objects that have the same market environment and better information communication. Liu et al. (2022) suggest that social learning and competition are two major channels of the peer effect and observe that firms are keener to invest in R&D when their competitors in the same industry disclose more about innovation in MD&A [47]. Additionally, knowledge spillover, such as the adoption of new technology, is another impetus of the peer effect among firms in the same region and industry [48]. Consequently, firms are more sensitive to peers’ strategic activities, especially those which belong to the same region, same industry, or have the same products.
Heavy-pollution industry firms endure the pressure of higher environmental protection and technology transformation requirements, which have stronger peer effects in terms of green innovation input and environmental strategies. Tan et al. (2022) investigate the existence of the peer effect of green innovation among firms within high pollution, high energy intensity, and overcapacity industries [27]. They find that green innovation in high-pollution enterprises not only promotes the green innovation of companies in the same industry but also positively influences the quality of peers’ green innovation in non-high-pollution enterprises in the same peer group. Yang et al. (2022) find that other firms’ green financing behaviors in the same industry or the same region significantly reduce external information uncertainty and increase a firm’s green financing development [19]. Siedschlag and Yan (2021) demonstrate that firms’ environmental investments are highly correlated to peers’ investments in environmental protection within the same industry or the same district [20]. Currently, corporate ESG performance is being well-popularized in heavy-pollution industry firms’ transformation management and corporate governance. Positive ESG news may reduce these firms’ financing difficulties and cost in the secondary capital market [49]. High-quality ESG performance can also affect corporate value, financial performance, and capital allocation efficiency [50,51]. As a result, based on social learning and information communication effects, which come from signaling and imitation strategy theory, heavy-pollution industry firms imitate peers in ESG management, especially those within the same province, within the same industry, and with the same products, to improve their ESG performance. Motivated by the discussion of the above literature, the following Hypothesis 1 is proposed.
Hypothesis 1 (H1).
Corporate ESG performance has a significantly positive peer effect among heavy-pollution industry listed firms within the same province, within the same industry, and with the same products.

2.3. The Impacts of the Peer Effects of Media Coverage, Regulatory Pressure, and Green Innovation on Corporate ESG Performance

Moreover, corporate ESG performance is affected by many internal and external characteristics of firms. First, the reputation effect is an essential influence factor for firms to improve their ESG management level. Many studies find that a firm’s ESG or CSR development has direct positive impacts on corporate brand credibility and corporate reputation (Stanaland et al. (2011), Hur et al. (2014)) [52,53]. Some studies suggests that a higher rating in ESG can help firms more positively maintain relationships with employees, increase the loyalty of customers, enhance the confidence of investors, and broaden cooperation with suppliers (Lin-Hi and Blumberg, (2018)) [54]. A firm’s CSR advertising that can deeply improve customers’ attitudes and emotions towards the brand [55]. Zhang et al. (2021) argues that a firm’s CSR disclosure effectively protects a firm’s reputation when there are public issues such as financial restatements [56]. For heavy-pollution industry companies, the improvement of ESG development is a promising approach to changing public opinion and reconstructing a firm’s reputation. According to legitimacy theory, these firms are facing pressure from the subjective attitude of external stakeholders, which leads them to take ESG performance as an important component of legitimacy management measures (Brammer and Pavelin (2006), Boiral (2013)) [57,58]. Because of that, the environmental activities of heavy-pollution industry firms will be extremely affected by public attention and monitoring (Luo et al. (2012)) [59]. Cheng and Liu (2018) and Braam et al. (2016) empirically find that corporate environmental performance is negatively associated with the environmental reporting and positively associated with the degree of external visibility, such as public attention and media coverage [3,60]. Following this sort of literature provided above, we suggest that a firm’s ESG performance is not only affected by its own public media attention but is also influenced by the peer effect from the level of public media attention of other firms.
Second, environmental regulation is another stimulus for firms to carry out environmentally friendly production and promote higher environmental performance. The Porter hypothesis holds that a suitable environmental regulation increases a corporation’s green activities and investments and then enhances a firm’s environmental and competitive performance [61]. In line with this argument, some scholars have empirically analyzed the relationship between environmental regulation and a firm’s environmental behaviors. The empirical results of You et al. (2019) and Zhang et al. (2020) show that environmental regulation would likely drives/inhibits the ecological innovation behaviors of China’s industrial listed firms [62,63]. Other studies, such as Zhao et al. (2018) and Wang et al. (2019), represent that environmental regulation positively affects a firm’s green total factor productivity in carbon-intensive industrial sectors within a certain level [64,65]. From the views of the government, environmental regulation at a reasonable level is an important instrument to make firms engage in sustainable development in heavy-pollution and energy-consuming industries [61]. Meanwhile, environmental regulation can also become the impetus of a firm’s ESG management practice. Lu and Cheng (2023) explore the influences of the revised Environmental Protection Law implemented in China on a firm’s ESG performance and find the crucial meanings for encouraging a firm’s ESG improvement in regulation policies [66]. Similarly, Jiménez-Parra et al. (2018) argue that environmental regulation reinforces the positive effect of corporate social responsibility on reducing air pollution [67]. Zeng et al. (2022) also find that public regulations of atmospheric quality help the cultivation of CSR-based entrepreneurship in heavily polluting firms [68]. Hence, in accordance with these studies, we give the hypothesis that the intensity of environmental regulation on both a firm itself and peers have significant impacts on corporate ESG performance.
Third, green innovation capability is also a significant internal source of a firm’s ESG practice and development. The level of a firm’s green innovation reflects a higher executive’s environmental concepts and competitive senses, which can exhibit a firm’s technical strength, bring more concerns from investors, and generate good reactions in the capital market. This will give firms with a better public evaluation in all three aspects of environmental, social, and governance. Based on panel data from China’s growth enterprise market listed companies, Zheng et al. (2022) gain the result that green innovation significantly improves a firm’s ESG scores [69]. Wang et al. (2023) argue that green innovation dampens the negative effect of environmental uncertainty on firm’s ESG performance [70]. Moreover, a firm’s green innovation capability and ESG performance have coordinated comovement effects on corporate development. As Zheng et al. (2023) suggested, corporate ESG performance moves together with green innovation output in clean industry firms and has a long-run causal link between these two factors in pollution industry firms [71]. However, the competition between peers could cause a crowding-out effect of other firms’ green innovation on a corporation’s environmental performance. Coad and Teruel (2013) investigate the correlations of the growth rates of competing firms and identify significant negative effects of rivals’ growth on a firm’s growth [72]. Cao et al. (2019) point out that peers which are hard to catch up with the voting firms in CSR ratings will significantly lower their financial performance [29]. According to these studies, we put forward the hypothesis that green innovation capability has a positive effect on a firm’s ESG performance but a negative peer effect on other firms’ ESG performance.
According to signaling theory, a firm’s features concerning media coverage, regulatory pressure, and green innovation capability can be regarded as signals, which transmit their own ESG information to other firms and have a significant impact on peers’ ESG performance. Therefore, we employ a mechanism analysis to investigate the impacts in the aspects of peer effects of other firms’ public media attention, regulatory pressure, and green innovation on corporate ESG performance. By using the spatial econometric decomposition measure, we detect the direct effect and peer indirect effect of negative web news, environmental punishment, and green patents on corporate ESG performance. Based on the discussions above, Hypotheses H2a, H2b, and H2c are proposed as follows.
Hypothesis 2a (H2a).
The increase in other firms’ negative web news has a significantly positive peer effect on corporate ESG performance among heavy-pollution industry listed firms within the same province, within the same industry, and with the same products.
Hypothesis 2b (H2b).
The increase in other firms’ environment-related penalties has a significantly positive peer effect on corporate ESG performance among heavy-pollution industry listed firms within the same province, within the same industry, and with the same products.
Hypothesis 2c (H2c).
The increase in other firms’ green patents has a significantly negative peer effect on corporate ESG performance among heavy-pollution industry listed firms within the same province, within the same industry, and with the same products.

2.4. The Peer Effect of Corporate ESG Performance in Different ESG Level Changing Statuses

Furthermore, based on imitation strategy theory, firms may have different reactions to their counterparts’ business strategies, which lead to various results of peer effects among firms in different situations. Shroff et al. (2017) argue that peer information influences have time-varying externalities that depend on the amount of information available [73]. The degree of industrial competition and concentration significantly affects the strength or weakness of peer effects between different firms. Tan et al. (2022) suggest that the fiercer the industrial competition and stronger financing constraint, the lower the peer effect of green innovation among firms, yet the higher the marketization, the stronger the peer effect for green industries [27]. High competition could generate a pulling effect among neighbors, while low competition could cause a dragging effect among them [74]. In addition, based on peers’ good or poor performance, firms will make different decisions, such as imitating or avoiding the same activities. If their peers have a better performance, firms are more likely to mimic their operational strategies. Inversely, the positive peer effect among firms could become weak when peers display worse performance. Cho and Muslu (2021) find that firms will increase (decrease) capital investments and inventory when they observe that counterparts have more optimistic (pessimistic) tones in their management discussion and analysis (MD&A) publications [75]. Compared to good scenarios, firms are more sensitive to the bad situations of their peer firms due to their conservative senses (Fan et al. (2022)) [76]. The empirical outcomes of Cho et al. (2020) show that when peer companies notice negative results of the accounting inspections for a leading firm in their industry, they will raise the accounting quality level to pay more attention to their financial risk [77]. In consequence, we predict that the peer effect of corporate ESG performance has two different statuses when other firms’ ESG levels increase or decrease. These arguments lead to two more hypotheses, Hypotheses H3a and H3b.
Hypothesis 3a (H3a).
When other firms’ ESG levels increase, corporate ESG performance has a significantly positive peer-pulling effect among the heavy-pollution industry listed firms within the same province, within the same industry, and with the same products.
Hypothesis 3b (H3b).
When other firms’ ESG levels decrease, corporate ESG performance has a significantly positive peer-dragging effect among the heavy-pollution industry listed firms within the same province, within the same industry, and with the same products.

3. Methodology and Data

3.1. The Spatial Econometric Methodology

3.1.1. The Spatial Autoregressive Model and Spatial Durbin Model

Following Li et al. (2021) [14] and Grieser et al. (2022) [15], we present a spatial econometrics framework for estimating the peer effects of corporate ESG performance. This approach exploits the spatial linkage nature of different peer groups among firms to identify a series of common economical information. In this study, we first use the spatial autoregressive model (SAR) as a basic econometric model to capture the peer effects among firms. The key parameters in spatial econometric models are ρ , which represents the magnitude of the spatial effect or peer effect of dependent variables, and the coefficient vector β , measuring the direct impact of independent variables. The SAR model is expressed as follows:
y = ρ W y + X β + ε
where ε ~ N ( 0 , σ 2 I n ) is the random error vector; y denotes the dependent variable (i.e., corporate ESG performance); W is the spatial weight matrix, which describes the different peer connection groups among firms; and X is a matrix of explanatory variables. The spatial lagged variable W y describes the integrated effect of one firm’s ESG performance through its adjacent spatial counterparts. The SAR model is built to measure the average integrated effects, that is, the peer effects, of the changes of peer firms’ ESG performance on one firm’s ESG performance in different peer linkage frameworks.
To further detect the influence mechanisms in the peer effects of corporate ESG performance from various aspects, such as media attention, regulatory pressure, and green innovation ability, we employ the spatial Durbin model (SDM), which not only contains the spatial effect of the dependent variable but also considers the spatial effects of core explanatory variables. The SDM model is extended from the SAR model by including the spatial lagged variables of the independent variables. The SDM model is expressed as follows:
y = ρ W y + X β + W X γ + ε
where ε ~ N ( 0 , σ 2 I n ) is the random error vector; y denotes the dependent variable; W is the spatial weight matrix; and X is a matrix of explanatory variables. β and γ are the coefficient vectors of independent variables and spatial lags of independent variables, respectively. As argued by Elhorst (2014) [78], the SDM model cannot directly estimate all impacts that contain both spatial and non-spatial effects from explanatory variables at the same time.
In order to comprehensively analyze the influences of explanatory variables, the partial differential method can be used to decompose the total effect of the explanatory variables on the dependent variable in the SDM model into direct effects and peer indirect effects based on the sources and patterns of these influence effects. In our study, the former can be seen as the change in a firm’s ESG performance influenced by the changes in its own explanatory variables, such as a firm’s financial characteristics, public and media attention, and green innovation input. The latter is the spatial effect of explanatory variables, which is the change in a firm’s ESG performance influenced by the changes in peer firms’ explanatory variables. To obtain the calculated modes of the direct effect and peer indirect effect, the SDM model in Equation (2) is transferred to the general form as:
y = ( I ρ W ) 1 n ι n + I ρ W 1 X β + W X γ + I ρ W 1 ε
Then, the partial differential equation of the dependent variable with respect to the k-th explanatory variable can be given as:
y X 1 k   y X 2 k   y X n k = y 1 X 1 k y 1 X 2 k y 2 X 1 k y 2 X 2 k y 1 X n k y 2 X n k y n X 1 k y n X 2 k y n X n k = ( I ρ W ) 1 β k ω 12 γ k ω 21 γ k β k ω 1 n γ k ω 2 n γ k ω n 1 γ k ω n 2 γ k β k
As shown in Equation (4) above, the k-th explanatory variable’s direct effect is the average of the main diagonal elements in the rightmost matrix, and the k-th explanatory variable’s spatial indirect effect is the average of the all other elements in the rightmost matrix, which equals 1 n 2 i = 1 n j = 1 n ω i j γ k . By introducing this type of explanatory variables’ spatial indirect effect, it is possible to capture the influence mechanisms of the peer indirect effect of the dependent variable in the SDM model. In short, we can further detect whether corporate ESG performance is impacted by other counterparts’ public media attention level, regulatory pressure, and green innovation ability.

3.1.2. The Spatial Autoregressive Probit Model

By referring to Brasington and Parent (2017) and Martinetti and Geniaux (2017) [24,79], we implement a binary spatial autoregressive probit model when the dependent variable follows a discrete choice process. In this case, the dependent variable is a binary 0–1 variable and the probability of the situation P r ( y = 1 ) is dependent on explanatory variables. Therefore, the binary dependent variable can be used to represent whether the corporate ESG performance is changed in the standard form of the SAR model, which is given by:
y * = ρ W y * + X β + ε
where ε ~ N ( 0,1 ) ; y * is the latent variable with y = 1   i f   y * > 0 and y = 0   i f   y * 0 ; ρ W y * denotes the spatial lagged variable; and W is spatial weight matrix. If ρ = 0 , the spatial probit model in Equation (5) reduces to the standard probit model. The probit form of the dependent variable implies that y = 1 when the corporate ESG performance increases or decreases, and y = 0 when the corporate ESG performance remains the same value in our empirical model.
In addition, the multivariate ordered spatial probit model is an extended form of the binary spatial probit model, which considers that the observed variable is more than two statuses. This setting, based on the ordered observed variable in the model, allows us to detect the peer effect of the ESG performance in the frameworks of nine different ESG levels from low to high. Accordingly, we use the ordered integer numbers that matched with different corporate ESG levels as an alternative dependent variable in the ordered spatial probit model for the robustness test about the peer ESG performance effect. For an ordered probit, the observed dependent variable is expressed as:
y = k ,   i f   δ k 1 < y * δ k ,   f o r   j = 1 ,   2 ,   ,   J
where the dependent variable y is a censored form of latent variables y * and the possible results of y are integers between 1 and K (and K = 9 , in our model), which correspond to the matched ESG levels from the lowest-level C to the highest-level AAA. The latent variable y * is within the change ranges δ 0 < δ 1 < < δ K 1 < δ K , where δ 0 = and δ K = + . Therefore, the probabilities of these k can be expressed as follows:
Pr y = 1 X = Φ δ 1 X β Φ ( δ 0 X β ) Pr y = 2 X = Φ δ 2 X β Φ ( δ 1 X β ) Pr y = K X = Φ δ K X β Φ ( δ K 1 X β )
where Φ · is the cumulative distribution function of the standard normal distribution. Unlike the maximum likelihood estimation (MLE) method of the SAR and SDM models, as argued by Smith and LeSage (2004) [80], we employ the Markov chain Monte Carlo (MCMC) method to estimate the two kinds of spatial probit models. Based on the Bayesian estimation framework, the parameters of the estimation function correspond to prior and posterior distributions, respectively. Subsequently, the MCMC method provides regression outcomes by simulating draws from the complete set of conditional distributions for parameters in the spatial probit model [81].

3.1.3. The Construction of Spatial Weight Matrix

The spatial weight matrix is a crucial component in the spatial econometric model, which intuitively demonstrates the linkage and connection between different spatial units. In this paper, we measure the peer effects of corporate ESG performance in different peer relationships by constructing three types of spatial weight matrices. Each of these captures corporations’ structures of spatial dependency in three matching situations and corresponds to various frameworks of the corporations’ connections, such as social relationships, economic relationships, or geographic relationships. The elements of the spatial weight matrix illustrate the relationships between different corporations based on various construction principles in three peer corporation groups. The spatial weight matrix W is composed of zero diagonal elements and other exogenous elements w i , j , which equals to the correlation coefficient between corporations i and j set in some way. The spatial weight matrix is as follows:
W = 0 w 1,2 w 2,1 0 w 1 , n w 2 , n w n , 1 w n , 2 0
In this study, three types of spatial weight matrices are used to represent various peer firm groups. First, we construct a geography weight matrix W1 to indicate the location relationships between heavy-pollution industry listed firms. If two different listed firms’ registered addresses are in the same province, the element of spatial weight matrix w i j is equal to one, otherwise it is zero. Firms within the same province may have stronger linkages among each other than those not in the same province because of the similar strength of government supervision and market environment. Thus, the geographic weight matrix W1 is used to detect the peer ESG performance effect between firms within the same province in our empirical models. And the headquarters’ locations of these listed corporations are based on their CSRC registered information. Second, we build an industry weight matrix in which the element equals one if the two different matched corporations belong to the same industry, otherwise it is zero. The industry weight matrix W2 can denote the proximity of the corporation industries. According to the CSRC industry classification standard, these heavy-pollution corporations can be classified into 20 industries. Firms within the same industry may face the same industry norms and regulatory requirements. Therefore, we use the industry weight matrix to estimate the peer ESG performance effect between firms within the same industry in the spatial econometric models. Third, the product weight matrix W3 is constructed to present the relationship of two different corporations that have the same products. According to the CSRC listed firm’s main product information, if two matched firms have same main product, the element of the spatial weight matrix w i j is equal to one, otherwise it is zero. The product weight matrix W3 can reflect the direct competitive relationship between those firms that have the same products. All CSRC listed firm’s data that are used to construct spatial weight matrices are collected from the WIND database. Moreover, all three spatial weight matrices should be typically row-standardized, that is, for each i have j w i , j = 1 , to make sure the spatial lagged variables may be interpreted as the weighted average of the neighbor units [78].

3.2. Research Design

3.2.1. Data and Variables Selection

The judgement standard of heavy-pollution industries in this paper is mainly based on the Guidance for Environmental Information Disclosure of Listed Companies published by the Ministry of Ecology and Environment of China in September 2010 (see website: https://www.mee.gov.cn/gkml/sthjbgw/qt/201009/t20100914_194484.htm (accessed on 28 May 2023)). In line with Zhou et al. (2021) [82], we select 20 heavy-pollution industries and classify them using CSRC two-digit codes, including electricity, heat production and supply (D44); textiles (C17); textiles, clothing, and apparel (C18); the nonmetallic mineral products industry (C30); ferrous metal mining (B08); ferrous metal smelting and rolling processing (C31); chemical fiber manufacturing (C28); chemical raw materials and chemical products manufacturing (C26); the metal products industry (C33); wine, beverages, and refined tea manufacturing (C15); mining auxiliary activity industry (B11); the coal mining and washing industry (B06); leather, fur, feathers, and their products and the footwear industry (C19); the oil and gas extraction industry (B07); petroleum processing, coking and nuclear fuel processing (C25); the rubber and plastic products industry (C29); pharmaceutical manufacturing (C27); nonferrous metal mining and processing (B09); the nonferrous metal smelting and rolling industry (C32); and the paper and paper products industry (C22). Therefore, we choose 681 A-share listed corporations from the heavy-pollution industries above after excluding the incomplete and abnormal data samples, such as long suspended and consecutive loss (ST and *ST category), unlisted or delisted, or without ESG ratings in the year from 2012 to 2021.
Following Lin et al. (2021) and Feng et al. (2022) [83,84], we employ the Sino-Securities ESG Index as the proxy of corporate ESG performance. The Sino-Securities ESG Index is a multi-dimension evaluation system, which can effectively reflect the information from listed corporations’ annual reports and ESG disclosure reports. This rating methodology can calculate a weighted score for each corporation regarding ESG performance, which makes it a good comparison between different corporations. Compared to other domestic third-party ESG rating models, the Sino-Securities ESG Index not only refers to the global mainstream ESG rating framework but also integrates the characteristics of Chinese listed firms, thereby it can provide a comprehensive evaluation from a total of three first-level indicators, 14 s-level indicators, 26 third-level indicators in the three aspects of environment, society, and governance. Moreover, the Sino-Securities ESG Index covers the samples of most A-share listed firms in all industries from 2012 to 2022, which can help us to further analyze the relationship of ESG performance among different firms in different periods. The Sino-Securities ESG Index is divided into nine levels, from the highest-level AAA to the lowest-level C, which represent each ESG level from the excellent rating to the poor rating, respectively. We collect the Sino-Securities ESG Index of 681 A-share listed corporations in heavy-pollution industries over the 10-year sample period from the WIND database. For the convenience of the logarithmic transform of variable, we manually assign the numbers from 9 to 1 to match every ESG rating from AAA to C. The score denotes that the higher the number, the better the performance of corporate ESG performance in that year.
Table 1 presents the definitions of all variables in this paper. The main dependent variable in this paper is the ESG performance (ESG_perfomi,t) of 681 listed corporations in heavy-pollution industries, which is the natural logarithm of the manually assigned number from 9 to 1 of a firm’s Sino-Securities ESG level. We also use two other binary dependent variables (ESG_levelupi,t and ESG_leveldowni,t) to demonstrate the direction change of the corporate ESG rating in the further analysis section. Specifically, if corporate ESG rating increased/decreased from that of the previous year, the element of the dependent variable equals one, otherwise it is zero. Moreover, the Sino-Securities ESG level (ESG_leveli,t) is used as an alternative dependent variable for the robustness test. The three variables ESG_levelupi,t, ESG_leveldowni,t, and ESG_leveli,t are all ordered dependent variables, which can be estimated in the spatial autoregressive ordered probit models presented in Section 3.1.2. This paper is focused on the peer effect of corporations’ ESG performance and its influencing mechanism, which are represented by the spatial lagged variables of dependent variable j = 1 n W i , j y j , t and core independent variable j = 1 n W i , j X j , t in the SAR model, SDM model, and SAR ordered probit model, such as in Equations (1), (2), and (5).
The core explanatory variables in our research, respectively, correspond to three aspects, namely public media coverage and attention, environmental regulatory pressure, and a firm’s green innovation ability. We are interested in both the direct effect of these three explanatory variables and their special impacts on the peer effect in corporate ESG performance. First, in accordance with Cheng and Liu (2018) [3], we choose the negative web news reports related to each firm as the proxy of public media coverage and attention. The rise in negative web news reports may have a negative impact on a firm’s ESG performance and rating. This variable (Neg_newsi,t) is measured by the natural logarithm of the total number of negative web news reports about a firm during the year. Second, the high level of environmental supervision by the government may lead to firms promoting ESG performance itself [85]. But suffering environmental punishment may lower its ESG performance. Hence, we use whether a firm has been punished for environmental protection as the proxy of environmental regulatory pressure. This is a dummy variable (Env_punishi,t) that is equal to one if a firm is punished due to environmental issues during the year and zero otherwise. Finally, the green patent (Green_patenti,t) is utilized as the proxy of a firm’s green innovation ability, following Cui et al. (2022), which is measured by the natural logarithm of the total number of a firm’s registered green patents over the year [86]. To avoid the minus infinity of natural logarithm, the total number of a firm’s negative web news or registered green patents have one added to them in that year.
We also introduce a series of control variables into our empirical models, for instance, a corporation’s financial characteristics, profitability, and development prospects, and a firm board’s governance mechanisms. In line with Braam et al. (2016) [60], the corporation’s financial characteristics in this paper include the return on assets and book leverage. Return on assets (ROAi,t) is a measure of the corporation’s capital performance which is equal to fiscal year-end net income divided by total assets. And the leverage ratio (Levi,t) is measured by corporation’s total year-end debt divided by year-end total assets. Following Pan et al. (2022) [16], we use the profit growth ratio (Growthi,t) as the proxy of profitability and development prospects, which is the growth rate of the corporation’s year-end net profit. Compared to those corporations with fewer independent board members, firms with more independent, non-executive directors might have a stronger ESG information disclosure will. And firms with good corporate governance have better ESG performance than those with poor governance (Haque and Ntim (2018)) [87]. Therefore, based on these related works, we employ the large shareholders’ ratio and the strength of independent directors to control a firm board’s governance level. The large shareholders’ ratio (Firsti,t) is identified via the total shareholding ratio of the largest ten shareholders. The strength of the independent director (Indpi,t) is expressed via the proportion of independent directors on the board of directors. The data of explanatory variables and control variables are sourced from the Chinese Research Data Services Platform (CNRDS). Our sample range is from 2012 to 2021 and contains a total of 6810 observations. The summary statistics of all variables are shown in Table A1.

3.2.2. Regression Models

The research object of this paper is the peer effect of corporate ESG performance among 681 of China’s A-share listed firms within 20 heavy-pollution industries from 2012 to 2021. First, we conducted a panel model regression by including core explanatory variables and control variables, which are related to corporate ESG performance. The baseline panel model setting is as follows:
E S G _ p e r f o m i , t = β 1 N e g _ n e w s i , t + β 2 E n v _ p u n i s h i , t + β 3 G r e e n _ p a t e n t i , t   + β 4 R O A i , t + β 5 L e v i , t + β 6 G r o w t h i , t + β 7 F i r s t i , t + β 8 I n d p i , t   + F i r m i + Y e a r t + ε i , t
for i = 1,2 , , N and t = 1,2 , , T denote the 681 heavy-pollution industry listed corporations and 10 years, respectively, and the E S G _ p e r f o m i , t is the n × 1 dependent variable vector, which is the heavy-pollution industry corporate ESG performance.
Second, to investigate the peer effect of corporate ESG performance, based on the spatial autoregressive model framework in Section 3.1.1, we set the following SAR model:
E S G _ p e r f o m i , t = ρ j = 1 n w i , j E S G _ p e r f o m j , t + β 1 N e g _ n e w s i , t + β 2 E n v _ p u n i s h i , t + β 3 G r e e n _ p a t e n t i , t + β 4 R O A i , t + β 5 L e v i , t + β 6 G r o w t h i , t + β 7 F i r s t i , t + β 8 I n d p i , t + F i r m i + Y e a r t + ε i , t
where i , j refer to firms and t denotes the year. j = 1 n w i , j E S G _ p e r f o m j , t is the spatial lagged variable of the dependent variable E S G _ p e r f o m i , t , w i , j is the elements of different spatial weight matrices, and ρ is the spatial spillover coefficient that denotes the intensiveness of peer effects on corporate ESG performance. This regression model is constructed to empirically test the Hypothesis 1 (H1): The corporate ESG performance has a significantly positive peer effect among the heavy-pollution industry listed firms within the same province, within the same industry, and with the same products.
Meanwhile, we extend the SAR model as the SDM model to explore both the direct effect and peer indirect effect of the core explanatory variables, which is built as follows:
E S G _ p e r f o m i , t = ρ j = 1 n w i , j E S G _ p e r f o m j , t + β 1 N e g _ n e w s i , t + β 2 E n v _ p u n i s h i , t + β 3 G r e e n _ p a t e n t i , t + γ 1 j = 1 n w i , j N e g _ n e w s j , t + γ 2 j = 1 n w i , j E n v _ p u n i s h j , t + γ 3 j = 1 n w i , j G r e e n _ p a t e n t j , t + β 4 R O A i , t + β 5 L e v i , t + β 6 G r o w t h i , t + β 7 F i r s t i , t + β 8 I n d p i , t + F i r m i + Y e a r t + ε i , t
where j = 1 n w i , j N e g _ n e w s j , t , j = 1 n w i , j E n v _ p u n i s h j , t , and j = 1 n w i , j G r e e n _ p a t e n t j , t denote the spatial lags of core explanatory variables, and the coefficients γ 1 , γ 2 , and γ 3 represent the spatial effects of peer firms’ negative web news, environmental punishment, and green patent. The coefficient γ 1 in the SDM model empirically tests the Hypothesis 2a (H2a): The increase in other firms’ negative web news has a significantly positive peer effect on corporate ESG performance among the heavy-pollution industry listed firms within the same province, within the same industry, and with the same products. The coefficient γ 2 in the SDM model empirically tests the Hypothesis 2b (H2b). The increase in other firms’ environment-related penalties has a significantly positive peer effect on corporate ESG performance among the heavy-pollution industry listed firms within the same province, within the same industry, and with the same products. The coefficient γ 3 in the SDM model empirically tests the Hypothesis 2c (H2c). The increase in other firms’ green patents has a significantly negative peer effect on corporate ESG performance among the heavy-pollution industry listed firms within the same province, within the same industry, and with the same products.
Third, to further analyze the peer-pulling effect and peer-dragging effect of corporate ESG performance in two situations when a firm’s ESG level increases or decreases, according to Martinetti and Geniaux (2017) [79], we employ the binary spatial autoregressive probit model with three different weight matrices, namely the geography matrix W1, the industry matrix W2, and the product matrix W3. Based on the presentation in Section 3.1.3, two alternative binary dependent variables, ESG_levelupi,t and ESG_leveldowni,t, are utilized to demonstrate whether the corporate ESG level has increased or decreased. The data range is from 2013 to 2021 and the samples of 2012 are eliminated because the ESG level in this year is set as the benchmark. The ordinary probit model and the spatial autoregressive probit model with binary dependent variables ESG_levelupi,t are constructed as follows:
E S G _ l e v e l u p i , t = β 1 N e g _ n e w s i , t + β 2 E n v _ p u n i s h i , t + β 3 G r e e n _ p a t e n t i , t + β 4 R O A i , t + β 5 L e v i , t + β 6 G r o w t h i , t + β 7 F i r s t i , t + β 8 I n d p i , t + F i r m i + Y e a r t + ε i , t
E S G _ l e v e l u p i , t = ρ j = 1 n w i , j E S G _ l e v e l u p j , t + β 1 N e g _ n e w s i , t + β 2 E n v _ p u n i s h i , t + β 3 G r e e n _ p a t e n t i , t + β 4 R O A i , t + β 5 L e v i , t + β 6 G r o w t h i , t + β 7 F i r s t i , t + β 8 I n d p i , t + F i r m i + Y e a r t + ε i , t
where the 0–1 binary variable E S G _ l e v e l u p i , t denotes whether corporate ESG level in the year t is moved up compared with the former year. If the corporate ESG rating moved up than that in the former year, the element of dependent variable equals one, otherwise it is zero. In equation (13), j = 1 n w i , j E S G _ l e v e l u p i , t is the spatial lag of explained variable and the spatial coefficient ρ represents the magnitude of peer effect. The core independent variables and control variables in both equations are identical to those in the baseline panel model, the SAR model, and the SDM model. We also consider firm fixed-effect and year fixed-effect in these two models as the same as the previous models. This spatial autoregressive probit model empirically tests Hypothesis 3a (H3a): When other firms’ ESG levels increase, the corporate ESG performance has a significantly positive peer-pulling effect among the heavy-pollution industry listed firms within the same province, within the same industry, and with the same products.
Moreover, the ordinary probit model and the spatial autoregressive probit model with binary dependent variables E S G _ l e v e l d o w n i , t are also constructed as follows:
E S G _ l e v e l d o w n i , t = β 1 N e g _ n e w s i , t + β 2 E n v _ p u n i s h i , t + β 3 G r e e n _ p a t e n t i , t + β 4 R O A i , t + β 5 L e v i , t + β 6 G r o w t h i , t + β 7 F i r s t i , t + β 8 I n d p i , t + F i r m i + Y e a r t + ε i , t
E S G _ l e v e l d o w n i , t = ρ j = 1 n w i , j E S G _ l e v e l d o w n j , t + β 1 N e g _ n e w s i , t + β 2 E n v _ p u n i s h i , t + β 3 G r e e n _ p a t e n t i , t + β 4 R O A i , t + β 5 L e v i , t + β 6 G r o w t h i , t + β 7 F i r s t i , t + β 8 I n d p i , t + F i r m i + Y e a r t + ε i , t
where the 0–1 binary variable E S G _ l e v e l d o w n i , t denotes whether corporate ESG level in the year t is decreased compared with the previous year. If the corporate ESG rating is lower than that in the previous year, the element of dependent variable equals one, otherwise it is zero. Both the core independent variables and control variables are the same as in Equation (12), and firm fixed-effect and year fixed-effect are also considered in the models. This regression model is built to empirically test Hypothesis 3b (H3b): When other firms’ ESG levels decrease, the corporate ESG performance has a significantly positive peer-dragging effect among the heavy-pollution industry listed firms within the same province, within the same industry, and with the same products.

4. The Empirical Results of Peer Effect of Corporate ESG Performance and Mechanism Analysis

4.1. The Baseline Panel Model of Corporate ESG Performance

Table 2 reports the OLS estimation results of corporate ESG performance of the panel model in Equation (9). In columns (1) and (2), we include firm-fixed effect and year-fixed effect, where the significant results of Hausman’s statistic tests denote that the fixed effects should be considered in the models. For comparison, the regressions in columns (3) and (4) are the panel model OLS estimations with the random effect. And we further include the control variables in columns (2) and (4), such as a corporation’s return on assets (ROAi,t), book leverage ratio (Levi,t), profit growth ratio (Growthi,t), large shareholders’ ratio (Firsti,t), and strength of independent director (Indpi,t), as in Section 3.2.1, to control the impacts from firm’s finance characteristics, sustainable profitability, and governance capacity on corporate ESG performance. There are 6810 observations of each model, and the standard errors of estimators are clustered at firm level.
In Table 2, the core explanatory variables are all significant at least in the 5% confidence level both in fixed-effect and random-effect panel models. We find that the negative web news and environmental punishment negatively influence the ESG performance of the corporation itself. Consistent with Pan et al. (2022) and Gong et al. (2021) [88,89], the increase in negative web news and punishments by the environmental regulator weaken a corporation’s public reputation effect and then harm the corporate ESG performance. Cheng and Liu (2018) suggest that the environmental performance of heavy-pollution industry listed corporations with a higher environmental pressure are more sensitive to negative media coverage and news [3]. On the other hand, we notice that the corporate ESG performance is strengthened with the total number of green patent registrations. In line with Hao and He (2022) [90], the reinforcement of green innovation capacity positively promotes corporate ESG performance, because the heavy-pollution industry listed firms are more motivated to input green innovation to improve the environmental protection level of their production processes. Moreover, it is worth checking the estimates of coefficients for other control variables in panel models (2) and (3). First, we observe that the estimation outcomes of corporation’s return on assets are positively significant, indicating that the better a firm’s financial profitability, the better the ESG performance. This result is the same as Sandberg et al. (2023), where higher ESG ratings are associated with a firm’s better financial performance [91]. Firms with higher asset profitability can provide more financial support and impetus for improving their ESG performance. Second, the rise in a firm’s leverage negatively correlates with ESG performance but is insignificant. Some studies, such as Lemma et al. (2022) [92], point out that corporate ESG activities are inversely associated with its book leverage ratio, yet there might not be a consistent result regarding the relationship between ESG performance and leverage. This difference is due to the heterogeneity within different corporations and industries. Limkriangkrai et al. (2017) suggest firms with high ESG ratings tend to increase their leverage [93]. According to Mahmood et al. (2023) [94], there is a negative and significant correlation between leverage and corporate social responsibility in low-leverage corporations, yet this result is insignificant in high-leverage corporations. Third, we also find that the increase in profit growth ratio is not remarkably connected with corporate ESG performance. As argued by Bellandi (2023) [95], an unconventional problem of imbalance and discordance exists between two dimensions of a firm’s financial profit growth and ESG sustainable performance. Finally, the regression coefficients of the large shareholders’ ratio and the strength of independent directors are both positively significant, which indicates that the stability of the shareholding structure and the rise of governance transparency enhance the listed firm’s governance ability and then improve its ESG performance [3]. In addition, it was found that there were not any obvious changes in estimators and significance between the four panel models, indicating that the empirical regression results of the baseline model in Equation (9) are sound and robust.
Before engaging the estimation of spatial econometric models, as suggested by Elhorst (2014) [78], it is necessary to employ the spatial correlation statistic tests in panel models with different weight matrices. Table A2 shows the results of Moran’s residual test and the Lagrange multiplier (LM) test. Moran’s residual test was used to check the spatial dependency of panel models’ residuals in Equation (9), which is able to detect whether the panel models ignore the spatial correlation of variables. We find that the Moran’s test results all reject the null hypothesis at the 1% significance level, which implies that the panel models in Table 3 have spatial dependency and lack spatial lagged variables. Also, the coefficients of the LM statistic test and robust LM statistic test for the SAR model with three weight matrices are all significant at 1%. This outcome verifies the soundness of our spatial autoregressive model setting with a geography weight matrix W1, industry weight matrix W2, and product weight matrix W3, as presented in Section 3.1.2. Therefore, based on the baseline panel model in Equation (9), we can build the SAR model and its extended form, such as SDM model and SAR ordered probit model, to explore the peer effect of heavy-pollution industry corporate ESG performance in terms of spatial econometric techniques in the following sections.
Table 3. The estimation results of peer effect of corporate ESG performance based on spatial autoregressive model.
(5) (6)(7)(8)(9)(10)
SAR_W1SAR_W1SAR_W2SAR_W2SAR_W3SAR_W3
W × ESG_perform0.151 ***
(0.000)
0.143 ***
(0.000)
0.223 ***
(0.000)
0.212 ***
(0.000)
0.090 ***
(0.000)
0.087 ***
(0.000)
Neg_news−0.026 ***
(0.000)
−0.025 ***
(0.000)
−0.026 ***
(0.000)
−0.025 ***
(0.000)
−0.026 ***
(0.000)
−0.025 ***
(0.000)
Env_punish−0.124 ***
(0.000)
−0.122 ***
(0.000)
−0.125 ***
(0.000)
−0.123 ***
(0.000)
−0.123 ***
(0.000)
−0.122 ***
(0.000)
Green_patent0.007 **
(0.022)
0.005 **
(0.041)
0.006 **
(0.040)
0.005 *
(0.069)
0.006 **
(0.035)
0.005 *
(0.060)
ROA 0.002 ***
(0.001)
0.002 ***
(0.001)
0.002 ***
(0.001)
Lev −0.004
(0.665)
−0.005
(0.622)
−0.005
(0.639)
Growth −0.001
(0.445)
−0.002
(0.445)
−0.001
(0.446)
First 0.180 ***
(0.000)
0.180 ***
(0.000)
0.181 ***
(0.000)
Indp 0.282 ***
(0.001)
0.282 ***
(0.001)
0.288 ***
(0.001)
FirmControlControlControlControlControlControl
YearControlControlControlControlControlControl
R_squared0.1430.5060.1340.4510.1510.469
Hausman’s75.900 ***
(0.000)
121.180 ***
(0.000)
73.250 ***
(0.000)
120.180 ***
(0.000)
73.580 ***
(0.000)
118.010 ***
(0.000)
Loglikelihood2007.2462056.8002013.3412062.2512002.9822053.057
AIC−4004.492−4093.600−4016.681−4104.502−3995.964−4086.114
BIC−3970.361−4025.338−3982.551−4036.241−3961.833−4017.853
Observations681068106810681068106810
Note: *, **, and *** indicate significance at the 0.1, 0.05, and 0.01 levels, and the p value is in the brackets. The dependent variable is the heavy-pollution industry listed corporation’s ESG performance.

4.2. The Peer Effect of Corporate ESG Performance Based on the SAR Model

Table 3 lists the estimation results of SAR models with or without control variables in Equation (10) under three different weight matrices W1, W2, and W3. We include firm-fixed effect and time-fixed effect in each SAR model by considering the significant results of Hausman’s statistic tests. It can be seen that for the values and the significance of the coefficients of core explanatory variables and control variables, there are no apparent changes in the SAR models compared to the results of the baseline models, as shown in Table 2. This implies that our SAR model setting is robust, which can be used to further estimate the peer effect of corporate ESG performance on the basis of the baseline panel model in Equation (9).
Models (5) and (6) in Table 3 are the SAR model with the geographic weight matrix W1, which are able to detect the peer effect of corporate ESG performance among different firms within the same province. We also built SAR models (7) and (8) with industry weight matrix W2 and the SAR models (9) and (10) with product weight matrix W3, to estimate the peer effect of corporate ESG performance among different firms within the same industry and those which have the same main product, respectively. We found that the coefficients of all spatial lagged variables are significantly positive, indicating that one corporate ESG performance is considerably influenced by its counterparts’ or neighbor firms’ ESG performance. The higher the level of ESG performance of other spatial connected firms, the higher the level of ESG performance itself. This result demonstrates that a heavy-pollution industry listed corporation’s ESG performance has a strong peer effect between different firms regardless of whether they are within the same province, within the same industry, or have the same products. First, from a geographic perspective, firms located in the same province may have a closer relationship in terms of business interactions. A shorter geographic distance between two firms leads to faster reactions in the field of business strategy implementation and technology transformation to each other. Yue et al. (2022) confirm that technology spillover has a positive impact on the innovation quality of enterprises with geographic proximity [96]. Therefore, the level of corporate ESG performance will be promoted by the increase in other firms’ ESG performance levels within the same province. Second, the estimators of spatial lagged variables in models (7) and (8) denote that corporate ESG performance also has a remarkable peer effect within the same industry. Firms that belong to the same industry have a strong link between organizational learning and financial performance [97]. Compared to firms from different industries, business cooperation in the same industry causes the technology absorptive capacity of firms to have a more positive moderating effect on their innovation capability [98]. Due to this degree of interconnectedness, corporate ESG performance can be improved through an increase in other firms’ ESG performance in the same industry. Third, based on the results in models (9) and (10), we found that corporate ESG performance still has a significantly positive peer effect among firms that produce the same main products. Fierce competition in market segmentation and commodity selling may exist among firms that have the same primary products. This makes firms pay more attention to their counterparts in terms of business operation and production processes. The high level of competition among peer firms contributes to a wide imitation of each other in management strategy. Gyimah et al. (2020) provide evidence that firms mimic their peers in formulating trade credit policies, which are those not only in similar circumstances but also those that are more or less successful [99]. Bustamante and Frésard (2021) suggest that the investment of a firm highly depends on the investment of other firms in the same product market, and this peer effect is stronger in concentrated markets, featuring more heterogeneous firms, and for smaller firms with less precise information [10]. Hence, the improvement in peers’ ESG performance can significantly stimulate the increase in a firm’s ESG performance.
Further, we observe that the coefficients of the spatial lagged variables of SAR models with industry weight matrix W2 are sequentially larger than those in SAR models with geographic weight matrix W1 and product weight matrix W3, demonstrating that heavy-pollution industry listed corporations have a stronger ESG performance peer effect within the same industry and a lower ESG performance peer effect among firms that produce the same products. There may be two ways in which to interpret the comparison concerning the corporate ESG performance peer effect regarding the three types of spatial connections of heavy-pollution industry listed firms. On the one hand, the collaboration between firms within the same industry is closer than those within the same province and with the same product in business interactions. This is because firms in the same industry face a similar market environment and technology background, so there is more information communication between them. Hu et al. (2023) find that geographical closeness has no impact on the relationship between the breadth of external technology acquisition and a firms’ innovation performance [100]. Compared to the other two spatial connective modes, geographic proximity, and product proximity, firms within one industry have a greater number of cases of cooperation in terms of strategic alliance and technology innovations [98]. Zhang et al. (2022) argue that firms are better off choosing potential R&D partners who are in the same industry rather than from a different industry domain for more efficient organizational communications [101]. On the other hand, intensive competition in the same product market might weaken the peer effect of ESG performance among firms. A significant negative effect on the growth rates of rival firms that have the same product in a highly inter-firm competitive market exists [72]. This causes firms focus more on direct competition in price and quality and concern themselves less with their respective ESG performances. As Ryou et al. (2022) pointed out [102], the magnitude of product market competition promotes a firm’s proprietary cost concerns, which significantly decreases the likelihood, frequency, and length of a firm’s individual CSR reports. Martins (2022) also suggests that competition shocks have a negatively causal effect on firms’ ESG practices [28]. Overall, the results of corporate ESG performance peer effects based on the SAR models in Table 3 provide significant empirical support for Hypothesis 1 (H1).

4.3. The Mechanism Analysis of Peer Effect of Corporate ESG Performance Based on the SDM Model

By employing the SAR models, we estimated the peer effect of corporate ESG performance and the impact of core explanatory variables on corporate ESG performance in previous sections. In this section, we further detect the direct effect and peer indirect effect of the core explanatory variables, which are negative web news, environment-related penalties, and green patents, on corporate ESG performance based on the spatial Durbin model (SDM) model. The direct effect is the influence of the unit changes in the core explanatory variables on firm’s own ESG performance, while the indirect peer effect reflects the average weighted changes in the core explanatory variables of other spatial neighbors on a firm’s ESG performance. The peer indirect effect can be regarded as the impacts of the peer effects of negative web news, environment-related penalties, and green patents among firms on corporate ESG performance. Thus, we employ mechanism analysis to detect whether corporate ESG performance is further influenced by peers’ negative web news, environment-related penalties, and green patents.
Table 4 reports the estimation results of the corporate ESG performance peer effect of the spatial Durbin model in Equation (11). We also consider the three spatial weight matrices, such as the geography matrix, industry matrix, and product matrix, into the SDM models to detect the differences in peer effects of both corporate ESG performance and explanatory variables with various firms’ connection cases. Firm fixed-effect and time fixed-effect are all controlled in the models based on the significant results of Hausman’s tests. The results of two Wald statistics in each model are all positively significant, indicating that the tests reject the hypotheses that the SDM model can be degraded into SAR or SEM model [78]. This demonstrates that our SDM model is still superior to the SAR model or SEM model in regression fitting after adding the spatial lagged variables of core explanatory variables.
Columns (1) to (3) in Table 4 are the estimation results of the SDM model with spatial weight matrix W1, W2, and W3, respectively, used to investigate the impacts of peers’ ESG performance and several other key factors, such as peers’ negative news, environment-related penalties, and green innovation capability on firm’s ESG performance. Compared with the results in Table 3, there are not many differences in the values and significance of the coefficients of core independent variables and control variables, which shows the robustness of SDM models’ outcomes. We found that the estimators of corporate ESG performance peer effects under three different weight matrices are also the same as those in Table 3. This demonstrates that the conclusions of Hypothesis 1 (H1)—that heavy-pollution industry listed corporations have a significantly positive ESG performance peer effect within the same province, same industry, and with the same products—still hold in the SDM model. In addition, the order of large size of peer effects in different firm counterparts’ connections is as the same as that in Table 3. Finally, the point estimation method of SDM models is not able to provide the marginal effects of independent variable on the dependent variable. Consequently, the spatial lags of core explanatory variables cannot directly reflect the impacts of their spatial effects on the dependent variable, and thus, we need to apply the partial differential method to decompose their estimators to obtain the direct effects and indirect effects [78].
Table 5 shows the results of the direct and indirect effects under three weight matrices in the spatial Durbin models. By following the method outlined in Section 3.1.1, the decompositions intuitively illustrate the outcomes of the direct effect, indirect effect, and total effect of the core explanatory variables, such as negative web news, environment-related penalties, and green patents. The total effect is the simple sum of coefficients in other two effects, which leads to a lower significance of the estimators and underestimate certain concrete impacts of the key factors on corporate ESG performance [103]. Therefore, it is necessary to separately consider the direct and indirect effects of core explanatory variables both from an external and internal viewpoint of a firm. The direct effects denote the impacts of firm’s negative web news, environment-related penalties, and green patents on its own ESG performance. Identical to the results in Table 3 and Table 4, we found that the corporate ESG performance would significantly decrease with the increase in the number of firm’s negative web news and when a firm is suffering from environment-related penalties by the government, yet it will increase with the increase in the number of a firm’s green patents. Here, we focus more on the indirect effects of core explanatory variables to verify whether e three various dimensions.
First, in Table 5, we found that the coefficients of indirect effect of negative web news are positively significant at the 5% confidence level, which demonstrates that the increase in peers’ negative web news has a strong influence on firm’s ESG performance. This significant relationship exists in all three SDM models with different weight matrices, namely the geographic matrix, industry matrix, and product matrix. The heavy-pollution industry firms endure the higher pressure of public media attention in energy conservation and emission reduction, indicating that they are more sensitive to the level of media coverage about peer firms no matter whether these are in the same district, within the same industry, or produce the same product [104]. Consistent with Cheng and Liu (2018) [3], this result also suggests that public media attention and media coverage have an effective oversight function that stimulates heavy-pollution industry firms to improve their ESG performance. Therefore, we empirically verify Hypothesis 2a (H2a).
Second, the estimator of the indirect effect of environmental punishment is positively significant in the SDM model both with the spatial weight matrix W2 and W3, yet it is insignificant in the SDM model with spatial weight matrix W1. This demonstrates that the peer effect of environmental punishment has a remarkable impact on heavy-pollution industry listed firms’ ESG performance, especially those within the same industry or producing the same product. One reason is that these firms within the same industry have more possibilities in information communication and business cooperation [97,98]. Moreover, as mentioned by Xiang and van Gevelt (2020) [105], the implementation of environmental regulation by local governments be less effective due to the decentralized nature of governance structure. Although peers in the same districts have been punished due to environmental issues, the penalties for unsustainable environmental behavior could lead to other firms continuously ignoring the improvement of ESG performance in the long term. Hence, our Hypothesis 2b (H2b) is partially supported.
Third, it can obviously be seen that the indirect effect of green patents is negatively significant only in the SDM model with geographic W1, which implies that a firm’s ESG performance is negatively influenced by the upgrade of counterparts’ green innovation capabilities within the same district. This result indicates that firm’s input in green innovation does not effectively drive the peers’ ESG performance improvement due to the different degrees of competition among firms. In accordance with Lambertini et al. (2017) [106], it is shown that an inverted U-shaped relationship exists between firm green innovation spillover and competition, where if the competition degree is in the higher or lower levels, then the innovation spillover level is lower between firms. Therefore, on the one hand, a less competitive environment between firms within the same province causes a negatively significant impact on the peer effect of green innovation on corporate ESG performance. This is also confirmed by the empirical results of Wang et al. (2021), where green technology innovation has a negative spatial effect on the green total factor productivity of its regional neighbors [103]. On the other hand, the influences of counterparts’ green innovation on corporate ESG performance within the same industry or with the same products are not significantly different from zero. The interpretation is that those firms within the same industry or the same product market maintain a competitive awareness of green innovation, which means that they are more likely to imitate their peers’ green innovation [43]. This type of mutual rivalry-based imitation of green innovation may eventually lead to its encouraging effect on corporate ESG performance that does not display a significant difference among peer firms. Finally, these results partially support our Hypothesis 2c (H2c).

5. The Further Empirical Analysis of Peer-Pulling Effect and Peer-Dragging Effect of Corporate ESG Level Change

5.1. The Peer-Pulling Effect of Corporate ESG Level Increases Based on the SAR Probit Model

Table A3 lists the results of probit models and panel models with binary dependent variable E S G _ l e v e l u p i , t . We employed the ordinary probit model in models (14) and (15) and the panel model in models (16) and (17) for comparison. We found that the values and significance of almost all core explanatory variables and control variables are similar to those in Table 2 and Table 3, which proves that the alteration of the dependent variable does not significantly change the previous results. Table 6 reports the MCMC results of peer-pulling effect of corporate ESG level when it increases based on the binary spatial autoregressive probit model. Three types of spatial weight matrices are also embedded in the models to detect peer effect differences in different peer firms’ connective groups. The estimators of core independent variables and control variables retain the same size and significance as those in Table A3. This verifies the robustness of our spatial probit model, which again demonstrates the significantly negative impacts of the increase in a firm’s negative web news and environment-related penalties and the significantly positive impacts of the enhancement of firm’s green innovation capability on the upward movement of corporate ESG level. And the improvement of a firm’s financial profit and inside governance capability would also encourage corporations to gain a higher ESG rating. The coefficients of spatial lags of dependent variables are all significantly positive, which indicates that the heavy-pollution industry listed corporate ESG performance has a significantly positive peer-pulling effect among firms within the same province, within the same industry and with the same products when other firms’ ESG levels increase. Moreover, we notice the size difference between the magnitudes of peer effects in three kinds of peer firms’ groups is similar to the outcomes in Table 3 and Table 4. These results provide significant empirical support for Hypothesis 3a (H3a).

5.2. The Peer-Dragging Effect of Corporate ESG Level Decreases Based on the SAR Probit Model

Table A4 presents the estimators of the binary probit model and panel model of Equation (14). We observe that the coefficients of negative web news and environmental punishment are significantly positive at the 1% confidence level, which implies that the increase in the number of a firm’s negative web news and environment-related penalties would obviously cause the decrease in corporate ESG rating. And the estimators of green patents are all significantly negative to the dependent variable, demonstrating that the stronger a firm’s green innovation capability is, the smaller the probability of a firm’s ESG level decreasing. With respect to the control variables, the increase in a firm’s financial profit and internal governance capability can also reduce the probability of a firm’s ESG level decreasing. Compared with Table A3, all coefficients in Table A4 have the opposite symbol directions but the same approximate size in values. This result indicates that the core explanatory variables and control variables have totally inverse influences on the upward and downward movement of corporate ESG levels.
Table 7 reports the results of the peer-dragging effect of corporate ESG level decreases based on the binary spatial autoregressive probit model of Equation (15). The binary spatial autoregressive probit models are estimated with or without control variables under three kinds of weight matrices, which are the geographic matrix, industry matrix, and product matrix, to investigate the peer-dragging effect when corporate ESG level decreases. The results of core independent variables and control variables are identical to those in Table A4, which demonstrates the robustness of the binary spatial autoregressive probit model. We found that the spatial lagged variables are significantly positive under the geographic weight matrix W1 and industry weight matrix W2, indicating that when corporate ESG rating decreases, a peer-dragging effect among firms within the same district and the same industry exists. This result provides evidence that firms would also pay little attention to the ESG level when their peers are not putting effort into corporate ESG performance. The interpretations are twofold. First, heavy-pollution industry listed firms within the same province have the same environmental protection pressures from their local government, so they could adopt the same strategy to respond to regulations [107]. When regulatory pressure is loosened, the decline in firms’ focus on ESG performance will lead to their peers ignoring their own ESG performance. Second, due to the high frequency of business cooperation and information interaction, firms within the same industry often mimic each other in managerial strategy [15]. This proximity contributes to a significant peer-dragging effect when one firm shifts its operational focus from ESG performance to other profit targets. Moreover, the lower competition between firms or the lack of full information about the market could lead managers to take a more conservative approach to imitate peers within the same region and industry, such as decreasing input into corporate ESG practice [11]. However, the coefficients of spatial lagged variables under product weight matrix W3 in models (32) and (33) are insignificant, which demonstrates that the downward movement of corporate ESG level has no peer-dragging effect among firms with the same main products. This result verifies the conclusion in Section 4.2 from another angle. On the one hand, the intense competition in price and quality between firms who have homogeneous products result in them reducing their concerns about peers’ ESG performance [102]. On the other hand, as Cao et al. (2019) mentioned, firms may apply ESG performance as a strategic response to peer threats, which implies that they could retain the unchangeable input of their ESG level to gain an advantage against market competition [29]. Therefore, Hypothesis 3b (H3b) is partially supported in this section.

6. Robustness and Heterogeneity Tests

6.1. The Corporate ESG Performance Peer Effect Based on the SEM Model

To verify the robustness of the SAR model in Equation (10), we constructed another form of spatial econometric model, that is, the spatial error model (SEM), under the same three different weight matrices in this section. Different from the SAR model, the spatial error model considers the spatial effect from the cross-product item, which is between the spatial weight matrix and residual, rather than the spatial lags of dependent variable. The SEM model is expressed as y = X β + ε ,   ε = λ W ε + ϵ and ε ~ N ( 0 ,   σ 2 I n ) , where y denotes the dependent variable (i.e., corporate ESG performance), W is the spatial weight matrix, and λ is the spatial effect parameter captured by errors. Table 8 represents the results of spatial effect of corporate ESG performance based on the spatial error model with firm fixed-effect and year fixed-effect. We observe that the estimators of core independent variables and control variables are both identical to those in Table 3. It was also found that the coefficients of residuals’ spatial lags in SEM models under three kinds of weight matrices are all significantly positive, indicating the existence of a noticeable spatial effect in the baseline models of Table 2, which verifies the necessity of employing the spatial econometric model, as presented in Section 3.1.2. This also provides significant evidence of the peer effect of corporate ESG performance among firms, such as those within the same district, within the same industry, and with the same product. Hence, the main results of Section 4.2 still hold after the different regression models have been changed.

6.2. The Endogenous Tests of Peer Effect of Corporate ESG Performance

To relieve the endogenous problem in our empirical analysis, we apply the instrument variable two-stage least square method (IV-2SLS) to avoid the estimation bias in SAR models. The one-order lagged variables of the spatial lags ( W * E S G _ p e r f o r m i , t ) 1 with three different weight matrices are utilized as the instrument variables. The first reason for this is that the one-order lagged variable of spatial lags of corporate ESG performance is closely related to the current spatial lags of corporate ESG performance, thus meeting the conditions of high correlation between the instrument variables and endogenous explanatory variables. The second is that the one-order lagged variable of the spatial lags of corporate ESG performance would not directly affect the explained variable and has no correlation with the disturbance term, which satisfies the requirement of the exogeneity of instrumental variables.
Table 9 represents the results of the endogenous tests of the peer effect of corporate ESG performance based on the IV-2SLS method. In the first stage in Panel A, the instrument variables are all significantly positive at the 1% confidence level under the endogenous variable W * E S G _ p e r f o r m i , t , which demonstrates that the IVs are highly correlated with the replaced variables. The values of Cragg–Donald–Wald F-statistics and Kleibergen–Paap–Wald rk F-statistics are both far larger than the Stock–Yogo weak ID F-test 10% critical value of 16.380, indicating that the IVs pass the weak identification tests. Moreover, the significantly positive Kleibergen–Paap rk LM-statistics in three columns show that the IVs also all pass the under-identification tests. The Panel B contains the estimators of the second stage of IV-2SLS with dependent variable corporate ESG performance. We found that the coefficients of core independent variables and control variables are robust compared with Table 3. And the estimators of IVs demonstrate our results of the peer effect of corporate ESG performance in SAR models are still sound after eliminating the probably endogenous problems.

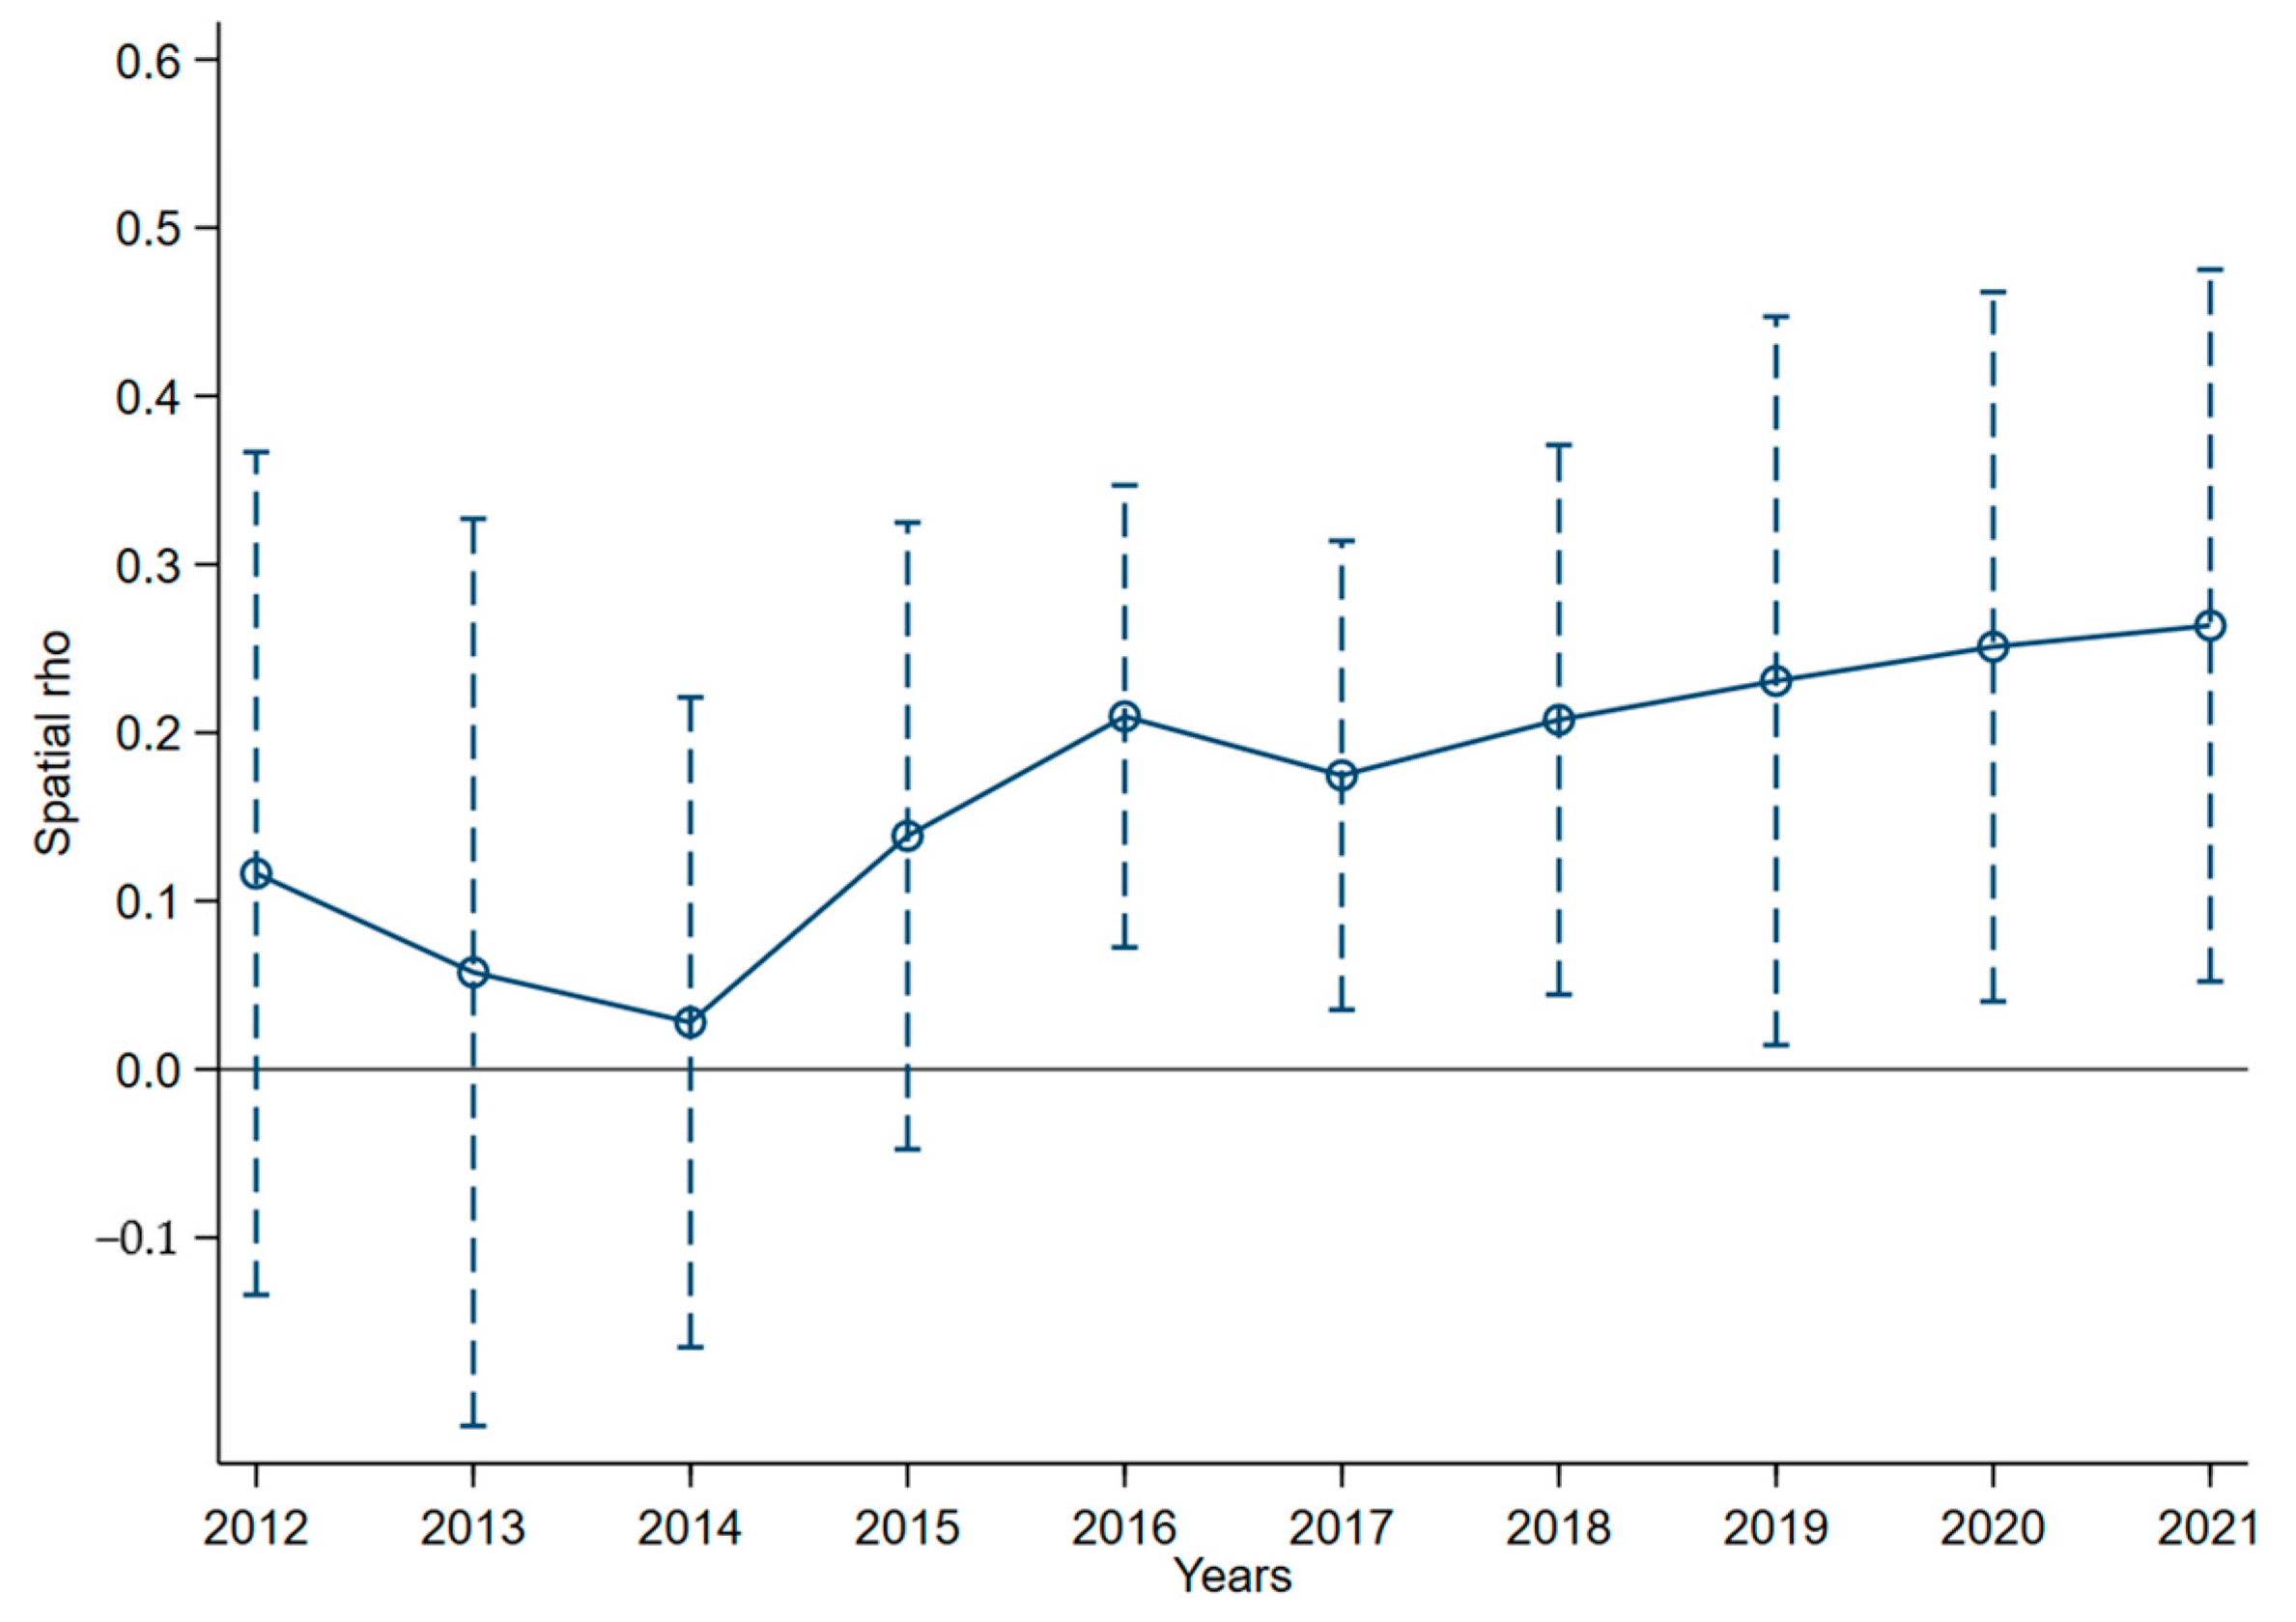
6.3. The Cross-Section Analysis of the Peer Effect of Corporate ESG Performance on Different Years

Further, based on the same spatial autoregressive model in Section 4.2, we take a cross-section analysis of the peer effect of corporate ESG performance on each different year in the sample period from 2012 to 2021. By this measure, we can detect the temporal change in the peer effects of corporate ESG performance within three kinds of firm connective groups, namely geography correlation, industry correlation, and product correlation. Figure 2, Figure 3 and Figure 4 are the estimation results of the peer effects of corporate ESG performance in each year based on the SAR models with three weight matrices, respectively. It is obviously shown in the three pictures that the tendency of the peer effect of corporate ESG performance increases gradually over the year in total among firms regardless of whether they are within the same province, within the same industry, or produce the same product. This indicates that heavy-pollution industry listed firms are constantly strengthening the formation of institutions in the three pillars of environment, society, and governance. In addition, they also continuously learn ESG management experiences from their more advanced domestic and overseas counterparts. In addition, as the description in these three plots, we can see that the coefficients of the peer effect have all been significantly larger than zero since 2016. This is because the Chinese government published the Environmental Protection Supervision Draft in 2015 and formally launched the central ecological and environmental protection supervision program in 2016 (see website: http://www.gov.cn/zhengce/2019-06/28/content_5403999.htm (accessed on 28 May 2023)). The supervision enhanced firms’ awareness of environmental protection and improved the quality of disclosure of environmental accounting information. This causes heavy-pollution industry firms to focus significantly more on the gaps in corporate ESG performance between themselves and their peers. Finally, we found that the average level of peer effect in the SAR models with industry weight matrix W2 in Figure 3 is larger than that in Figure 2 and Figure 4, indicating that the average peer effect of the corporate ESG performance among firms within the same industry is strongest in the whole sample period. This result again confirms our main empirical conclusion given in Section 4.2.

6.4. The Peer Pulling Effect of Corporate ESG Level Based on the Ordered SAR Probit Model

To verify the robustness of empirical results of further analysis in Section 5, we utilize another alternative dependent variable, ESG_leveli,t, to replace the previous dependent variables, namely corporate ESG level increase and decrease (ESG_levelupi,t and ESG_leveldowni,t). Due to the variable ESG_leveli,t being an ordered dependent variable, ranging from 1 to 9, we further employ the ordered spatial autoregressive probit model to investigate the peer-pulling effect of corporate ESG level. Based on the model setting in Section 3.1.2, the ordered spatial autoregressive probit model is the extended form of the binary spatial autoregressive probit model, and both are estimated using the MCMC method. Therefore, we are able to follow the same regression model in Section 5, except for the different explained variables. Table A5 reports the baseline estimation results of ordered probit models with the dependent variable ESG_leveli,t when the model does not consider the spatial lags. At the same time, we also apply the ordinary panel model for comparison. The value and significance of the coefficients of core independent variables and control variables are in accordance with the outcomes in Table A3. This shows that the ordered dependent variable ESG_leveli,t can be a robust alternative variable, and our results still hold after changing the explained variable.
Table 10 represents the results of the peer-pulling effect of corporate ESG level based on the ordered spatial autoregressive probit model. The estimators of core independent variables, such as negative web news, environment-related penalties, and green patents, are consistent with the previous tables in Section 4.2. Moreover, the results of the control variables stay the same, which demonstrates that the ordered spatial autoregressive probit model is robust. The significantly positive spatial lagged variables demonstrate that heavy-pollution industry listed corporation’s ESG performance has a strong peer effect on firms within the same province, the same industry, and with the same products. The results of spatial lags of the ordered dependent variable also show that the higher the peer firms’ ESG level is, the higher a firm’s own ESG level, which provides evidence that a peer-pulling effect among peer firms exists. Driven by the improvement in peers’ ESG levels, a firm would increase its own ESG level because the implementation of ESG is seen as a strategic response to the threats in the competitive market [29]. We also found the same differences in the peer effects of the corporate ESG level between various peer groups compared with the results from Section 4.2 and Section 5.1. Therefore, the results of the ordered spatial probit model again verify the sound of our main conclusions after changing the explained variable and empirical model.

7. Discussions

This paper empirically investigates the peer effect of corporate ESG performance among 681 of China’s A-share listed firms within 20 heavy-pollution industries from 2012 to 2021. By constructing three types of spatial weight matrices of peer firms, we explore the existence and difference of peer effects of corporate ESG performance among the counterparts within the same province, within the same industry, and with the same products based on the SAR model. The results of the SAR model, as shown in Section 4.2, are compatible with the conclusions of Li and Wang (2022) [22], where corporate ESG or CSR performance has a local peer effect among nearby firms in the same region. Consistent with Liu and Wu (2016) and Dong et al. (2023) [21,23], we also observe that corporate ESG performance has a significant industry peer effect. Apart from the views of geography or industry, we further consider the peer effect of corporate ESG performance within the same product market. By comparing the magnitude of peer effects in these three types of peer groups, we found that heavy-pollution industry listed corporations have a stronger ESG performance peer effect within the same industry and a lower ESG performance peer effect among firms with the same products. This outcome can be explained from the perspectives of the business cooperation and communication between peers (Liu and Shan (2023), Zhang et al. (2022)) [98,101] and the competition environment among firms (Coad and Teruel (2013), Ryou et al. (2022)) [72,102].
Furthermore, we employ the SDM model, as presented in Section 4.3, to engage the mechanism analysis, which is the direct effect and peer indirect effect of the core factors of public media attention, regulatory pressure, and green innovation on corporate ESG performance based on Cheng and Liu (2018) [3], Lu and Cheng (2023) [66], and Zheng et al. (2022) [69]. Li and Wang (2022) argue that local CSR comovement is mainly driven by a firm’s incentives to access financing [22]. Dong et al. (2023) suggest that the industry peer effect of corporate social responsibility is affected by a firm’s motivation (when the common shareholder is a foreign investor) and ability (when the focal firm’s financial performance is high) to respond to competitive threats and tensions from investee peers [23]. However, we focus more on the indirect effects of core explanatory variables in order to verify whether corporate ESG performance is changed by the peer effects in three various dimensions. We found that the increase in other firms’ negative web news, environment-related penalties, and green patents has different indirect peer effects on corporate ESG performance within the same province, industry, and product market. Additionally, in the further analysis shown in Section 5, we detect the peer-pulling effect and peer-dragging effect of corporate ESG level when it increases and decreases within three various peer groups based on the SAR probit model. We draw the conclusion that the corporate ESG performance has a significantly positive peer-pulling effect among firms when other firms’ ESG levels increase, yet it has a significantly positive peer-dragging effect only within the same region and industry when other firms’ ESG levels decrease. These findings are supported by Cao et al. (2019) and Ryou et al. (2022) in different dimensions [29,102].

8. Conclusions and Implications

8.1. Main Conclusions

The main conclusions of this paper are threefold. First, the ESG performance of listed corporations in the heavy-pollution industry has a significantly positive peer effect among firms within the same province, the same industry, and with the same products. Due to the different market competition and cooperation environments between firms, the peer effect of corporate ESG performance is stronger among counterparts within the same industry than the other two peer groups. Second, the decomposition of the estimators in the SDM models shows that the direct effect and peer indirect effect of core explanatory variables are significantly different in terms of their influences on corporate ESG performance. The level of public attention and media coverage of other firms has a positive peer indirect effect on peer corporate ESG performance no matter within the same province, the same industry, and the same product market. The environment-related penalties of other firms can stimulate the improvement of peer corporate ESG performance within the same industry and the same product but not within the same province due to the lower effectiveness of the regulation implementation of local government. The increase in the number of green patents of other firms negatively influences peer corporate ESG performance only within the same province, yet the mutual rivalry-based imitation of green innovation may eventually lead to its peer effect on corporate ESG performance being insignificant between peer firms within the same industry or the same product market. Third, when other firms’ ESG levels increase, the heavy-pollution industry listed corporations’ ESG performance has a significantly positive peer-pulling effect among firms within the same province, the same industry, and with the same products. When other firms’ ESG levels decrease, they also have a significantly positive peer-dragging effect among firms within the same province and the same industry. However, due to the higher degree of competition, corporate ESG performance has no peer-dragging effect among firms that have the same products.

8.2. Management Implications

This study has certain management implications for the implementation of corporate ESG strategy and government environmental supervision in heavy-pollution industries. Our results show that firms within the same district, industry, or product market all have significant peer effects in the field of corporate ESG performance. Therefore, from a firm’s perspective, it should improve its own ESG construction and try hard to learn from the industry leaders in ESG management measures. The government should promulgate positive regulations to widely promote the conception of ESG to help heavy-pollution industry firms in environmental protection transformation. The mechanism analysis also provides policy suggestions. First, media coverage can be well used as an impetus for corporate ESG development, because we found that firms are very sensitive to negative online news about their peers. Another is that the local government needs to strengthen the sustainability of regulatory supervision to prompt firms to establish the awareness of corporate ESG management and push them to implement ESG information communications. The last is that government should guide firms into a suitable level of market competition and cooperation to release the potential abilities of technology spillover effects of green innovation in different industries. Finally, we notice that heavy-pollution industry listed corporations’ ESG performance has a significantly positive peer-dragging effect when their peers’ ESG performance ratings decrease. On the one hand, firms should give up this kind of short-sighted operational strategy to pursue long-term development to refine corporate ESG management as a useful competitive advantage rather than a sort of cost burden. On the other hand, the government should maintain healthy market development and consistency with intense supervision to avoid low effectiveness, which causes firms to continuously ignore corporate ESG management and fall back into disordered competition.

8.3. Limitations and Future Research

The limitations of this paper are twofold. First, our sample is only based on the listed firms in heavy-pollution industries, which cannot entirely represent the situation in the whole manufactory sector. Second, our regression model is the static panel model, so it is unable to detect the dynamic evolution of the peer effect of corporate ESG performance. Future research will further employ dynamic panel models and explore more indirect influence factors of the peer effect of corporate ESG performance in mechanism analysis.

Author Contributions

All the authors contributed to the entire process of writing this paper. Conceptualization, H.Z. and A.L.; methodology, A.L. and Y.L.; validation, Y.L. and D.H.; formal analysis, H.Z. and A.L.; data curation, H.Z. and Y.L.; writing—original draft preparation, H.Z. and A.L.; writing—review and editing, A.L. and D.H.; supervision, Y.L. and D.H. All authors have read and agreed to the published version of the manuscript.

Funding

This research was funded by the Project Supported by Natural Science Foundation of Jiangxi Province, China (grant no. 20224BAB211007); the Foundation of Social Science and Humanity, China Ministry of Education (grant no. 22XJA630003); the Humanities and Social Sciences Project of the Training Plan for Thousand Young Backbone Teachers in Guangxi Universities (grant no. 2021QGRW039); the Humanities and Social Sciences Program of the Higher Education Institutions of Jiangxi Province, China (grant no. GL22129); and the Natural Science Foundation of China (grant no. 71761020).

Data Availability Statement

Publicly available datasets were analyzed in this study. The data can be found at WIND database (https://www.wind.com.cn/) and CNRDS database (https://www.cnrds.com/).

Acknowledgments

The authors are grateful to the editors and anonymous reviewers for their comments and discussions.

Conflicts of Interest

The authors declare no conflict of interest.

Appendix A

Table A1. Summary statistics of variables.
VariableSymbolObservationMeanS.D.Min.Max.
ESG performanceESG_perfomi,t68101.5920.2650.6932.197
ESG level increaseESG_levelupi,t68100.2330.42301
ESG level decreaseESG_leveldowni,t68100.2150.41101
ESG levelESG_leveli,t68105.0721.16329
Negative web newsNeg_newsi,t68104.0491.10608.925
Environmental punishmentEnv_punishi,t68100.0070.08501
Green patentGreen_patenti,t68101.1601.40908.080
Return on assetsROAi,t68104.0347.841−105.165119.277
Book leverage ratioLevi,t68101.4805.079−182.279128.343
Profit growth ratioGrowthi,t6810−0.97025.005−119.16322.042
The large shareholders’ ratioFirsti,t68100.5640.15400.986
The strength of independent directorIndpi,t68100.3690.05200.750
Geography spatial weight matrixW1463,7610.0510.22001
Industry spatial weight matrixW2463,7610.1010.30101
Product spatial weight matrixW3463,7610.0490.21801
Table A2. The statistic test results of spatial econometric model setting.
OLS_W1OLS_W2OLS_W3
Model (1)Model (2)Model (1)Model (2)Model (1)Model (2)
Residual Moran test0.165 ***
(0.000)
0.033 ***
(0.000)
0.248 ***
(0.000)
0.039 ***
(0.000)
0.249 ***
(0.000)
0.027 ***
(0.000)
LM_SAR test23.431 ***
(0.000)
21.343 ***
(0.000)
41.769 ***
(0.000)
37.667 ***
(0.000)
12.485 ***
(0.000)
11.645 ***
(0.000)
Robust LM_SAR test45.191 ***
(0.000)
17.117 ***
(0.000)
42.105 ***
(0.000)
53.186 ***
(0.000)
27.963 ***
(0.000)
10.707 ***
(0.000)
Note: *** indicate significance at the 0.01 levels, and the p value is in the brackets.
Table A3. The estimation results of corporation’s ESG level increase of probit models.
(14)(15)(16)(17)
ProbitProbitOLS_FEOLS_FE
Neg_news−0.118 ***
(0.000)
−0.112 ***
(0.000)
−0.035 ***
(0.000)
−0.034 ***
(0.000)
Env_punish−0.417 *
(0.091)
−0.422 *
(0.089)
−0.117 **
(0.015)
−0.119 **
(0.011)
Green_patent0.046 **
(0.029)
0.043 **
(0.039)
0.014 **
(0.041)
0.013 *
(0.055)
ROA 0.011 ***
(0.004)
0.003 ***
(0.006)
Lev 0.005
(0.194)
0.001
(0.208)
Growth −0.001
(0.141)
−0.001
(0.173)
First 0.104 *
(0.098)
0.044 *
(0.066)
Indp 0.140 **
(0.013)
0.427 **
(0.015)
FirmControlControlControlControl
YearControlControlControlControl
R_squared0.0830.0880.0550.085
Loglikelihood−3215.061−3198.185−3367.883−3358.452
AIC7798.1237776.3716743.7676734.904
BIC12,395.14012,413.7106770.6556795.391
Observations6129612961296129
Note: *, **, and *** indicate significance at the 0.1, 0.05, and 0.01 levels, and the p value is in the brackets. The dependent variable is the heavy-pollution industry listed corporation’s ESG level increase.
Table A4. The estimation results of corporation’s ESG level decrease of probit models.
(24)(25)(26)(27)
ProbitProbitOLS_FEOLS_FE
Neg_news0.136 ***
(0.000)
0.120 ***
(0.000)
0.039 ***
(0.000)
0.035 ***
(0.000)
Env_punish0.705 ***
(0.002)
0.714 ***
(0.002)
0.214 ***
(0.002)
0.215 ***
(0.002)
Green_patent−0.062 ***
(0.005)
−0.060 ***
(0.006)
−0.018 ***
(0.007)
−0.017 ***
(0.009)
ROA −0.017 ***
(0.000)
−0.005 ***
(0.000)
Lev −0.002
(0.708)
−0.001
(0.582)
Growth 0.002
(0.112)
0.001
(0.167)
First −0.394 **
(0.049)
−0.116 *
(0.058)
Indp −0.150 ***
(0.009)
−0.419 **
(0.015)
FirmControlControlControlControl
YearControlControlControlControl
R_squared0.0810.0870.0840.104
Loglikelihood−3094.515−3074.293−3215.813−3194.724
AIC7557.0327526.5876439.6266407.449
BIC12,154.05012,157.2106466.5096467.936
Observations6129612961296129
Note: *, **, and *** indicate significance at the 0.1, 0.05, and 0.01 levels, and the p value is in the brackets. The dependent variable is the heavy-pollution industry listed corporation’s ESG level decrease.
Table A5. The estimation results of corporation’s ESG level of ordered probit models.
(43)(44)(45)(46)
Ordered_ProbitOrdered_ProbitOLS_FEOLS_FE
Neg_news−0.180 ***
(0.000)
−0.172 ***
(0.000)
−0.122 ***
(0.000)
−0.116 ***
(0.000)
Env_punish−0.869 ***
(0.000)
−0.871 ***
(0.000)
−0.585 ***
(0.000)
−0.580 ***
(0.000)
Green_patent0.056 **
(0.000)
0.052 ***
(0.001)
0.357 ***
(0.002)
0.032 ***
(0.004)
ROA 0.011 ***
(0.000)
0.008 ***
(0.000)
Lev −0.001
(0.872)
−0.001
(0.661)
Growth −0.001
(0.128)
−0.001
(0.143)
First 0.876 ***
(0.000)
0.688 ***
(0.000)
Indp 0.218 ***
(0.000)
0.143 ***
(0.000)
FirmControlControlControlControl
YearControlControlControlControl
R_squared0.2750.2800.1950.334
Loglikelihood−7614.105−7569.915−7866.441−7933.429
AIC16,608.21016,529.83415,740.88015,653.600
BIC21,318.25021,274.14815,768.19015,715.030
Observations6810681068106810
Note: **, and *** indicate significance at the 0.05, and 0.01 levels, and the p value is in the brackets. The dependent variable is the listed heavy-pollution industry corporation’s ESG level.

References

  1. Huber, B.; Comstock, M. ESG reports and ratings: What they are, why they matter. Harvard Law School Forum Corporate Governance 2017. Available online: https://corpgov.law.harvard.edu/2017/07/27/esg-reports-and-ratings-what-they-are-why-they-matter/ (accessed on 28 May 2023).
  2. Liu, W.; Wang, Z. The effects of climate policy on corporate technological upgrading in energy intensive industries: Evidence from China. J. Clean. Prod. 2017, 142, 3748–3758. [Google Scholar] [CrossRef]
  3. Cheng, J.; Liu, Y. The effects of public attention on the environmental performance of high-polluting firms: Based on big data from web search in China. J. Clean. Prod. 2018, 186, 335–341. [Google Scholar] [CrossRef]
  4. Adhikari, B.K.; Agrawal, A. Peer influence on payout policies. J. Corp. Financ. 2018, 48, 615–637. [Google Scholar] [CrossRef]
  5. Grennan, J. Dividend payments as a response to peer influence. J. Financ. Econ. 2019, 131, 549–570. [Google Scholar] [CrossRef]
  6. Leary, M.T.; Roberts, M.R. Do peer firms affect corporate financial policy? J. Financ. 2014, 69, 139–178. [Google Scholar] [CrossRef]
  7. Kaustia, M.; Rantala, V. Social learning and corporate peer effects. J. Financ. Econ. 2015, 117, 653–669. [Google Scholar] [CrossRef]
  8. Joo, C.; Yang, I.; Yang, T. Peer group effect in firm cash holding policy: Evidence from Korean manufacturing firms. Asia-Pac. J. Financ. Stud. 2016, 45, 535–573. [Google Scholar] [CrossRef]
  9. Chen, Y.; Chan, K.; Chang, Y. Peer effects on corporate cash holdings. Int. Rev. Econ. Financ. 2019, 61, 213–227. [Google Scholar] [CrossRef]
  10. Bustamante, M.C.; Frésard, L. Does firm investment respond to peers’ investment? Manag. Sci. 2021, 67, 4703–4724. [Google Scholar] [CrossRef]
  11. Li, J.; Yao, F.K. The role of reference groups in international investment decisions by firms from emerging economies. J. Int. Manag. 2010, 16, 143–153. [Google Scholar] [CrossRef]
  12. Lin, X. Utilizing spatial autoregressive models to identify peer effects among adolescents. Empir. Econ. 2015, 49, 929–960. [Google Scholar] [CrossRef]
  13. Liu, Z.; Zhang, T.; Li, W.; Kuang, X. The neighborhood effects of provincial-level stock market participation in China. Physica A 2018, 509, 459–468. [Google Scholar] [CrossRef]
  14. Li, Y.; Zhang, X.; Yao, T.; Sake, A.; Liu, X.; Peng, N. The developing trends and driving factors of environmental information disclosure in China. J. Environ. Manag. 2021, 288, 112386. [Google Scholar] [CrossRef] [PubMed]
  15. Grieser, W.; Hadlock, C.; Lesage, J.; Zekhnini, M. Network effects in corporate financial policies. J. Financ. Econ. 2022, 144, 247–272. [Google Scholar] [CrossRef]
  16. Pan, X.; Xu, G.; Zhu, N. Spatial peer effect of enterprises’ digital transformation: Empirical evidence from spatial autoregressive models. Sustainability 2022, 14, 12576. [Google Scholar] [CrossRef]
  17. Zhao, Y.; Lin, F. Peer effects in management forecast precision decision: Evidence from a novel text-based network. Appl. Econ. Lett. 2023, 30, 1671–1675. [Google Scholar] [CrossRef]
  18. Zheng, H.; Ye, A. Direct imitation or indirect reference?-Research on peer effects of enterprises’ green innovation. Environ. Sci. Pollut. Res. 2023, 30, 41028–41044. [Google Scholar] [CrossRef] [PubMed]
  19. Yang, S.; Zhang, H.; Zhang, Q.; Liu, T. Peer effects of enterprise green financing behavior: Evidence from China. Front. Environ. Sci. 2022, 10, 1033868. [Google Scholar] [CrossRef]
  20. Siedschlag, I.; Yan, W. Firms’ green investments: What factors matter? J. Clean. Prod. 2021, 310, 127554. [Google Scholar] [CrossRef]
  21. Liu, S.; Wu, D. Competing by conducting good deeds: The peer effect of corporate social responsibility. Financ. Res. Lett. 2016, 16, 47–54. [Google Scholar] [CrossRef]
  22. Li, C.; Wang, X. Local peer effects of corporate social responsibility. J. Corp. Financ. 2022, 73, 102187. [Google Scholar] [CrossRef]
  23. Dong, Y.; Chen, S.; Wu, Y. Keeping up with the Joneses: The role of investee peers corporate environmental responsibility. Corp. Soc. Responsib. Environ. Manag. 2023, 30, 1841–1855. [Google Scholar] [CrossRef]
  24. Brasington, D.M.; Parent, O. Public school consolidation: A partial observability spatial bivariate probit approach. J. R. Stat. Soc. Ser. A-Stat. Soc. 2017, 180, 633–656. [Google Scholar] [CrossRef]
  25. Skevas, T.; Skevas, I.; Kalaitzandonakes, N. The role of peer effects on farmers’ decision to adopt unmanned aerial vehicles: Evidence from Missouri. Appl. Econ. 2022, 54, 1366–1376. [Google Scholar] [CrossRef]
  26. Long, W.; Li, S.; Wu, H.; Song, X. Corporate social responsibility and financial performance: The roles of government intervention and market competition. Corp. Soc. Responsib. Environ. Manag. 2020, 27, 525–541. [Google Scholar] [CrossRef]
  27. Tan, X.; Yan, Y.; Dong, Y. Peer effect in green credit induced green innovation: An empirical study from China’s Green Credit Guidelines. Resour. Policy 2022, 76, 102619. [Google Scholar] [CrossRef]
  28. Martins, H.C. Competition and ESG practices in emerging markets: Evidence from a difference-in-differences model. Financ. Res. Lett. 2022, 46, 102371. [Google Scholar] [CrossRef]
  29. Cao, J.; Liang, H.; Zhan, X. Peer effects of corporate social responsibility. Manag. Sci. 2019, 65, 5487–5503. [Google Scholar] [CrossRef]
  30. Chen, C.; Jiang, D.; Li, W. Keeping up with the CSR Joneses: The impact of industry peers on focal firms’ CSR performance. Hum. Soc. Sci. Commun. 2023, 10, 106. [Google Scholar] [CrossRef]
  31. Freeman, R.E. Strategic Management: A Stakeholder Approach; Cambridge University Press: New York, NY, USA, 2010. [Google Scholar]
  32. Benlemlih, M. Corporate social responsibility and dividend policy. Res. Int. Bus. Financ. 2019, 47, 114–138. [Google Scholar] [CrossRef]
  33. Zahid, R.M.A.; Taran, A.; Khan, M.K.; Chersan, I.-C. ESG, dividend payout policy and the moderating role of audit quality: Empirical evidence from Western Europe. Borsa Istanb. Rev. 2023, 23, 350–367. [Google Scholar] [CrossRef]
  34. Zahid, R.M.A.; Khan, M.K.; Anwar, W.; Maqsood, U.S. The role of audit quality in the ESG-corporate financial performance nexus: Empirical evidence from Western Euro-pean companies. Borsa Istanb. Rev. 2022, 22, S200–S212. [Google Scholar] [CrossRef]
  35. Ambarish, R.; John, K.; Williams, J. Efficient signalling with dividends and investments. J. Financ. 1987, 42, 321–343. [Google Scholar] [CrossRef]
  36. Spence, M. Signaling in retrospect and the informational structure of markets. Am. Econ. Rev. 2002, 92, 434–459. [Google Scholar] [CrossRef]
  37. Banerjee, A.V. A simple model of herd behavior. Q. J. Econ. 1992, 107, 797–817. [Google Scholar] [CrossRef]
  38. Hisrich, R.D.; Peters, M.P.; Shepherd, D.A. Entrepreneurship; Irwin: Burr Ridge, IL, USA, 1998. [Google Scholar]
  39. Chen, M.-J.; MacMillan, I.C. Nonresponse and delayed response to competitive moves: The roles of competitor dependence and action irreversibility. Acad. Manag. J. 1992, 35, 539–570. [Google Scholar] [CrossRef]
  40. DiMaggio, P.J.; Powell, W.W. The iron cage revisited: Institutional isomorphism and collective rationality in organizational fields. Am. Sociol. Rev. 1983, 48, 147–160. [Google Scholar] [CrossRef]
  41. Haunschild, P.R.; Miner, A.S. Modes of interorganizational imitation: The effects of outcome salience and uncertainty. Adm. Sci. Q. 1997, 42, 472–500. [Google Scholar] [CrossRef]
  42. Li, B.; Pan, A.; Xu, L.; Liu, X.; Qin, S. Imprinting and peer effects in acquiring state ownership: Evidence from private firms in China. Pac.-Basin Financ. J. 2020, 61, 101337. [Google Scholar] [CrossRef]
  43. Wu, X.; Li, Y.; Feng, C. Green innovation peer effects in common institutional ownership networks. Corp. Soc. Responsib. Environ. Manag. 2023, 30, 641–660. [Google Scholar] [CrossRef]
  44. Park, K.; Yang, I.; Yang, T. The peer-firm effect on firm’s investment decisions. N. Am. Econ. Financ. 2017, 40, 178–199. [Google Scholar] [CrossRef]
  45. Li, W.; Wang, F.; Liu, T.; Xue, Q.; Liu, N. Peer effects of digital innovation behavior: An external environment perspective. Manag. Decis. 2023, 61, 2173–2200. [Google Scholar] [CrossRef]
  46. Yuan, D.; Shang, D.; Ma, Y.; Li, D. The spillover effects of peer annual report tone for firm innovation investment: Evidence from China. Technol. Forecast. Soc. Chang. 2022, 177, 121518. [Google Scholar] [CrossRef]
  47. Liu, Q.; Wang, J.; Chi, W. The spillover effects of innovation content disclosure in MD&A. Pac.-Basin Financ. J. 2022, 76, 101879. [Google Scholar] [CrossRef]
  48. Haller, S.A.; Siedschlag, I. Determinants of ICT adoption: Evidence from firm-level data. Appl. Econ. 2011, 43, 3775–3788. [Google Scholar] [CrossRef]
  49. Capelle-Blancard, G.; Petit, A. Every little helps? ESG news and stock market reaction. J. Bus. Ethics 2019, 157, 543–565. [Google Scholar] [CrossRef]
  50. Zahid, R.M.A.; Saleem, A.; Maqsood, U.S. ESG performance, capital financing decisions, and audit quality: Empirical evidence from Chinese state-owned enterprises. Environ. Sci. Pollut. Res. 2023, 30, 44086–44099. [Google Scholar] [CrossRef]
  51. Bhandari, A.; Javakhadze, D. Corporate social responsibility and capital allocation efficiency. J. Corp. Financ. 2017, 43, 354–377. [Google Scholar] [CrossRef]
  52. Stanaland, A.J.S.; Lwin, M.O.; Murphy, P.E. Consumer perceptions of the antecedents and consequences of corporate social responsibility. J. Bus. Ethics 2011, 102, 47–55. [Google Scholar] [CrossRef]
  53. Hur, W.-M.; Kim, H.; Woo, J. How CSR leads to corporate brand equity: Mediating mechanisms of corporate brand credibility and reputation. J. Bus. Ethics 2014, 125, 75–86. [Google Scholar] [CrossRef]
  54. Lin-Hi, N.; Blumberg, I. The link between (not) practicing CSR and corporate reputation: Psychological foundations and managerial implications. J. Bus. Ethics 2018, 150, 185–198. [Google Scholar] [CrossRef]
  55. Salmones, M.D.M.G.; Perez, A. Effectiveness of CSR advertising: The role of reputation, consumer attributions, and emotions. Corp. Soc. Responsib. Environ. Manag. 2018, 25, 194–208. [Google Scholar] [CrossRef]
  56. Zhang, L.; Shan, Y.G.; Chang, M. Can CSR disclosure protect firm reputation during financial restatements? J. Bus. Ethics 2021, 173, 157–184. [Google Scholar] [CrossRef]
  57. Brammer, S.; Pavelin, S. Voluntary environmental disclosures by large UK companies. J. Bus. Finan. Account. 2006, 33, 1168–1188. [Google Scholar] [CrossRef]
  58. Boiral, O. Sustainability reports as simulacra? A counter-account of A and A plus GRI reports. Account. Audit. Account. 2013, 26, 1036–1071. [Google Scholar] [CrossRef]
  59. Luo, L.; Lan, Y.-C.; Tang, Q. Corporate incentives to disclose carbon information: Evidence from the CDP global 500 report. J. Int. Financ. Manag. Account. 2012, 23, 93–120. [Google Scholar] [CrossRef]
  60. Braam, G.J.M.; de Weerd, L.U.; Hauck, M.; Huijbregts, M.A.J. Determinants of corporate environmental reporting: The importance of environmental performance and assurance. J. Clean. Prod. 2016, 129, 724–734. [Google Scholar] [CrossRef]
  61. Wu, R.; Lin, B. Environmental regulation and its influence on energy-environmental performance: Evidence on the Porter Hypothesis from China’s iron and steel industry. Resour. Conserv. Recycl. 2022, 176, 105954. [Google Scholar] [CrossRef]
  62. You, D.; Zhang, Y.; Yuan, B. Environmental regulation and firm eco-innovation: Evidence of moderating effects of fiscal decentralization and political competition from listed Chinese industrial companies. J. Clean. Prod. 2019, 207, 1072–1083. [Google Scholar] [CrossRef]
  63. Zhang, J.; Zhang, W.; Song, Q.; Li, X.; Ye, X.; Liu, Y.; Xue, Y. Can energy saving policies drive firm innovation behaviors?-Evidence from China. Technol. Forecast. Soc. Chang. 2020, 154, 119953. [Google Scholar] [CrossRef]
  64. Zhao, X.; Liu, C.; Yang, M. The effects of environmental regulation on China’s total factor productivity: An empirical study of carbon-intensive industries. J. Clean. Prod. 2018, 179, 325–334. [Google Scholar] [CrossRef]
  65. Wang, Y.; Sun, X.; Guo, X. Environmental regulation and green productivity growth: Empirical evidence on the Porter Hypothesis from OECD industrial sectors. Energy Policy 2019, 132, 611–619. [Google Scholar] [CrossRef]
  66. Lu, S.; Cheng, B. Does environmental regulation affect firms’ ESG performance? Evidence from China. Manag. Decis. Econ. 2023, 44, 2004–2009. [Google Scholar] [CrossRef]
  67. Jiménez-Parra, B.; Alonso-Martínez, D.; Godos-Díez, J.-L. The influence of corporate social responsibility on air pollution: Analysis of environmental regulation and eco-innovation effects. Corp. Soc. Responsib. Environ. Manag. 2018, 25, 1363–1375. [Google Scholar] [CrossRef]
  68. Zeng, J.; Ren, J.; Ning, Z. Mediating effect of corporate social responsibility-based entrepreneurship on environmental improvement: Evidence from 475 heavy-polluting enterprises. J. Bus. Res. 2022, 149, 506–517. [Google Scholar] [CrossRef]
  69. Zheng, J.; Khurram, M.U.; Chen, L. Can green innovation affect ESG ratings and financial performance? Evidence from Chinese GEM listed companies. Sustainability 2022, 14, 8677. [Google Scholar] [CrossRef]
  70. Wang, W.; Sun, Z.; Wang, W.; Hua, Q.; Wu, F. The impact of environmental uncertainty on ESG performance: Emotional vs. rational. J. Clean. Prod. 2023, 397, 136528. [Google Scholar] [CrossRef]
  71. Zheng, M.; Feng, G.-F.; Jiang, R.-A.; Chang, C.-P. Does environmental, social, and governance performance move together with corporate green innovation in China? Bus. Strateg. Environ. 2023, 32, 1670–1679. [Google Scholar] [CrossRef]
  72. Coad, A.; Teruel, M. Inter-firm rivalry and firm growth: Is there any evidence of direct competition between firms? Ind. Corp. Change 2013, 22, 397–425. [Google Scholar] [CrossRef]
  73. Shroff, N.; Verdi, R.S.; Yost, B.P. When does the peer information environment matter? J. Account. Econ. 2017, 64, 183–214. [Google Scholar] [CrossRef]
  74. Schettini, D.; Azzoni, C.R.; Paez, A. Neighborhood and efficiency in manufacturing in Brazilian regions: A spatial Markov Chain analysis. Int. Reg. Sci. Rev. 2011, 34, 397–418. [Google Scholar] [CrossRef]
  75. Cho, H.; Muslu, V. How do firms change investments based on MD&A disclosures of peer firms? Account. Rev. 2021, 96, 177–204. [Google Scholar] [CrossRef]
  76. Fan, R.; Wang, Y.; Chen, F.; Du, K.; Wang, Y. How do government policies affect the diffusion of green innovation among peer enterprises?—An evolutionary-game model in complex networks. J. Clean. Prod. 2022, 364, 132711. [Google Scholar] [CrossRef]
  77. Cho, E.; Kim, J.; Kim, S. Spillover effect of regulatory accounting inspections on accounting quality of peer companies. Manag. Audit. J. 2020, 35, 685–704. [Google Scholar] [CrossRef]
  78. Elhorst, J.P. Spatial Econometrics: From Cross-Sectional Data to Spatial Panels; Springer: Heidelberg, Germany, 2014; pp. 26–87. [Google Scholar]
  79. Martinetti, D.; Geniaux, G. Approximate likelihood estimation of spatial probit models. Reg. Sci. Urban Econ. 2017, 64, 30–45. [Google Scholar] [CrossRef]
  80. Smith, T.E.; LeSage, J.P. A Bayesian probit model with spatial dependencies. In Spatial and Spatiotemporal Econometrics (Advances in Econometrics, Vol. 18); Lesage, J.P., Kelley Pace, R., Eds.; Emerald Group Publishing Limited: Bingley, UK, 2004; Volume 18, pp. 127–160. [Google Scholar]
  81. Wang, X.; Kockelman, K.M. Application of the dynamic spatial ordered probit model: Patterns of land development change in Austin, Texas. Pap. Reg. Sci. 2009, 88, 345–365. [Google Scholar] [CrossRef]
  82. Zhou, D.; Qiu, Y.; Wang, M. Does environmental regulation promote enterprise profitability? Evidence from the implementation of China’s newly revised Environmental Protection Law. Econ. Model. 2021, 102, 105585. [Google Scholar] [CrossRef]
  83. Lin, Y.; Fu, X.; Fu, X. Varieties in state capitalism and corporate innovation: Evidence from an emerging economy. J. Corp. Financ. 2021, 67, 101919. [Google Scholar] [CrossRef]
  84. Feng, J.; Goodell, J.W.; Shen, D. ESG rating and stock price crash risk: Evidence from China. Financ. Res. Lett. 2022, 46, 102476. [Google Scholar] [CrossRef]
  85. Yan, Y.; Cheng, Q.; Huang, M.; Lin, Q.; Lin, W. Government environmental regulation and corporate ESG performance: Evidence from natural resource accountability audits in China. Int. J. Environ. Res. Public Health 2023, 20, 447. [Google Scholar] [CrossRef]
  86. Cui, J.; Dai, J.; Wang, Z.; Zhao, X. Does environmental regulation induce green innovation? A panel study of Chinese listed firms. Technol. Forecast. Soc. Chang. 2022, 176, 121492. [Google Scholar] [CrossRef]
  87. Haque, F.; Ntim, C.G. Environmental policy, sustainable development, governance mechanisms and environmental performance. Bus. Strateg. Environ. 2018, 27, 415–435. [Google Scholar] [CrossRef]
  88. Pan, X.; Chen, X.; Yang, X. Examining the relationship between negative media coverage and corporate social responsibility. Bus. Ethics Environ. Responsib. 2022, 31, 620–633. [Google Scholar] [CrossRef]
  89. Gong, G.; Huang, X.; Wu, S.; Tian, H.; Li, W. Punishment by Securities Regulators, Corporate Social Responsibility and the Cost of Debt. J. Bus. Ethics 2021, 171, 337–356. [Google Scholar] [CrossRef]
  90. Hao, J.; He, F. Corporate social responsibility (CSR) performance and green innovation: Evidence from China. Financ. Res. Lett. 2022, 48, 102889. [Google Scholar] [CrossRef]
  91. Sandberg, H.; Alnoor, A.; Tiberius, V. Environmental, social, and governance ratings and financial performance: Evidence from the European food industry. Bus. Strateg. Environ. 2023, 32, 2471–2489. [Google Scholar] [CrossRef]
  92. Lemma, T.T.; Muttakin, M.; Mihret, D. Environmental, social, and governance performance, national cultural values and corporate financing strategy. J. Clean. Prod. 2022, 373, 133821. [Google Scholar] [CrossRef]
  93. Limkriangkrai, M.; Koh, S.; Durand, R.B. Environmental, social, and governance (ESG) profiles, stock returns, and financial policy: Australian evidence. Int. Rev. Financ. 2017, 17, 461–471. [Google Scholar] [CrossRef]
  94. Mahmood, A.N.; Arslan, H.M.; Younas, Z.I.; Komal, B.; Ali, K.; Mubeen, M. Understanding the dynamics of capital structure, corporate governance, and corporate social responsibility in high- and low-leveraged US and Chinese firms. Environ. Sci. Pollut. Res. 2023, 30, 46204–46221. [Google Scholar] [CrossRef]
  95. Bellandi, F. Equilibrating financially sustainable growth and environmental, social, and governance sustainable growth. Eur. Manag. Rev. 2023, in press. [Google Scholar] [CrossRef]
  96. Yue, L.; Huang, C.; Cao, Y. The impact of FDI technology spillover on the innovation quality of Chinese enterprises: A microperspective based on geographic proximity. Eur. J. Innov. Manag. 2022, in press. [Google Scholar] [CrossRef]
  97. Jiang, X.; Li, Y. The relationship between organizational learning and firms’ financial performance in strategic alliances: A contingency approach. J. World Bus. 2008, 43, 365–379. [Google Scholar] [CrossRef]
  98. Liu, M.; Shan, Y.; Li, Y. Heterogeneous Partners, R&D cooperation and corporate innovation capability: Evidence from Chinese manufacturing firms. Technol. Soc. 2023, 72, 102183. [Google Scholar] [CrossRef]
  99. Gyimah, D.; Machokoto, M.; Sikochi, A.S. Peer influence on trade credit. J. Corp. Financ. 2020, 64, 101685. [Google Scholar] [CrossRef]
  100. Hu, C.; Zhu, X.; Liu, R.; Teng, Z. The impact of external technology acquisition on enterprise innovation performance: The moderating effect of geographical distance. Technol. Anal. Strateg. Manag. 2023, in press. [Google Scholar] [CrossRef]
  101. Zhang, S.; Li, J.; Li, N. Partner technological heterogeneity and innovation performance of R&D alliances. R D Manag. 2022, 52, 3–21. [Google Scholar] [CrossRef]
  102. Ryou, J.W.; Tsang, A.; Wang, K.T. Product market competition and voluntary corporate social responsibility disclosures. Contemp. Account. Res. 2022, 39, 1215–1259. [Google Scholar] [CrossRef]
  103. Wang, H.; Cui, H.; Zhao, Q. Effect of green technology innovation on green total factor productivity in China: Evidence from spatial durbin model analysis. J. Clean. Prod. 2021, 288, 125624. [Google Scholar] [CrossRef]
  104. Fan, L.; Yang, K.; Liu, L. New media environment, environmental information disclosure and firm valuation: Evidence from high-polluting enterprises in China. J. Clean. Prod. 2020, 277, 123253. [Google Scholar] [CrossRef]
  105. Xiang, C.; van Gevelt, T. Central inspection teams and the enforcement of environmental regulations in China. Environ. Sci. Policy 2020, 112, 431–439. [Google Scholar] [CrossRef]
  106. Lambertini, L.; Poyago-Theotoky, J.; Tampieri, A. Cournot competition and “green” innovation: An inverted-U relationship. Energy Econ. 2017, 68, 116–123. [Google Scholar] [CrossRef]
  107. Zeng, H.; Li, X.; Zhou, Q.; Wang, L. Local government environmental regulatory pressures and corporate environmental strategies: Evidence from natural resource accountability audits in China. Bus. Strateg. Environ. 2022, 31, 3060–3082. [Google Scholar] [CrossRef]
Figure 1. The number of A-share listed corporations that issued ESG reports from 2012 to 2021.
Sustainability 15 12925 g001
Figure 2. The estimation results of peer effect of corporate ESG performance in each year based on geography weight matrix spatial autoregressive model (SAR_W1). The dotted line denotes the 95% confidence interval.
Sustainability 15 12925 g002
Figure 3. The estimation results of peer effect of corporate ESG performance in each year based on the industry weight matrix spatial autoregressive model (SAR_W2). The dotted line denotes the 95% confidence interval.
Sustainability 15 12925 g003
Figure 4. The estimation results of peer effect of corporate ESG performance in each year based on product weight matrix spatial autoregressive model (SAR_W3). The dotted line denotes the 95% confidence interval.
Sustainability 15 12925 g004
Table 1. Variable definition and data source.
VariableDefinitionData Source
Dependent variables
ESG performanceWe apply the Sino-Securities ESG rating to demonstrate corporate ESG level and use the logarithm of the manually assigned number from 9 to 1 of each level as the ESG performance.WIND database
ESG level increaseA binary dependent variable that equals one if the corporate ESG rating increased from the previous year, otherwise it is zero.Calculated based on ESG performance
ESG level decreaseA binary dependent variable that equals one if corporate ESG rating decreased from the previous year, otherwise it is zero.Calculated based on ESG performance
ESG levelAn ordered dependent variable that corresponds to each ESG rating by manually assigning a number from 9 to 1.WIND database
Core explanatory variables
Negative web newsNegative news is measured by the natural logarithm of the number of negative web news reports about a firm during the year.CNRDS database
Environmental punishmentEnvironmental punishment is a dummy variable that equals one if a firm is punished due to environmental issues during the year and is zero otherwise.CNRDS database
Green patentGreen patent is measured by the natural logarithm of the number of firm’s registered green patents during the year.CNRDS database
Control variables
Return on assetsReturn on assets is a measure of a corporation’s capital performance, which equals the fiscal year-end net income divided by total assets.CNRDS database
Book leverageLeverage is measured by a corporation’s total year-end debt divided by year-end total assets.CNRDS database
Profit growth ratioProfit growth ratio is the growth rate of the corporation’s year-end net profit.CNRDS database
The large shareholders’ ratioThe total shareholding ratio of the largest ten shareholders.CNRDS database
The strength of independent directorThe proportion of independent directors on the board of directors.CNRDS database
Spatial weight matrices
Geography spatial weight matrixThe element of geography weight matrix equals one if the two matched different corporations are located in the same province, otherwise it is zero.Constructed based on CSRC registered information in WIND database
Industry spatial weight matrixThe element of industry weight matrix equals one if the two matched different corporations belong to the same industry, otherwise it is zero.Constructed based on CSRC industry classification standard in WIND database
Product spatial weight matrixThe element of product weight matrix equals one if the two matched different corporations have the same main product type, otherwise it is zero.Constructed based on CSRC listed firms’ main product information in WIND database
Table 2. The estimation results of corporate ESG performance of panel models.
(1) (2) (3)(4)
OLS_FEOLS_FEOLS_REOLS_RE
Neg_news−0.026 ***
(0.000)
−0.025 ***
(0.000)
−0.021 ***
(0.000)
−0.020 ***
(0.000)
Env_punish−0.121 ***
(0.000)
−0.120 ***
(0.000)
−0.108 ***
(0.000)
−0.104 ***
(0.000)
Green_patent0.006 **
(0.019)
0.005 **
(0.037)
0.015 ***
(0.000)
0.014 ***
(0.000)
ROA 0.002 ***
(0.000)
0.003 ***
(0.000)
Lev −0.005
(0.353)
−0.001
(0.190)
Growth −0.002
(0.117)
−0.001
(0.163)
First 0.182 ***
(0.000)
0.179 ***
(0.000)
Indp 0.289 ***
(0.000)
0.291 ***
(0.000)
_cons1.693 ***
(0.000)
1.472 ***
(0.000)
1.660 ***
(0.000)
1.439 ***
(0.000)
FirmControlControl
YearControlControl
R_squared0.1590.3040.1400.284
Hausman’s71.240 ***
(0.000)
171.410 ***
(0.000)
Loglikelihood1997.3492047.792
AIC−3986.698−4077.584
BIC−3959.394−4016.148
Observations6810681068106810
Note: **, and *** indicate significance at the 0.05, and 0.01 levels, and the p value is in the brackets. The dependent variable is the heavy-pollution industry listed corporation’s ESG performance.
Table 4. The estimation results of peer effect of corporate ESG performance based on the spatial Durbin model.
(11)(12)(13)
SDM_W1SDM_W2SDM_W3
W × ESG_perform0.136 ***
(0.000)
0.217 ***
(0.000)
0.094 ***
(0.000)
Neg_news−0.035 ***
(0.000)
−0.037 ***
(0.000)
−0.034 ***
(0.000)
Env_punish−0.121 ***
(0.000)
−0.122 ***
(0.000)
−0.120 ***
(0.000)
Green_patent0.011 ***
(0.000)
0.009 **
(0.010)
0.008 **
(0.010)
W × Neg_news0.021 **
(0.015)
0.034 ***
(0.000)
0.024 ***
(0.005)
W × Env_punish0.216
(0.191)
0.297 *
(0.060)
0.214 *
(0.093)
W × Green_patent−0.033 ***
(0.000)
−0.005
(0.531)
−0.008
(0.278)
ROA0.002 ***
(0.001)
0.002 **
(0.010)
0.002 ***
(0.001)
Lev−0.005
(0.638)
−0.005
(0.630)
−0.005
(0.637)
Growth−0.001
(0.452)
−0.001
(0.477)
−0.001
(0.474)
First0.156 ***
(0.001)
0.158 ***
(0.001)
0.167 ***
(0.001)
Indp0.293 ***
(0.000)
0.296 ***
(0.000)
0.296 ***
(0.000)
FirmControlControlControl
YearControlControlControl
R_squared0.3820.3620.339
Hausman125.610 ***
(0.000)
132.360 ***
(0.000)
129.140 ***
(0.000)
Wald_sar21.050 ***
(0.000)
16.250 ***
(0.001)
12.010 ***
(0.007)
Wald_sem17.760 ***
(0.000)
11.240 **
(0.011)
10.030 **
(0.018)
Loglikelihood2082.2892081.7612065.833
AIC−4138.580−4137.523−4105.666
BIC−4049.848−4048.783−4016.926
Observations681068106810
Note: *, **, and *** indicate significance at the 0.1, 0.05, and 0.01 levels, and the p value is in the brackets. The dependent variable is the heavy-pollution industry listed corporation’s ESG performance.
Table 5. The direct effect and indirect effect decomposition of spatial Durbin models.
SDM_W1SDM_W2SDM_W3
Neg_news−0.016 *
(0.051)
−0.003
(0.733)
−0.010
(0.164)
Total
_effect
Env_punish0.121
(0.535)
0.236
(0.249)
0.109
(0.455)
Green_patent−0.025 **
(0.012)
0.004
(0.693)
0.001
(0.919)
Neg_news−0.035 ***
(0.000)
−0.037 ***
(0.000)
−0.034 ***
(0.000)
Direct
_effect
Env_punish−0.121 ***
(0.000)
−0.121 ***
(0.000)
−0.119 ***
(0.000)
Green_patent0.011 ***
(0.000)
0.009 ***
(0.005)
0.008 ***
(0.006)
Neg_news0.019 **
(0.040)
0.034 **
(0.003)
0.023 ***
(0.009)
Indirect
_effect
Env_punish0.242
(0.196)
0.357 *
(0.074)
0.229 *
(0.069)
Green_patent−0.037 ***
(0.000)
−0.005
(0.634)
−0.008
(0.279)
Note: *, **, and *** indicate significance at the 0.1, 0.05, and 0.01 levels, and the p value is in the brackets.
Table 6. The estimation results of peer-pulling effect of corporate ESG level increase based on spatial autoregressive probit model.
(18)(19)(20)(21)(22)(23)
SAR_ Probit_W1SAR_ Probit_W1SAR_ Probit_W2SAR_ Probit_W2SAR_ Probit_W3SAR_ Probit_W3
W × ESG_levelup0.615 ***
(0.000)
0.615 ***
(0.000)
0.639 ***
(0.002)
0.621 ***
(0.003)
0.325 **
(0.014)
0.317 **
(0.018)
Neg_news−0.105 ***
(0.000)
−0.099 ***
(0.000)
−0.106 ***
(0.000)
−0.101 ***
(0.000)
−0.111 ***
(0.000)
−0.106 ***
(0.000)
Env_punish−0.469 *
(0.059)
−0.475 *
(0.057)
−0.431 *
(0.082)
−0.435 *
(0.080)
−0.424 *
(0.086)
−0.428 *
(0.084)
Green_patent0.039 *
(0.061)
0.038 *
(0.079)
0.041 *
(0.052)
0.039 *
(0.067)
0.043 **
(0.041)
0.041 *
(0.053)
ROA 0.009 ***
(0.004)
0.010 ***
(0.006)
0.011 ***
(0.005)
Lev 0.006
(0.175)
0.005
(0.193)
0.005
(0.200)
Growth −0.001
(0.138)
−0.001
(0.144)
−0.001
(0.340)
First 0.104 *
(0.068)
0.118*
(0.058)
0.109 *
(0.083)
Indp 0.140 **
(0.013)
0.143 **
(0.011)
0.143 **
(0.011)
FirmControlControlControlControlControlControl
YearControlControlControlControlControlControl
R_squared0.0850.0880.0850.0870.0840.086
Loglikelihood−3207.518−3198.185−3210.464−3201.380−3212.080−3202.884
AIC7785.0377776.3717790.9297782.7617794.1617785.768
BIC12,388.78112,413.71612,394.67212,420.17312,397.93412,423.113
Observations612961296129612961296129
Note: *, **, and *** indicate significance at the 0.1, 0.05, and 0.01 levels, and the p value is in the brackets. The dependent variable is the heavy-pollution industry listed corporation’s ESG level increase.
Table 7. The estimation results of peer-dragging effect of corporate ESG level decrease based on spatial autoregressive probit model.
(28)(29)(30)(31)(32)(33)
SAR_ Probit_W1SAR_ Probit_W1SAR_ Probit_W2SAR_ Probit_W2SAR_ Probit_W3SAR_ Probit_W3
W × ESG
_leveldown
0.622 ***
(0.001)
0.620 ***
(0.001)
0.697 ***
(0.002)
0.682 ***
(0.002)
0.073
(0.603)
0.064
(0.651)
Neg_news0.129 ***
(0.000)
0.114 ***
(0.000)
0.129 ***
(0.000)
0.114 ***
(0.000)
0.134 ***
(0.000)
0.119 ***
(0.000)
Env_punish0.718 ***
(0.001)
0.727 ***
(0.001)
0.714 ***
(0.001)
0.724 ***
(0.001)
0.706 ***
(0.002)
0.715 ***
(0.001)
Green_patent−0.059 *
(0.061)
−0.057 ***
(0.009)
−0.056 **
(0.011)
−0.054 **
(0.014)
−0.061 ***
(0.005)
−0.059 ***
(0.007)
ROA −0.017 ***
(0.000)
−0.017 ***
(0.000)
−0.017 ***
(0.000)
Lev −0.002
(0.639)
−0.001
(0.757)
−0.002
(0.713)
Growth 0.002
(0.123)
0.001
(0.111)
0.002
(0.111)
First −0.399 **
(0.043)
−0.413 **
(0.031)
−0.398 **
(0.045)
Indp −0.151 ***
(0.009)
−0.154 ***
(0.008)
−0.150 ***
(0.009)
FirmControlControlControlControlControlControl
YearControlControlControlControlControlControl
R_squared0.0830.0880.0850.0880.0810.086
Loglikelihood−3088.502−3068.556−3089.567−3069.605−3094.381−3074.191
AIC7547.0047517.1127549.1347519.2167558.7617528.381
BIC12,150.74112,154.45512,152.87212,156.55312,162.54512,165.723
Observations612961296129612961296129
Note: *, **, and *** indicate significance at the 0.1, 0.05, and 0.01 levels, and the p value is in the brackets. The dependent variable is the heavy-pollution industry listed corporation’s ESG level decrease.
Table 8. The estimation results of peer effect of corporate ESG performance based on a spatial error model.
(34) (35)(36)(37)(38)(39)
SEM_W1SEM_W1SEM_W2SEM_W2SEM_W3SEM_W3
W × Residual0.190 ***
(0.000)
0.173 ***
(0.000)
0.270 ***
(0.000)
0.250 ***
(0.000)
0.111 ***
(0.000)
0.087 ***
(0.000)
Neg_news−0.030 ***
(0.000)
−0.027 ***
(0.000)
−0.032 ***
(0.000)
−0.029 ***
(0.000)
−0.028 ***
(0.000)
−0.027 ***
(0.000)
Env_punish−0.125 ***
(0.000)
−0.124 ***
(0.000)
−0.127 ***
(0.000)
−0.125 ***
(0.000)
−0.124 ***
(0.000)
−0.122 ***
(0.000)
Green_patent0.008 ***
(0.006)
0.007 **
(0.014)
0.007 **
(0.017)
0.006 **
(0.035)
0.007 **
(0.024)
0.006 **
(0.045)
ROA 0.002 ***
(0.001)
0.002 ***
(0.002)
0.002 ***
(0.001)
Lev −0.005
(0.664)
−0.006
(0.595)
−0.005
(0.616)
Growth −0.001
(0.452)
−0.001
(0.475)
−0.002
(0.452)
First 0.174 ***
(0.000)
0.169 ***
(0.001)
0.179 ***
(0.000)
Indp 0.274 ***
(0.001)
0.296 ***
(0.000)
0.289 ***
(0.001)
FirmControlControlControlControlControlControl
YearControlControlControlControlControlControl
R_squared0.1590.3020.1590.3010.1590.304
Loglikelihood2013.2242056.8002021.5672067.7642005.8792055.106
AIC−4016.449−4101.404−4033.136−4115.529−4001.758−4090.212
BIC−3982.318−4033.143−3999.005−4047.268−3967.627−4090.212
Observations681068106810681068106810
Note: **, and *** indicate significance at the 0.05, and 0.01 levels, and the p value is in the brackets. The dependent variable is the heavy-pollution industry listed corporation’s ESG performance.
Table 9. The estimation results of endogenous tests of corporate ESG performance peer effect.
Panel A: IV-2SLS First Stage (Dependent Variable: W × E S G _ p e r f o r m i , t )
(40)(41)(42)
W1W2W3
IVs0.439 ***
(0.000)
0.502 ***
(0.000)
0.382 ***
(0.000)
ControlsYesYesYes
FirmControlControlControl
YearControlControlControl
Stock–Yogo weak ID F-test 10% critical value16.38016.38016.380
Cragg–Donald–Wald F-statistic1195.2901734.160873.440
Kleibergen–Paap–Wald rk F-statistic851.800445.100165.220
Kleibergen–Paap rk LM-statistic204.560 ***
(0.000)
259.900 ***
(0.000)
70.780 ***
(0.000)
Observations612961296129
Panel B: IV-2SLS Second stage (Dependent variable: E S G _ p e r f o r m i , t )
IVs0.513 ***
(0.001)
0.754 ***
(0.000)
0.434 ***
(0.001)
Neg_news−0.025 ***
(0.000)
−0.025 ***
(0.000)
−0.025 ***
(0.000)
Env_punish−0.136 ***
(0.000)
−0.139 ***
(0.000)
−0.135 ***
(0.000)
Green_patent0.008 **
(0.011)
0.005 *
(0.096)
0.006 *
(0.051)
ROA0.002 ***
(0.001)
0.002 ***
(0.001)
0.002 ***
(0.001)
Lev−0.003
(0.803)
−0.005
(0.628)
−0.004
(0.654)
Growth−0.002
(0.412)
−0.002
(0.448)
−0.002
(0.411)
First0.166 ***
(0.003)
0.162 ***
(0.004)
0.170 ***
(0.003)
Indp0.267 ***
(0.004)
0.302 ***
(0.001)
0.287 ***
(0.002)
FirmControlControlControl
YearControlControlControl
Adj R_squared0.3210.3320.273
Observations612961296129
Note: *, **, and *** indicate significance at the 0.1, 0.05, and 0.01 levels, and the p value is in the brackets.
Table 10. The estimation results of peer-pulling effect of corporate ESG level based on ordered spatial autoregressive probit model.
(47)(48)(49)(50)(51)(52)
SAR_ Probit_W1SAR_ Probit_W1SAR_ Probit_W2SAR_ Probit_W2SAR_ Probit_W3SAR_ Probit_W3
W × ESG_level0.388 ***
(0.000)
0.376 ***
(0.000)
0.640 ***
(0.000)
0.627 ***
(0.000)
0.333 ***
(0.000)
0.330 ***
(0.000)
Neg_news−0.169 ***
(0.000)
−0.162 ***
(0.000)
−0.163 ***
(0.000)
−0.156 ***
(0.000)
−0.169 ***
(0.000)
−0.161 ***
(0.000)
Env_punish−0.901 ***
(0.000)
−0.902 ***
(0.000)
−0.915 ***
(0.000)
−0.915 ***
(0.000)
−0.896 ***
(0.000)
−0.898 ***
(0.000)
Green_patent0.059 ***
(0.000)
0.055 ***
(0.000)
0.050 ***
(0.001)
0.046 ***
(0.003)
0.054 ***
(0.000)
0.050 ***
(0.001)
ROA 0.011 ***
(0.000)
0.010 ***
(0.000)
0.011 ***
(0.000)
Lev 0.001
(0.981)
−0.006
(0.837)
−0.005
(0.845)
Growth −0.001
(0.127)
−0.001
(0.228)
−0.001
(0.423)
First 0.878 ***
(0.000)
0.881 ***
(0.000)
0.894 ***
(0.000)
Indp 0.209 ***
(0.000)
0.221 ***
(0.000)
0.216 ***
(0.000)
FirmControlControlControlControlControlControl
YearControlControlControlControlControlControl
R_squared0.2770.2810.2790.2830.2780.282
Loglikelihood−7597.089−7553.970−7575.630−7533.117−7592.841−7549.018
AIC16,576.18016,499.94716,533.26016,458.24216,567.68416,490.044
BIC21,293.05121,250.94621,250.13221,209.23121,284.55321,241.043
Observations681068106810681068106810
Note: *** indicate significance at the 0.01 levels, and the p value is in the brackets. The dependent variable is the heavy-pollution industry listed corporation’s ESG level.
Disclaimer/Publisher’s Note: The statements, opinions and data contained in all publications are solely those of the individual author(s) and contributor(s) and not of MDPI and/or the editor(s). MDPI and/or the editor(s) disclaim responsibility for any injury to people or property resulting from any ideas, methods, instructions or products referred to in the content.

