Article

Modeling Multi-Generation Product Diffusion in the Context of Dual-Brand Competition and Sustainable Improvement

School of Management Science and Engineering, Dongbei University of Finance and Economics, Dalian 116025, China
*
Author to whom correspondence should be addressed.
Sustainability 2023, 15(17), 12920; https://doi.org/10.3390/su151712920
Submission received: 28 June 2023 / Revised: 22 August 2023 / Accepted: 23 August 2023 / Published: 27 August 2023
(This article belongs to the Special Issue Sustainable Supply Chain and Operation Management)

Abstract

:
The diffusion of competition under the coexistence of multi-generation products has become one of the important challenges faced by enterprises in their daily and sustainable operations. At the same time, the competition between different brands has intensified the difficulty and complexity of decision making in the process of multi-generation product operations. Therefore, based on the Norton–Bass model diffusion process, this paper introduces two marketing variables: dynamic price and quality level. Then, this paper builds a multi-generation product diffusion model under dual-brand competition and analyzes the impact of the company’s revenue on launch time to market, pricing, quality, and technical levels. By using the system dynamics (SD) method (from the perspective of strong brand and weak brand enterprises), the competition diffusion model is built and simulated. The simulation indicates the following: (i) When enterprises have the same brand competitiveness, reducing the pricing level cannot obtain more revenue and instead diminishes the overall revenue of the industry. Raising the pricing level can obtain more revenue and also improve the revenue of competitors. (ii) When the competitive strengths of enterprises are different, strong brands tend to maintain stable pricing on the basis of improving the quality level (or slightly raising the price). Weak brands tend to raise the pricing of new products significantly on the basis of improving the quality level. (iii) The launch-time-to-market decision of new products is influenced by the degree of the product quality upgrade. Therefore, the frequency of releasing new products should trade off against the degree of technological upgrading of the product quality. This research provides a theoretical basis and new insights for new product launches and operation decisions of enterprises.

1. Introduction

With the acceleration of scientific and technological progress and the rapid variation and continuous increase in consumer demand, single-generation products have been unable to meet consumers’ needs; more and more enterprises use the multi-generation product upgrade method to provide consumers with new products [1]. A relevant study showed that the profits of multi-generation products launched by enterprises is 26% higher than those of multi-series single-generation products and 40% higher than those of pure single-generation products [2]. Moreover, in a gradually saturated market, multi-generation products will also encourage consumers to make repeated purchases [3] and improve the overall revenue of enterprises. For example, Apple, Xiaomi, and Huawei in the mobile phone industry and BYD and Tesla in the electric vehicle industry provide products and services for consumers through continuous multi-generation product upgrades in order to promote sales and achieve sustainable development. In addition, in the operation process of multi-generation product upgrades, these high-tech enterprises also face the impact of competitors on brand, pricing, quality, and launch time to market, which makes the competitive environment of enterprises more complex and severe; the increasing frequency of new products to market also reduces product innovation and manufacturing sustainability [4]. The multi-generation diffusion modes are considered well used to describe the upgrading process of the products [5]. In the process of multi-generation product diffusion, price is often considered as a marketing factor [6]. Brands affect the diffusion rate of products through advertising, which also has an impact on the diffusion rate of competitors [7]. Meanwhile, product quality has an impact on this diffusion process. Gradual and continuous upgrading of quality or technology can enable enterprises to succeed more easily than taking a giant leap [2]; it is also a way for enterprises to obtain long-term development, which makes the competition between enterprises more intense. In such complicated situations, enterprises need to perform a trade-off with the product launch time to market and also consider the substitution effect of consumer behaviors between multi-generation products; these factors jointly play a role in corporate revenue and decision making. In the dynamic environment of brand competition, establishing how to make product upgrading and pricing decisions and considering the influence between generations of products are very important issues; however, there has been insufficient effort made in the existing research on these topics. Therefore, in the increasingly competitive business environment, strategic decision-making problems need to be solved in order to systematically analyze the relationship between the brand, pricing, quality, or technological upgrading of the products and the launch time to market, as well as to plan the product comprehensively in the operation process of multi-generation products to obtain a long-term competitive advantage and growth path.
Our main aim is to build a multi-generation diffusion model in the context of two-brand competition, explore the pricing of multi-generation products under different brand values and quality levels, and maximize profits as the goal of the simulations. Finally, we discuss the launch time to market. This paper puts forward the enterprise product analysis path of “pricing–quality upgrade–launch” under brand competition; reveals the relationship between pricing, quality level upgrade, and launch time to market; expands the multi-generation products diffusion theory; and provides a theoretical basis and new insights for enterprises’ new product launches and operation decisions.
The study of multi-generation product diffusion based on computer simulation is a common method nowadays, and approaches relating to multi-generation product diffusion via system dynamics have been adopted by various studies [5,8]. Therefore, we use the system dynamics method to conduct experimental simulations of the model. In this paper, the marketing factors such as declining dynamic prices and quality levels are added. The influence of brand value spillover effects on the diffusion process and pricing is emphatically discussed, and the path of continuous product innovation and improvement is explored.
The remainder of this paper is organized as follows. In Section 2, we review the related literature on multi-generation diffusion and marketing factors in the diffusion process. We then explain the multi-generational diffusion model and analyze consumers’ behaviors in this diffusion process in Section 3. Then, the diffusion system of the multi-generation product model in the context of dual-brand competition is built in Section 4, and we use the system dynamics method to simulate and compute the solution in Section 5. We then verify the model and related summaries with a case study in Section 6. Finally, we conclude this study in Section 7.

2. Literature Review

2.1. Multi-Generation Diffusion

With regard to the multi-generation upgrading of products, relevant scholars have conducted a large number of relevant studies [4,5,6,7,8,9,10,11,12,13]. Among these studies, the multi-generation upgrading of products can be divided into two modes: one is the complete replacement of old products after new products are launched—that is, replacing single-generation products; the second is new products gradually eliminating old products until the sales of the old products drop to 0—that is, multi-generation coexistence. Among these two modes, multi-generation coexistence is the most common, and this paper mainly aims to study the market coexistence of multi-generation products. At present, the extension modeling of new products’ diffusion based on the Bass model and the characterization of consumer demand and purchase processes constitute one of the main methods to study multi-generation product upgrading. Based on the original Bass model [14], Norton and Bass relaxed and extended the assumed conditions and built the Norton–Bass model of diffusion of multi-generation products [9]. Later, many scholars continued to expand the Norton–Bass model. Jiang [6] developed the generalized multi-generation diffusion model (Generalized Norton–Bass model) based on the Norton–Bass model, analyzed the leapfrogging adoption purchasing and switching adoption purchasing behaviors in the diffusion process, and proved the superiority of the model with an empirical approach. Islam [10] and Ilonen [11] studied the effect of sales of old products on the diffusion of new products, as well as on the diffusion of products related to multiple categories. Guo [12] segmented the market from the perspective of strategic consumers. Based on the Norton–Bass model, they analyzed the impact of price discounts on consumers’ purchasing behaviors between multi-generations of products and the impact of the products’ performances on time to market. In addition, Dhakal [5] performed a systematic review of multi-generation diffusion models (MGDMs), in which they presented a detailed overview and summarized the main research methods of MGDMs. Based on the Norton–Bass model, with the deepening of the research in this field, scholars have added the influence of brand factor on the basis of the competition between new and old products of many generations. Zhang [15] performed an empirical study of multi-generation products’ diffusion based on competition, which was carried out to describe the competitive complementary effect and competitive substitution effect in product diffusion. Hapuwatte [4] proposed a prediction method based on the Norton–Bass model for continuous multi-generation design to plan the sustainable performance of products. With the further expansion of the research in this field, scholars have added the influence of brand competition factor on the basis of the competition between new and old products of many generations [16,17,18,19,20,21]. Kim [22] proposed a multi-generational diffusion model for homogeneous products and studied the effects of the diffusion of other categories of products on the product markets of concern. Libai [23] built a competitive diffusion model with both internal and cross-brand interactions and analyzed the process of brand diffusion. Shi [7] built a multi-brand and multi-generation diffusion model based on the Norton–Bass model and verified the effectiveness of the model with empirical methods. Based on the Bass model and the multi-generation diffusion model, Aggrawal [24] discussed how users transfer between different brands and verified the model with actual data. The above research analyzes the diffusion process under the influence of combining brand factors with a diffusion model, then builds a multi-generation diffusion model under a brand competition environment.

2.2. Marketing Factor in Diffusion Process

This paper studies a brand’s pricing strategies in a pure duopoly competition environment because pricing is an effective tool to either prevent or alleviate the problem of high uncertainty in a new product’s introduction, often leading to extreme cases of demand and supply mismatches [25]. Li [26] examined offensive pricing strategies in a two-platform competition, and this study found that word-of-mouth (WOM) marketing can effectively affect the pricing strategies in the platform business. McGrath [27] offered three main pricing strategies such as pricing leadership, penetration pricing, and experience curve pricing. Experience curve pricing is a defense strategy for discouraging competition; it is a downward price strategy, which can drop the price to a quarter of the original [28]. These works show that we can introduce price into the brand product diffusion process and discuss it with regard to product upgrades and new products’ launch times. In the process of competition and diffusion of high-tech products, experience curve pricing is a common price strategy.
In addition, some research processes of multi-generation product upgrading consider the price and quality or technical factors. Generally speaking, product quality is the key to consumers’ choices of product, measuring the degree of a product’s upgrade and also affecting product pricing [29]. Therefore, in the spread of multi-generation products, the quality factor must be considered. Some previous studies jointly optimized price and quality [30,31,32] and analyzed enterprises’ quality and price competition strategies for different consumers by constructing consumer functions. Some scholars have introduced quality level as a key factor to the optimal decision-making problem of product renewal design and determined the optimal quality upgrade level by constructing a non-competitive model, in which new and old products coexist in competition and old products are gradually withdrawn. Through in-depth research, it was found that quality and technical levels have an important impact on the time to market of multi-generation products, and there should be a certain balance between the two [2]. Druehl [33] studied the relationship between the launch time of updated products and profit changes based on the Bass model and also explored updates for the optimal release time of products. Feng [34] used the game analysis framework to study the entry strategy of new entrants in the software-as-a-service market and analyzed the impact of product quality on a product’s launch time. Lobel [35] found that when the company does not announce future technology, it is optimal to release a new generation of products periodically with fixed technology upgrades, and when this technology is announced, it is optimal to release it periodically with size-alternating technology upgrades. In addition, some scholars study the renewal and listing of multi-generation products from the perspective of production and marketing [36,37,38,39]. Kalyanaram [38] pointed out that new products should be listed as soon as possible to improve competitive advantage. Grützner [39] pointed out that companies need to perform a trade-off with the timing of product replacement, and some scholars also pay attention to consumer behavior in the process of product diffusion [13,40]. Jun [13] studied a multi-generation product model that incorporates the diffusion effect and the selection effect and captures the substitution process between products.
The above works mainly analyze and optimize pricing, launch time to market, and quality or technology upgrade strategies based on the construction of multi-generation products models and the process of product upgrading, or they only discuss the diffusion of one-generation products under the brand competition environment, while there are still many deficiencies in the research on the two dimensions of multi-generation product upgrading and the brand competition environment. Few scholars pay attention to the relationship between quality level upgrades and launch time to market in the process of multi-generation product upgrading under competitive conditions. There is also very little research reflecting the important influence of quality or technology upgrades on multi-generation product diffusion, the dynamic nature of price, or the spillover value of brand competition with sufficient effort. Therefore, based on the multi-generation diffusion models, this study establishes a dynamic multi-generation product diffusion system model by integrating the factors of brand, pricing, quality upgrading, and launch time to market.

3. The Model

3.1. The Brand Competition Diffusion

Brand A and brand B supply substitutable products at the same time. We assume that brand A diffusion and brand B diffusion have no influence on each other—that is, in the same market, the diffusion of one brand and the diffusion of another brand are relatively independent, and the diffusion of brands does not promote or hinder each other. With reference to the brand competition model established by Savin [41] and Libai [23], this paper mainly studies the competition at the brand level of products, without considering the cross-brand interaction, and we obtain a competitive diffusion model of double-brand A and B, as shown in Equations (1) and (2):
d N A t d t = p + q N A t M M N t
d N B t d t = p + q N B t M M N t
N t = N A t + N B t
where Nj(t) represents the cumulative number of diffusion products of brand j at time t, j = A, B.

3.2. Separation of Consumer Behaviors under Multi-Generation Diffusion
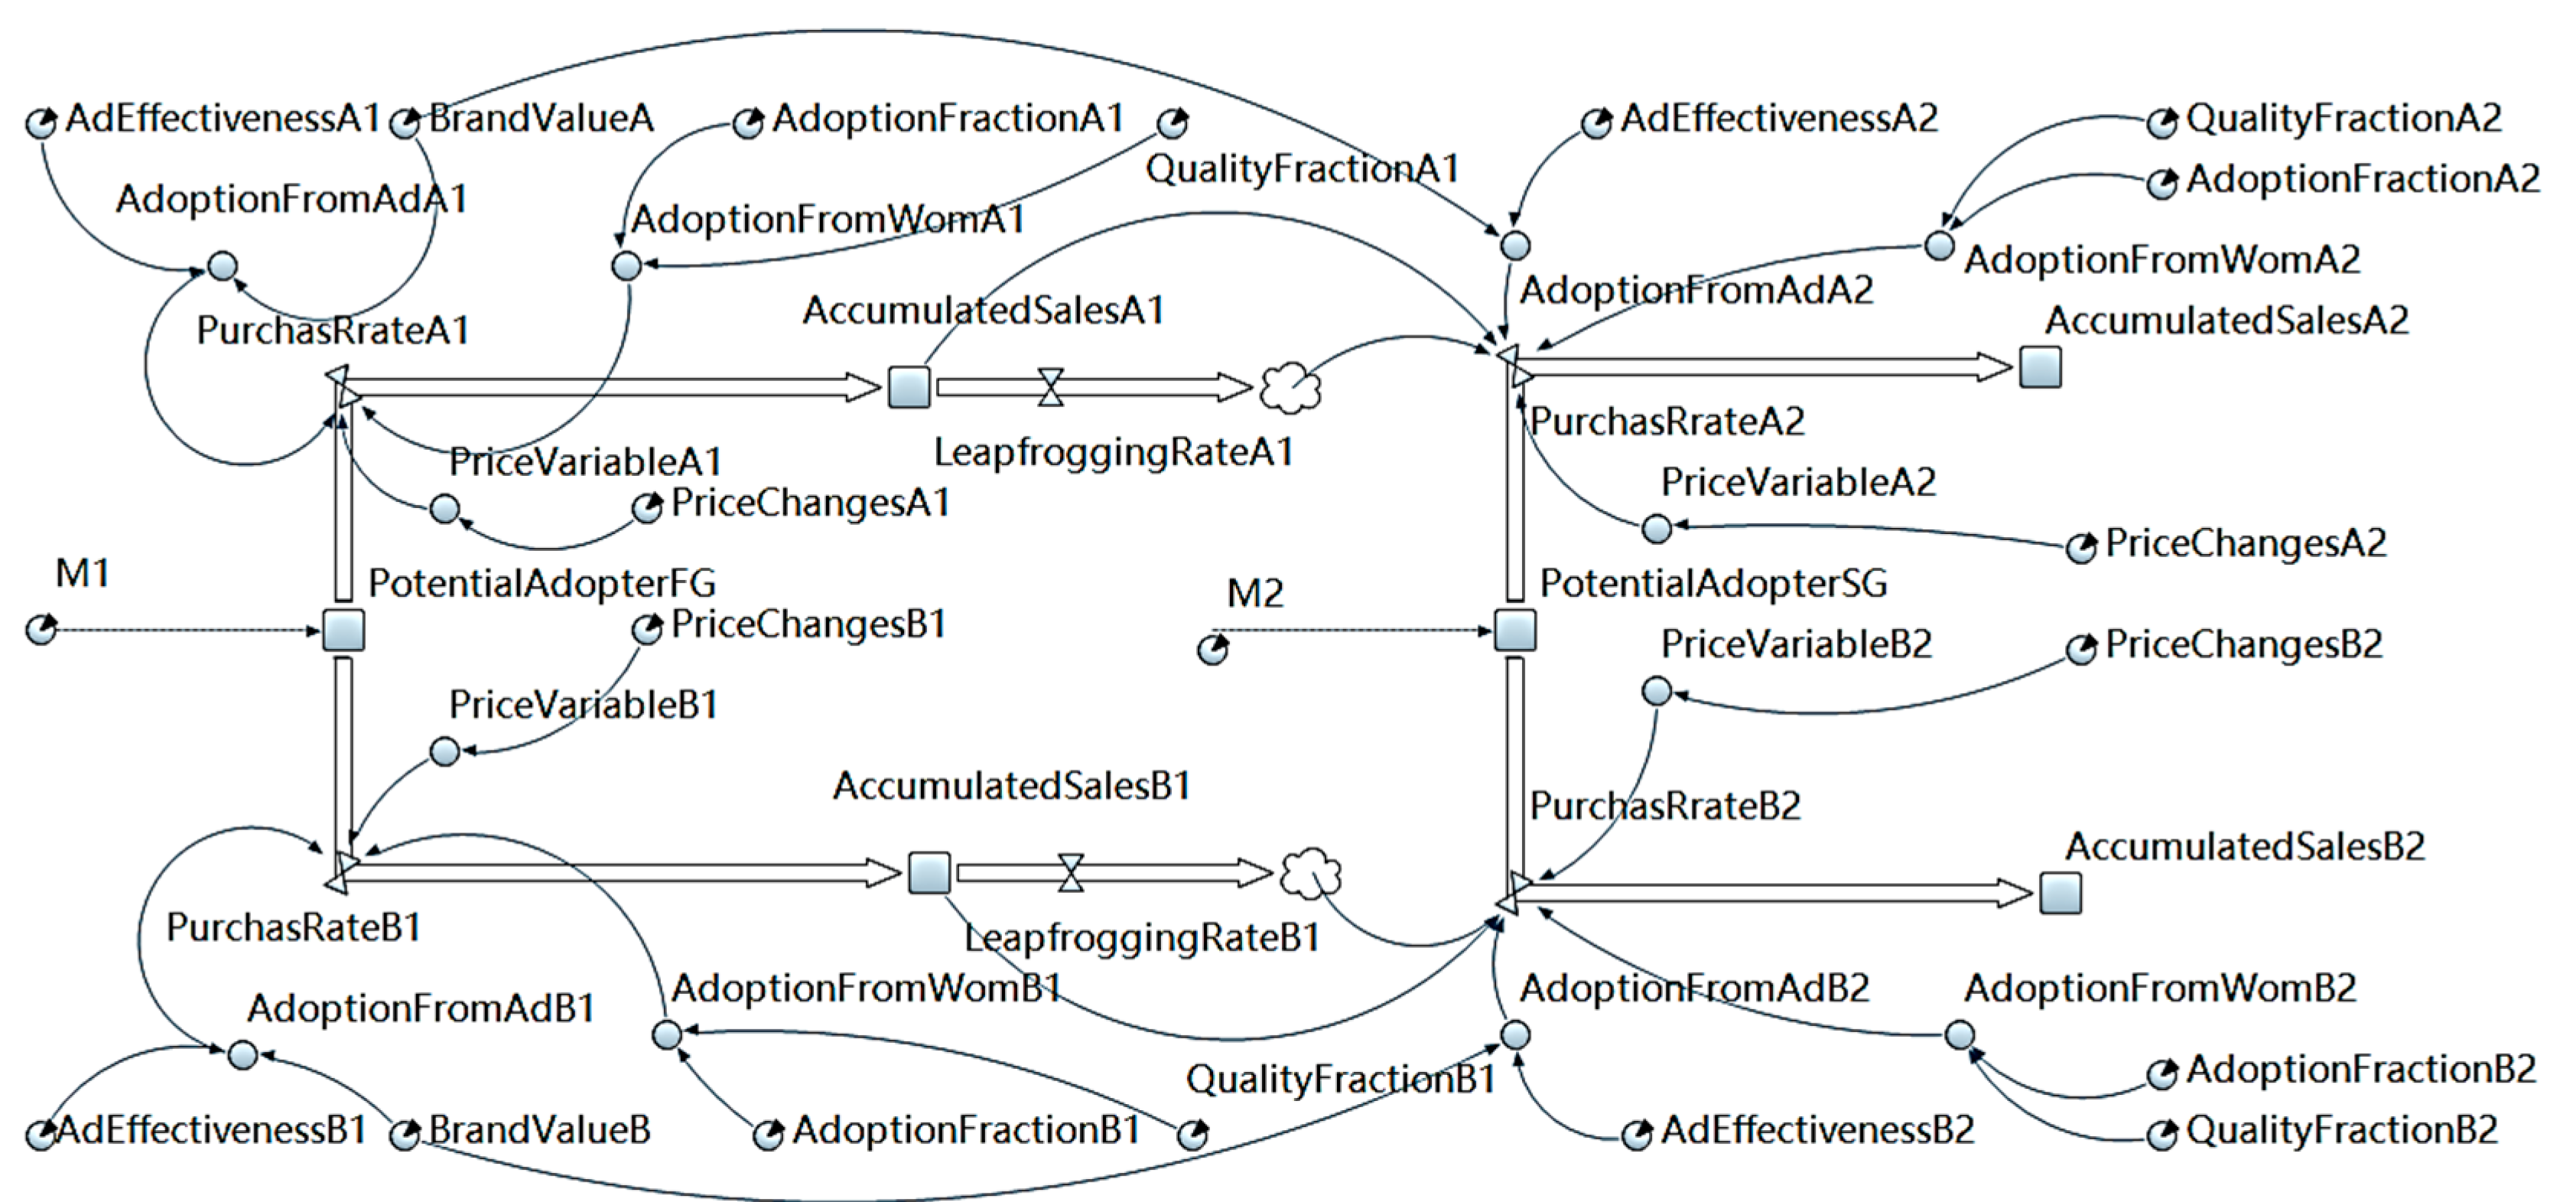
In the Norton–Bass model, the diffusion process between the two generations of products is in the following form:
S 1 t = m 1 F 1 t 1 F 2 t τ 2      
S 2 t = F 2 t τ 2 m 2 + m 1 F 1 t
where mi is the potential market size, i = 1, 2, and i represents the different generations of products. In general, the potential market size of second-generation products is larger than the potential size of the first-generation market. Fi(t) represents the diffusion adoption concerning generation at time t, where fi(t) is the derivative of Fi(t) and represents the diffusion rate of generation i at time t. Si(t) is the number of units in use under the coexistence of multiple generations at time t—that is, the rates of sales under the influence of multiple generations of products.
When consumers buy multi-generation products, they show different preferences and behaviors [40,42]. Although the multi-generation strategy is more profitable than the single-generation strategy, it can also result in inter-generation cannibalization [43], where sales of first-generation products are affected by the number of consumers skipping products, and sales of second-generation products are affected by two quantitative dimensions: consumers skipping products of the first-generation and upgrading on products of the first-generation.
Based on the Norton–Bass model and referring to Jiang [6], this paper separates the consumer behavior into two types, leapfrogging buyers or adoptions and switching buyers or adoptions, which are also referred to as repeat buyers. Leapfrogging buyers represent the behavior of potential buyers or adopters skipping the previous generation and directly buying a newer generation. Switching buyers or adopters represent some existing buyers of the immediate previous generation being willing to purchase new-generation products. These terms describe the cannibalistic behaviors of the next generation of products over the previous generation.
As Jiang [6] describes, the leapfrogging buyers or adoptions at time t can be expressed as follows:
u 2 t = m 1 f 1 t F 2 t τ 2 ,   t τ 2  
and the switching buyers or adoptions at time t can be expressed as
w 2 t = m 1 F 1 t f 2 t τ 2 , t τ 2  
We add the competition diffusion of brands to the expression above, then the leapfrogging buyers or adoptions at time t of each brand are given using
u A 2 = α A p A 1 + k A 1 q A 1 N A 1 t M 1 M 1 N A 1 t N B 1 t e β A p A 1 t N A 2 t τ 2 M 2
u B 2 = α B p B 1 + k B 1 q B 1 N B 1 t M 1 M 1 N B 1 t N A 1 t e β B p B 1 t N B 2 t τ 2 M 2
and the switching buyers or adoptions at time t of each brand are given using
w A 2 = N A 1 t α A p A 2 + k A 2 q A 2 N A 2 t τ 2 M 2 1 N A 2 t τ 2 M 2 N B 2 t τ 2 M 2 e β A p A 2 t τ 2
w B 2 = N B 1 t α B p B 2 + k B 2 q B 2 N B 2 t τ 2 M 2 1 N B 2 t τ 2 M 2 N A 2 t τ 2 M 2 e β B p B 2 t τ 2
We introduce the spillover effect coefficient of brand value and the influence coefficient of quality level α j and kji. Here, pji stands for the innovation coefficient, which is also defined as the advertising influence coefficient in some studies, and qji stands for the imitation coefficient, which can also be called the WOM influence coefficient. According to [6], this paper assumes that the advertising coefficient is equal between the two generations of products, and the WOM influence coefficient for the second generation of products is greater than that of the first generation. This is embedded in the advertising coefficient and the WOM impact coefficient, respectively. α j is the brand value spillover effect coefficient, used to represent the brand’s competitive strength, j = A, B, where α A α B , and we embedded the brand spillover effect coefficient α i into the innovation coefficient. βj represents the price sensitivity coefficient, j = A, B., which refers to the consumer’s sensitivity to the price as a marketing factor, and it affects the diffusion speed of the products, implying the impact of price on consumer demand to some extent. References [36,44] show that quality affects products sales through WOM, and enterprises with a higher quality have a positive impact on the spread of word of mouth. kji stands for quality level, j = A, B, i = 1, 2, and because the quality level of the product is constantly upgraded, under the same brand, the quality level of the second generation of products must not be less than the quality level of the first generation of products. In [34,45], price is added to the brand diffusion model as a marketing variable, expressed as e β j p t , and βj represents the price sensitivity coefficient. pji(t) represents the dynamic price, which is composed of the initial price pji(0) and the decline factor function R. In the process of multi-generation product upgrading, enterprises make decisions regarding this initial price. In a competitive environment, enterprises of different brands generally release new products at the same or a similar time. As enterprises usually take about 50 weeks to release new products, our upgrade time in the model was initially set to τ 2 = 50 , which is equal to about one year. This is also in line with the phenomenon in the real world in which new products from competing companies such as Apple, Samsung, Huawei, and Xiaomi are released at the same time, and they launch new products about once every other year. In order to better reflect the characteristics of competition, this paper assumes that the launch time of products of different generations of the two brands is synchronized, and the two companies compete against a homogenized market group.

4. The System

Referring to the reasoning and calculation process of sales quantity in [5], this paper builds a systematic dynamic model of multi-generation diffusion of dual brands with the goal of maximizing the revenues of the two generations of products. The model is established as follows:
M a x π A = 0 T d S A 1 t d t p A 1 t e r t + d S A 2 t d t p A 2 t e r t τ 2 d t
M a x π B = 0 T d S B 1 t d t p B 1 t e r t + d S B 2 t d t p B 2 t e r t τ 2 d t
where π j represents the two generations’ total revenues of each brand, j = A, B. r is the discount factor, and we assume r = 0.02, which about equals to the interest rate of some banks.
d S A 1 t d t = α A p A 1 + k A 1 q A 1 N A 1 t M 1 M 1 N A 1 t N B 1 t 1 N A 2 t τ 2 M 2 e β A p A 1 t
d S B 1 t d t = α B p B 1 + k B 1 q B 1 N B 1 t M 1 M 1 N B 1 t N A 1 t 1 N B 2 t τ 2 M 2 e β B p B 1 t  
Equations (14) and (15) represent the sales volume of each brand’s first-generation products at time t. By combining leapfrogging buyers or adoptions and switching buyers or adoptions into the first-generation product diffusion process, we obtain the second-generation product dynamic sales process, as in Equations (16) and (17):
d S A 2 t d t = M 2 + N A 1 t α A p A 2 + k A 2 q A 2 N A 2 t τ 2 M 2 1 N A 2 t τ 2 M 2 N B 2 t τ 2 M 2 e β A p A 2 t τ 2 + α A p A 1 + k A 1 q A 1 N A 1 t M 1 M 1 N A 1 t N B 1 t N A 2 t τ 2 M 2 e β A p A 1 t
d S B 2 t d t = M 2 + N B 1 t α B p B 2 + k B 2 q B 2 N B 2 t τ 2 M 2 1 N B 2 t τ 2 M 2 N A 2 t τ 2 M 2 e β B p B 2 t τ 2 + α B p B 1 + k B 1 q B 1 N A 1 t M 1 M 1 N B 1 t N A 1 t N B 2 t τ 2 M 2 e β B p B 1 t
In this system, as shown in Table 1, where Mi represents the potential market size, i = 1, 2, which represents the different generations of products. In general, the potential market size of second-generation products is larger than the potential size of the first-generation market. The unit of time t is weeks. Nji(t) represents the cumulative diffusion quantity of brand j generation i products at time t, Sji(t) represents the sales quantity of i generation products of brand j at time t, j = A, B; i = 1, 2, and Sji(t) is the number of units in use under the coexistence of multiple generations at time t—that is, the rates of sales under the influence of multiple generations of products. R represents the rate of price change. This paper uses experience curve pricing to describe the brand’s pricing strategy and assumes that the price is monotonically decreasing, but the price cannot fall all the time. Based on the observation that the price of Apple mobile phone products at the end of product sales is about 75–80% of the initial price, down to about a quarter of the initial price [27], then this paper sets the final decline price at 80% of the initial price until the products are completely withdrawn from the market, and we set 0 R 0.8 . Referring to the research in [46,47,48], the price marketing variable is introduced into the Norton–Bass diffusion process. In view of the fact that price decline is a strategy often adopted in commercial activities, this paper adopts the method of price showing a dynamic path of monotone decline over time presented in [12,47]. Supposing that p j i t = p j i 0 e R t ,   p j i 0 represents the initial price of the products to market, and R represents the price decline factor.

5. System Dynamics Simulation and Experimentation

Since the parameters and variables involved in the model constructed in this paper are complex, the system dynamics (SD) method is very suitable for complex system modeling and simulation without focusing too much on mathematical forms. This paper mainly discusses the dynamic decision problem, in which the system involves many variables and parameters, and it is difficult to obtain the analytical closed solution. Therefore, we adopt the system dynamics method to simulate the model, compare and discuss the problem of multi-generation product diffusion under a dual-brand and multi-generation scenario, and perform decision analysis based on quality level, pricing, and launch time to market.
The flow chart of the SD model established based on AnyLogic software of version 8.8 is shown in Figure 1, where Ai represents the i generation products of brand A, and Bi represents the i generation products of brand B, i = 1, 2.
According to the values assigned to Bass model parameters using data in [6,47], the other specific basic parameter settings of the model in this paper are shown in Table 2.
As shown in Table 2, we assume that the total market size of the second-generation products is about four times that of the first-generation products’ market, the initial pricing is set to 1, while the brand value, quality level coefficient, and innovation coefficient are also set to 1, indicating the same competitiveness of the two enterprises. The price decline rate of the two brands is the same, the price sensitivity coefficient is the same, and the imitation coefficient of the same-generation products is the same. This shows that the two companies are in the same market and target the same consumer group. By changing the parameter assignment, the decision problems of the pricing level, quality level, brand value spillover effect, and launch time to market are analyzed. Due to the constraints of production costs and other operating expenses, the price will not drop indefinitely. This paper assumes that once the dynamic price drops to a certain extent, it will not change again before the products are withdrawn from the market.

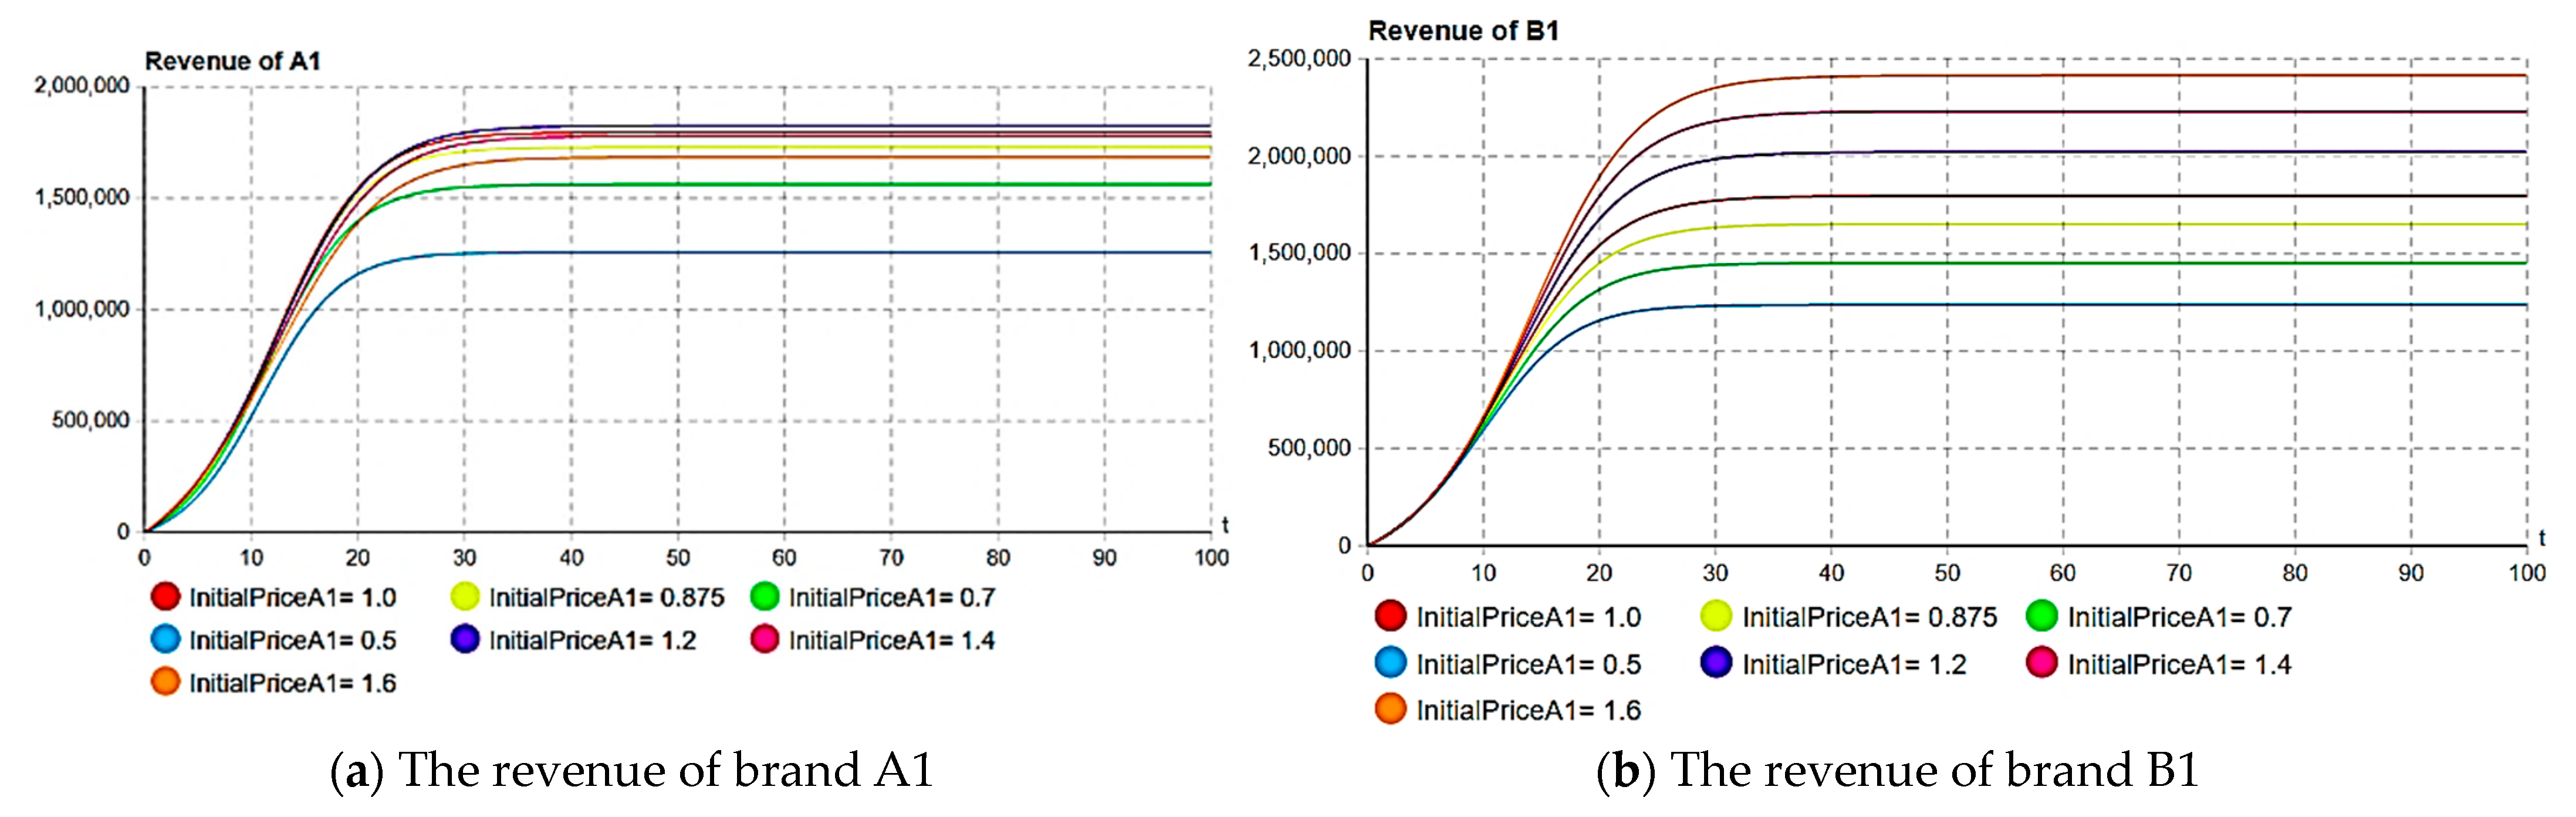
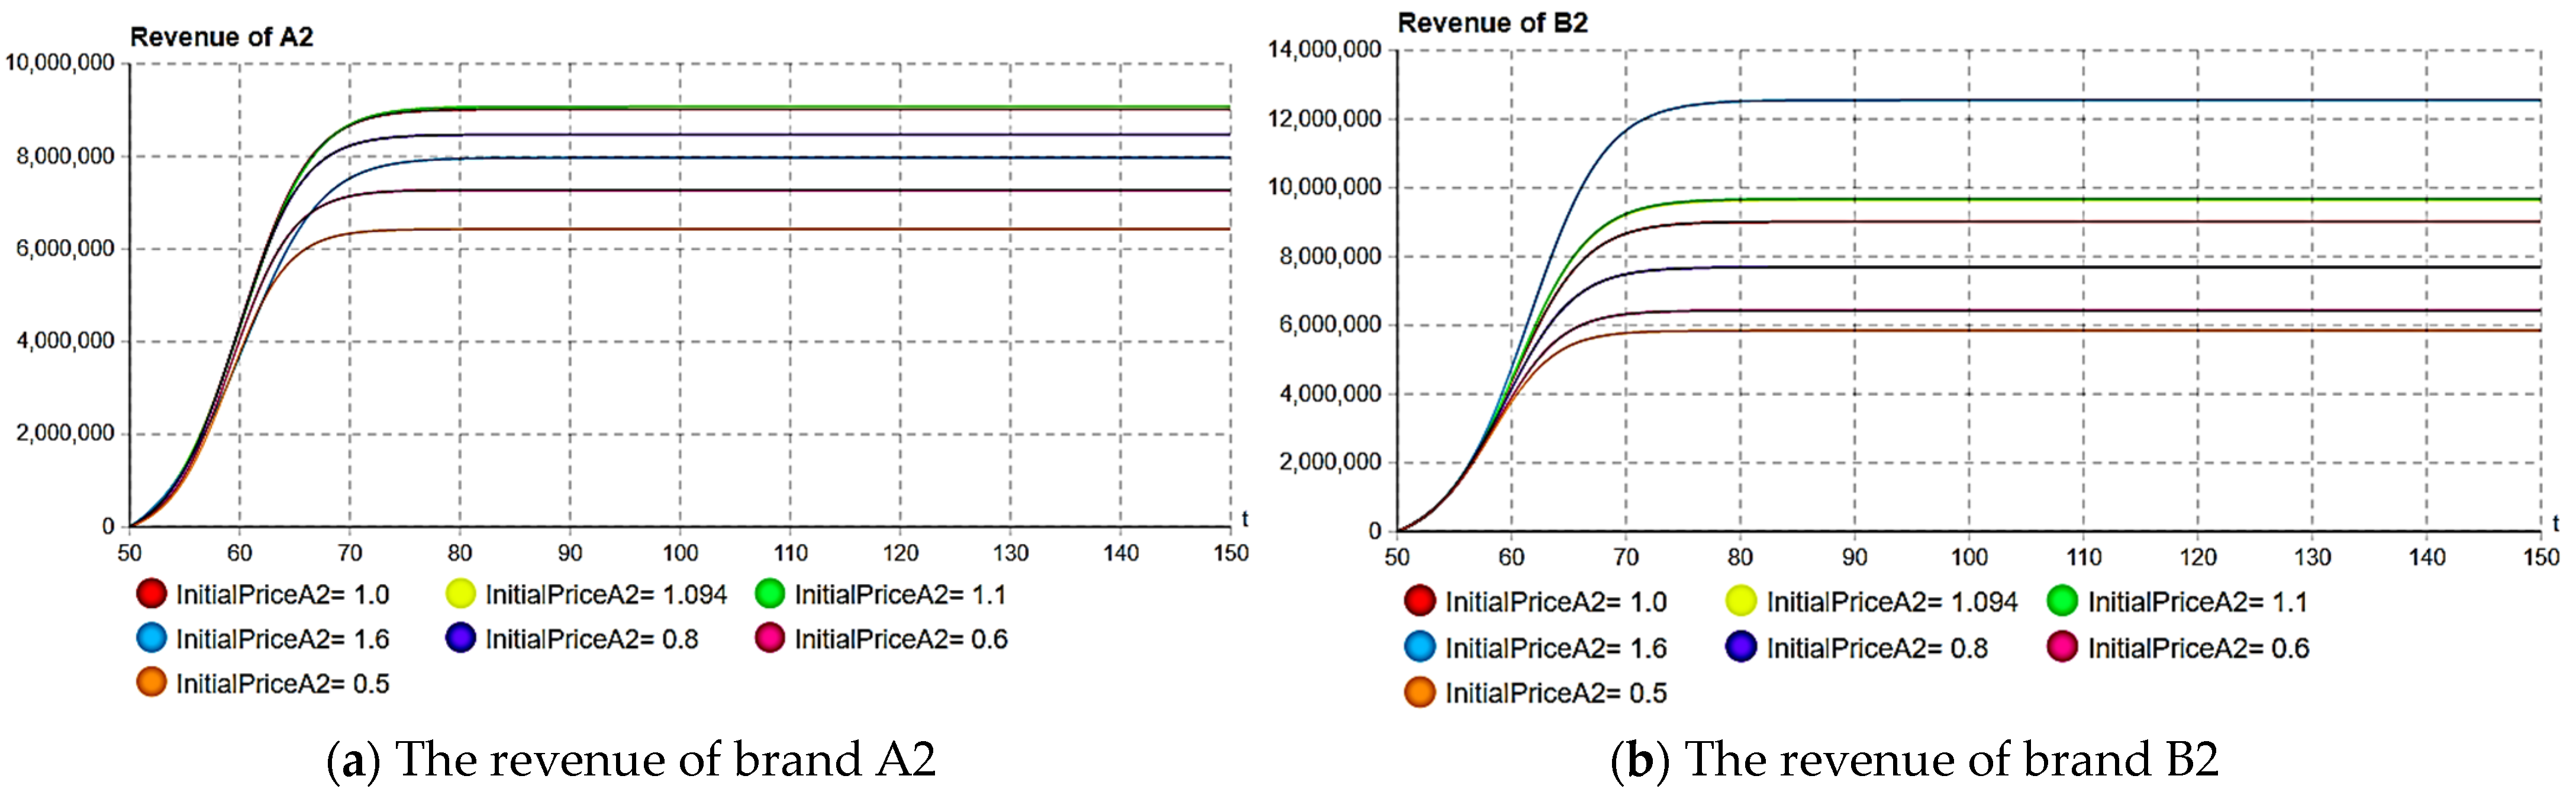
5.1. Optimal Pricing Decision

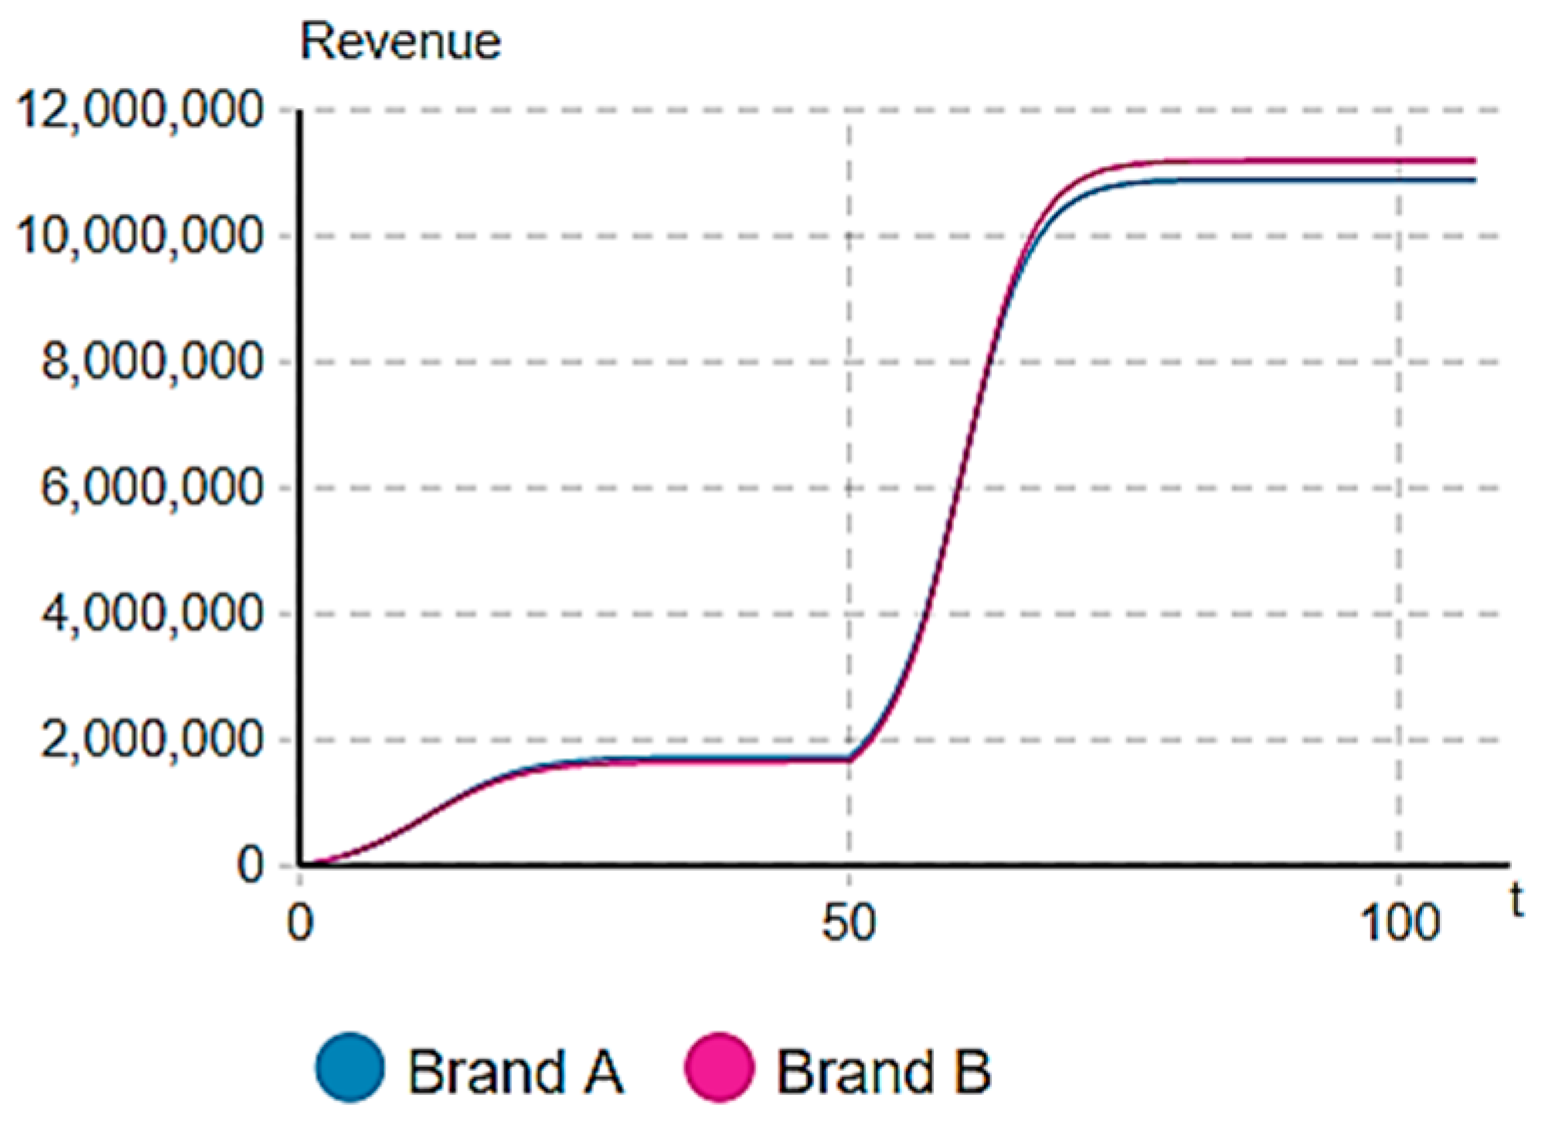
5.1.1. In the Case of Equal Brand Competitive Strength

Taking brand A as an example, we fix brand B under the setting of basic parameters. Through simulation and calculation, the optimal pricing level and total revenue of brand A are as follows:
p A 1 0 = 0.875 , p A 2 τ 2 = 1.094 π A = 10 , 894 , 474.196
Before the optimization of the brand A pricing, its total revenue was 10,814,887.927. After the revenue is optimized, the total revenue of brand A achieves a small increase of about 0.74%.
Although the pricing strategy of brand A improves its own revenue, it also promotes the increase in the total revenue of its competitor brand B. The total revenue of B increases to 11,196,931.813, and the total revenue increases by 3.53%. The simulation results are shown in Figure 2:
Even if brand A can improve its own revenue, it is unable to improve its competitiveness and can even weaken its competitiveness to some extent. Through the decomposition of the revenue of brand A and brand B, it is found that under the optimal pricing level, the revenue of brand A is greater than that of brand B in the diffusion period of the first-generation products. In the diffusion period of the second-generation products, the revenue of brand A is lower than that of brand B because brand A raises the pricing of new products. As a result, the total revenue of the two generations of brand A is lower than that of brand B. The revenue decomposition results are shown in Figure 3.
As seen in Figure 3a, under optimal pricing, the revenue of the first-generation products of brand A is greater than that of the first-generation products of brand B. Figure 3b shows that the revenue of the second-generation products of brand A is smaller than that of the second-generation products of brand B, and the revenue of the two generations of products is integrated, resulting in the total revenue of brand A after pricing adjustment being smaller than that of brand B. It can be seen that when the competitive strength of the brand is equal, the key to affecting the corporate revenue is pricing. In this case, the pricing reduction will cause the enterprise to gain more revenue than its competitor, and the pricing increase will cause the enterprise to gain less revenue than its competitor, and the enterprise can easily fall into the competition of a “price war”. The enterprise mainly implements the low-pricing strategy to obtain relatively more revenue than its competitor, but the total revenue is faced with the risk of decline, which causes losses for both competing brands.
The following is a comparative experiment that shows the impact of the pricing level of two generations of brand A on the different revenues. It is assumed that due to the cost constraints, the initial pricing level should not be too low, reaching at least 50% of the competitor’s pricing. The simulation and calculation results are shown in Figure 4 and Figure 5.
From the simulation results below, it can be concluded that compared with the benchmark initial price of value 1, the optimal initial pricing reduces the revenue of both brands. Compared with brand A, the revenue of rival brand B decreases by a larger margin. The experiment continues to reduce the pricing of the two generations of products. Through comparison, it is found that the revenues of the two generations of A and B products continue to decline, and the revenue of brand B is still greater than that of brand A. However, the high pricing may cause the enterprise to gain revenue, but its competitor gains more revenue. For example, in Figure 4a and Figure 5a, when pA1 and pA2 are equal to 1.2 and 1.1, respectively, brand A’s revenue of the two generations of products improves, while the revenue of brand B increases by a larger margin, and the increase in price may lead to a significant decline in revenue. For example, when pA1 and pA2 are equal to 1.6, the revenue of the two generations of brand A declines, but the revenue of brand B increases significantly. Through the above simulation experiments, the following summaries can be drawn:
Summary 1: When the strength of each enterprise is equal, lowering the pricing will not necessarily cause the enterprises to gain revenue but will cause the competitor to lose more revenue, which can have the effect of “hurting the enemies one thousand and self-loss eight hundred”, resulting in the decline in the overall revenue of the industry.
Summary 2: When the strength of each firm is equal, raising the price may increase or decrease its own revenue, but the competitor will always benefit and obtain more revenue.
Therefore, in the case of equal competitive strength, the pricing decision of the enterprise is affected by the pricing decision of the competitor, and it should make a reasonable decision to raise or lower the pricing according to the pricing level of the competitor and its own decision-making purposes.

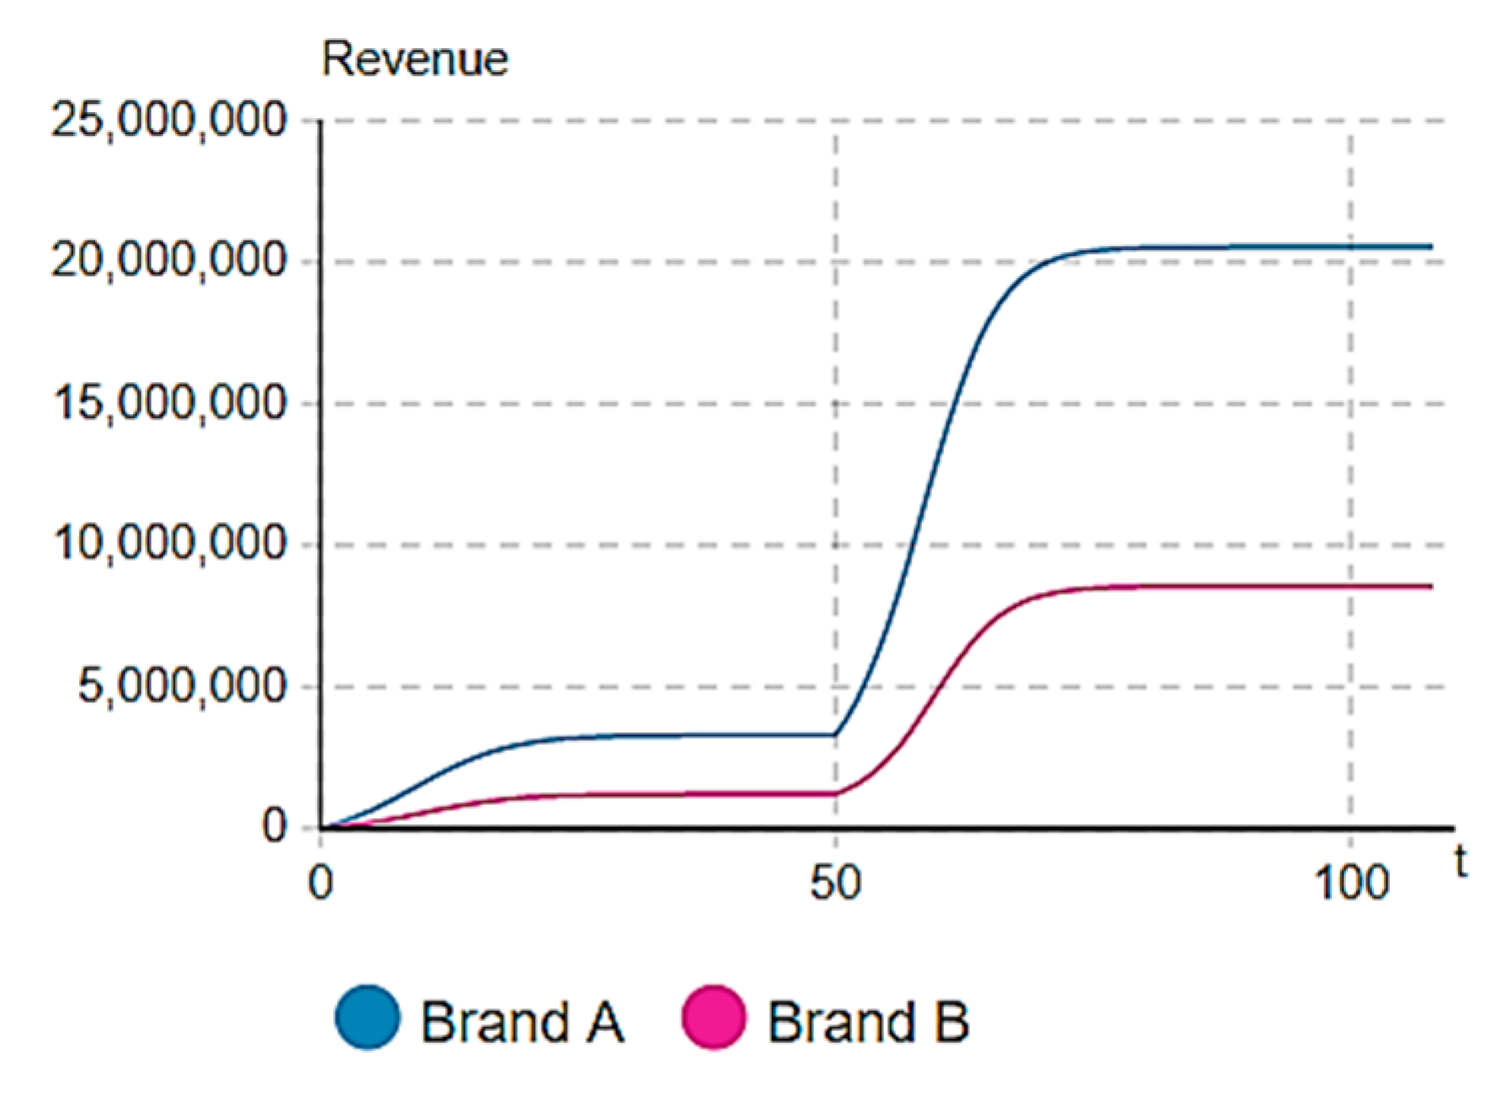
5.1.2. In the Case of Unequal Brand Competitive Strength

When the spillover effects of brand value are unequal, assume that A is a strong brand, and the brand spillover value effect is 3, and B is a weak brand, and the brand spillover value effect is 1—that is, the influence of brand A is three times that of brand B. In the experiment, the parameters of brand B are fixed. Through simulation calculation, the optimal pricing and revenue results are as follows:
p A 1 0 = 1.291 , p A 2 τ 2 = 1.556 π A = 20 , 536 , 744.303
It can be seen that in the case of an unequal brand spillover value, through optimizing the pricing level of brand A and comparing it with the benchmark model, it is found that the pricing and total revenue of the two generations of products are significantly improved, and the revenue increases by 89.9%, while the revenue of brand B is 8,555,889.585, and the revenue decreases by about 20.9% compared with the benchmark model, as shown in Figure 6. Due to the greater spillover effect of brand value, the total revenue of brand A is much greater than that of brand B.
Before the pricing optimization, the revenue of brand A was 17,934,512.734 and that of brand B was 5,471,369.187. Compared with the benchmark model, the revenue of brand A increases by 65.8%, and the revenue of brand B decreases by about 49.4%. After pricing optimization, the revenue of brand A increased by about 14.5% compared to the original, while the revenue of brand B increased by about 56.4% compared to the original. It can be seen that only the pricing of brand A is optimized, and the pricing after optimization is higher than the benchmark pricing, which not only improves its own revenue but also improves the revenue of the competitor brand B, and the competitor experiences a larger increase.
Summary 3: Under the brand spillover effect, raising the price can increase the total revenue of enterprises on the original basis, and the revenue of competitors will also increase, and the growth range may be larger.
The following is a comparative experiment on the impact of different pricing levels on the revenue of different brands at different periods under the brand spillover effect, and the results are shown in Figure 7 and Figure 8 as follows:
From the simulation above in Figure 7 and Figure 8, it can also be seen that when brand A lowers the initial pricing, its own revenue will decline and that of competitor B will also decline, resulting in a decline in the overall industry revenue, but the loss caused by pricing reduction for brand A will be more than that for competitor B. For example, when the initial pricing of brand A’s first-generation and second-generation products is 0.7 and 0.5, respectively, the revenue for the first-generation products of brand A decreases by 22.4% and 41.3%, respectively, and that of the second-generation products decreases by 22.1% and 41.2%, respectively. The revenue for the first-generation products of brand B decreases by 21.8% and 33.8%, and the revenue for the second-generation products decreases by 24.7% and 37.8%, respectively. The low level of the pricing of brand A reduces the overall revenue of the two brands. Raising the pricing level of brand A can increase or decrease the revenue, but it will always bring more revenue to competitors. For example, when the initial pricing of brand A’s two generations is 2.0, the revenue of each generation will increase, and the revenue of brand B will also increase significantly. When the initial price of brand A2’s two generations is 2.5, the revenue of brand A will decrease. However, the revenue of brand B increases significantly, and summary 2 is verified with these results.
Summary 4: In the case of unequal brand value spillover, the revenue loss caused by the pricing reduction in strong brands is more than that for weak brands. Lowering the pricing level reduces the overall revenue of the industry.
Summary 5: In the case of unequal brand value spillover, a strong brand has a larger space to raise its pricing, and raising its pricing may increase or decrease the total revenue, but it is always beneficial to competitors.
From the above summaries, in the face of a complex competitive environment, enterprises should avoid adopting too low of a competitive pricing strategy, so as to not fall into the “price war” situation, resulting in overall losses for the industry. This result is similar to the results in [26], showing that when new products are introduced continuously, competing companies cannot obtain more revenue by tightening up market prices. Among these companies, strong brand enterprises should try to avoid setting low prices to reduce the loss caused by brand spillover value but also to avoid raising pricing significantly, resulting in greater revenue for their competitors. In the face of this complex competitive environment, they should carefully adjust pricing. Weak brand enterprises should avoid setting a high level of initial prices, so as not to push up the revenue of the strong brand, thus expanding the disadvantages of the weak brand.

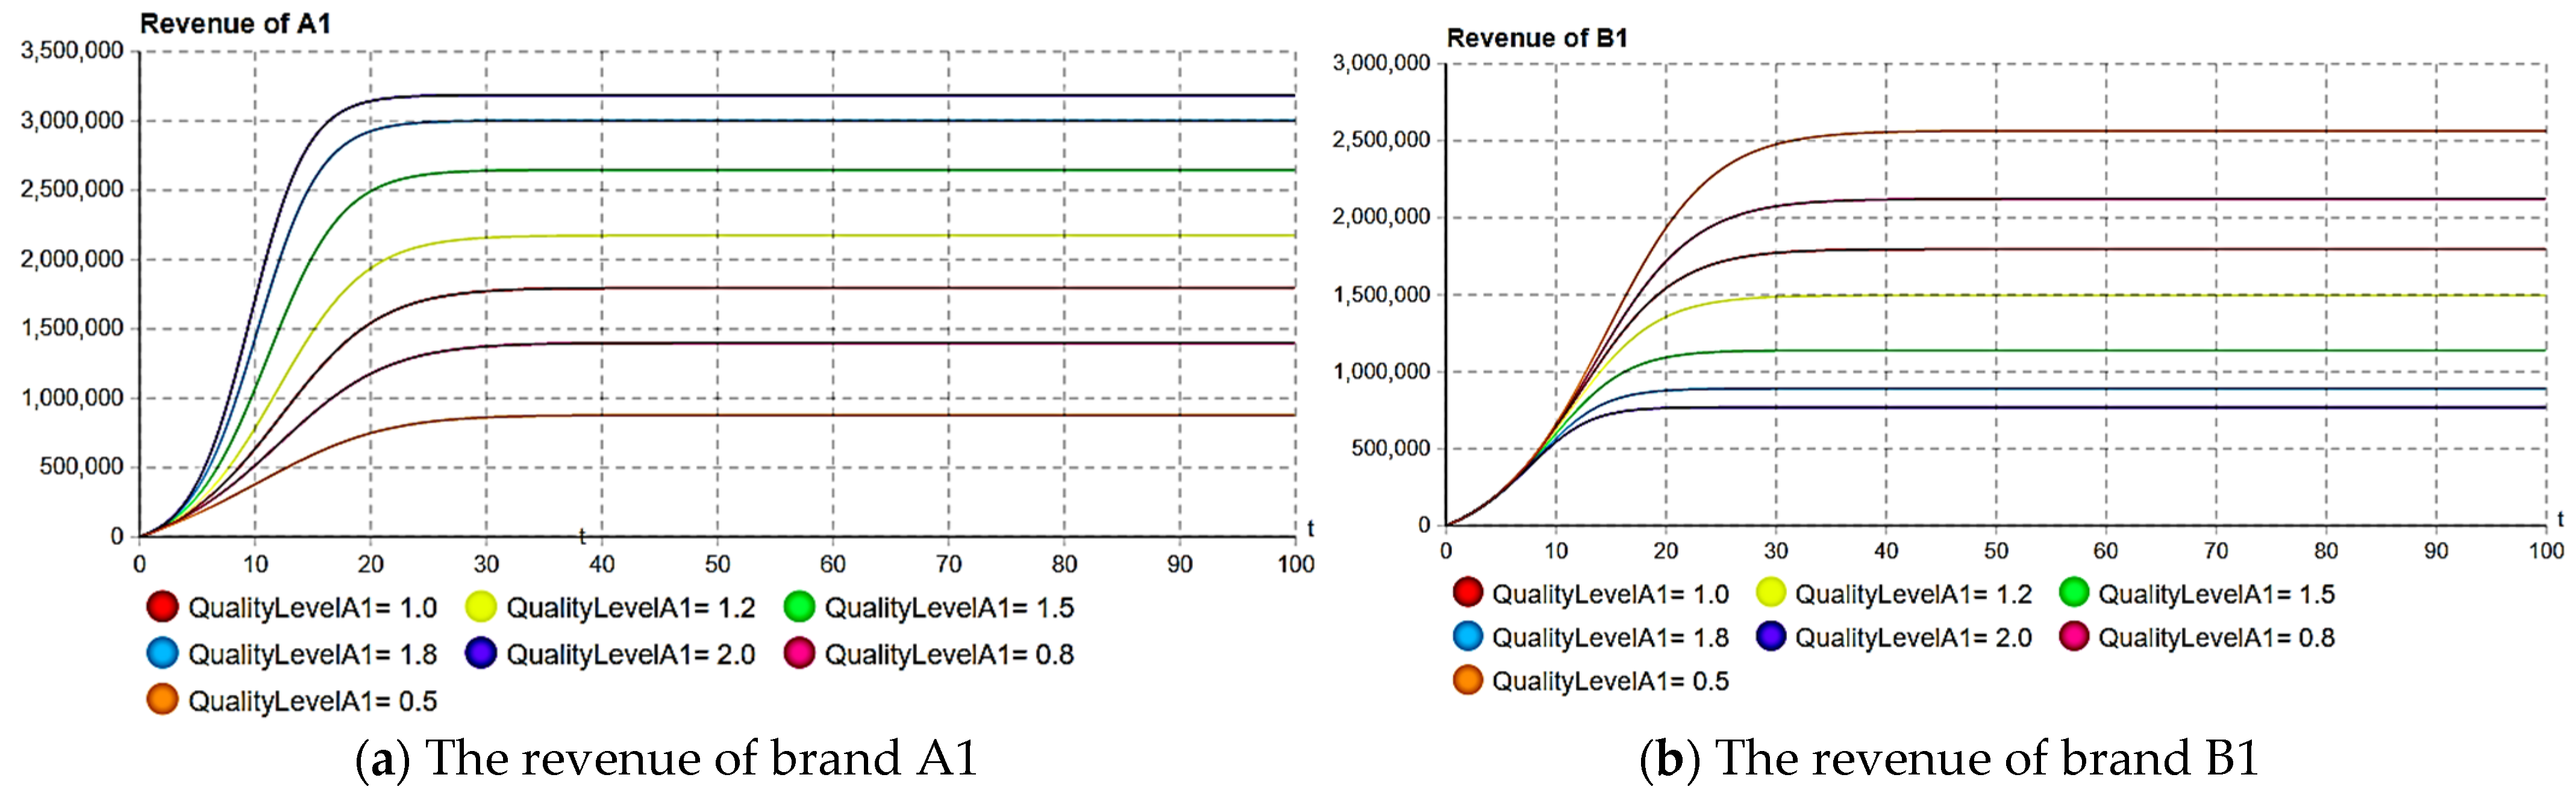
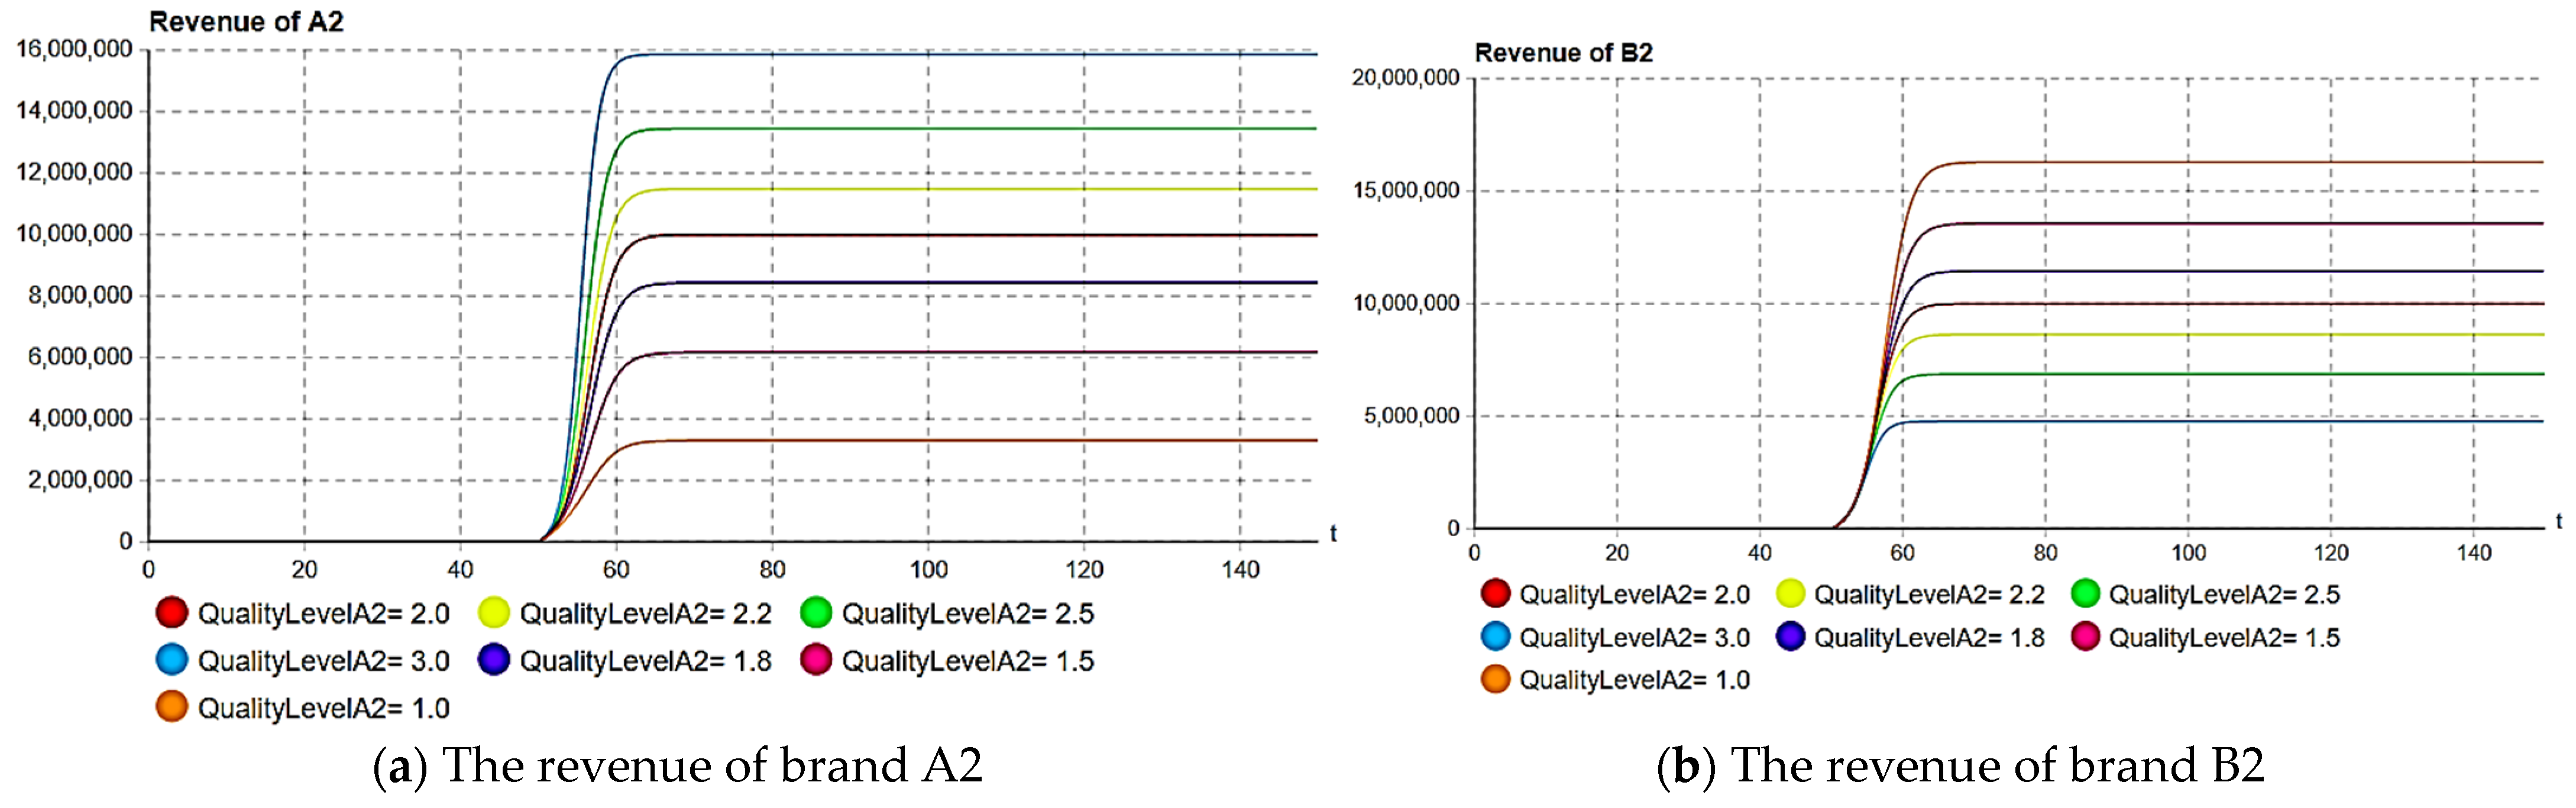
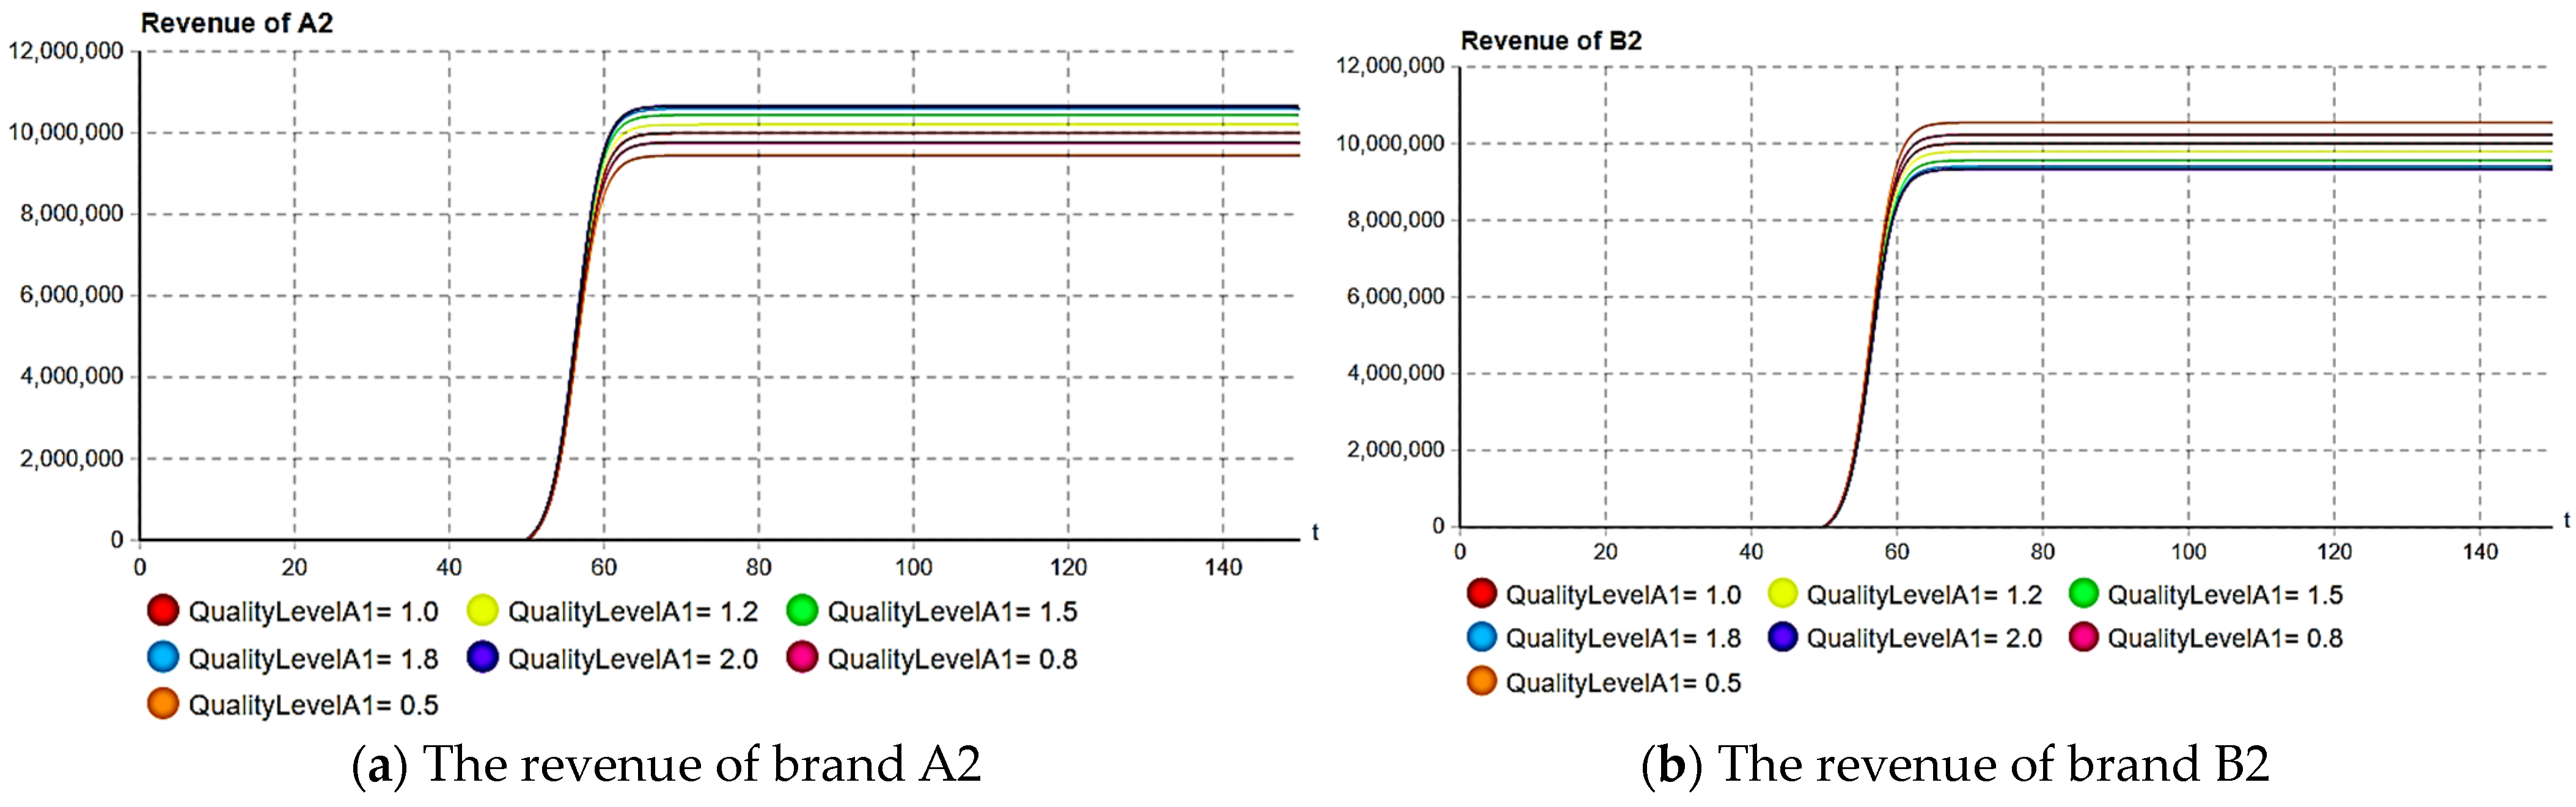
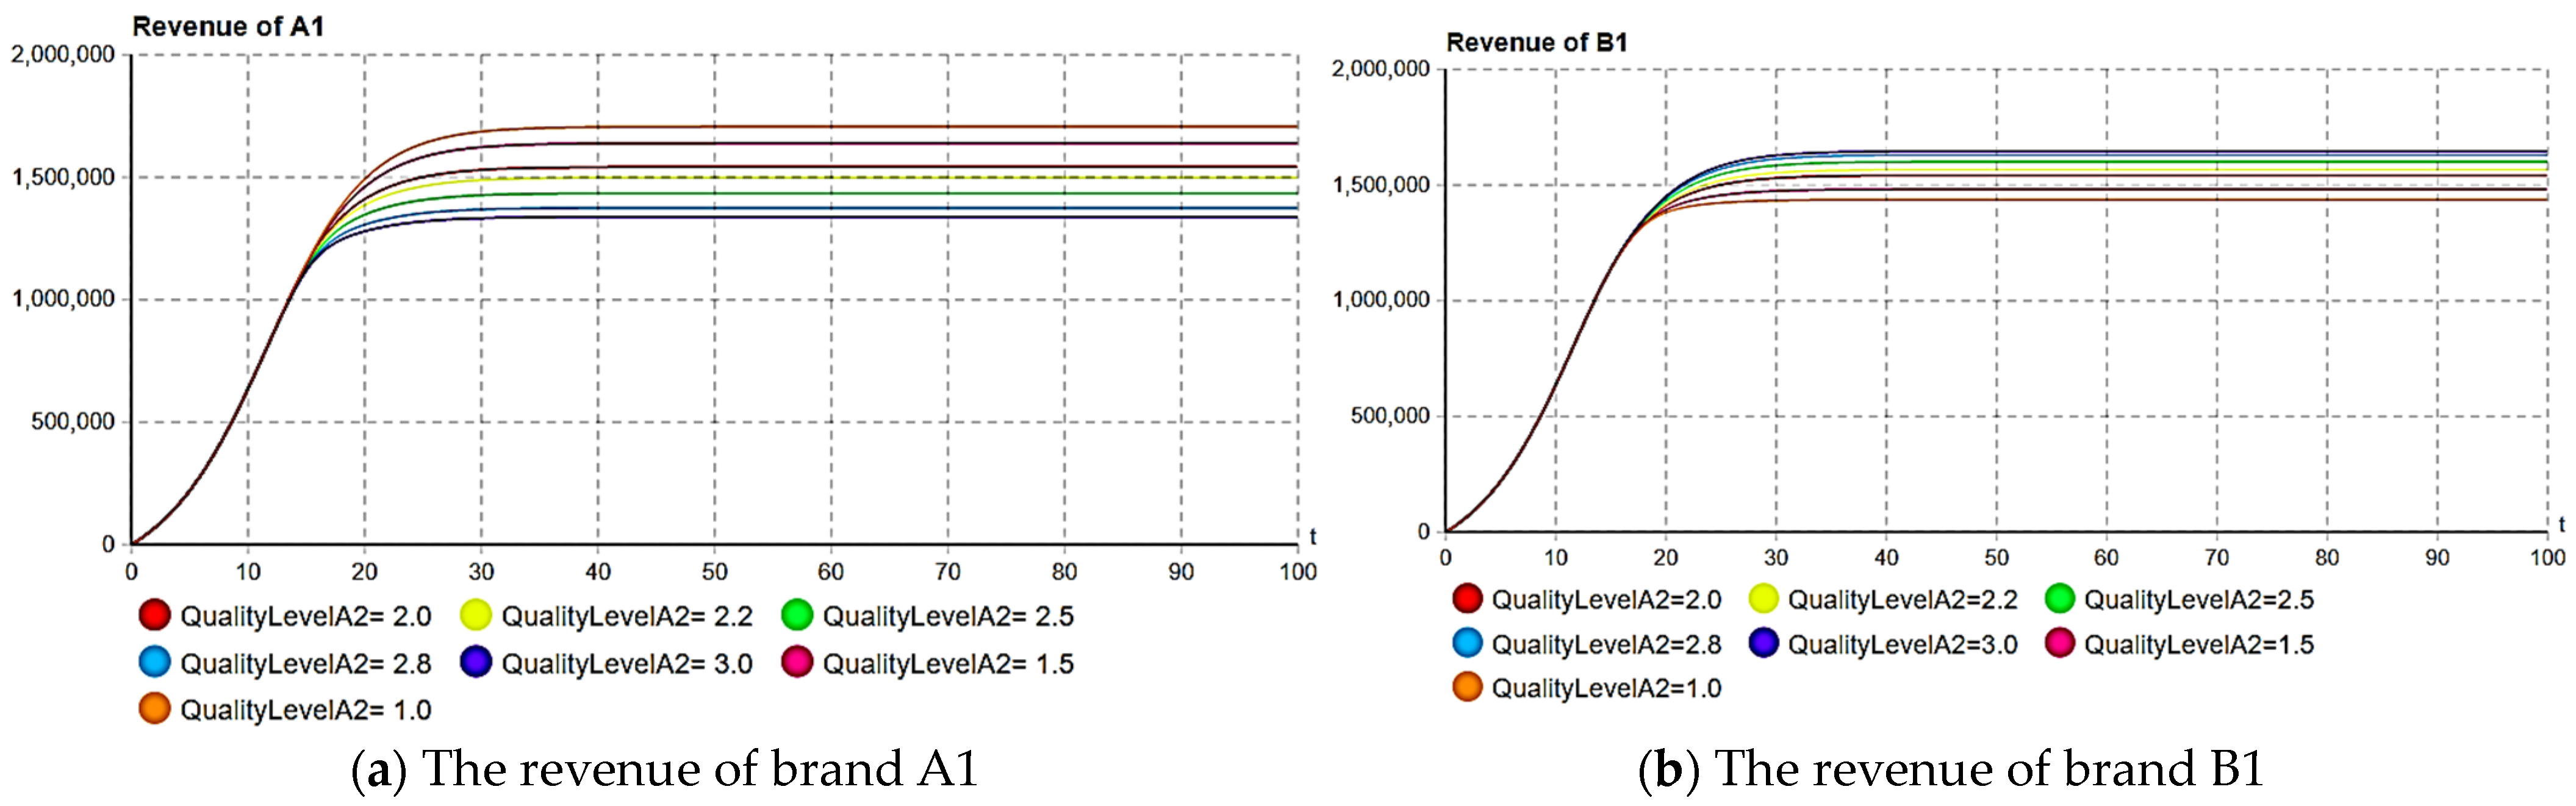
5.2. Influence of Quality Level

Because this paper studies the pricing of multi-generation products under a competitive environment, the quality level of each generation of products is divided into various situations, and the relationship between generations is also diverse. Therefore, this section adopts the scenario analysis method to calculate and analyze the optimal pricing level under different quality or technology levels.
We assume that the quality of the second-generation products of each brand will not be lower than the quality level of the first-generation products—that is, in the case of product quality improvement and upgrading. In the case of an equal brand spillover effect, it is assumed that the quality level of each generation is equal—that is, kA1 = kB1 = 1 and kA2 = kB2 = 2.
Through simulation of the model, the optimal pricing and revenue are obtained as follows:
p A 1 0 = 0.849 ,   p A 2 τ 2 = 0.994 π A = 11 , 827 , 922.349
Next, the pricing of brand B is fixed, so that the pricing of brand A is below the optimal price. Through the comparison of two groups of experiments, the quality level of each generation of brand A is adjusted, and it is found that the quality level has a significant impact on the revenue of each generation of products. By improving the quality level of each generation, the products’ revenue of each generation can be increased, and the revenue of competitors’ products can be reduced while the products’ revenue is increased, as shown in Figure 9 and Figure 10:
The influence of the adjustment of the quality or technical level of each generation on the adjacent generations of products changes in the opposite direction to the launch time of listing. As shown in Figure 11, when the launch time is at t = 50, the previous generation of products will have an impact on the revenue of the new products, while the influence of the quality or technology level of the new products on the revenue of the previous products can almost be ignored. This is because the launch time of new products is at the end of the decline in the previous generation of products, meaning that the proportion of skipping users is very small, reducing the encroachment on the market share of old products, and as the launch time is brought forward, it is found that the impact of new products on the revenue of the previous generation of products gradually appears because bringing the launch time forward increases the encroachment of new products on the market share of the previous generation of products and thus reduces the revenue of previous-generation products.
As shown in Figure 12, when the launch time to market is adjusted to t = 10, by adjusting the quality level A1, we find that when the launch time to market is greatly brought forward, the higher the quality level of the new products, the more the revenue level of the previous generation products will decline, while the revenue of the previous generation of products of competitors will increase. This is because the improvement in the quality level of new products will slow the diffusion rate of competitors’ new products, which will lead to the “cannibalization” of the competitors’ previous generation of products. However, the pricing level at this time cannot maximize the revenue of brand A. The revenue of brand A is 11,555,236.786. When kA2 = 2.2, the total revenue increases to 13,009,325.82. By adjusting the quality technical level, the revenue can be greatly increased; the optimal pricing at this time is calculated as pA1 = 0.71 and pA2 = 1.072, and the revenue is 13,107,736.724. After the pricing level’s adjustment, the revenue of competitor B is also increased from 9,881,453.212 to 10,378,745.104. At this time, after quality level adjustment, the enterprise can reduce the revenue of its competitors while increasing its own revenue, and maintaining the original price cannot maximize its own revenue, but it also cannot increase the revenue of competitors. For example, if kA2 is adjusted to 2.2 and then the pricing is adjusted to the optimal level, brand A will increase its revenue by 0.76% on the basis of the original adjustment of quality and technology level, and the competitor’s revenue will increase by 5%.
Summary 6: In the process of launching new products, enterprises will perform a trade-off with the listing time according to the upgrading of quality level or control the upgrade degree of the quality level in order to maintain a certain time listing frequency.
Generally speaking, the earlier that products enter the market, the more of the market the enterprise will occupy. However, summary 6 in this paper shows that although products entering the market earlier can occupy a greater market share, entering the market earlier does not necessarily increase the revenue of these products, or even mean that they occupy a greater market share than the previous generation of products due to the high quality of these products, resulting in losses in total revenue.
Summary 7: Improving the quality level can effectively increase the revenue of each generation of products. Even if the pricing strategy is constant or stable, the improvement of quality level can improve products’ revenue.
Based on the different relationships between brands, when the product quality level of brand A is no less than that of brand B of the same generation, six quality-level scenarios are designed to optimize the pricing of brand A, respectively. The simulation results are summarized in Table 3:
As can be seen from the results in Table 3, under different quality levels, the spillover effect of brand value can increase the overall revenue of the brand by significantly increasing the pricing of new and previous-generation products, and the revenue is relatively stable, reflecting the brand premium of the enterprise’s products.
Scenario 2 is more in line with the competitive status of enterprises in reality. Brand B is in a weak position in terms of its brand value spillover and quality level, and it continually tries to catch up with brand A. Through simulation, it is found that the optimal pricing of the two generations of brand A is basically at the same level, maintaining a certain pricing stability.
The above results are based on the simulation calculation of the system from the perspective of brand A. The following is the simulation experiment of the system from the perspective of brand B. The pricing level of brand B is also optimized under six scenarios, and the simulation results are obtained as shown in Table 4.
As can be seen from the results in Table 4, an enterprise with a weak brand will lose brand value no matter whether its quality level is upgraded or not, and it will not bring more benefits despite setting a low pricing level. For example, in scenarios (8) and (11), although brand B achieves optimal revenue after raising its pricing, its revenue still decreases when compared with the equivalent brand strength. Weak brand enterprises, whose quality level is always lagging behind, should maximize their own benefits by raising pricing, but even if they do this, the revenue will be further reduced, and they cannot make up for the loss caused by the spillover effect of brand value.

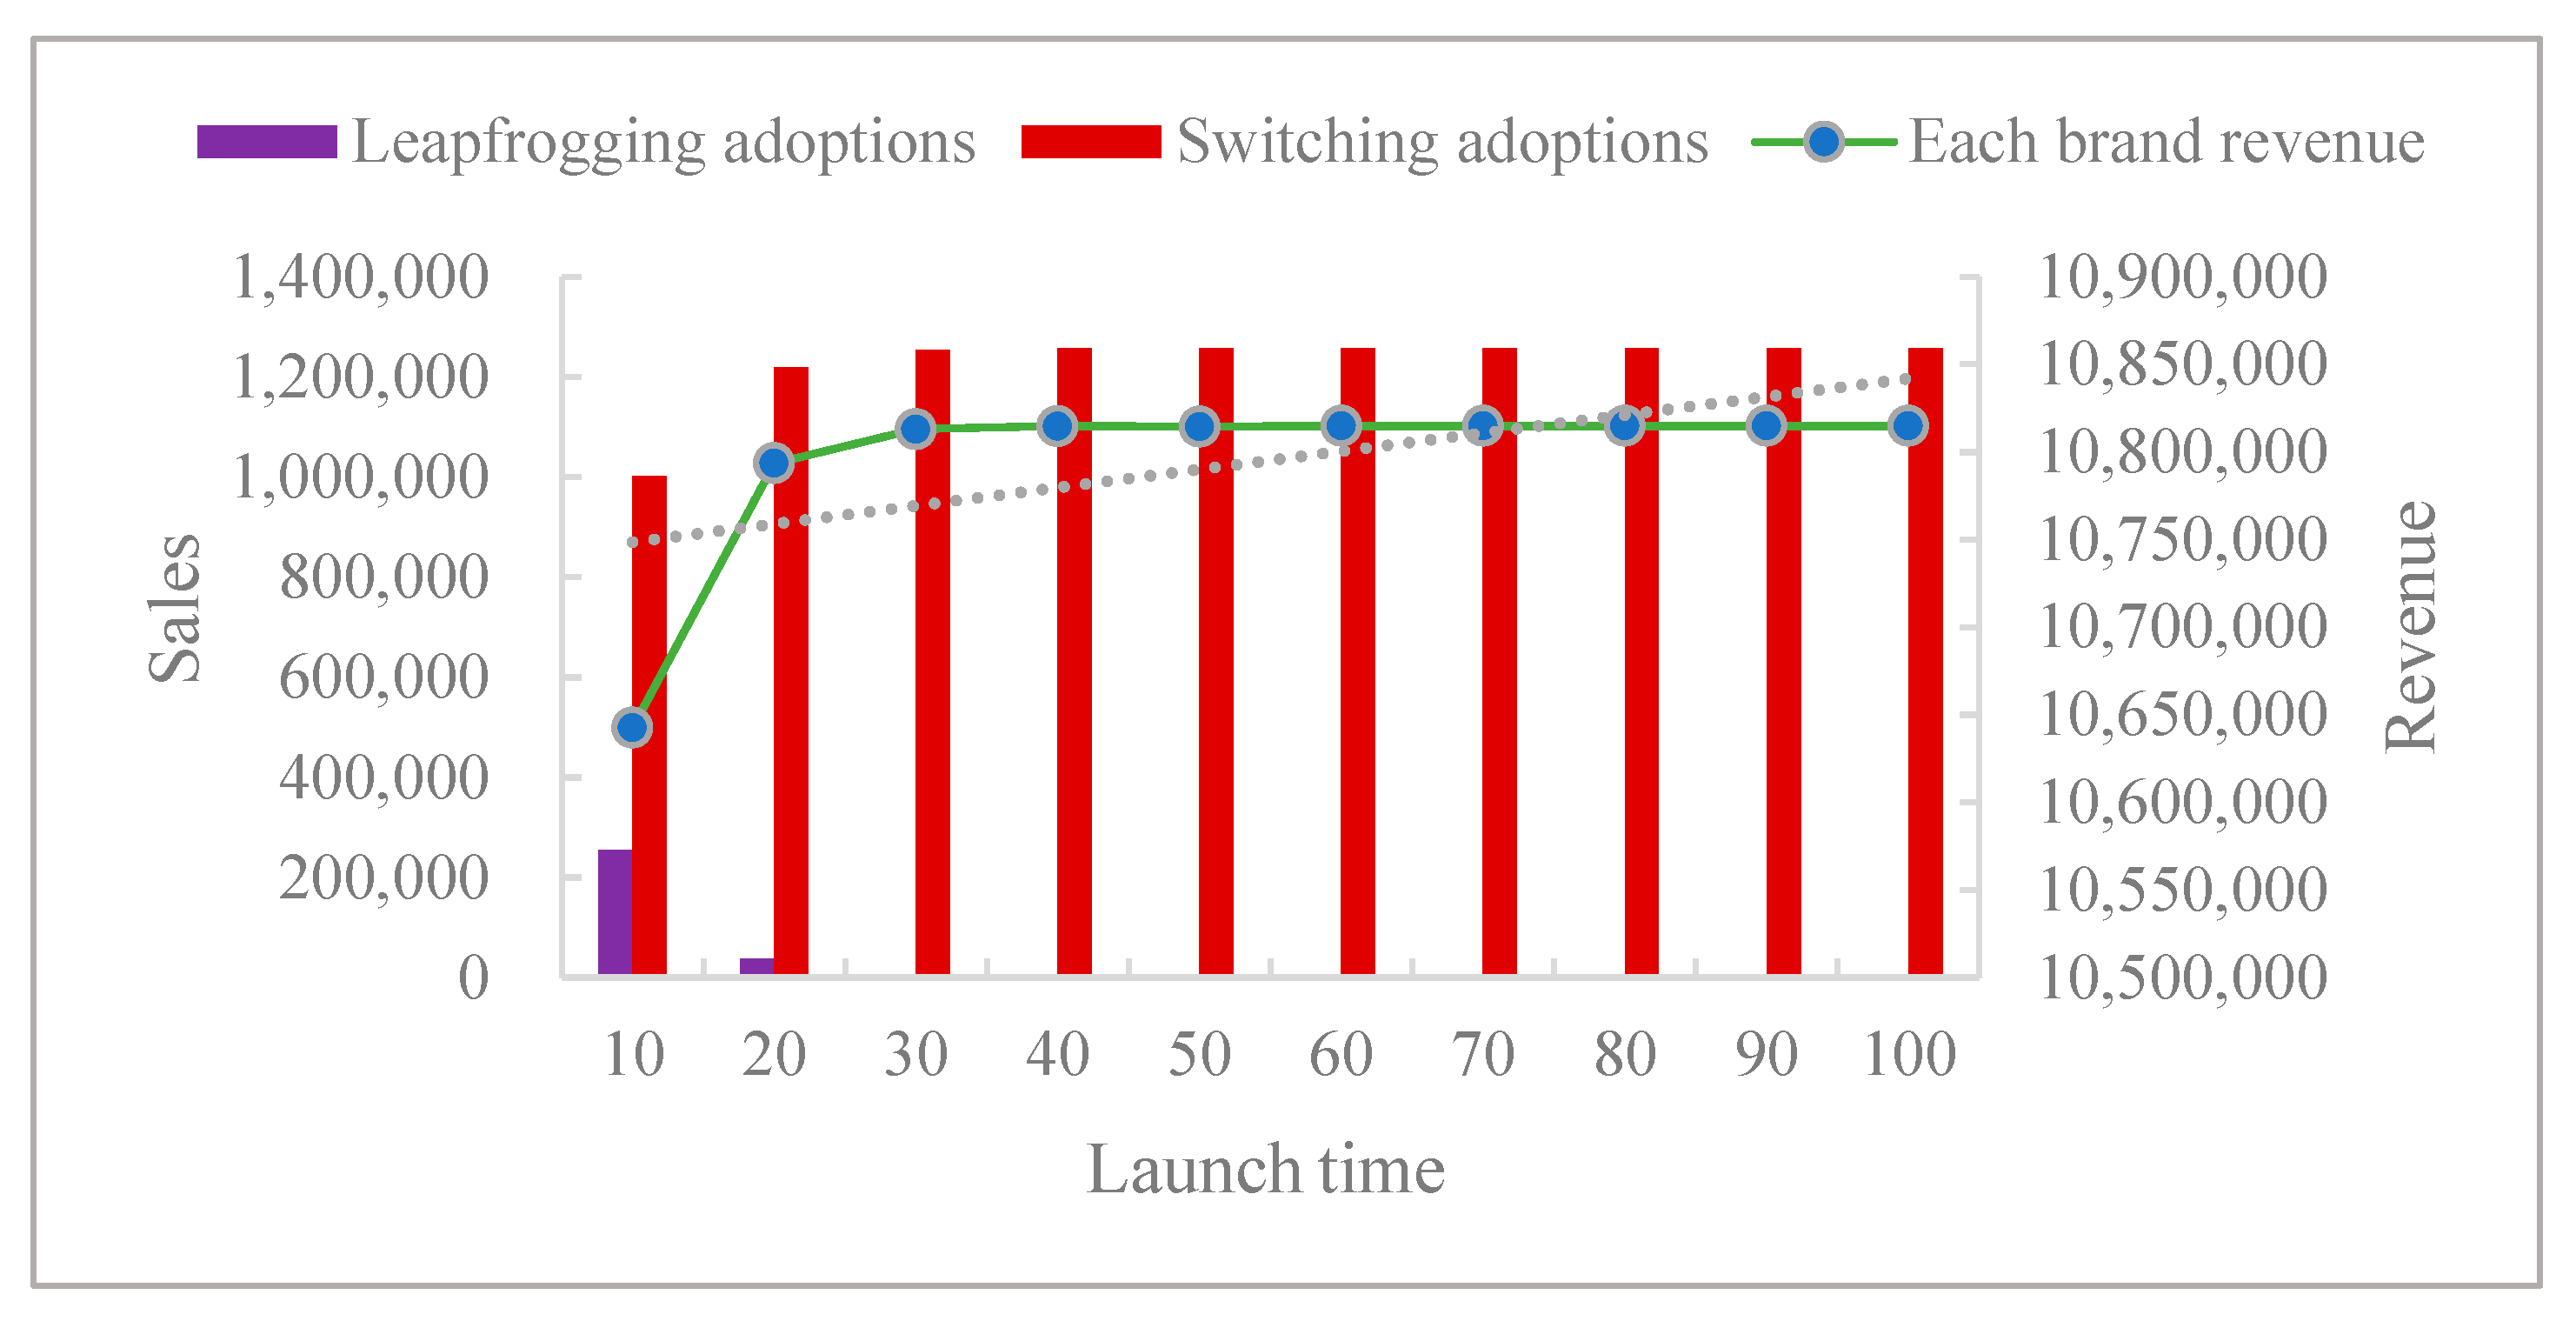
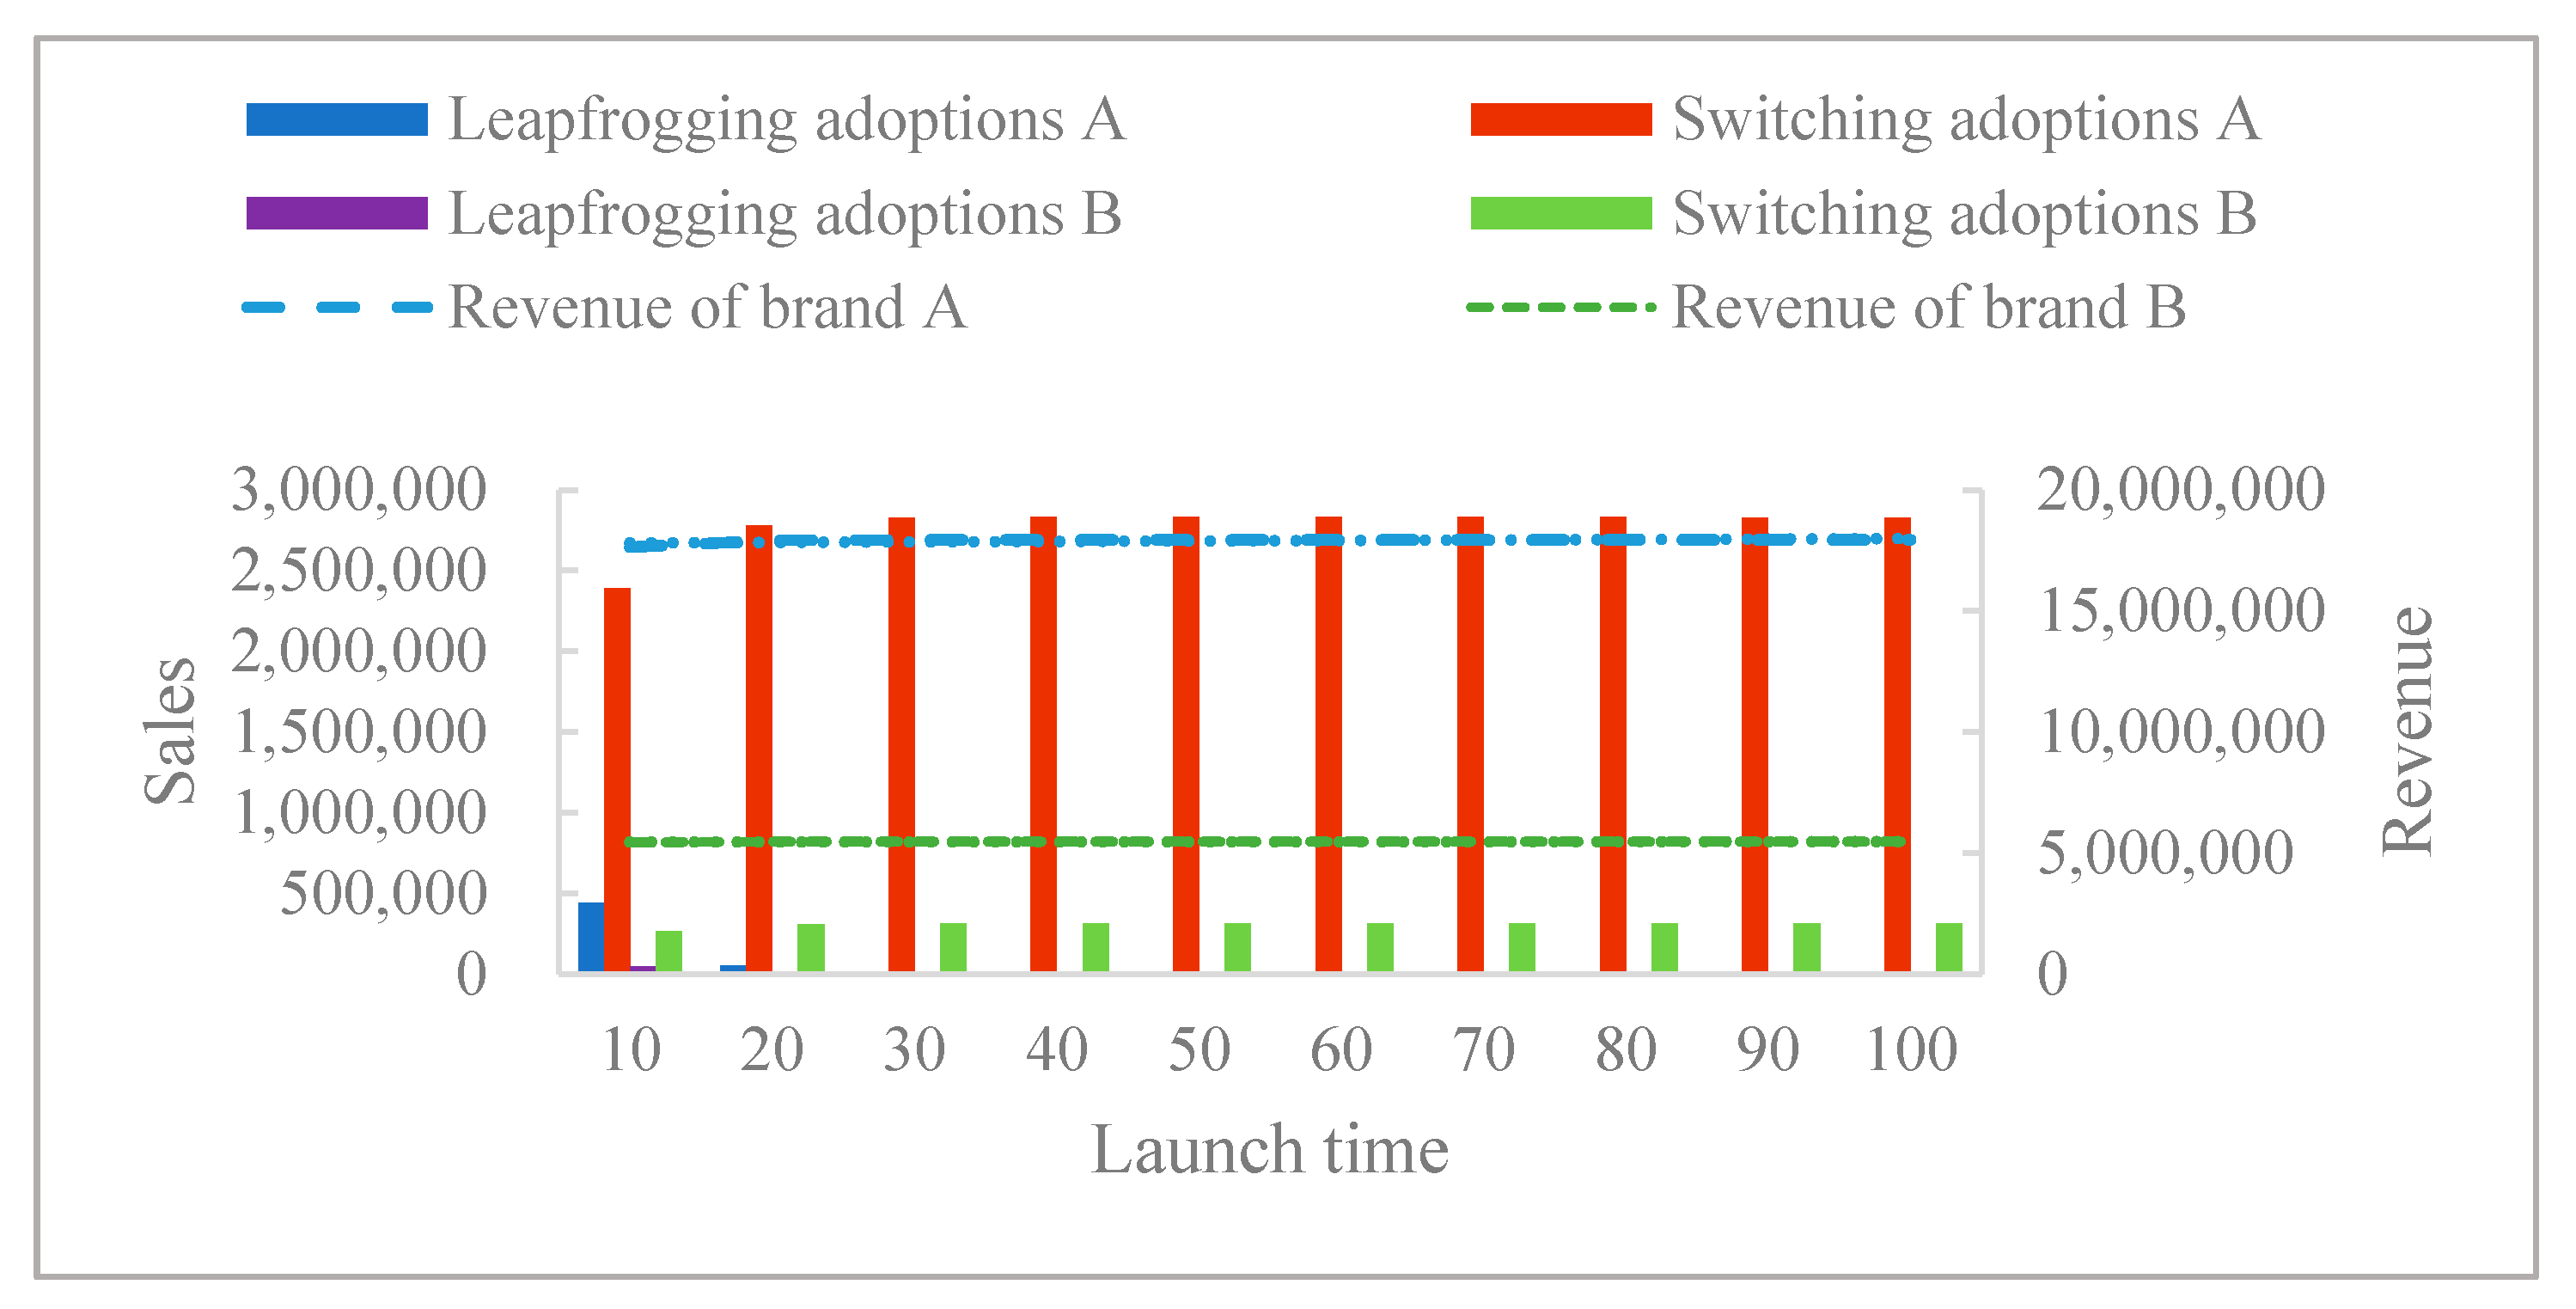
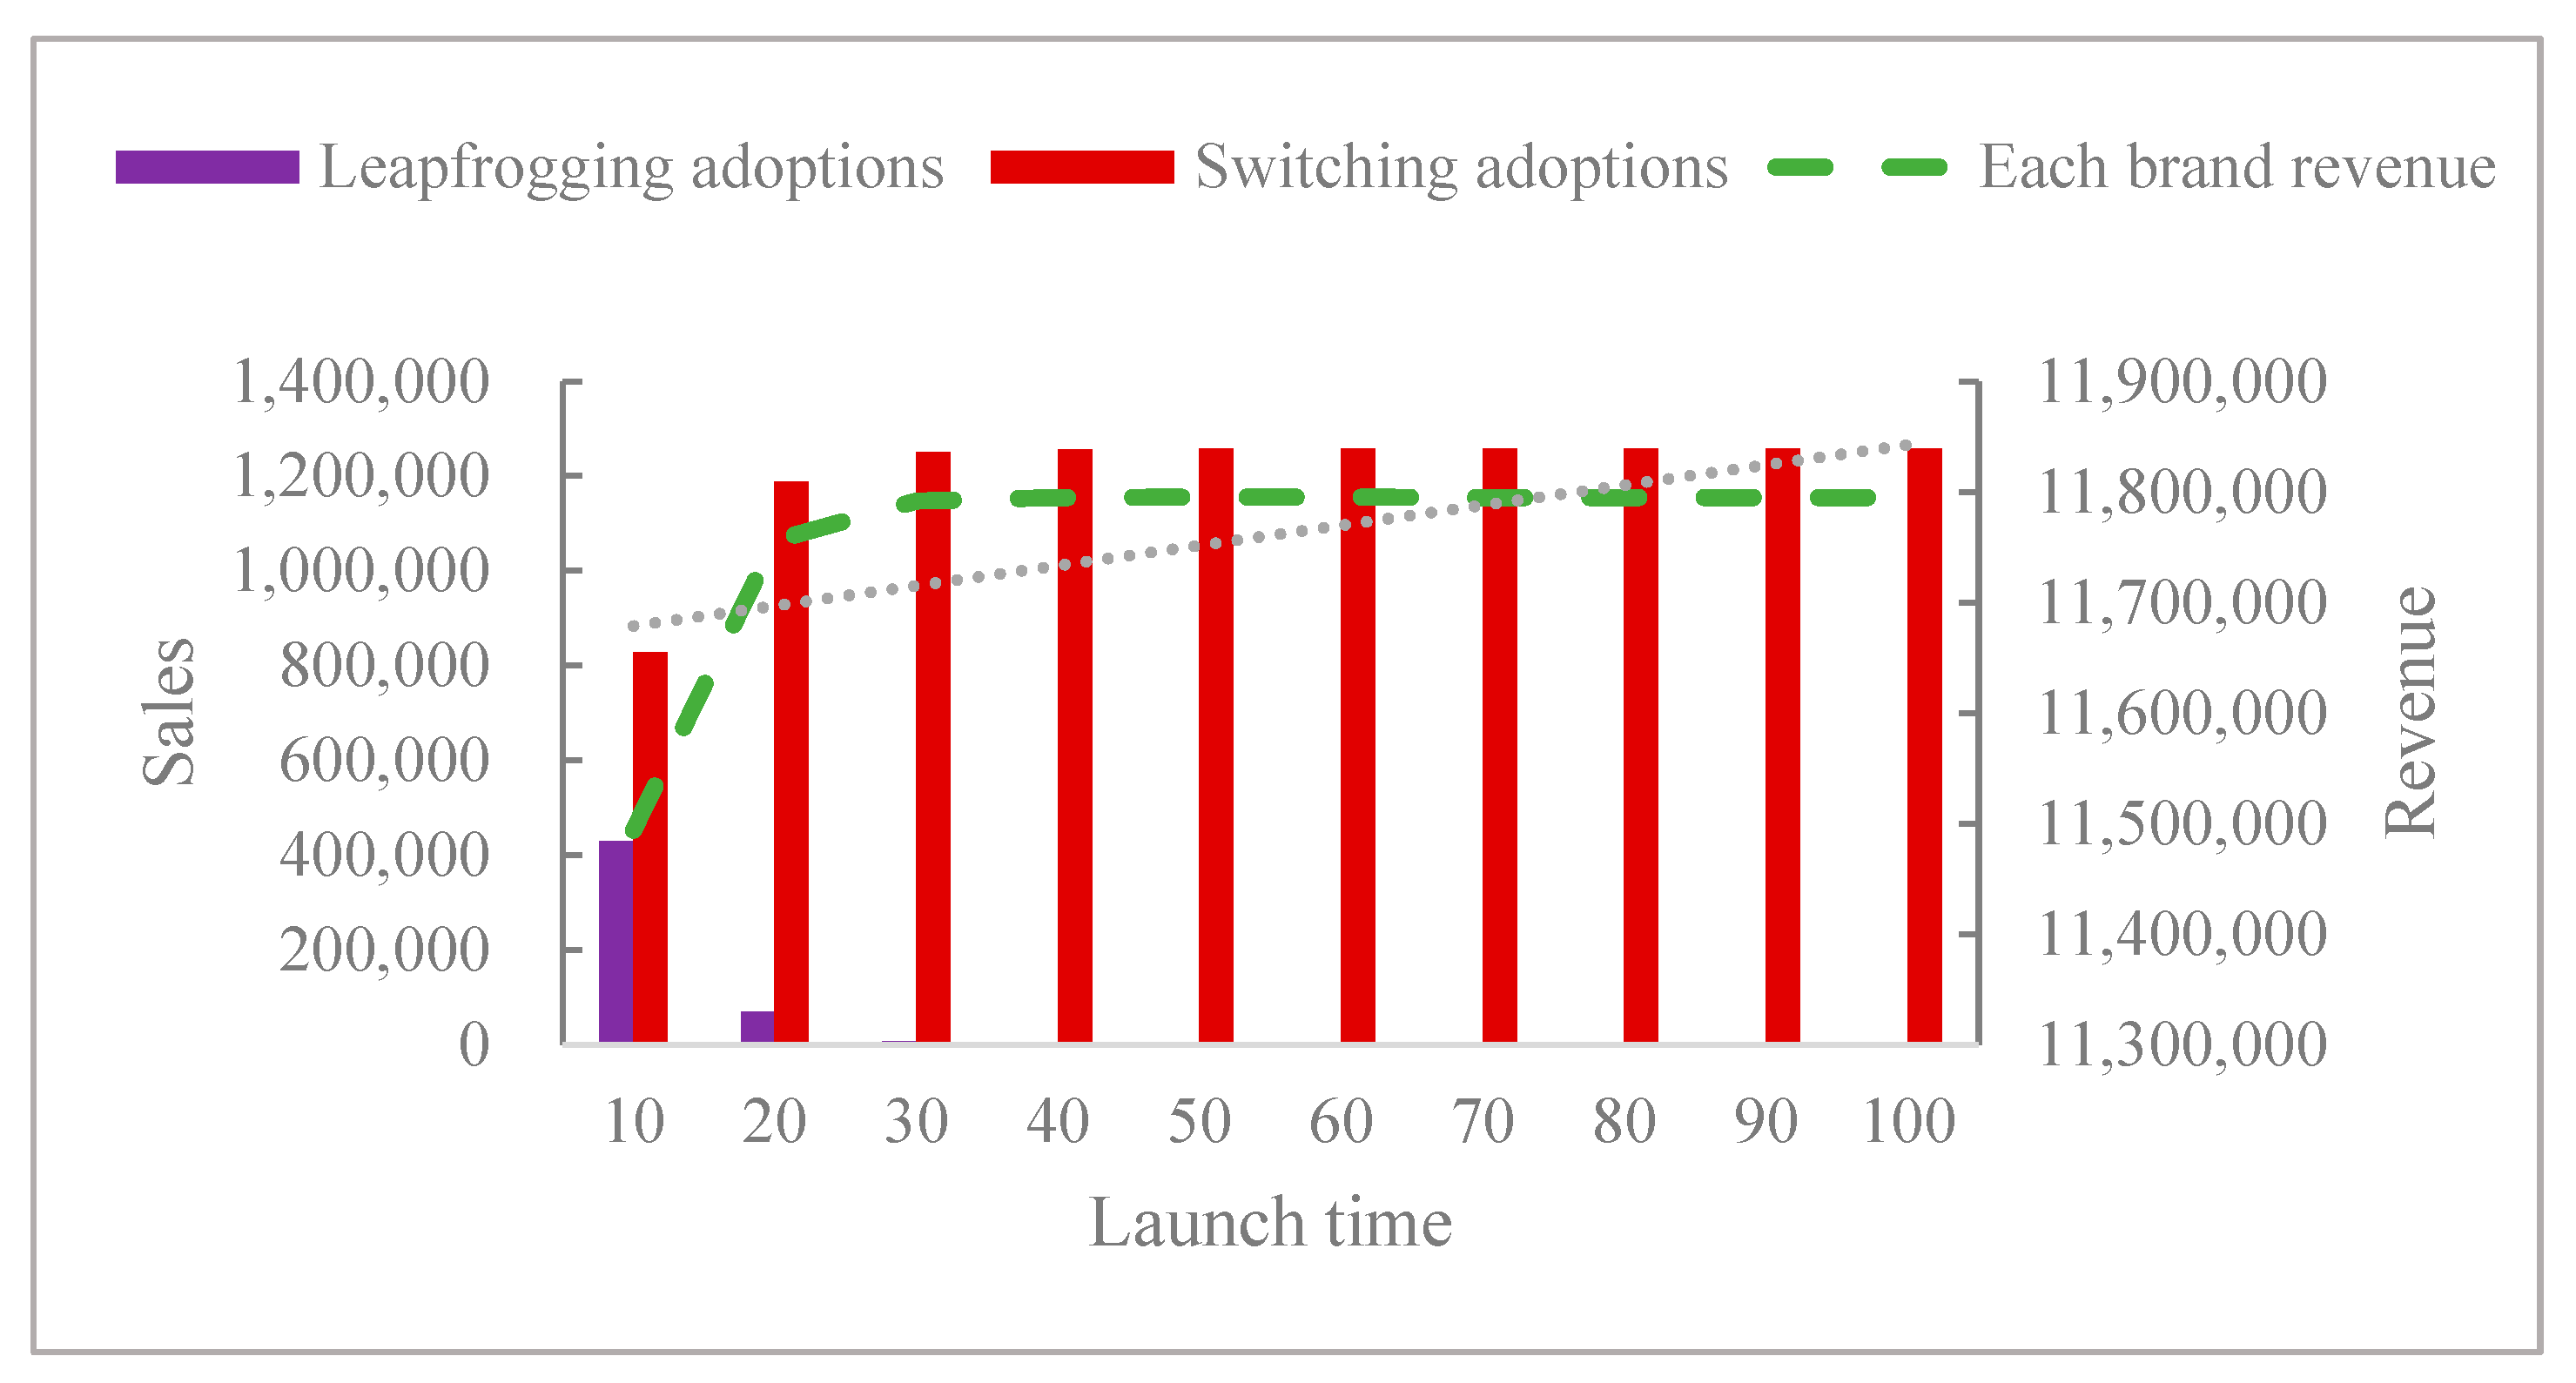
5.3. Launch Time Decision

5.3.1. Launch Time Decision under Equal Brand Value Spillover Scenario

Under the base model, the impact of changing the launch time to market on leapfrogging adoptions, switching adoptions, and revenue is studied. The simulation results are shown in Figure 13.
Figure 13 shows that in the condition of equal competitive strength, the launch time to market has an important impact on brand revenue, leapfrogging buyers or adoptions, and switching buyers or adoptions. Under the benchmark model, the early launch of new products will erode the market of the previous generation of old products and weaken the upgrading of the users of the first generation of products to the second generation of products, and the revenue will also decrease. With competitive brand strength, in anticipation of the possibility that rivals will be synchronized in releasing their own new products, the enterprise will not launch its new products too early, which would not only cause a cannibalizing effect on the previous generation of old products but would also reduce their own revenues, resulting in an overall revenue loss for the industry. Enterprises generally choose to release new products at the end of the sales of the previous generation of products in order to minimize leapfrogging buyers or adoptions, to increase switching buyers or adoptions and to maximize revenue.

5.3.2. Launch Time Decision under Unequal Brand Value Spillover Scenario

In the case of a spillover effect of brand value, brand strength is no longer equal. By changing the launch time of second-generation products, the impact on leapfrogging buyers, switching buyers, and revenue of each brand is obtained. Setting the launch time to market within the range of [0, 100], the simulation results are shown in Figure 14:
Figure 14 shows the relationship between the launch time, the number of leapfrogging buyers and switching buyers, and the total revenue of each brand in the case of unequal competitive strength. By solving the time to market of brand A, it is found that the optimal time to market of brand A is t = 84.6, while the optimal launch time to market of brand B is t = 70.3. Strong brands want new products to be launched to market a little later, and weak brands want to launch their products to the market earlier. As can be seen from the figure, the impact of early listing on the revenue of brand A is slightly greater than that of brand B, especially when the launch time is brought forward to around 20 to 30, at which the revenue of brand A changes significantly.

5.3.3. Launch Time to Market Decision under Quality Upgrade Scenario

In the benchmark model, the scenario of the quality upgrade of the second-generation products compared to the first-generation products is not considered. Under the quality upgrade situation, the impact of launch time to market on leapfrogging buyers, switching buyers, and the revenue of each brand is discussed. Under the benchmark model, we set kA1 = kB1 = 1 and kA2 = kB2 = 2, indicating that the second-generation products are upgraded, so that the quality level of the new products is twice the quality level of the old products. The simulation results are shown in Figure 15.
Under the quality upgrade scenario, the number of leapfrogging adoptions is further increased, the “cannibalization” of the first-generation products is strengthened, the number of users upgrading to second-generation products is reduced, and the early launch has a relatively large impact on brand revenue. For example, when t = 10 and t = 20, the revenue of each brand is 11,494,338.921 and 11,755,864.774, respectively. If the enterprise is listed at t = 20, the revenue will increase by 22.8% compared with that at t = 10. In the benchmark model, the revenue is 10,642,639.005 and 10,793,582.461, the company is listed at t = 20, and the revenue will be 14.2% higher than that at t = 10. Different quality levels have different impacts on the launch time to market of enterprises. Therefore, the launch time to market of products can be traded off according to the degree of the quality upgrade, which is consistent with the research results in the literature [39,49,50]. In the case of the simultaneous launch of various brands, if the expected quality upgrade is higher than that of competitors, the launch time can be appropriately delayed. The research conclusions of this paper and those of previous studies clarify the relationship between the degree of quality upgrade and the launch time to market, and this paper provides an explanation from the perspective of market “cannibalization” and “upgrade”.
Summary 8: An early launch time for products will have a negative impact on the brand’s revenue, enhance the cannibalization effect of the previous-generation product market, and weaken the revenue of product upgrades. In the situation of upgrading the quality level, the above phenomenon will be strengthened.

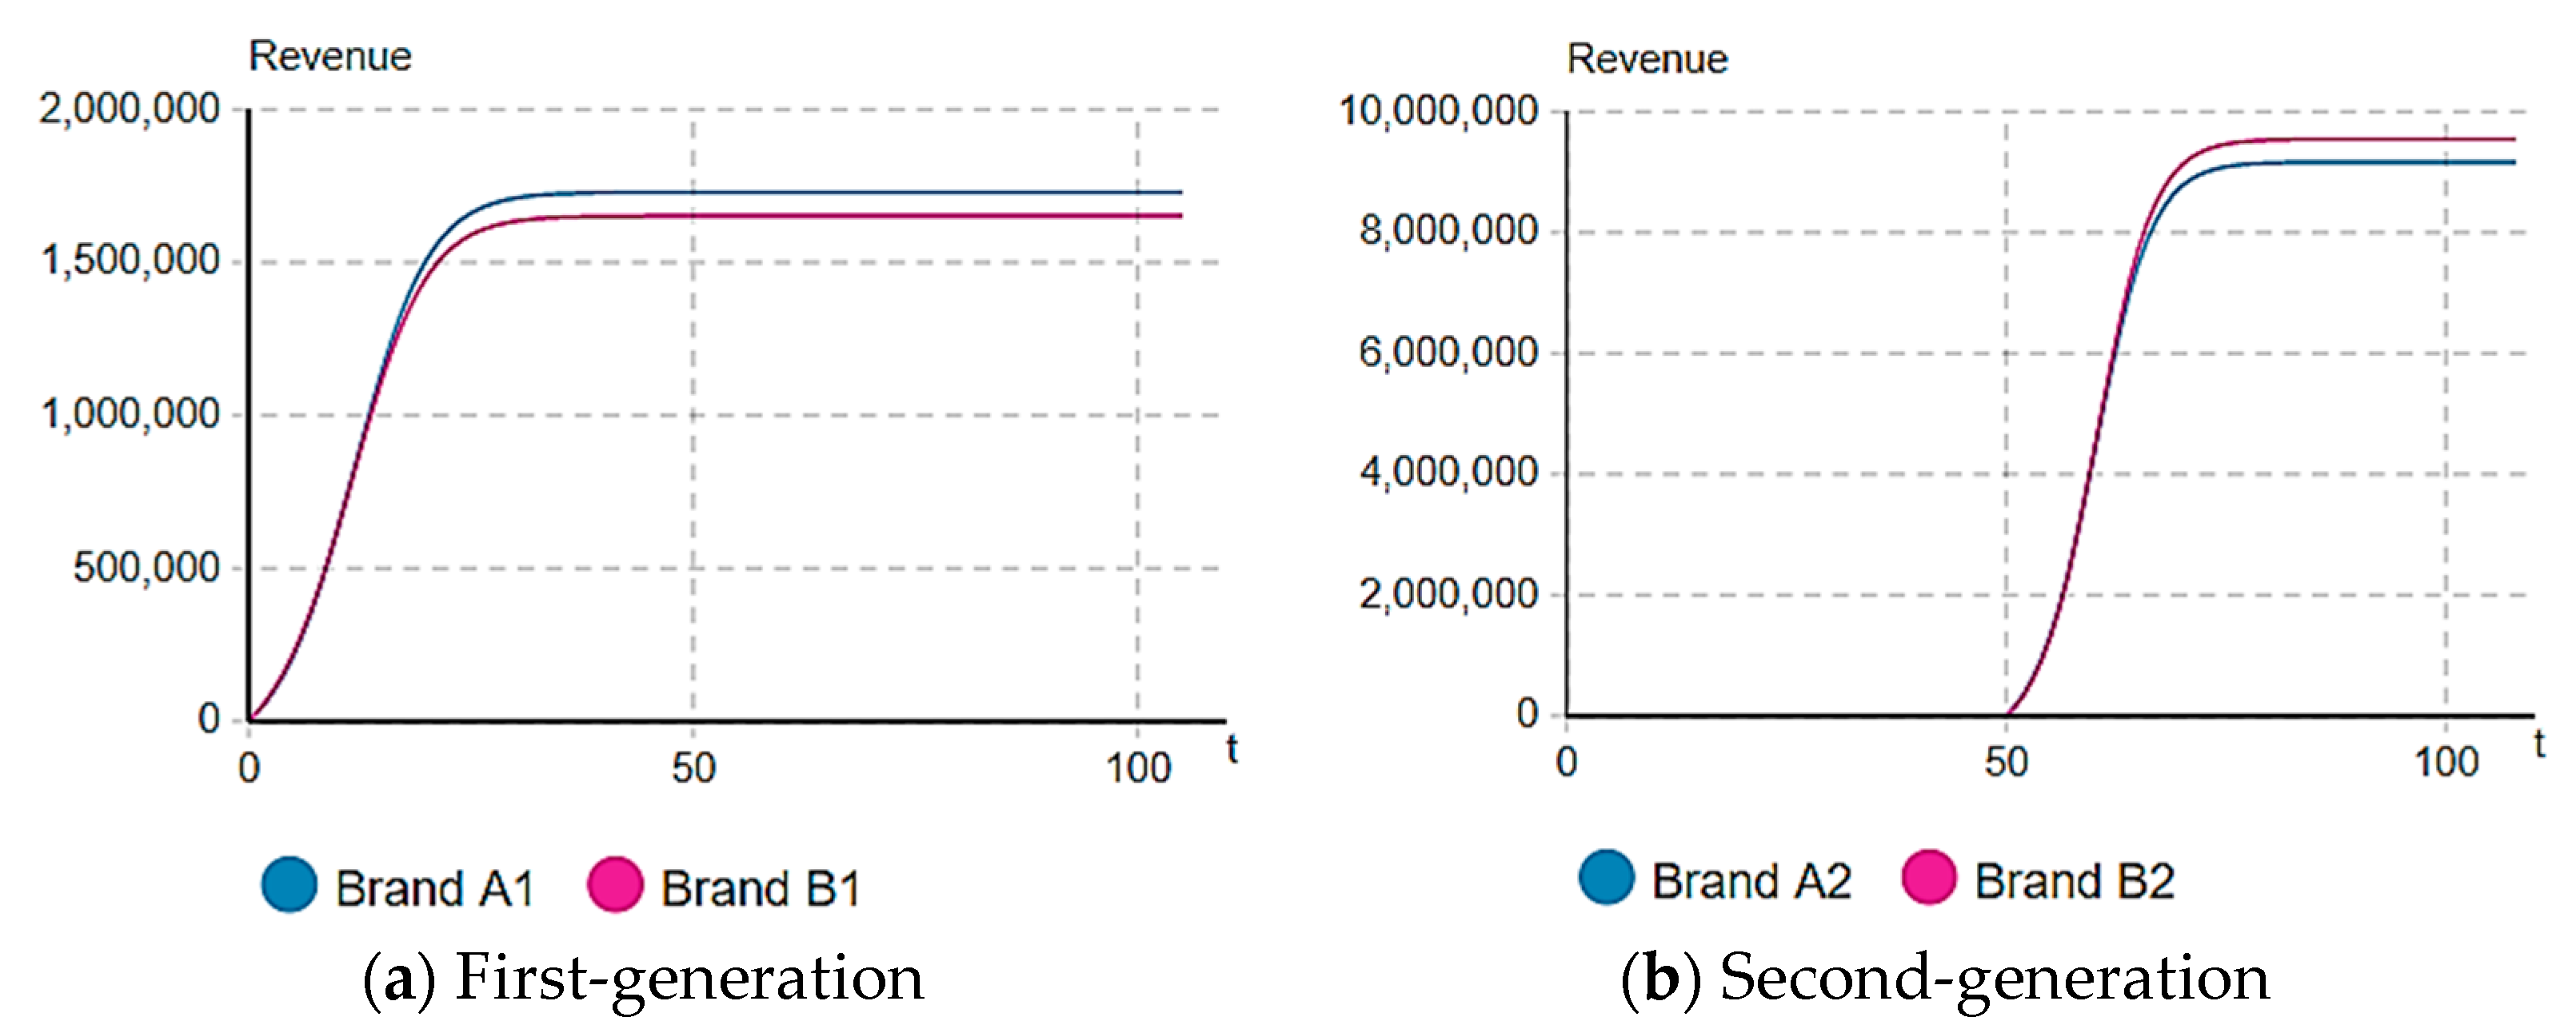
6. Model and Summaries Verification

We check our model and summaries via a case study to visually examine their validity. We analyze the price data of basic models of Apple and Xiaomi over the years in the Chinese market as an example, and the price unit used is CNY. Apple is a strong brand, while Xiaomi is a weak brand, and they are both enterprises that have upgraded their products in multiple generations, meaning that our model is suitable for this situation. As the pricing data of Apple mobile phones over the years show, we find that the initial pricing level of the iPhone 8 and iPhone X on the market greatly improved, marked by an ellipse in Figure 16. It is understood that the iPhone X realized a leapfrog change in technology or quality at that time and introduced a face recognition function for the first time. In addition, the overall design greatly subverted the previous generation of products, meaning that it no longer belongs to the product quality or technology upgrading series studied in this paper, so the data of iPhoneX are excluded.
As can be seen from Figure 16, (1) after several generations of product upgrades, the pricing of Apple’s mobile phone products remains relatively stable, while that of Xiaomi shows a trend of a pricing increase overall. The continuous rising period for price is marked by an oval in the figure. During this period, Xiaomi realized the improvement of brand awareness after previous periods of product technology or quality upgrading. Xiaomi used the strategy of raising pricing in three successive generations of product upgrades, which is consistent with the analysis results presented above in this paper. However, during the three successive generations of product upgrading, the two enterprises also maintained a relatively stable pricing strategy in the process of product upgrading for several generations, which proved the validity of summary 7. (2) Xiaomi’s pricing rose in stages, circled by a dashed ellipse in Figure 16, perhaps because of the increase in Xiaomi’s brand premium and the gain of brand spillover value in the face of other competitors, which enabled Xiaomi to set a higher level of pricing while maintaining pricing stability in a certain period of time. The benefits of products should be improved by upgrading the quality and technology level, instead of increasing the pricing of competitors through multiple generations, which can be explained in summaries 3 and 5 in this paper. In actual business activities, the brand of Apple has a high premium, thus developing a high level of pricing strategy in the sales process of multi-generation products and keeping the pricing of multi-generation products relatively stable, in order to wait for other brands of mobile phones to increase the revenue of each generation of Apple mobile phones in the process of pricing increase. Xiaomi adopts a phased pricing strategy and always maintains a low pricing level. It also seeks to maintain the relatively stable pricing of multi-generation products. Xiaomi products themselves do not have high profit margins, are unable to weaken their own revenues through cutting the price, and avoid large price increases, pushing up the revenues of other domestic competitive brands. Perhaps it is the existence of brand value spillover that forms a relatively stable pricing strategy for multi-generation products of enterprises. Summaries 3 and 4 in this study can provide an explanation for this phenomenon. (3) In view of Apple’s almost stable launch time every year (September or October) and the “squeezing toothpaste” style of product quality upgrades, summary 6 and summary 8 in this paper can explain this.

7. Conclusions

In this study, the diffusion process of the multi-generation products model is built and simulated in a competitive situation, and influence factors such as brand value spillover effect, dynamic price, and quality level are introduced. Through simulation calculation, the influence of pricing, quality level, and launch time to market on brand revenue is analyzed, as well as the substitution effect between new and previous-generation products on enterprise revenue, and eight relevant important summaries are provided.
This paper provides the following management-related conclusions: (i) In the context of brand competition, the way to obtain high revenues is through lower pricing or higher pricing after quality upgrades. In the process of multi-generation products, the key to pricing-level decisions is brand competitiveness, specifically whether it is stronger. (ii) Strong brands can set a higher level of pricing and then try to maintain a stable price strategy or slightly increase the price in the process of quality upgrading of multi-generation products in order to obtain higher brand value benefits, and with the learning effect, the development costs will continue to decline [3], meaning that more revenue will be obtained. However, weak brands set a lower pricing level in the early stage and appropriately raise their pricing level with continuous quality upgrades and brand competitiveness improvement. After obtaining a relative brand premium, they should try to maintain price stability and improve the brand strength ability through continuous quality upgrades. (iii) The launch-time-to-market decision of new products is influenced by the level of the quality upgrade of new products, and the frequency of releasing new products should be traded off against the degree of product quality upgrade. From the perspective of the diffusion of brand competition, this paper provides theoretical support and a decision-making basis for enterprises to continuously promote product quality or technical level upgrading and also offers sustainable improvement under a stable pricing strategy.
This paper mainly studies the diffusion of multi-generation products in the context of brand competition. Instead of considering a certain user’s loyalty to a brand and the conversion cost between brands, it only considers the competition between products of the same generation between brands. In the future, we can consider the conversion between different brands—that is, the multi-generation products’ competition between different brands. In fact, the mutual transfer or betrayal of users to the brand is a very common phenomenon, and it is necessary to carry out a more detailed division of user behavior. This can be achieved by modeling individual micro-behaviors [51], combined with the multi-generation diffusion model constructed in this paper, which represents a good research direction for the future. The model constructed in this paper only covers the leapfrogging effect of new products on the market share of the previous generation of products and does not separate the substitution effect of the previous generation of products on the market share of new products; future research will reflect this kind of consumer behavior.

Author Contributions

Conceptualization, B.T. and Z.Z.; methodology, B.T. and Z.Z.; software, B.T.; validation, B.T., Z.Z. and P.J.; formal analysis, B.T. and Z.Z.; investigation, B.T.; resources, Z.Z.; data curation, B.T.; writing—original draft preparation, B.T.; writing—review and editing, B.T. and P.J.; visualization, B.T.; supervision, Z.Z. and X.W.; project administration, Z.Z.; funding acquisition, Z.Z. and X.W. All authors have read and agreed to the published version of the manuscript.

Funding

The research was funded by the National Natural Science Foundation of China, China (Grant No. 72172025, 71772033, and 72101051); the Humanities and Social Sciences Foundation of the Ministry of Education of China (Grant No. 21YJAZH130); the Scientific Research Foundation of the Education Department of Liaoning Province (Grant No. LJKMZ20221606); and the Liaoning Provincial Social Science Planning Fund for 2021(Grant No. L21BTQ001).

Institutional Review Board Statement

Not applicable.

Informed Consent Statement

Not applicable.

Data Availability Statement

Part of the data in this study is generated via simulation. All code and SD model files will be made available upon reasonable request.

Acknowledgments

The authors appreciate the valuable comments and suggestions of anonymous reviewers and area editors, which improved this paper both in content and representation. All authors have consented to the acknowledgement.

Conflicts of Interest

The authors declare no conflict of interest.

References

  1. Sun, J.; Xie, J.; Chen, T.; Li, F.; Wang, G. Managing reference–group effects in sequential product upgrades. Prod. Oper. Manag. 2022, 31, 442–456. [Google Scholar] [CrossRef]
  2. Morgan, L.O.; Morgan, R.M.; Moore, W.L. Quality and Time-to-Market Trade-offs when There Are Multiple Product Generations. Manuf. Serv. Oper. Manag. 2001, 3, 89–104. [Google Scholar]
  3. Liao, S.; Seifert, R.W. On the optimal frequency of multiple generation product introductions. Eur. J. Oper. Res. 2015, 245, 805–814. [Google Scholar] [CrossRef]
  4. Hapuwatte, B.M.; Badurdeen, F.; Bagh, A.; Jawahir, I. Optimizing sustainability performance through component commonality for multi-generational products. Resour. Conserv. Recycl. 2022, 180, 105999. [Google Scholar]
  5. Dhakal, T.; Min, K.S.; Lim, D.E. Review of multi-generation innovation diffusion models. Ind. Eng. Manag. Syst. 2019, 18, 794–807. [Google Scholar] [CrossRef]
  6. Jiang, Z.; Dipak, C.; Jain, A. Generalized Norton–Bass Model for Multigeneration Diffusion. Manag. Sci. 2012, 58, 1887–1897. [Google Scholar] [CrossRef]
  7. Shi, X.; Chumnumpan, P. Modelling market dynamics of multi-brand and multi-generational products. Eur. J. Oper. Res. 2019, 279, 199–210. [Google Scholar] [CrossRef]
  8. Maier, F.H. New product diffusion models in innovation management—A system dynamics perspective. Syst. Dyn. Rev. J. Syst. Dyn. Soc. 1998, 14, 285–308. [Google Scholar] [CrossRef]
  9. Norton, J.A.; Bass, F.M. A Diffusion Theory Model of Adoption and Substitution for Successive Generations of High-Technology Products. Manag. Sci. 1987, 33, 1069–1086. [Google Scholar] [CrossRef]
  10. Islam, T.; Fiebig, D.G. Modelling the development of supply–restricted telecommunications markets. J. Forecast. 2001, 20, 249–264. [Google Scholar] [CrossRef]
  11. Ilonen, J.; Kamarainen, J.K.; Puumalainen, K.; Sundqvist, S.; Kälviäinen, H. Toward automatic forecasts for diffusion of innovations. Technol. Forecast. Soc. Chang. 2006, 73, 182–198. [Google Scholar]
  12. Guo, Z.; Chen, J. Multigeneration Product Diffusion in the Presence of Strategic Consumers. Inf. Syst. Res. 2018, 29, 206–224. [Google Scholar]
  13. Jun, D.B.; Park, Y.S. A Choice-Based Diffusion Model for Multiple Generations of Products. Technol. Forecast. Soc. Chang. 1999, 61, 45–58. [Google Scholar]
  14. Bass, F.M. A new product growth for model consumer durables. Manag. Sci. 1969, 15, 215–227. [Google Scholar]
  15. Zhang, L.; Li, Y.; Al, W. Research on Diffusion Mode of Chinese Mobile Communication Products. In Proceedings of the 2007 International Conference on Management Science and Engineering, Harbin, China, 20–22 August 2007; pp. 2034–2039. [Google Scholar]
  16. Laciana, C.E.; Gual, G.; Kalmus, D.; Oteiza-Aguirre, N.; Rovere, S. Diffusion of two brands in competition: Cross-brand effect. Phys. A Stat. Mech. Appl. 2014, 413, 104–115. [Google Scholar]
  17. Nikolopoulos, K.; Buxton, S.; Khammash, M.; Stern, P. Forecasting branded and generic pharmaceuticals. Int. J. Forecast. 2016, 32, 344–357. [Google Scholar]
  18. Krishnan, T.V.; Vakratsas, D. The multiple roles of interpersonal communication in new product growth. Int. J. Res. Mark. 2012, 29, 292–305. [Google Scholar]
  19. Guseo, R.; Mortarino, C. Within-brand and cross-brand word-of-mouth for sequential multi-innovation diffusions. IMA J. Manag. Math. 2014, 25, 287–311. [Google Scholar]
  20. Krishnan, T.V.; Kumar, F.M.B. Impact of a Late Entrant on the Diffusion of a New Product/Service. J. Mark. Res. 2000, 37, 269–278. [Google Scholar]
  21. Mahajan, V.; Sharma, S.; Buzzell, R.D. Assessing the impact of competitive entry on market expansion and incumbent sales. J. Mark. 1993, 57, 39–52. [Google Scholar]
  22. Kim, N.; Chang, D.R.; Shocker, A.D. Modeling intercategory and generational dynamics for a growing information technology industry. Manag. Sci. 2000, 46, 496–512. [Google Scholar]
  23. Libai, B.; Muller, E.; Peres, R. The Role of Within-Brand and Cross-Brand Communications in Competitive Growth. J. Mark. 2009, 73, 19–34. [Google Scholar]
  24. Aggrawal, D.; Anand, A.; Bansal, G.; Davies, G.H.; Maroufkhani, P.; Dwivedi, Y.K. Modelling product lines diffusion: A framework incorporating competitive brands for sustainable innovations. Oper. Manag. Res. 2022, 15, 760–772. [Google Scholar]
  25. Li, H.; Graves, S.C. Pricing Decisions During Inter-Generational Product Transition. Prod. Oper. Manag. 2012, 21, 14–28. [Google Scholar]
  26. Li, F.; Du, T.C.; Wei, Y. Offensive pricing strategies for online platforms. Int. J. Prod. Econ. 2019, 216, 287–304. [Google Scholar]
  27. McGrath, M.E. Product Strategy for High-Technology Companies: How to Achieve Growth, Competitive Advantage, and Increased Profits. 1995. Available online: https://cir.nii.ac.jp/crid/1130282272956639744 (accessed on 22 August 2023).
  28. Henderson, B. The experience curve reviewed–II. History. Perspectives 1973, 125, 1–2. [Google Scholar]
  29. Bock, S.; Puetz, M. Implementing Value Engineering based on a multidimensional quality-oriented control calculus within a Target Costing and Target Pricing approach. Int. J. Prod. Econ. 2017, 183, 146–158. [Google Scholar]
  30. Li, H.; Webster, S.; Yu, G. Product Design Under Multinomial Logit Choices: Optimization of Quality and Prices in an Evolving Product Line. Manuf. Serv. Oper. Manag. 2020, 22, 1011–1025. [Google Scholar]
  31. Bala, R.; Carr, S. Pricing Software Upgrades: The Role of Product Improvement and User Costs. Prod. Oper. Manag. 2009, 18, 560–580. [Google Scholar]
  32. Kim, H.J.; Jee, S.J.; Sohn, S.Y. Cost–benefit model for multi-generational high-technology products to compare sequential innovation strategy with quality strategy. PLoS ONE 2021, 16, e0249124. [Google Scholar]
  33. Druehl, C.T.; Schmidt, G.M.; Souza, G.C. The optimal pace of product updates. Eur. J. Oper. Res. 2009, 192, 621–633. [Google Scholar] [CrossRef]
  34. Feng, H.; Jiang, Z.; Liu, D. Quality, pricing, and release time: Optimal market entry strategy for new software-as-a-service vendors. MIS Q. 2017, 42, 333–353. [Google Scholar] [CrossRef]
  35. Lobel, I.; Patel, J.; Vulcano, G.; Zhang, J. Optimizing Product Launches in the Presence of Strategic Consumers. Manag. Sci. 2016, 62, 1778–1799. [Google Scholar] [CrossRef]
  36. Negahban, A.; Smith, J.S. Optimal production-sales policies and entry time for successive generations of new products. Int. J. Prod. Econ. 2018, 199, 220–232. [Google Scholar] [CrossRef]
  37. Shen, W.; Duenyas, I.; Kapuscinski, R. Optimal pricing, production, and inventory for new product diffusion under supply constraints. Manuf. Serv. Oper. Manag. 2014, 16, 28–45. [Google Scholar] [CrossRef]
  38. Kalyanaram, G.; Robinson, W.T.; Urban, G.L. Order of Market Entry: Established Empirical Generalizations, Emerging Empirical Generalizations, and Future Research. Mark. Sci. 1995, 14 (Suppl. S3), 212. [Google Scholar] [CrossRef]
  39. Grützner, T.; Schnider, C.; Zollinger, D.; Seyfang, B.C.; Künzle, N. Reducing time to market by innovative development and production strategies. Chem. Eng. Technol. 2016, 39, 1835–1844. [Google Scholar] [CrossRef]
  40. McKie, E.C.; Ferguson, M.E.; Galbreth, M.R.; Venkataraman, S. How do consumers choose between multiple product generations and conditions? An empirical study of iPad sales on eBay. Prod. Oper. Manag. 2018, 27, 1574–1594. [Google Scholar] [CrossRef]
  41. Savin, S.; Terwiesch, C. Optimal product launch times in a duopoly: Balancing life-cycle revenues with product cost. Oper. Res. 2005, 53, 26–47. [Google Scholar] [CrossRef]
  42. Ke, T.T.; Shen, Z.J.M.; Li, S. How inventory cost influences introduction timing of product line extensions. Prod. Oper. Manag. 2013, 22, 1214–1231. [Google Scholar]
  43. Kilicay-Ergin, N.; Lin, C.; Okudan, G.E. Analysis of dynamic pricing scenarios for multiple-generation product lines. J. Syst. Sci. Syst. Eng. 2015, 24, 107–129. [Google Scholar] [CrossRef]
  44. El Ouardighi, F.; Feichtinger, G.; Grass, D.; Hartl, R.F.; Kort, P.M. Advertising and Quality-Dependent Word-of-Mouth in a Contagion Sales Model. J. Optim. Theory Appl. 2016, 170, 323–342. [Google Scholar] [CrossRef]
  45. Danaher, P.J.; Hardie, B.G.S.; Putsis, W.P. Marketing-Mix Variables and the Diffusion of Successive Generations of a Technological Innovation. J. Mark. Res. 2001, 38, 501–514. [Google Scholar] [CrossRef]
  46. Cosguner, K.; Seetharaman, S. Dynamic Pricing for New Products Using a Utility-Based Generalization of the Bass Diffusion Model. Manag. Sci. 2022, 68, 1904–1922. [Google Scholar] [CrossRef]
  47. Krishnan, T.V.; Bass, F.M.; Jain, D.C. Optimal Pricing Strategy for New Products. Manag. Sci. 1999, 45, 1650–1663. [Google Scholar] [CrossRef]
  48. Speece, M.W.; MacLachlan, D.L. Forecasting fluid milk package type with a multigeneration new product diffusion model. IEEE Trans. Eng. Manag. 1992, 39, 169–175. [Google Scholar] [CrossRef]
  49. Pedram, M.; Balachander, S. Increasing Quality Sequence: When Is It an Optimal Product Introduction Strategy? Manag. Sci. 2015, 61, 2487–2494. [Google Scholar] [CrossRef]
  50. Peng, S.; Li, B.; Hou, P. Optimal Upgrading Strategy for the Quality, Release Time, and Pricing for Software Vendor. IEEE Trans. Eng. Manag. 2021, 70, 3849–3862. [Google Scholar] [CrossRef]
  51. Zhang, J.; Dong, L.; Ji, T. The Diffusion of Competitive Platform-Based Products with Network Effects. Sustainability 2023, 15, 8845. [Google Scholar] [CrossRef]
Figure 1. Multi-generation diffusion model of brand competition.
Sustainability 15 12920 g001
Figure 2. The curve for the total revenue of two brands.
Sustainability 15 12920 g002
Figure 3. The revenue decomposition results of each brand between two generations.
Sustainability 15 12920 g003
Figure 4. Influence of first-generation products’ initial price for brand A.
Sustainability 15 12920 g004
Figure 5. Influence of second-generation products’ initial price for brand A.
Sustainability 15 12920 g005
Figure 6. The curve for the total revenue of two brands with unequal strength.
Sustainability 15 12920 g006
Figure 7. Influence of first-generation products’ initial price for brand A with unequal strength.
Sustainability 15 12920 g007
Figure 8. Influence of second-generation products’ initial price for brand A with unequal strength.
Sustainability 15 12920 g008
Figure 9. Influence of first-generation products’ quality for brand A.
Sustainability 15 12920 g009
Figure 10. Influence of second-generation products’ quality for brand A.
Sustainability 15 12920 g010
Figure 11. Influence of first-generation products’ quality for brand A to second-generation.
Sustainability 15 12920 g011
Figure 12. Influence of second-generation products’ quality for brand A to first-generation.
Sustainability 15 12920 g012
Figure 13. The relationship between launch time and total revenue for brand of equal strength.
Sustainability 15 12920 g013
Figure 14. The relationship between launch time and total revenue for brand of unequal strength.
Sustainability 15 12920 g014
Figure 15. The relationship between launch time and total revenue for brand of quality upgrade.
Sustainability 15 12920 g015
Figure 16. Pricing chart of Apple and Xiaomi mobile phones over the years.
Sustainability 15 12920 g016
Table 1. The interpretation and summary of notation.
NotationInterpretation
MiTotal market size of each generation of products
kjiThe quality level of each j brand and i generation of products
α j Brand value spillover effect coefficient
p j i Advertising coefficient of each j brand and i generation of products
q j i Word-of-mouth influence coefficient of each j brand and i generation of products
p j i t Each j brand of the i generation of products’ dynamic price (price changes)
Nji(t)The cumulative diffusion number of each j brand and i generation of products at time t
Sji(t)The cumulative sales volume of each j brand and i generation of products at time t
πjTotal revenue of two generations of products for each brand j
βjPrice sensitivity coefficient of each j brand
τ 2 Second-generation products’ launch time
RDiminishing price factor
rProduct revenue discount factor
TSimulation termination time
Table 2. Basic parameter settings during model simulation.
ParameterValueParameterValue
M1 5.03 × 10 7 kA11
M2 21.1 × 10 7 kA21
αA1kB11
αB1kB21
qA10.337pA1(0)1
qA20.477pA2(0)1
qB10.337pB1(0)1
qB20.477pB2(0)1
pA10.00943R−0.005
pA20.00943 τ 2 50
pB10.00943βA0.5
pB20.00943βB0.5
r0.02T150 weeks
Table 3. Optimal initial price of brand A under scenarios of different quality levels.
ScenarioBrand Value
αA = 1, αB = 1
Brand Value
αA = 3, αB = 1
kA1 = 1, kB1 = 1
kA2 = 2, kB2 = 2
pA1(0) = 0.849, pA2(τ2) = 0.994
πA = 11,827,922.349
pA1(0) = 1.278, pA2(τ2) = 1.398
πA = 21,015,325.598 (1)
kA1 = 2, kB1 = 1
kA2 = 3, kB2 = 2
pA1(0) = 1.345, pA2(τ2) = 1.336
πA = 21,963,950.961
pA1(0) = 1.762, pA2(τ2) = 1.742
πA = 31,744,272.157 (2)
kA1 = 1, kB1 = 1
kA2 = 3, kB2 = 2
pA1(0) = 0.676, pA2(τ2) = 1.34
πA = 19,334,506.412
pA1(0) = 1.173, pA2(τ2) = 1.743
πA = 29,099,025.877 (3)
kA1 = 2, kB1 = 1
kA2 = 3, kB2 = 3
pA1(0) = 1.438, pA2(τ2) = 0.954
πA = 14,736,147.193
pA1(0) = 1.857, pA2(τ2) = 1.321
πA = 23,729,928.91 (4)
kA1 = 2, kB1 = 1
kA2 = 2, kB2 = 1
pA1(0) = 1.427, pA2(τ2) = 1.675
πA = 24,773,330.916
pA1(0) = 1.741, pA2(τ2) = 2.075
πA = 35,111,523.865 (5)
kA1 = 1, kB1 = 1
kA2 = 1, kB2 = 1
pA1(0) = 0.875, pA2(τ2) = 1.094
πA = 10,894,474.196
pA1(0) = 1.291, pA2(τ2) = 1.556
πA = 20,536,744.303 (6)
Table 4. Optimal initial price of brand B under scenarios of different quality levels.
ScenarioBrand Value
αA = 1, αB = 1
Brand Value
αA = 3, αB = 1
kA1 = 1, kB1 = 1
kA2 = 2, kB2 = 2
pB1(0) = 0.849, pB2(τ2) = 0.994
πB = 11,827,922.349
pB1(0) = 0.819, pB2(τ2) = 0.833
πB = 5,964,821.122 (7)
kA1 = 2, kB1 = 1
kA2 = 3, kB2 = 2
pB1(0) = 0.715, pB2(τ2) = 0.761
πB = 5,460,440.417
pB1(0) = 0.999, pB2(τ2) = 0.78
πB = 2,805,444.926 (8)
kA1 = 1, kB1 = 1
kA2 = 3, kB2 = 2
pB1(0) = 0.99, pB2(τ2) = 0.762
πB = 6,789,403.062
pB1(0) = 0.949, pB2(τ2) = 0.78
πB = 3,402,421.956 (9)
kA1 = 2, kB1 = 1
kA2 = 3, kB2 = 3
pB1(0) = 0.454, pB2(τ2) = 0.952
πB = 10,685,858.775
pB1(0) = 0.813, pB2(τ2) = 0.778
πB = 5,567,137.124 (10)
kA1 = 2, kB1 = 1
kA2 = 2, kB2 = 1
pB1(0) = 0.817, pB2(τ2) = 0.908
πB = 3,873,196.966
pB1(0) = 1.043, pB2(τ2) = 1.052
πB = 2,205,744.207 (11)
kA1 = 1, kB1 = 1
kA2 = 1, kB2 = 1
pB1(0) = 0.875, pB2(τ2) = 1.094
πB = 10,894,474.196
pB1(0) = 0.847, pB2(τ2) = 0.975
πB = 5,486,472.016 (12)
Disclaimer/Publisher’s Note: The statements, opinions and data contained in all publications are solely those of the individual author(s) and contributor(s) and not of MDPI and/or the editor(s). MDPI and/or the editor(s) disclaim responsibility for any injury to people or property resulting from any ideas, methods, instructions or products referred to in the content.

