
_Li.png)
Barriers to Applying Last-Mile Logistics in the Egyptian Market: An Extension of the Technology Acceptance Model


Abstract
:1. Introduction
2. The MAY-D System
3. Technology Acceptance Model
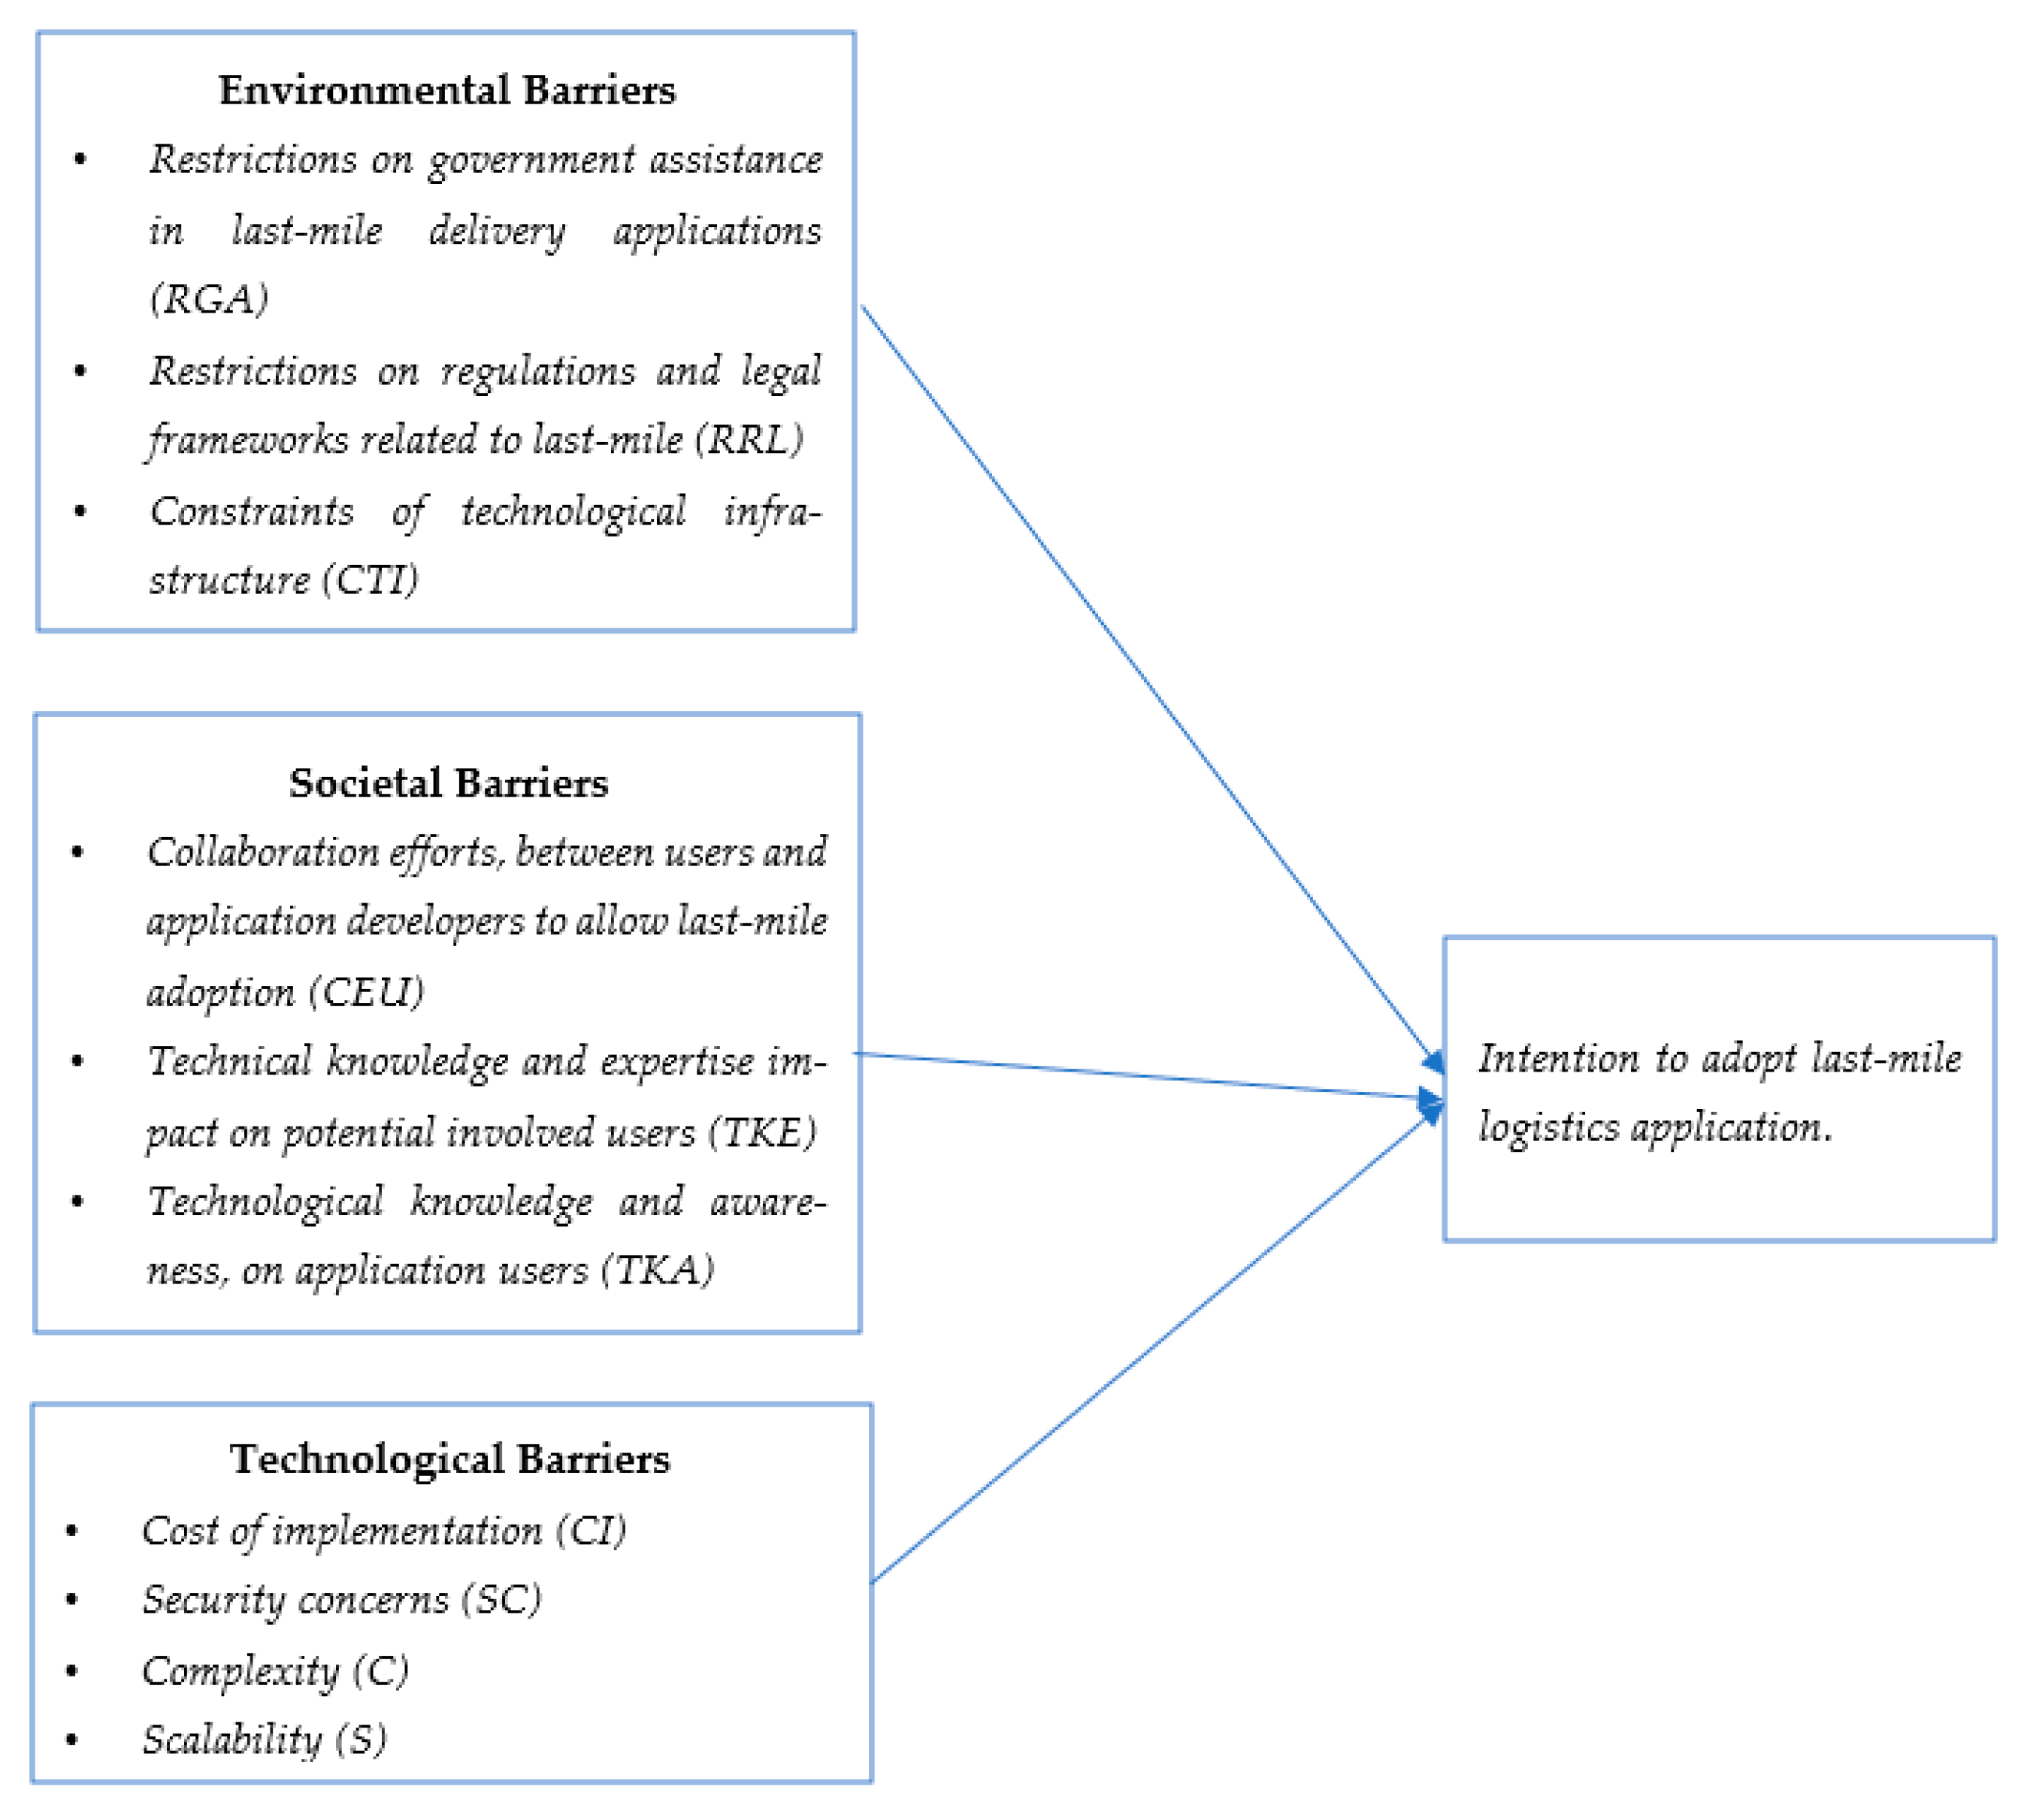
4. Barriers’ Impact on Last-Mile Application
4.1. Environmental Barriers
4.2. Societal Barriers
4.3. Technological Barriers
5. Hypotheses Development
5.1. Environmental Hypothesis
5.2. Societal Hypothesis
5.3. Technological Hypothesis
6. Research Methodology
6.1. Study Context
6.2. Sample and Procedures
6.3. Research Instruments

| Main Variables | Sub-Variables | Questions Assessing the Variables |
|---|---|---|
| Environmental Barriers | Restrictions to government assistance in last-mile delivery applications (RGA) [92] | The government has not supplied incentives to encourage the implementation of last-mile application in Egypt. |
| The Egyptian government does not enthusiastically encourage last-mile application implementation. | ||
| The Egyptian government has not launched significant legislations to boost last-mile application implementation. | ||
| There is no backing offered by the Egyptian government regarding last-mile implementation. | ||
| Restrictions on regulations and legal frameworks related to last-mile (RRL) [70,93,94] | The governing body (Egyptian cabinet) is not so far well determined to deal with last-mile issues. | |
| There is no plan for adjustments in policies that would interfere with our practices of last-mile application in the future. | ||
| There is no authority to solve disputes between users and developers. | ||
| Legal structures do not satisfactorily safeguard users from problems on last-mile platforms. | ||
| Constraints of technological infrastructure (CTI) [95,96,97] | The contemporary technological structure is not adequate for last-mile implementation. | |
| The existing internet service is not efficient enough for last-mile implementation. | ||
| There is not satisfactory access to last-mile technology. | ||
| Societal Barriers | Collaboration efforts, between users and application developers, to allow last-mile adoption (CEU) [98,99] | Is not easy. |
| Is challenging. | ||
| Demands a lot of intellectual effort. | ||
| Technical knowledge and expertise impact on potential involved users (TKE) [100,101] | Has the relevant technical knowledge about last-mile technology. | |
| Users are qualified to use last-mile applications. | ||
| Has interest in projects related to last-mile technology. | ||
| Is familiar with this type of technology and its applications. | ||
| Technological knowledge and awareness on the part of application users (TKA) [102] | Does not recognise last-mile as a competitive weapon. | |
| Does not recognise last-mile as an instrument to improve income and lifestyle. | ||
| Does not recognise last-mile as a tool to increase the usage of unused space in vehicles. | ||
| Does not recognise the potentials involved in participating in last-mile application. | ||
| Does not believe last-mile contributes significantly to their life or financial welfare. | ||
| Technological Barriers | Cost of implementation (CI) [103] | Increase the user’s income generated from their assets. |
| Are expensive due to trial-and-error. | ||
| Require high up-front investment costs. | ||
| Security concerns (SC) [104] | Do not feel secure in providing sensitive information when working with last-mile applications. | |
| Do not feel secure sending and/or uploading sensitive information to the platform. | ||
| Do not feel safe sending precious parcels through last-mile applications. | ||
| Do not feel that last-mile is a safe platform for operating businesses with sensitive information and cargo overall. | ||
| Complexity (C) [105] | Last-mile is conceptually difficult to understand from a business perspective. | |
| Last-mile is conceptually difficult to understand from a technical perspective. | ||
| When using last-mile technology, it is difficult to resolve transactional errors. | ||
| Using last-mile technology is difficult. | ||
| Scalability (S) [95,106] | The speed of operation of last-mile will never be enormous. | |
| Last-mile operation size will never be huge as users will be repelled from implementing this concept. | ||
| Overall expected operation size and speed are to be problematic aspects. | ||
| The Intention to Adopt the Sharing Economy Concept (Last-Mile) in Alexandria, Egypt | Regarding our stance on last-mile application technology [107,108] | Will NOT adopt last-mile application unless it proves beneficial for us. |
| Needs to clarify some queries regarding last-mile and justify adopting last-mile application. | ||
| Is unlikely to use last-mile application soon. | ||
| Believes that last-mile application is not for Alexandria city. |
6.4. Descriptive Analysis
7. The Research Findings
7.1. Pre-Test
7.2. Pilot Study
7.3. Non-Response Bias and Common Method Bias
7.4. Main Study
8. Results
9. Discussion
10. Conclusions
11. Theoretical Implications
12. Practical Implications
13. Limitations and Future Research
Author Contributions
Funding
Institutional Review Board Statement
Informed Consent Statement
Data Availability Statement
Conflicts of Interest
References
- Khosla, R.; Renaldi, R.; Mazzone, A.; McElroy, C.; Palafox-Alcantar, G. Sustainable Cooling in a Warming World: Technologies, Cultures, and Circularity. Annu. Rev. Environ. Resour. 2022, 47, 449–478. [Google Scholar] [CrossRef]
- Chaudhuri, R.; Chatterjee, S.; Ghosh, A.; Vrontis, D.; Thrassou, A. Sustainable innovation for shared mobility: Contextual and consumer factors of an Indian car subscription business model. Int. J. Entrep. Behav. Res. 2022. [Google Scholar] [CrossRef]
- Acquier, A.; Carbone, V.; Massé, D. How to create value (s) in the sharing economy: Business models, scalability, and sustainability. Technol. Innov. Manag. Rev. 2019, 9, 200–202. [Google Scholar] [CrossRef]
- Gansky, L. The Mesh: Why the Future of Business Is Sharing; Penguin: London, UK, 2010. [Google Scholar]
- Carbone, V.; Rouquet, A.; Roussat, C. A typology of logistics at work in collaborative consumption. Int. J. Phys. Distrib. Logist. Manag. 2018, 48, 570–585. [Google Scholar] [CrossRef]
- Li, S.; Wu, W.; Xia, Y.; Zhang, M.; Wang, S.; Douglas, M.A. How do crowd logistics platforms create value? An exploratory case study from China. Int. J. Logist. Res. Appl. 2019, 22, 501–518. [Google Scholar] [CrossRef]
- Huang, S.-Z. Removing barriers to a sharing economy helps attain sustainable development goals in ASEAN countries. J. Innov. Knowl. 2023, 8, 100300. [Google Scholar] [CrossRef]
- Moncef, B.; Monnet Dupuy, M. Last-mile logistics in the sharing economy: Sustainability paradoxes. Int. J. Phys. Distrib. Logist. Manag. 2021, 51, 508–527. [Google Scholar] [CrossRef]
- Silva, V.; Amaral, A.; Fontes, T. Sustainable Urban Last-Mile Logistics: A Systematic Literature Review. Sustainability 2023, 15, 2285. [Google Scholar] [CrossRef]
- Johansson, V.; Islind, A.S.; Lindroth, T.; Angenete, E.; Gellerstedt, M. Online communities as a driver for patient empowerment: Systematic review. J. Med. Internet Res. 2021, 23, e19910. [Google Scholar] [CrossRef]
- Marangunić, N.; Granić, A. Technology acceptance model: A literature review from 1986 to 2013. Univers. Access Inf. Soc. 2015, 14, 81–95. [Google Scholar] [CrossRef]
- Tu, J.-C.; Yang, C. Key factors influencing consumers’ purchase of electric vehicles. Sustainability 2019, 11, 3863. [Google Scholar] [CrossRef]
- Yadav, V.; Kaswan, M.S.; Gahlot, P.; Duhan, R.K.; Garza-Reyes, J.A.; Rathi, R.; Chaudhary, R.; Yadav, G. Green Lean Six Sigma for sustainability improvement: A systematic review and future research agenda. Int. J. Lean Six Sigma 2023. [Google Scholar] [CrossRef]
- Kaswan, M.S.; Rathi, R.; Cross, J.; Garza-Reyes, J.A.; Antony, J.; Yadav, V. Integrating Green Lean Six Sigma and industry 4.0: A conceptual framework. J. Manuf. Technol. Manag. 2022, 34, 87–121. [Google Scholar] [CrossRef]
- Melkonyan, A.; Gruchmann, T.; Lohmar, F.; Kamath, V.; Spinler, S. Sustainability assessment of last-mile logistics and distribution strategies: The case of local food networks. Int. J. Prod. Econ. 2020, 228, 107746. [Google Scholar] [CrossRef]
- Janjevic, M.; Winkenbach, M.; Merchán, D. Integrating collection-and-delivery points in the strategic design of urban last-mile e-commerce distribution networks. Transp. Res. Part E Logist. Transp. Rev. 2019, 131, 37–67. [Google Scholar] [CrossRef]
- Bosona, T. Urban freight last mile logistics—Challenges and opportunities to improve sustainability: A literature review. Sustainability 2020, 12, 8769. [Google Scholar] [CrossRef]
- Halldorsson, A.; Wehner, J. Last-mile logistics fulfilment: A framework for energy efficiency. Res. Transp. Bus. Manag. 2020, 37, 100481. [Google Scholar] [CrossRef]
- Xaмукoв, Ю.; Kaнoкoвa, M. Prospects and problems of robotic delivery of the last mile. The relevance of the problem and the concept of the solution. part I. EurasianUnionScientists 2021, 16, 24–32. [Google Scholar]
- Edwards, J.; McKinnon, A.C. Shopping trip or home delivery: Which has the smaller carbon footprint? Logist. Transp. Focus 2009, 11, 20–24. [Google Scholar]
- Olsson, J.; Hellström, D.; Pålsson, H. Framework of last mile logistics research: A systematic review of the literature. Sustainability 2019, 11, 7131. [Google Scholar] [CrossRef]
- Edwards, J.B.; McKinnon, A.C.; Cullinane, S.L. Comparative analysis of the carbon footprints of conventional and online retailing: A “last mile” perspective. Int. J. Phys. Distrib. Logist. Manag. 2010, 40, 103–123. [Google Scholar] [CrossRef]
- Mucowska, M. Trends of environmentally sustainable solutions of urban last-mile deliveries on the e-commerce market—A literature review. Sustainability 2021, 13, 5894. [Google Scholar] [CrossRef]
- Ali, A.H.; Gruchmann, T.; Melkonyan, A. Assessing the impact of sustainable logistics service quality on relationship quality: Survey-based evidence in Egypt. Clean. Logist. Supply Chain 2022, 4, 100036. [Google Scholar]
- Ali, A.H.; Melkonyan, A.; Noche, B.; Gruchmann, T. Developing a sustainable logistics service quality scale for logistics service providers in Egypt. Logistics 2021, 5, 21. [Google Scholar] [CrossRef]
- De Maio, A.; Laganà, D. The effectiveness of Vendor Managed Inventory in the last-mile delivery: An industrial application. Procedia Manuf. 2020, 42, 462–466. [Google Scholar] [CrossRef]
- Lauenstein, S.; Schank, C. Design of a Sustainable Last Mile in Urban Logistics—A Systematic Literature Review. Sustainability 2022, 14, 5501. [Google Scholar] [CrossRef]
- Suguna, M.; Shah, B.; Raj, S.K.; Suresh, M. A study on the influential factors of the last mile delivery projects during COVID-19 era. Oper. Manag. Res. 2021, 13, 1–14. [Google Scholar] [CrossRef]
- van Duin, J.R.; Wiegmans, B.W.; van Arem, B.; van Amstel, Y. From home delivery to parcel lockers: A case study in Amsterdam. Transp. Res. Procedia 2020, 46, 37–44. [Google Scholar] [CrossRef]
- Lemardelé, C.; Estrada, M.; Pagès, L.; Bachofner, M. Potentialities of drones and ground autonomous delivery devices for last-mile logistics. Transp. Res. Part E Logist. Transp. Rev. 2021, 149, 102325. [Google Scholar] [CrossRef]
- Aljohani, K.; Thompson, R.G. Last mile delivery activities in the city centre–Insights into current practices and characteristics of delivery trips. Transp. Res. Procedia 2020, 46, 261–268. [Google Scholar] [CrossRef]
- Schmidt, M.; Zmuda-Trzebiatowski, P.; Kiciński, M.; Sawicki, P.; Lasak, K. Multiple-Criteria-Based Electric Vehicle Charging Infrastructure Design Problem. Energies 2021, 14, 3214. [Google Scholar] [CrossRef]
- Archetti, C.; Guerriero, F.; Macrina, G. The online vehicle routing problem with occasional drivers. Comput. Oper. Res. 2021, 127, 105144. [Google Scholar] [CrossRef]
- Mangiaracina, R.; Perego, A.; Seghezzi, A.; Tumino, A. Innovative solutions to increase last-mile delivery efficiency in B2C e-commerce: A literature review. Int. J. Phys. Distrib. Logist. Manag. 2019, 49, 901–920. [Google Scholar] [CrossRef]
- Govindan, K.; Shankar, K.M.; Kannan, D. Achieving sustainable development goals through identifying and analyzing barriers to industrial sharing economy: A framework development. Int. J. Prod. Econ. 2020, 227, 107575. [Google Scholar] [CrossRef]
- Reuter, E. Hybrid business models in the sharing economy: The role of business model design for managing the environmental paradox. Bus. Strategy Environ. 2022, 31, 603–618. [Google Scholar] [CrossRef]
- Chyung, S.Y.; Roberts, K.; Swanson, I.; Hankinson, A. Evidence-based survey design: The use of a midpoint on the Likert scale. Perform. Improv. 2017, 56, 15–23. [Google Scholar] [CrossRef]
- Valente, E.; Patrus, R.; Guimarães, R.C. Sharing economy: Becoming an Uber driver in a developing country. Rev. De Gestão 2019, 26, 143–160. [Google Scholar] [CrossRef]
- Sadiq, M.; Moslehpour, M.; Qiu, R.; Hieu, V.M.; Duong, K.D.; Ngo, T.Q. Sharing economy benefits and sustainable development goals: Empirical evidence from the transportation industry of Vietnam. J. Innov. Knowl. 2023, 8, 100290. [Google Scholar] [CrossRef]
- Carissimi, M.C.; Creazza, A. The role of the enabler in sharing economy service triads: A logistics perspective. Clean. Logist. Supply Chain 2022, 5, 100077. [Google Scholar] [CrossRef]
- Alharbi, A.; Cantarelli, C.; Brint, A. Crowd models for last mile delivery in an emerging economy. Sustainability 2022, 14, 1401. [Google Scholar] [CrossRef]
- Li, C.-Y.; Tsai, M.-C. What makes guests trust Airbnb? Consumer trust formation and its impact on continuance intention in the sharing economy. J. Hosp. Tour. Manag. 2022, 50, 44–54. [Google Scholar] [CrossRef]
- Tong, B.; Gunter, U. Hedonic pricing and the sharing economy: How profile characteristics affect Airbnb accommodation prices in Barcelona, Madrid, and Seville. Curr. Issues Tour. 2022, 25, 3309–3328. [Google Scholar] [CrossRef]
- Rojanakit, P.; de Oliveira, R.T.; Dulleck, U. The sharing economy: A critical review and research agenda. J. Bus. Res. 2022, 139, 1317–1334. [Google Scholar] [CrossRef]
- Jin, H.; Li, H.; Zhao, T.; Pang, Y. Role of the sharing economy in the achievement of energy efficiency and sustainable economic development: Evidence from China. J. Innov. Knowl. 2023, 8, 100296. [Google Scholar] [CrossRef]
- Tu, Y.-T.; Aljumah, A.I.; Van Nguyen, S.; Cheng, C.-F.; Tai, T.D.; Qiu, R. Achieving sustainable development goals through a sharing economy: Empirical evidence from developing economies. J. Innov. Knowl. 2023, 8, 100299. [Google Scholar] [CrossRef]
- Davis, F.D. Perceived usefulness, perceived ease of use, and user acceptance of information technology. MIS Q. 1989, 13, 319–340. [Google Scholar] [CrossRef]
- Ajzen, I. From Intentions to Actions: A Theory of Planned Behavior; Springer: Berlin/Heidelberg, Germany, 1985. [Google Scholar]
- Fishbein, M.; Ajzen, I. Belief, Attitude, Intention, and Behavior: An Introduction to Theory and Research; Addison-Wesley: Boston, MA, USA, 1977. [Google Scholar]
- Holden, R.J.; Karsh, B.-T. The technology acceptance model: Its past and its future in health care. J. Biomed. Inform. 2010, 43, 159–172. [Google Scholar] [CrossRef]
- Chau, P.Y. An empirical assessment of a modified technology acceptance model. J. Manag. Inf. Syst. 1996, 13, 185–204. [Google Scholar] [CrossRef]
- Thompson, R.L.; Higgins, C.A.; Howell, J.M. Personal computing: Toward a conceptual model of utilization. MIS Q. 1991, 15, 125–143. [Google Scholar] [CrossRef]
- Moore, G.C.; Benbasat, I. Development of an instrument to measure the perceptions of adopting an information technology innovation. Inf. Syst. Res. 1991, 2, 192–222. [Google Scholar] [CrossRef]
- Tornatzky, L.G.; Fleischer, M.; Chakrabarti, A.K. Processes of Technological Innovation; Lexington Books: Blue Ridge Summit, PE, USA, 1990. [Google Scholar]
- Saurabh, S.; Dey, K. Blockchain technology adoption, architecture, and sustainable agri-food supply chains. J. Clean. Prod. 2021, 284, 124731. [Google Scholar] [CrossRef]
- Galkin, A.; Obolentseva, L.; Balandina, I.; Kush, E.; Karpenko, V.; Bajdor, P. Last-mile delivery for consumer driven logistics. Transp. Res. Procedia 2019, 39, 74–83. [Google Scholar] [CrossRef]
- Li, Q.; Wang, Y.; Li, K.; Chen, L.; Wei, Z. Evolutionary dynamics of the last mile travel choice. Phys. A Stat. Mech. Appl. 2019, 536, 122555. [Google Scholar] [CrossRef]
- Bergmann, F.M.; Wagner, S.M.; Winkenbach, M. Integrating first-mile pickup and last-mile delivery on shared vehicle routes for efficient urban e-commerce distribution. Transp. Res. Part B Methodol. 2020, 131, 26–62. [Google Scholar]
- He, Y.; Qi, M.; Zhou, F.; Su, J. An effective metaheuristic for the last mile delivery with roaming delivery locations and stochastic travel times. Comput. Ind. Eng. 2020, 145, 106513. [Google Scholar] [CrossRef]
- Vakulenko, Y.; Shams, P.; Hellström, D.; Hjort, K. Service innovation in e-commerce last mile delivery: Mapping the e-customer journey. J. Bus. Res. 2019, 101, 461–468. [Google Scholar] [CrossRef]
- Yang, F.; Dai, Y.; Ma, Z.-J. A cooperative rich vehicle routing problem in the last-mile logistics industry in rural areas. Transp. Res. Part E Logist. Transp. Rev. 2020, 141, 102024. [Google Scholar] [CrossRef]
- Chen, Y.; Wang, H. Pricing for a last-mile transportation system. Transp. Res. Part B Methodol. 2018, 107, 57–69. [Google Scholar] [CrossRef]
- Bjerkan, K.Y.; Bjørgen, A.; Hjelkrem, O.A. E-commerce and prevalence of last mile practices. Transp. Res. Procedia 2020, 46, 293–300. [Google Scholar] [CrossRef]
- Fancello, G.; Paddeu, D.; Fadda, P. Investigating last food mile deliveries: A case study approach to identify needs of food delivery demand. Res. Transp. Econ. 2017, 65, 56–66. [Google Scholar] [CrossRef]
- Pålsson, H.; Pettersson, F.; Hiselius, L.W. Energy consumption in e-commerce versus conventional trade channels-Insights into packaging, the last mile, unsold products and product returns. J. Clean. Prod. 2017, 164, 765–778. [Google Scholar] [CrossRef]
- Janjevic, M.; Winkenbach, M. Characterizing urban last-mile distribution strategies in mature and emerging e-commerce markets. Transp. Res. Part A Policy Pract. 2020, 133, 164–196. [Google Scholar] [CrossRef]
- Liu, C.; Wang, Q.; Susilo, Y.O. Assessing the impacts of collection-delivery points to individual’s activity-travel patterns: A greener last mile alternative? Transp. Res. Part E Logist. Transp. Rev. 2019, 121, 84–99. [Google Scholar] [CrossRef]
- McLeod, F.; Cherrett, T.; Bektas, T.; Allen, J.; Martinez-Sykora, A.; Lamas-Fernandez, C.; Bates, O.; Cheliotis, K.; Friday, A.; Piecyk, M. Quantifying environmental and financial benefits of using porters and cycle couriers for last-mile parcel delivery. Transp. Res. Part D Transp. Environ. 2020, 82, 102311. [Google Scholar] [CrossRef]
- Guo, X.; Jaramillo, Y.J.L.; Bloemhof-Ruwaard, J.; Claassen, G. On integrating crowdsourced delivery in last-mile logistics: A simulation study to quantify its feasibility. J. Clean. Prod. 2019, 241, 118365. [Google Scholar] [CrossRef]
- Sadhya, V.; Sadhya, H. Barriers to Adoption of Blockchain Technology (2018); Louisiana State University: Baton Rouge, LA, USA, 2019. [Google Scholar]
- Baldi, M.M.; Manerba, D.; Perboli, G.; Tadei, R. A generalized bin packing problem for parcel delivery in last-mile logistics. Eur. J. Oper. Res. 2019, 274, 990–999. [Google Scholar] [CrossRef]
- Rai, H.B.; Verlinde, S.; Macharis, C. Who is interested in a crowdsourced last mile? A segmentation of attitudinal profiles. Travel Behav. Soc. 2021, 22, 22–31. [Google Scholar]
- Kin, B.; Spoor, J.; Verlinde, S.; Macharis, C.; Van Woensel, T. Modelling alternative distribution set-ups for fragmented last mile transport: Towards more efficient and sustainable urban freight transport. Case Stud. Transp. Policy 2018, 6, 125–132. [Google Scholar] [CrossRef]
- Aljohani, K.; Thompson, R.G. The impacts of relocating a logistics facility on last food miles–The case of Melbourne’s fruit & vegetable wholesale market. Case Stud. Transp. Policy 2018, 6, 279–288. [Google Scholar]
- Alnaggar, A.; Gzara, F.; Bookbinder, J.H. Crowdsourced delivery: A review of platforms and academic literature. Omega 2021, 98, 102139. [Google Scholar] [CrossRef]
- de Kervenoael, R.; Schwob, A.; Chandra, C. E-retailers and the engagement of delivery workers in urban last-mile delivery for sustainable logistics value creation: Leveraging legitimate concerns under time-based marketing promise. J. Retail. Consum. Serv. 2020, 54, 102016. [Google Scholar] [CrossRef]
- Gruchmann, T.; Elgazzar, S.; Ali, A.H. Blockchain technology in pharmaceutical supply chains: A transaction cost perspective. Mod. Supply Chain Res. Appl. 2023. [Google Scholar] [CrossRef]
- CAPMAS. Available online: https://capmas.gov.eg/Pages/populationClock.aspx# (accessed on 15 September 2022).
- Dhulipala, S.; Kedia, A.; Katti, B. Multi-route choice modelling in a metropolitan context: A comparative analysis using multinomial logit and fuzzy logic based approaches. Eur. Transp. -Trasp. Eur. 2020, 79. [Google Scholar] [CrossRef]
- Okasha, A.S.; Mekkawy, A.A.E. Participatory eco-landscape design: The case of NRIAG eco-park in Helwan, Egypt. J. Eng. Appl. Sci. 2021, 68, 12. [Google Scholar] [CrossRef]
- Fraselle, J.; Limbourg, S.L.; Vidal, L. Cost and Environmental Impacts of a Mixed Fleet of Vehicles. Sustainability 2021, 13, 9413. [Google Scholar] [CrossRef]
- dos Santos, C.H.; Gabriel, G.T.; do Amaral, J.V.S.; Montevechi, J.A.B.; de Queiroz, J.A. Decision-making in a fast fashion company in the Industry 4.0 era: A Digital Twin proposal to support operational planning. Int. J. Adv. Manuf. Technol. 2021, 116, 1653–1666. [Google Scholar] [CrossRef]
- Parker, C.; Scott, S.; Geddes, A. Snowball sampling. SAGE Res. Methods Found. 2019. [Google Scholar] [CrossRef]
- Boysen, N.; Fedtke, S.; Schwerdfeger, S. Last-mile delivery concepts: A survey from an operational research perspective. Or Spectr. 2021, 43, 1–58. [Google Scholar] [CrossRef]
- Yuen, K.F.; Wong, Y.D.; Ma, F.; Wang, X. The determinants of public acceptance of autonomous vehicles: An innovation diffusion perspective. J. Clean. Prod. 2020, 270, 121904. [Google Scholar] [CrossRef]
- Tewathia, N.; Kamath, A.; Ilavarasan, P.V. Social inequalities, fundamental inequities, and recurring of the digital divide: Insights from India. Technol. Soc. 2020, 61, 101251. [Google Scholar] [CrossRef]
- Yıldız, B. Express package routing problem with occasional couriers. Transp. Res. Part C Emerg. Technol. 2021, 123, 102994. [Google Scholar] [CrossRef]
- Nicolaou, A.I.; Masoner, M.M. Sample size requirements in structural equation models under standard conditions. Int. J. Account. Inf. Syst. 2013, 14, 256–274. [Google Scholar] [CrossRef]
- Kline, R.B. Principles and Practice of Structural Equation Modeling; Guilford Publications: New York, NY, USA, 2015. [Google Scholar]
- Hair, J.F. Essentials of Business Research Methods, 2nd ed.; Routledge: London, UK, 2015. [Google Scholar]
- Dawes, J. Do data characteristics change according to the number of scale points used? An experiment using 5-point, 7-point and 10-point scales. Int. J. Mark. Res. 2008, 50, 61–104. [Google Scholar] [CrossRef]
- Choi, D.; Chung, C.Y.; Seyha, T.; Young, J. Factors affecting organizations’ resistance to the adoption of blockchain technology in supply networks. Sustainability 2020, 12, 8882. [Google Scholar] [CrossRef]
- Saberi, S.; Kouhizadeh, M.; Sarkis, J.; Shen, L. Blockchain technology and its relationships to sustainable supply chain management. Int. J. Prod. Res. 2019, 57, 2117–2135. [Google Scholar] [CrossRef]
- Rai, A.; Brown, P.; Tang, X. Organizational assimilation of electronic procurement innovations. J. Manag. Inf. Syst. 2009, 26, 257–296. [Google Scholar] [CrossRef]
- Öztürk, C.; Yildizbaşi, A. Barriers to implementation of blockchain into supply chain management using an integrated multi-criteria decision-making method: A numerical example. Soft Comput. 2020, 24, 14771–14789. [Google Scholar] [CrossRef]
- Brown, S.A.; Dennis, A.R.; Venkatesh, V. Predicting collaboration technology use: Integrating technology adoption and collaboration research. J. Manag. Inf. Syst. 2010, 27, 9–54. [Google Scholar] [CrossRef]
- Maruping, L.M.; Bala, H.; Venkatesh, V.; Brown, S.A. Going beyond intention: Integrating behavioral expectation into the unified theory of acceptance and use of technology. J. Assoc. Inf. Sci. Technol. 2017, 68, 623–637. [Google Scholar] [CrossRef]
- Fawcett, S.E.; Wallin, C.; Allred, C.; Magnan, G. Supply chain information-sharing: Benchmarking a proven path. Benchmarking Int. J. 2009, 16, 222–246. [Google Scholar] [CrossRef]
- Davis, F.D. A Technology Acceptance Model for Empirically Testing New End-User Information Systems: Theory and Results. Ph.D. Thesis, Massachusetts Institute of Technology, Cambridge, MA, USA, 1985. [Google Scholar]
- Leimeister, J.M.; Knebel, U.; Krcmar, H. RFID as enabler for the boundless real-time organisation: Empirical insights from Germany. Int. J. Netw. Virtual Organ. 2007, 4, 45–64. [Google Scholar] [CrossRef]
- Koh, C.E.; Kim, H.J.; Kim, E.Y. The impact of RFID in retail industry: Issues and critical success factors. J. Shopp. Cent. Res. 2006, 13, 101–117. [Google Scholar]
- Kearns, G.S.; Sabherwal, R. Strategic alignment between business and information technology: A knowledge-based view of behaviors, outcome, and consequences. J. Manag. Inf. Syst. 2006, 23, 129–162. [Google Scholar] [CrossRef]
- Shi, P.; Yan, B. Factors affecting RFID adoption in the agricultural product distribution industry: Empirical evidence from China. SpringerPlus 2016, 5, 1–11. [Google Scholar] [CrossRef]
- Pavlou, P.A.; Liang, H.; Xue, Y. Understanding and mitigating uncertainty in online exchange relationships: A principal-agent perspective. MIS Q. 2007, 31, 105–136. [Google Scholar] [CrossRef]
- Teo, H.-H.; Wei, K.K.; Benbasat, I. Predicting intention to adopt interorganizational linkages: An institutional perspective. MIS Q. 2003, 27, 19–49. [Google Scholar] [CrossRef]
- Zheng, Z.; Xie, S.; Dai, H.-N.; Chen, X.; Wang, H. Blockchain challenges and opportunities: A survey. Int. J. Web Grid Serv. 2018, 14, 352–375. [Google Scholar] [CrossRef]
- Kleijnen, M.; Lee, N.; Wetzels, M. An exploration of consumer resistance to innovation and its antecedents. J. Econ. Psychol. 2009, 30, 344–357. [Google Scholar] [CrossRef]
- Szmigin, I.; Foxall, G. Three forms of innovation resistance: The case of retail payment methods. Technovation 1998, 18, 459–468. [Google Scholar] [CrossRef]
- Fisher, M.J.; Marshall, A.P. Understanding descriptive statistics. Aust. Crit. Care 2009, 22, 93–97. [Google Scholar] [CrossRef]
- Broder, H.L.; McGrath, C.; Cisneros, G.J. Questionnaire development: Face validity and item impact testing of the Child Oral Health Impact Profile. Community Dent. Oral Epidemiol. 2007, 35, 8–19. [Google Scholar] [CrossRef] [PubMed]
- Hardesty, D.M.; Bearden, W.O. The use of expert judges in scale development: Implications for improving face validity of measures of unobservable constructs. J. Bus. Res. 2004, 57, 98–107. [Google Scholar] [CrossRef]
- Douglas, S.P.; Craig, C.S. Collaborative and iterative translation: An alternative approach to back translation. J. Int. Mark. 2007, 15, 30–43. [Google Scholar] [CrossRef]
- Hair, J.F., Jr.; Sarstedt, M.; Ringle, C.M.; Gudergan, S.P. Advanced Issues in Partial Least Squares Structural Equation Modeling; Sage Publications: Thousand Oaks, CA, USA, 2017. [Google Scholar]
- Chin, W.W.; Thatcher, J.B.; Wright, R.T. Assessing common method bias: Problems with the ULMC technique. MIS Q. 2012, 36, 1003–1019. [Google Scholar] [CrossRef]
- Zhang, M.; Merchant, H. A causal analysis of the role of institutions and organizational proficiencies on the innovation capability of Chinese SMEs. Int. Bus. Rev. 2020, 29, 101638. [Google Scholar] [CrossRef]
- Sheikh, K.; Mattingly, S. Investigating non-response bias in mail surveys. J. Epidemiol. Community Health 1981, 35, 293–296. [Google Scholar] [CrossRef]
- Barclay, S.; Todd, C.; Finlay, I.; Grande, G.; Wyatt, P. Not another questionnaire! Maximizing the response rate, predicting non-response and assessing non-response bias in postal questionnaire studies of GPs. Fam. Pract. 2002, 19, 105–111. [Google Scholar] [CrossRef]
- Hair, J.F., Jr.; Sarstedt, M.; Hopkins, L.; Kuppelwieser, V.G. Partial least squares structural equation modeling (PLS-SEM): An emerging tool in business research. Eur. Bus. Rev. 2014, 26, 106–121. [Google Scholar] [CrossRef]
- Hair, J.F., Jr.; Howard, M.C.; Nitzl, C. Assessing measurement model quality in PLS-SEM using confirmatory composite analysis. J. Bus. Res. 2020, 109, 101–110. [Google Scholar] [CrossRef]
- Hair, J.; Hollingsworth Carole, L.; Randolph Adriane, B.; Chong Alain Yee, L. An updated and expanded assessment of PLS-SEM in information systems research. Ind. Manag. Data Syst. 2017, 117, 442–458. [Google Scholar] [CrossRef]
- Deutsch, Y.; Golany, B. A parcel locker network as a solution to the logistics last mile problem. Int. J. Prod. Res. 2018, 56, 251–261. [Google Scholar] [CrossRef]
- El Moussaoui, A.E.; Benbba, B.; Jaegler, A.; El Andaloussi, Z.; El Amrani, L. Last Mile Logistics: Challenges & Improvement Ways. In Proceedings of the 2022 14th International Colloquium of Logistics and Supply Chain Management (LOGISTIQUA), Fez, Morocco, 25–27 May 2022; pp. 1–7. [Google Scholar]
- Park, H.; Park, D.; Jeong, I.-J. An effects analysis of logistics collaboration in last-mile networks for CEP delivery services. Transp. Policy 2016, 50, 115–125. [Google Scholar] [CrossRef]
- Gebrezgabiher, G.; Mekonnen, Z.; Yewhalaw, D.; Hailu, A. Reaching the last mile: Main challenges relating to and recommendations to accelerate onchocerciasis elimination in Africa. Infect. Dis. Poverty 2019, 8, 1–20. [Google Scholar] [CrossRef]
- Mobarak, A.M.; Meriggi, N.; Voors, M.; Levine, M.; Ramakrishna, V.; Kangbai, D.M.; Rozelle, M.; Tyler, E.; Cundy, S. Solving Last-Mile Delivery Challenges is Critical to Increase COVID-19 Vaccine Uptake: A Cluster Randomized Controlled Trial. Res. Sq. 2022. [Google Scholar] [CrossRef]
- Heyns, G.J.; Kilbourn, P.J. Online shopping behaviour and service quality perceptions of young people in South Africa: A COVID-19 perspective. J. Transp. Supply Chain Manag. 2022, 16, 777. [Google Scholar] [CrossRef]
- Sindakis, S.; Aggarwal, S. The Entrepreneurial Rise and Technological Innovation in the Middle East and North Africa. In Entrepreneurial Rise in the Middle East and North Africa: The Influence of Quadruple Helix on Technological Innovation; Emerald Publishing Limited: Bingley, UK, 2022. [Google Scholar]
- Koshta, N.; Devi, Y.; Chauhan, C. Evaluating Barriers to the Adoption of Delivery Drones in Rural Healthcare Supply Chains: Preparing the Healthcare System for the Future. IEEE Trans. Eng. Manag. 2022, 228, 1–13. [Google Scholar] [CrossRef]
- Nagendra, N.P. Satellite Big Data Analytics for Decision Intelligence-A Multi-Case Study Approach; Friedrich-Alexander-Universität Erlangen-Nürnberg (FAU): Erlangen, Germany, 2022. [Google Scholar]
- Ranieri, L.; Digiesi, S.; Silvestri, B.; Roccotelli, M. A review of last mile logistics innovations in an externalities cost reduction vision. Sustainability 2018, 10, 782. [Google Scholar] [CrossRef]
- Yiu, C.S.; Grant, K.; Edgar, D. Factors affecting the adoption of Internet Banking in Hong Kong—Implications for the banking sector. Int. J. Inf. Manag. 2007, 27, 336–351. [Google Scholar] [CrossRef]
- Laukkanen, T.; Sinkkonen, S.; Kivijärvi, M.; Laukkanen, P. Innovation resistance among mature consumers. J. Consum. Mark. 2007, 24, 419–427. [Google Scholar] [CrossRef]
- Li, X.; Gong, L.; Liu, X.; Jiang, F.; Shi, W.; Fan, L.; Gao, H.; Li, R.; Xu, J. Solving the last mile problem in logistics: A mobile edge computing and blockchain-based unmanned aerial vehicle delivery system. Concurr. Comput. Pract. Exp. 2022, 34, e6068. [Google Scholar] [CrossRef]
- Plazier, P.; Rauws, W.; Buijs, P.; Neef, R. Towards Sustainable Last-Mile Logistics? Investigating the Role of Cooperation, Regulation, and Innovation in Scenarios for 2035. Available online: https://ssrn.com/abstract=4201088 (accessed on 25 June 2023).
- Arias-Oliva, M.; Pelegrín-Borondo, J.; Matías-Clavero, G. Variables influencing cryptocurrency use: A technology acceptance model in Spain. Front. Psychol. 2019, 10, 475. [Google Scholar] [CrossRef] [PubMed]
- Tan, W.K.A.; Sundarakani, B. Assessing Blockchain Technology application for freight booking business: A case study from Technology Acceptance Model perspective. J. Glob. Oper. Strateg. Sourc. 2021, 14, 202–223. [Google Scholar] [CrossRef]
- Agustina, R.; Suprianto, D.; Ariyanto, R. Technology Acceptance Model Analysis of User Behavioral Intentions on IoT Smart Board Devices. In Proceedings of the 2021 1st Conference on Online Teaching for Mobile Education (OT4ME), Alcalá de Henares, Spain, 22–25 November 2021; pp. 89–92. [Google Scholar] [CrossRef]
- Pazvant, E.; Emel, F. Evaluation of the intention of using products with internet of things within the context of technology acceptance model. J. Manag. Mark. Logist. 2018, 5, 41–54. [Google Scholar] [CrossRef]
- Liu, D.; Li, Q.; Han, S. Using extended technology acceptance model to assess the adopt intention of a proposed IoT-based health management tool. Sensors 2022, 22, 6092. [Google Scholar] [CrossRef]
- Verma, S.; Bhattacharyya, S.S.; Kumar, S. An extension of the technology acceptance model in the big data analytics system implementation environment. Inf. Process. Manag. 2018, 54, 791–806. [Google Scholar] [CrossRef]
- Soon, K.W.K.; Lee, C.A.; Boursier, P. A study of the determinants affecting adoption of big data using integrated Technology Acceptance Model (TAM) and diffusion of innovation (DOI) in Malaysia. Int. J. Appl. Bus. Econ. Res. 2016, 14, 17–47. [Google Scholar]
- Marrucci, L.; Daddi, T.; Iraldo, F. The circular economy, environmental performance and environmental management systems: The role of absorptive capacity. J. Knowl. Manag. 2022, 26, 2107–2132. [Google Scholar] [CrossRef]


| Frequency | Percent | ||
|---|---|---|---|
| Gender | Male | 623 | 58.8 |
| Female | 437 | 41.2 | |
| Age | Younger | 218 | 20.6 |
| Elder | 842 | 79.4 | |
| Geographical Location | Agamy_surround | 778 | 73.4 |
| Montaza_suround | 282 | 26.6 | |
| Staying at Area | less than 1 year | 40 | 3.8 |
| 1–3 years | 98 | 9.2 | |
| 6–8 years | 315 | 29.7 | |
| more than 8 years | 607 | 57.3 | |
| Educational Level | Postgrad | 464 | 43.8 |
| Undergrad | 596 | 56.2 |
| Mean | Median | Mode | Std. Deviation | |
|---|---|---|---|---|
| RGA | 2.267 | 2.0000 | 1.25 | 1.24300 |
| RRL | 2.7493 | 2.2500 | 1.25 | 1.65130 |
| CTI | 5.5349 | 6.0000 | 6.33 | 1.42719 |
| CEU | 2.8733 | 2.2500 | 1.00 | 1.63644 |
| TKE | 5.663 | 6.0000 | 6.50 | 1.31797 |
| TKA | 2.6174 | 2.0000 | 1.20 | 1.60580 |
| CI | 2.4711 | 2.0000 | 1.33 | 1.54011 |
| SC | 5.1061 | 6.2500 | 6.25 | 1.93885 |
| C | 2.5012 | 1.7500 | 1.50 | 1.68513 |
| S | 2.8352 | 1.6667 | 1.33 | 1.91288 |
| LM | 6.041 | 6.5000 | 6.50 | 1.28222 |
| Latent Variable/Construct | Items | Factor Loading | Composite Reliability | Composite Reliability after Items Were Deleted | AVE | AVE after Items Were Deleted | |
|---|---|---|---|---|---|---|---|
| Environmental Barriers | Restrictions on government assistance in last-mile delivery applications | RGA1 | 0.893 | 0.934 | - | 0.83 | - |
| RGA2 | 0.929 | ||||||
| RGA3 | 0.948 | ||||||
| RGA4 | 0.889 | ||||||
| Restrictions on regulations and legal frameworks related to last-mile | RRL1 | 0.931 | 0.923 | - | 0.81 | - | |
| RRL2 | 0.944 | ||||||
| RRL3 | 0.943 | ||||||
| RRL4 | 0.780 | ||||||
| Constraints of technological infrastructure | CTI1 | 0.924 | 0.872 | - | 0.79 | - | |
| CTI2 | 0.834 | ||||||
| CTI3 | 0.918 | ||||||
| Societal Barriers | Collaboration efforts between users and application developers to allow last-mile adoption | CEU1 | 0.844 | 0.76 | 0.86 | 0.61 | 0.77 |
| CEU2 | 0.903 | ||||||
| CEU3 | 0.876 | ||||||
| CEU4 | 0.404 (Deleted) | ||||||
| Technical knowledge and expertise impact on potentially involved users | TKE1 | 0.854 | 0.88 | - | 0.74 | - | |
| TKE2 | 0.923 | ||||||
| TKE3 | 0.893 | ||||||
| TKE4 | 0.783 | ||||||
| Technological knowledge and awareness in application users | TKA1 | 0.868 | 0.90 | - | 0.73 | - | |
| TKA2 | 0.872 | ||||||
| TKA3 | 0.859 | ||||||
| TKA4 | 0.881 | ||||||
| TKA5 | 0.796 | ||||||
| Technological Barriers | Cost of implementation | CI1 | 0.844 | 0.80 | - | 0.71 | - |
| CI2 | 0.834 | ||||||
| CI3 | 0.861 | ||||||
| Security concerns | SC1 | 0.862 | 0.88 | - | 0.74 | - | |
| SC2 | 0.874 | ||||||
| SC3 | 0.928 | ||||||
| SC4 | 0.785 | ||||||
| Complexity | C1 | 0.918 | 0.91 | - | 0.80 | - | |
| C2 | 0.898 | ||||||
| C3 | 0.833 | ||||||
| C4 | 0.940 | ||||||
| Scalability | S1 | 0.895 | 0.88 | - | 0.81 | - | |
| S2 | 0.943 | ||||||
| S3 | 0.865 | ||||||
| Last-Mile | LM1 | 0.773 | 0.80 | 0.85 | 0.57 | 0.69 | |
| LM2 | 0.816 | ||||||
| LM3 | 0.341 (Deleted) | ||||||
| LM4 | 0.855 | ||||||
| LM5 | 0.865 |
| Latent Variable/Construct | Items | Factor Loading | Composite Reliability | AVE | |
|---|---|---|---|---|---|
| Environmental Barriers | Restrictions on government assistance in last-mile delivery applications | RGA1 | 0.944 | 0.93 | 0.845 |
| RGA2 | 0.907 | ||||
| RGA3 | 0.966 | ||||
| RGA4 | 0.855 | ||||
| Restrictions on regulations and legal frameworks related to last-mile | RRL1 | 0.939 | 0.94 | 0.849 | |
| RRL2 | 0.923 | ||||
| RRL3 | 0.941 | ||||
| RRL4 | 0.882 | ||||
| Constraints of technological infrastructure | CTI1 | 0.953 | 0.91 | 0.853 | |
| CTI2 | 0.886 | ||||
| CTI3 | 0.931 | ||||
| Societal Barriers | Collaboration efforts between users and application developers to allow last-mile adoption | CEU1 | 0.943 | 0.94 | 0.887 |
| CEU2 | 0.935 | ||||
| CEU3 | 0.948 | ||||
| Technical knowledge and expertise impact on potentially involved users | TKE1 | 0.908 | 0.90 | 0.767 | |
| TKE2 | 0.906 | ||||
| TKE3 | 0.913 | ||||
| TKE4 | 0.768 | ||||
| Technological knowledge and awareness in application users | TKA1 | 0.947 | 0.95 | 0.836 | |
| TKA2 | 0.942 | ||||
| TKA3 | 0.908 | ||||
| TKA4 | 0.938 | ||||
| TKA5 | 0.833 | ||||
| Technological Barriers | Cost of implementation | CI1 | 0.943 | 0.87 | 0.799 |
| CI2 | 0.942 | ||||
| CI3 | 0.787 | ||||
| Security concerns | SC1 | 0.953 | 0.93 | 0.841 | |
| SC2 | 0.916 | ||||
| SC3 | 0.944 | ||||
| SC4 | 0.854 | ||||
| Complexity | C1 | 0.967 | 0.92 | 0.828 | |
| C2 | 0.965 | ||||
| C3 | 0.954 | ||||
| C4 | 0.731 | ||||
| Scalability | S1 | 0.871 | 0.89 | 0.786 | |
| S2 | 0.866 | ||||
| S3 | 0.923 | ||||
| Last-Mile | LM1 | 0.930 | 0.93 | 0.827 | |
| LM2 | 0.942 | ||||
| LM3 | 0.955 | ||||
| LM4 | 0.804 |
| t-Value | Df | Mean Difference | Standard Error | 95% Confidence Interval | |||
|---|---|---|---|---|---|---|---|
| Lower Limit | Upper Limit | ||||||
| Environmental Barriers | RGA | −0.870 | 1058 | −0.06643 | 0.07637 | −0.21629 | 0.08342 |
| RRL | −0.358 | 1058 | −0.03631 | 0.10149 | −0.23545 | 0.16283 | |
| CTI | −0.045 | 1058 | −0.00394 | 0.08772 | −0.17606 | 0.16819 | |
| Societal Barriers | CEU | −0.164 | 1058 | −0.01647 | 0.10058 | −0.21383 | 0.18088 |
| TKE | 0.415 | 1058 | 0.03358 | 0.08100 | −0.12536 | 0.19252 | |
| TKA | 0.256 | 1058 | 0.02527 | 0.09869 | −0.16839 | 0.21893 | |
| Technological Barriers | CI | −0.299 | 1058 | −0.02828 | 0.09466 | −0.21401 | 0.15745 |
| SC | 0.510 | 1058 | 0.06081 | 0.11915 | −0.17299 | 0.29461 | |
| C | 0.205 | 1058 | 0.02120 | 0.10357 | −0.18202 | 0.22443 | |
| S | 0.235 | 1058 | 0.02763 | 0.11757 | −0.20306 | 0.25833 | |
| Last-Mile | LM | 0.311 | 1058 | 0.02455 | 0.07880 | −0.13009 | 0.17918 |
| C | CEU | CI | CTI | GL | HG | LM | RGA | RRL | S | SC | TKA | |
|---|---|---|---|---|---|---|---|---|---|---|---|---|
| CEU | 0.125 | |||||||||||
| CI | 0.369 | 0.152 | ||||||||||
| CTI | 0.285 | 0.614 | 0.355 | |||||||||
| GL | 0.110 | 0.058 | 0.068 | 0.132 | ||||||||
| HG | 0.025 | 0.018 | 0.029 | 0.028 | 0.204 | |||||||
| LM | 0.339 | 0.085 | 0.384 | 0.360 | 0.264 | 0.165 | ||||||
| RGA | 0.345 | 0.189 | 0.301 | 0.510 | 0.206 | 0.143 | 0.770 | |||||
| RRL | 0.189 | 0.325 | 0.205 | 0.784 | 0.172 | 0.076 | 0.579 | 0.710 | ||||
| S | 0.787 | 0.090 | 0.268 | 0.191 | 0.074 | 0.026 | 0.418 | 0.326 | 0.170 | |||
| SC | 0.775 | 0.057 | 0.673 | 0.187 | 0.080 | 0.019 | 0.254 | 0.235 | 0.069 | 0.591 | ||
| TKA | 0.329 | 0.316 | 0.782 | 0.298 | 0.032 | 0.022 | 0.307 | 0.260 | 0.105 | 0.195 | 0.493 | |
| TKE | 0.373 | 0.524 | 0.440 | 0.466 | 0.065 | 0.019 | 0.310 | 0.404 | 0.258 | 0.243 | 0.299 | 0.746 |
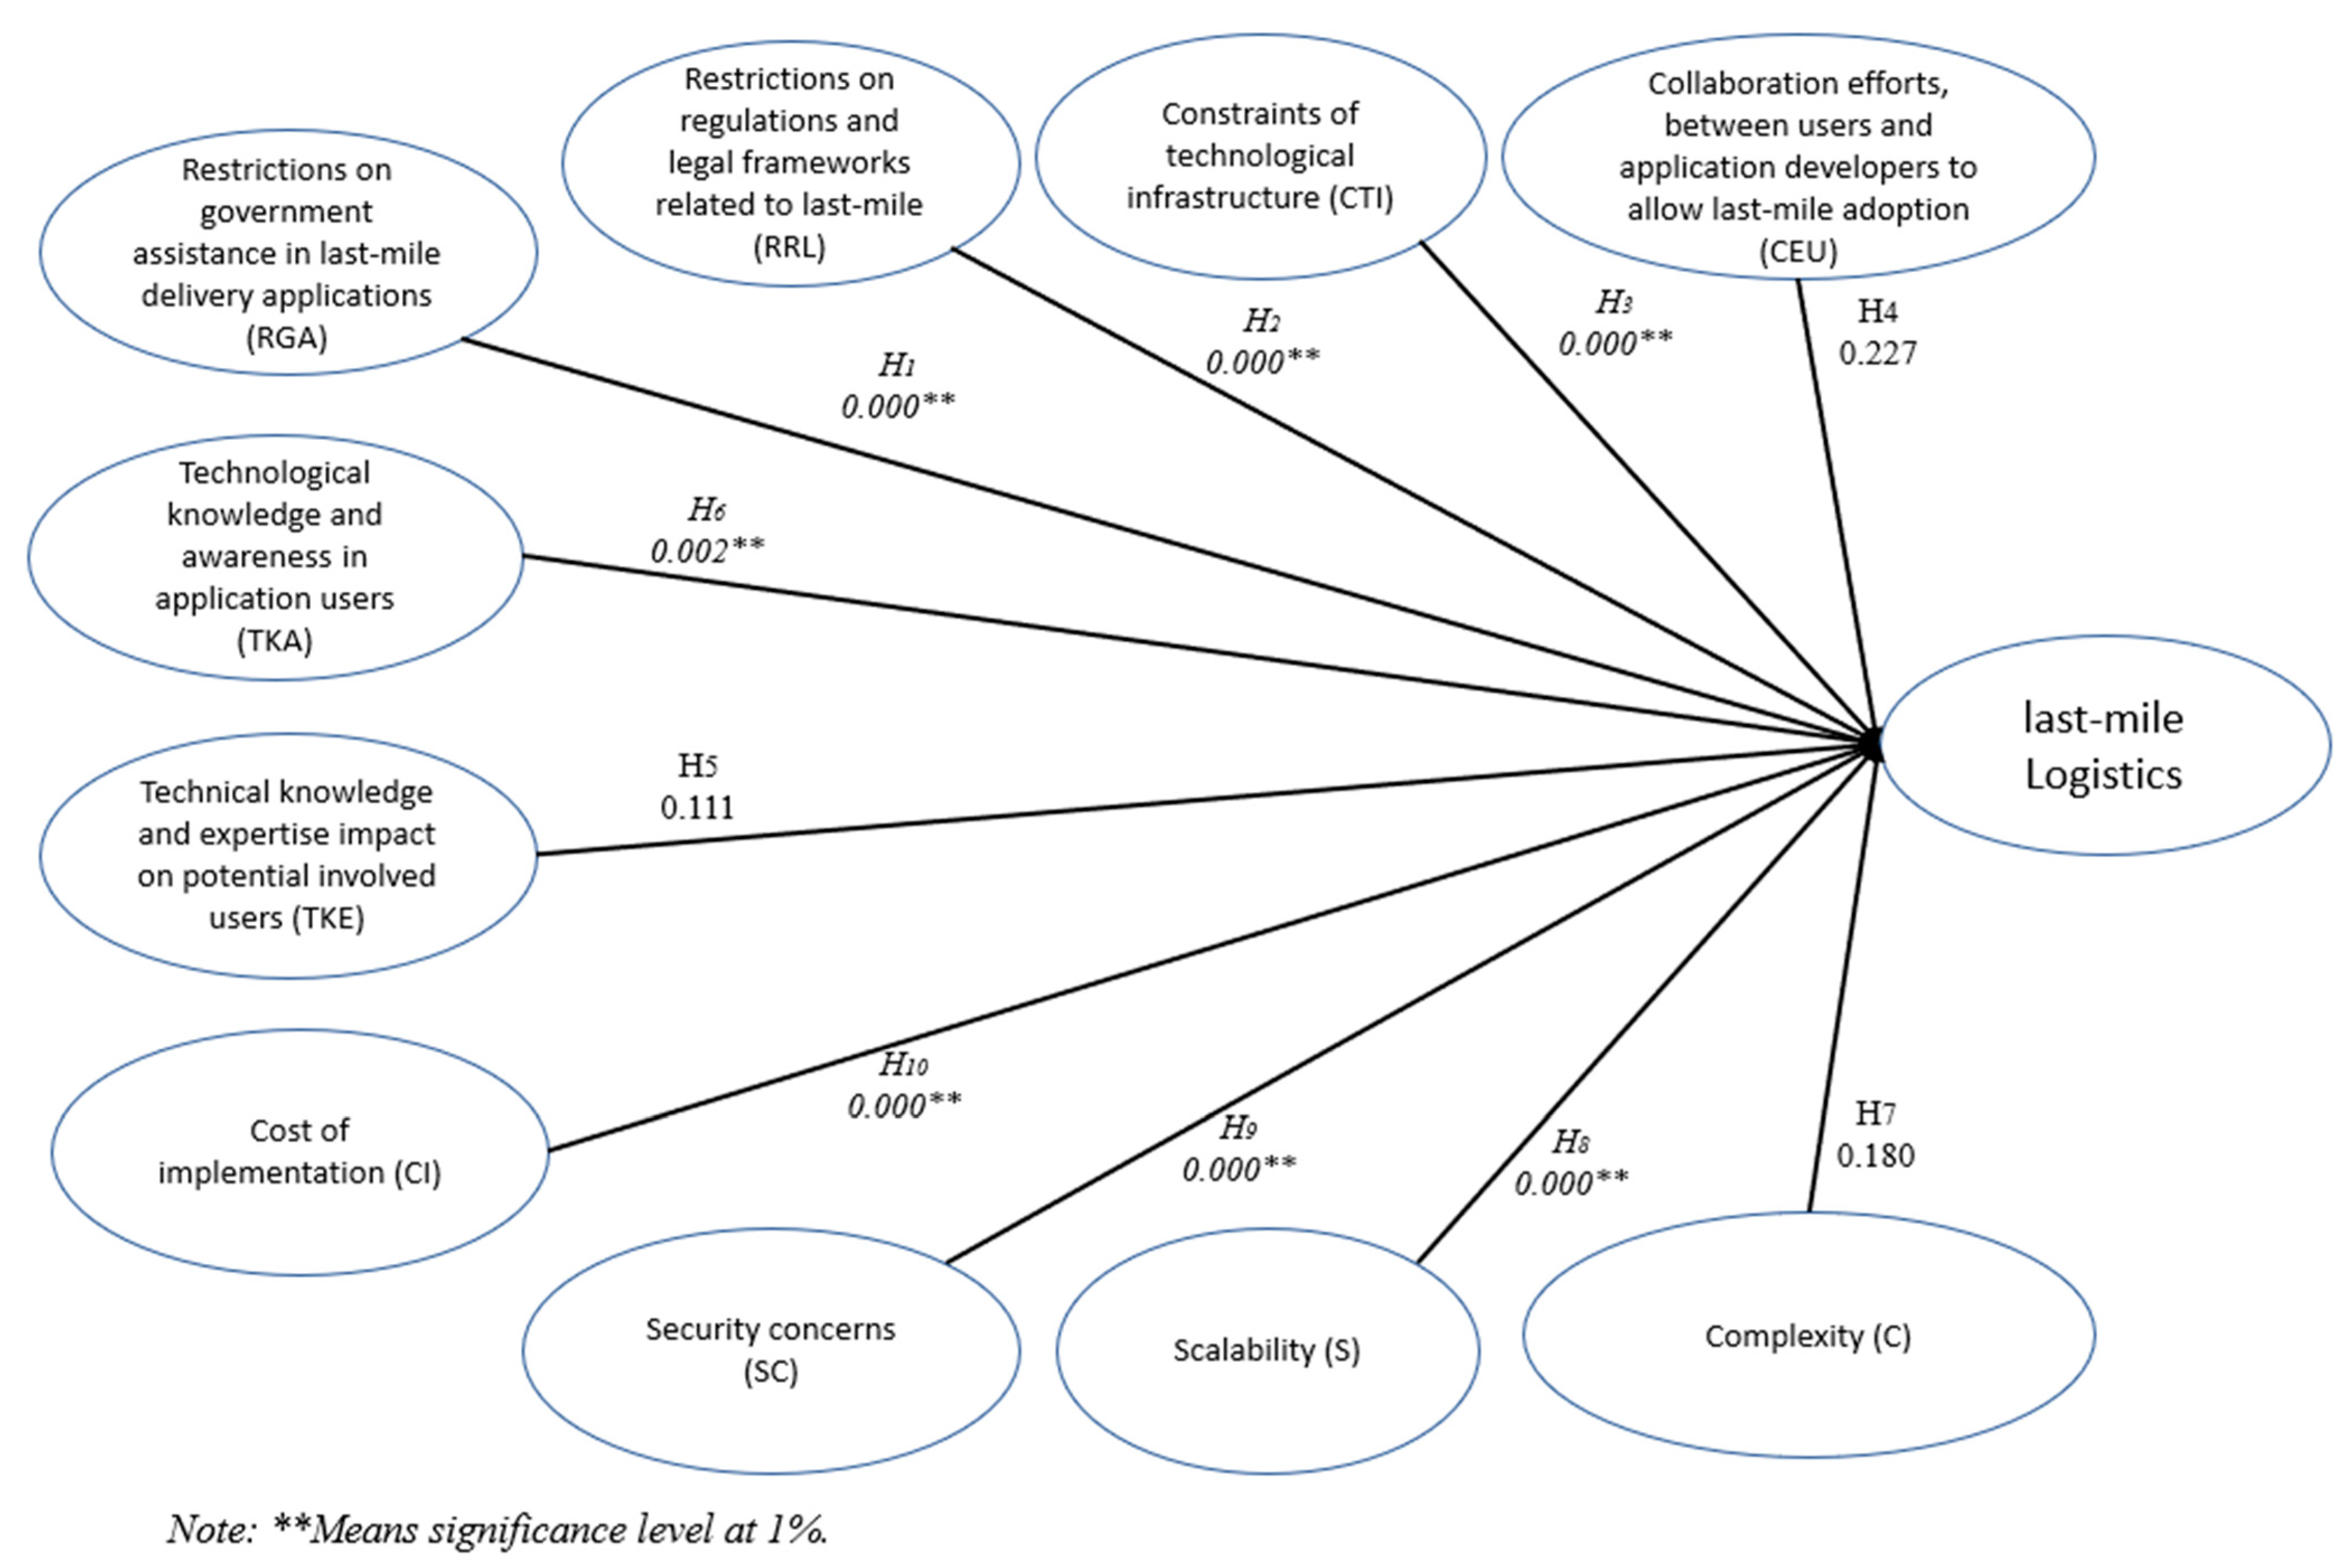
| IV | Dependent | Β | p-Value | Decision |
|---|---|---|---|---|
| C | LM | −0.031 | 0.180 | Rejected |
| CEU | LM | −0.015 | 0.227 | Rejected |
| CI | LM | −0.173 | 0.000 | Supported |
| CTI | LM | −0.214 | 0.000 | Supported |
| RGA | LM | −0.475 | 0.000 | Supported |
| RRL | LM | −0.265 | 0.000 | Supported |
| S | LM | −0.282 | 0.000 | Supported |
| SC | LM | −0.153 | 0.000 | Supported |
| TKA | LM | −0.113 | 0.002 | Supported |
| TKE | LM | −0.039 | 0.111 | Rejected |
Disclaimer/Publisher’s Note: The statements, opinions and data contained in all publications are solely those of the individual author(s) and contributor(s) and not of MDPI and/or the editor(s). MDPI and/or the editor(s) disclaim responsibility for any injury to people or property resulting from any ideas, methods, instructions or products referred to in the content. |
© 2023 by the authors. Licensee MDPI, Basel, Switzerland. This article is an open access article distributed under the terms and conditions of the Creative Commons Attribution (CC BY) license (https://creativecommons.org/licenses/by/4.0/).
Share and Cite
Sultan, M.A.; Kramberger, T.; Barakat, M.; Ali, A.H. Barriers to Applying Last-Mile Logistics in the Egyptian Market: An Extension of the Technology Acceptance Model. Sustainability 2023, 15, 12748. https://doi.org/10.3390/su151712748
Sultan MA, Kramberger T, Barakat M, Ali AH. Barriers to Applying Last-Mile Logistics in the Egyptian Market: An Extension of the Technology Acceptance Model. Sustainability. 2023; 15(17):12748. https://doi.org/10.3390/su151712748
Chicago/Turabian StyleSultan, Mohamed Amr, Tomaž Kramberger, Mahmoud Barakat, and Ahmed Hussein Ali. 2023. "Barriers to Applying Last-Mile Logistics in the Egyptian Market: An Extension of the Technology Acceptance Model" Sustainability 15, no. 17: 12748. https://doi.org/10.3390/su151712748
APA StyleSultan, M. A., Kramberger, T., Barakat, M., & Ali, A. H. (2023). Barriers to Applying Last-Mile Logistics in the Egyptian Market: An Extension of the Technology Acceptance Model. Sustainability, 15(17), 12748. https://doi.org/10.3390/su151712748