Article

Protection Scheme for Transient Impedance Dynamic-Time-Warping Distance of a Flexible DC Distribution System

1
School of Electrical Engineering, Beijing Jiaotong University, Beijing 100044, China
2
State Grid Economic and Technological Research Institute Co., Ltd., Beijing 102209, China
*
Author to whom correspondence should be addressed.
Sustainability 2023, 15(17), 12745; https://doi.org/10.3390/su151712745
Submission received: 14 July 2023 / Revised: 4 August 2023 / Accepted: 16 August 2023 / Published: 23 August 2023

Abstract

:
Flexible DC power distribution systems have characteristics such as rapid fault occurrence and fragile power electronics. DC faults usually result in rapid converter blocking (2–5 ms). However, existing protection schemes are susceptible to distributed capacitance, cannot tolerate long communication delays, and require artificial boundaries, among other features that make it impossible to combine speediness, selectivity, and reliability. A technique based on normalized transient impedance dynamic-time-warping (DTW) distance is proposed to improve the performance of the protection scheme. First, the fault equivalent circuit of the flexible DC distribution system (±10 kV) is established, and its transient impedance expression is derived accordingly. Subsequently, the expression components are split and their fault characteristics are resolved separately. Finally, the protection scheme for normalized DTW distance is proposed based on the transient impedance fault characteristics. A flexible DC distribution system (±10 kV) is established to verify the performance of the scheme.

1. Introduction

A flexible DC distribution system can efficiently and flexibly connect DC loads and distributed power sources in the distribution network. It solves the problems of the short-circuit capacity and power supply radius of an AC distribution network while improving power supply efficiency and power quality [1,2]. Early research on DC distribution grids focused on low-voltage DC distribution grids. In 2007, researchers at Virginia Tech categorized DC distribution systems into two voltage levels, 380 V and 40 V, to provide power primarily to homes and buildings [3]. RWTH Aachen University in Germany realized a DC distribution system with a medium-voltage DC ring network as the backbone network. In recent years, researchers in China have carried out a number of flexible DC power distribution demonstration projects with voltage levels of mostly ±10 kV. Therefore, the research object of this paper is a ±10 kV DC distribution network. Research on flexible DC distribution networks has continued, but the construction of flexible DC distribution systems is still in the exploration stage [4]. As the first line of defense for ensuring the safe and reliable operation of systems, relay protection faces challenges such as vulnerability to distributed capacitance and communication delays, slow action speed, and low reliability [5].
The main research object of this paper is the transmission lines of DC distribution networks. There are differences in the configuration of protection schemes for DC transmission lines of different voltage levels [6]. Low-voltage DC lines use overcurrent and overvoltage protection principles, medium-voltage DC lines use differential protection principles, and high-voltage DC lines often use traveling wave protection principles. Even medium- and high-voltage DC lines need the coordination of traveling wave protection and differential protection to prevent faults.
The existing protection schemes for flexible DC distribution systems can be divided into single-ended protection, which requires no communication, and double-ended protection, which requires communication [7]. Single-ended protection utilizes accessory devices, such as current-limiting inductors, to ensure selectivity [8,9]. However, the topological complexity of DC distribution systems is increased by large numbers of distributed power sources and DC loads. Multi-terminal flexible DC distribution systems will not be fully equipped with current-limiting reactors, so the study of double-ended protection is crucial [10].
Initial double-ended protection schemes for DC systems borrowed from the current differential protection [11] and the current direction protection of AC systems [12]. However, current oscillations due to distributed capacitance cannot be ignored due to the extremely high action time requirements of protection for DC systems. Therefore, the performance of current differential protection and current direction protection in DC systems is degraded [13]. To improve the performance of double-ended protection, double-ended protection based on line wave discrepancy is proposed [14]. The use of a traveling wave signal fundamentally solves the problem of distributed capacitance, but high-frequency traveling wave signals are vulnerable to noise and communication delays [15,16]. Reference [17] proposes a protection scheme based on waveform matching, using the similarity of the forward waves on both sides for fault identification. This scheme requires consistency of waveforms, leading to difficulties in its application in multi-terminal systems. Reference [18] proposes a high-speed action scheme based on traveling waves. References [19,20] analyze the fault information on both sides of the current-limiting reactor and propose a transient voltage-based protection scheme. As mentioned in the previous section, the limited use of current-limiting reactors limits their applicability.
In summary, protection schemes for flexible DC distribution systems need to focus on the following issues:
(1)
Given the extremely high action time requirements of DC distribution systems, the influence of line-distributed capacitance cannot be ignored. The protection scheme should have strong resistance to distributed capacitance currents.
(2)
The topology of distribution systems containing distributed power is complex and the selectivity of single-ended schemes is poor. The proposed scheme should compensate for this selectivity deficiency.
(3)
DC system faults develop very fast, and smaller communication delays may lead to the failure of the protection scheme. The proposed scheme should be acceptable for larger communication delays.
Considering the above factors, a reliable double-ended protection scheme is proposed with the following contributions and features:
(1)
The fault characteristics of the transient impedance are analyzed, and the transient impedance is calculated using the traveling wave signal so that the proposed scheme is not affected by the distributed capacitance.
(2)
The normalized DTW distance of the transient impedance at the local end is calculated and judged, and only the judgment result is transmitted to the opposite end. This process allows the proposed scheme to accept longer communication delays.
(3)
Compared with the prior state of the art, the proposed solution ensures high resistance and noise interference capability with better quick action.
The fault equivalent circuits and transient impedance expressions for flexible DC distribution systems are resolved in Section 2. The detailed resolution of the various components of the transient impedance is provided in Section 3. Section 3 also summarizes the fault variability of the transient impedance. The protection scheme based on the normalized DTW distance algorithm is provided in Section 4, while the simulation comparison results are presented in Section 5.

2. Expression Derivation of Transient Impedance

Since the flexible DC distribution system includes a variety of power sources and a large number of power electronics, its fault characteristics are more difficult to analyze, and the analysis method of transient circuits is used in this section. First, the model of the flexible DC distribution system is introduced. Subsequently, different fault areas with different fault lines of equivalent circuits are created. Finally, the transient equivalent impedance expressions are derived based on different circuits and the differences are explored.

2.1. Models

Due to its high reliability of power supply and greater suitability for accessing distributed energy sources, the ring-shaped flexible DC distribution system has become the mainstream topology for DC distribution. The model of the medium-voltage DC distribution system shown in Figure 1 is the basis of this study. The system uses a ring power supply structure with two 10 kV AC sources connected to the DC system via transformers and modular multilevel converters. The transformer uses a neutral point grounded by a large resistance, with a resistance value of 150 Ω. The MV DC voltage level of this system is ±10 kV, and the DC bus is wired in a symmetrical single pole. This method can meet the N-1 power supply principle and also realize the flexible regulation of the power side and load side.
The voltage-source converter (VSC2) in Figure 1 uses the half-bridge sub-module (HBSM), while VSC1 uses a full-bridge sub-module (FBSM). The line parameters are as follows: resistance is 0.127 Ω/km, inductance is 1.93 mH/km, capacitance is 0.00834 μF/km, and length is 10 km. Considering that the existing flexible DC distribution network project operates in bipolar mode and the neutral point is generally grounded by high resistance, if a single-pole ground fault occurs, the system will not generate serious overcurrent and the response speed of protection will not be high. Therefore, the fault characteristic analysis and the corresponding protection proposed in this paper are mainly for bipolar short-circuit faults, and the reference direction of current in this paper is specified as the busbar pointing to the line.

2.2. Equivalent Circuit of Line1 and Line3

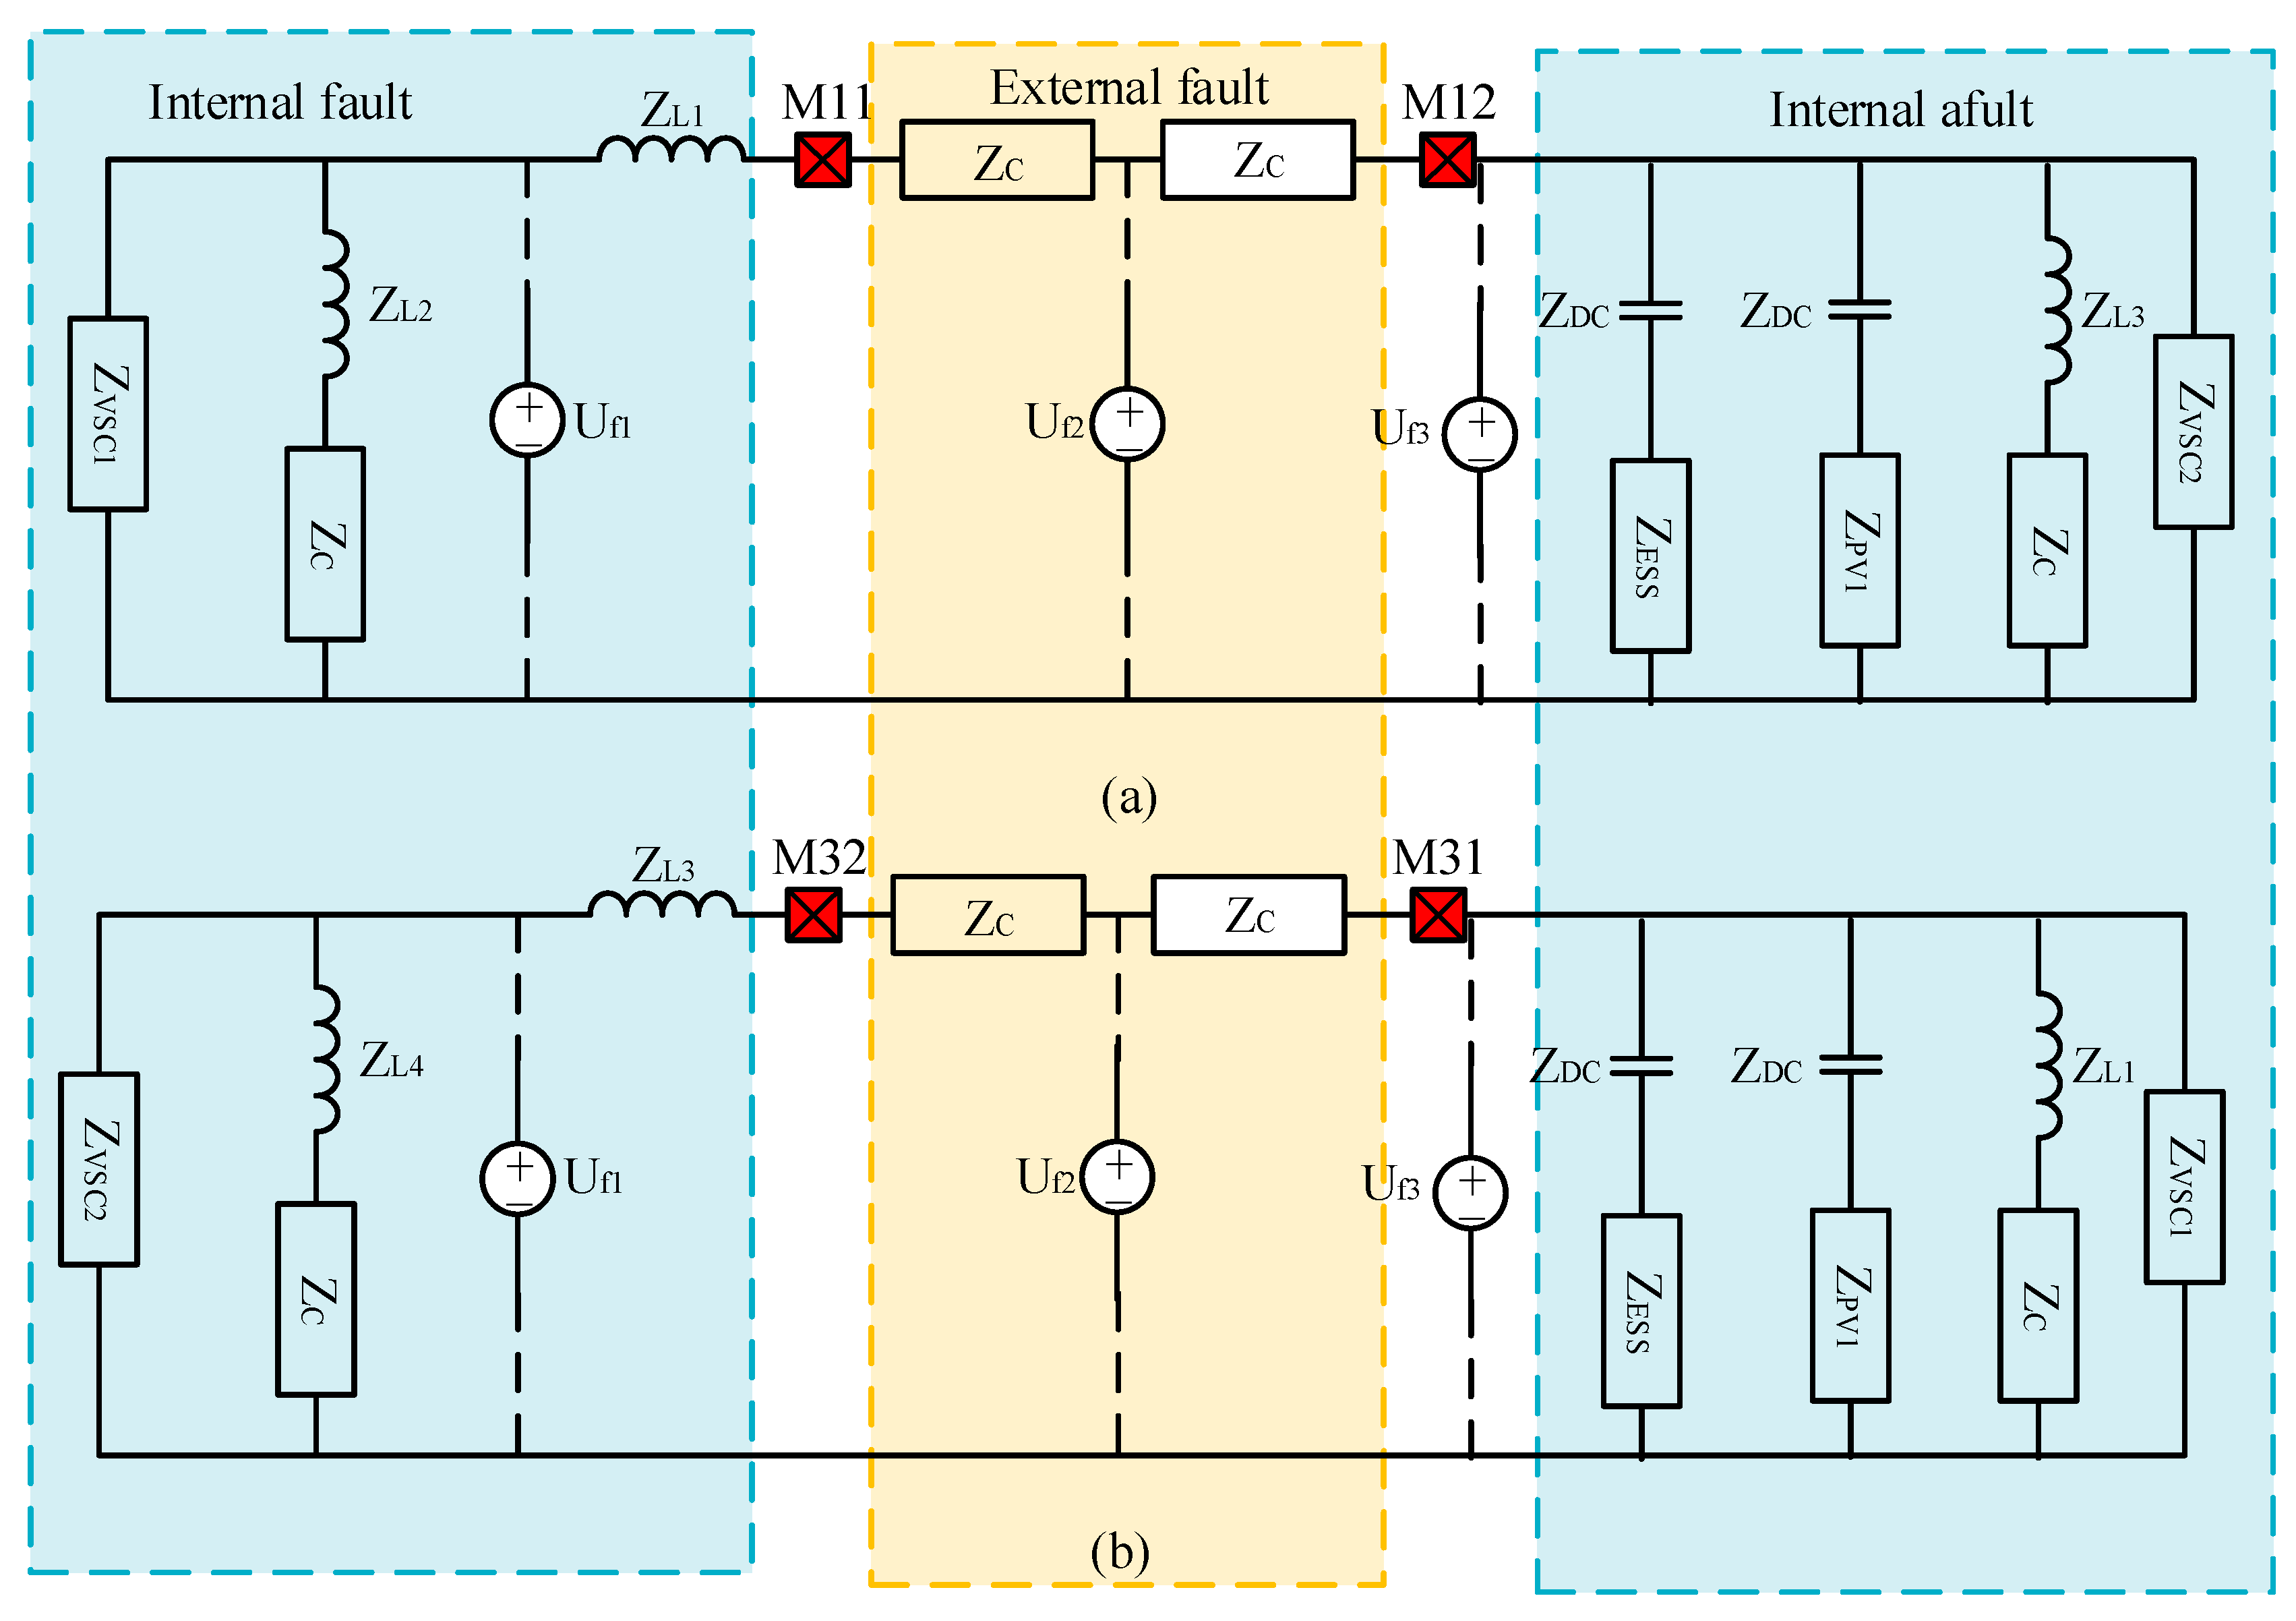
We define F1, F2, and F3 as a reverse external fault, positive internal fault, and positive external fault, respectively. Figure 2a,b represent the fault equivalent circuits of Line1 and Line3, respectively. Among them, M11, M12, M31, and M32 are measurement points of protection devices; ZVSC1 and ZVSC2 represent converter impedance; ZL1, ZL2, ZL3, and ZL4 represent current-limiting reactor impedance; ZDC, ZESS, and ZPV1 represent the impedance of the DC/DC converter, energy storage, and PV, respectively; and Uf1, Uf2, and Uf3 represent the fault voltage source.
A.
Line1
The analysis of M11 provides the transient process of different faults. (1) F1 fault: the transient traveling wave is emitted by the fault source Uf1 and the signal is transmitted to M11 via the current limiting reactor L3. (2) F2 fault: the transient traveling wave is emitted by the fault source Uf2 and the signal is transmitted to the measurement point M11 via the line. (3) F3 fault: the transient traveling wave is emitted by the fault source Uf3 and the signal M12 and the line are transmitted to the measurement point M11. Evidently, M11 receives the same signal for F2 and F3 faults. We define ZM11I and ZM11E as the transient impedance of M11 in the case of F2 (F3) and F1 faults, respectively. According to Figure 2a, the transient impedance is expressed as
| Z M 11 I | = Z L 1 + Z VSC 1 / / ( Z L 2 + Z C ) | Z M 11 E | = Z C
The transient impedance analysis at M12 is the same as M11, so the expression is
| Z M 12 I | = Z VSC 2 / / ( Z DC + Z ESS ) / / ( Z DC + Z PV 1 ) / / ( Z L 3 + Z C ) | Z M 12 E | = Z C
where ZM12I and ZM12E represent the transient impedance of M12 for internal and external internal faults, respectively.
B.
Line3
The analysis of the transient impedance of Line3 is the same as that of Line1. When a reverse external fault occurs, the line wave signal is transmitted from the fault point to M31 and M32. When a forward fault occurs, the line wave is transmitted from the fault point to M31 and M32 via the line. We define ZM31I and ZM31E as the transient impedance of M31 in the case of F2 (F3) and F1 faults, respectively. According to Figure 2b, the transient impedance is expressed as
| Z M 31 I | = Z VSC 1 / / ( Z DC + Z ESS ) / / ( Z DC + Z PV 1 ) / / ( Z L 1 + Z C ) | Z M 31 E | = Z C
The transient impedance analysis at M12 is the same as at M11, so the expression is
| Z M 32 I | = Z L 3 + Z VSC 1 / / ( Z L 4 + Z C ) | Z M 32 E | = Z C
where ZM32I and ZM32E represent the transient impedance of M32 for internal and external internal faults, respectively.
Through the above analysis, it can be found that the temporary impedance at both ends of the line internal fault is the equivalent impedance of its backside. For the external fault, this is the line by one end for the line characteristic impedance. The difference is that different types of distributed power supply lead to differences in the back equivalent impedance. Obviously, the analysis of transient impedance becomes complicated due to the addition of distributed power sources.

2.3. Equivalent Circuit of Line2 and Line4

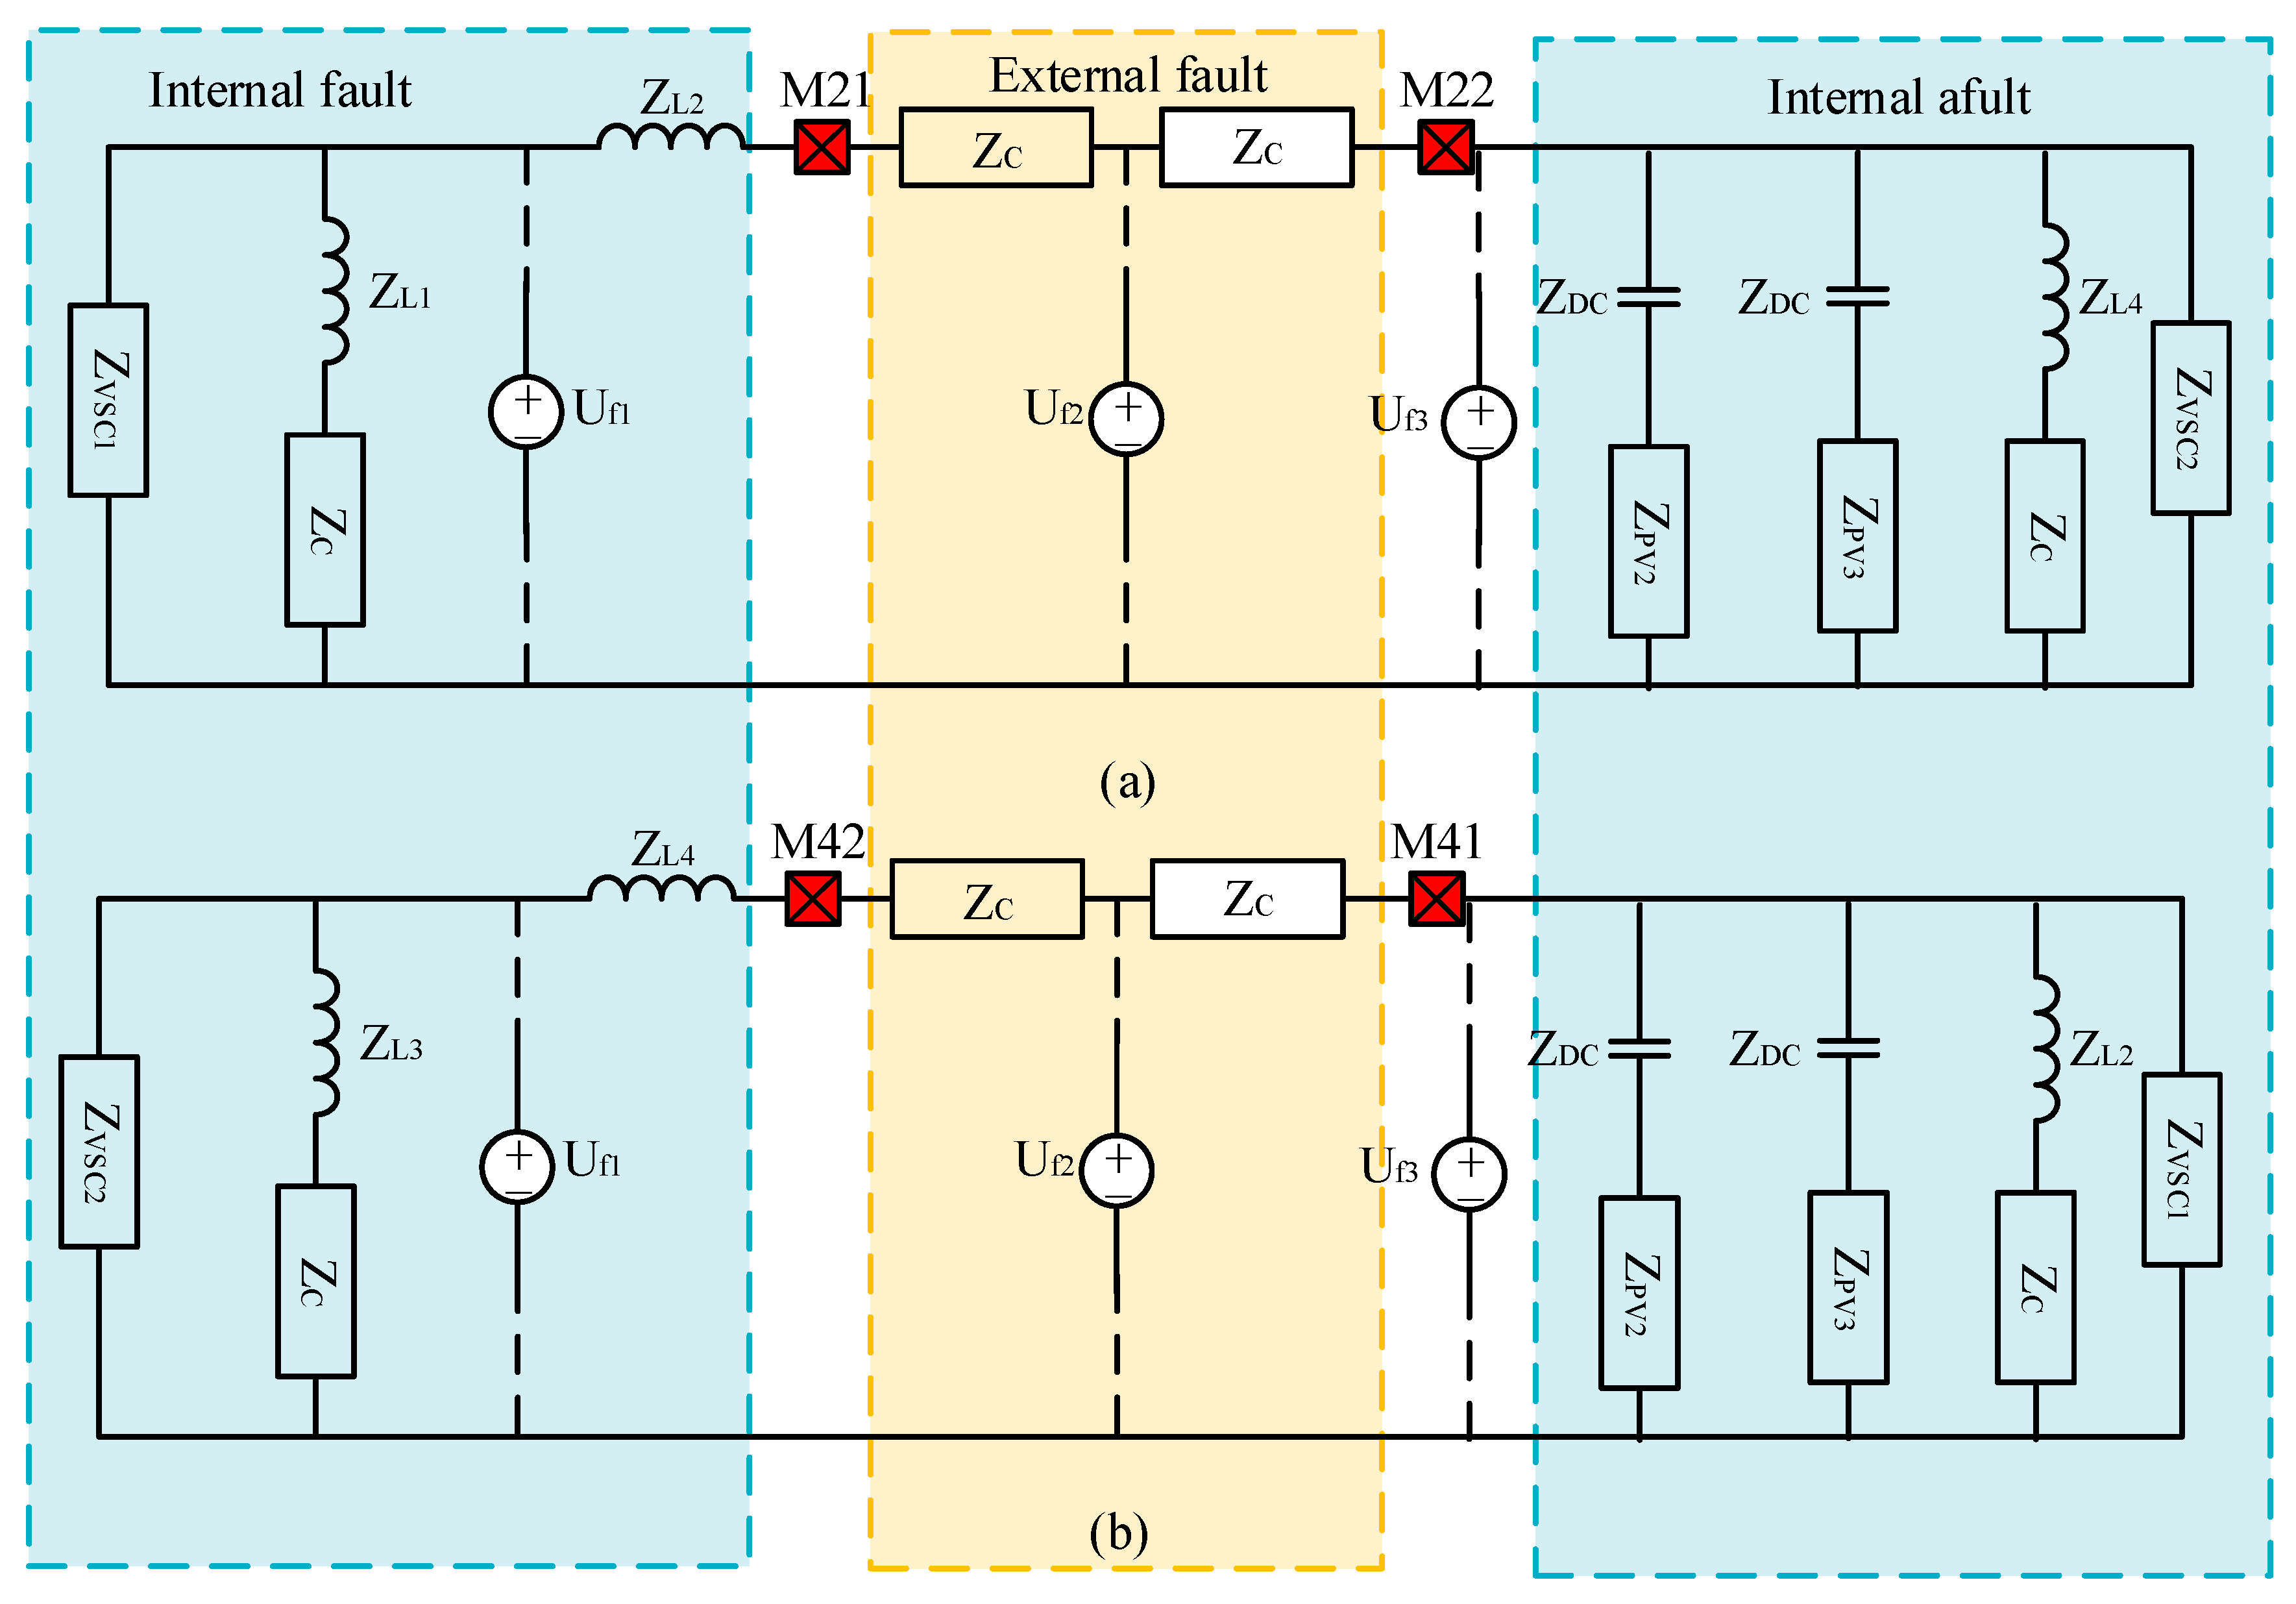
Line2 and Line4 are connected with photovoltaic (PV) power, while Line1 and Line3 are connected with PV and energy storage, respectively. Therefore, the transient impedances of Line2 and Line4 are derived based on Section 2.1. Figure 3a,b represent the fault equivalent circuits of Line2 and Line4, respectively. Among them, M21, M22, M41, and M42 are the measurement points of protection devices; ZVSC1 and ZVSC2 represent converter impedance; ZL1, ZL2, ZL3, and ZL4 represent current-limiting reactor impedance; ZPV2 and ZPV3 represent impedance of PV, respectively; and Uf1, Uf2, and Uf3 represent the fault voltage source.
According to Figure 3, the transient impedance is expressed as
| Z M 21 I | = Z L 2 + Z VSC 1 / / ( Z L 1 + Z C ) | Z M 22 I | = Z VSC 1 / / ( Z L 4 + Z C ) / / ( Z DC + Z PV 2 ) / / ( Z DC + Z PV 3 ) | Z M 42 I | = Z L 4 + Z VSC 2 / / ( Z L 3 + Z C ) | Z M 41 I | = Z VSC 1 / / ( Z L 2 + Z C ) / / ( Z DC + Z PV 2 ) / / ( Z DC + Z PV 3 ) | Z M 21 E | = | Z M 22 E | = = | Z M 42 E | = | Z M 41 E | = Z C
where ZM21I, ZM22I, ZM41I, and ZM42I represent the transient impedance of M21, M22, M41, and M42, respectively, in case of internal fault; and ZM21E, ZM22E, ZM41E, and ZM42E represent the transient impedance of the reverse fault.
In summary, it can be seen that there are differences in the transient impedance of different fault locations. The difference in distributed power sources also enhances the difference in transient impedance. When the DC line experiences an internal fault or external fault, the transient impedance characteristics of the two ends of the DC line are significantly different; this feature can be used to achieve the identification of the fault area. In addition, the transient impedance at both ends of the line is only related to the system structure and parameters, and the transient voltage and transient current amplitude are not relevant. Therefore, the method of fault identification using transient impedance measurement will be theoretically independent of the amplitude of the transient electrical quantities.

3. Analysis of Transient Impedance Difference

The analysis in Section 2 shows that there are differences in the transient impedance expressions for different fault areas, and, in this section, we analyze the various parts of the expressions in detail. The equivalent impedances of the line and converter, DC/DC converter, energy storage system, and PV system are analyzed, and the differences in transient impedances are summarized accordingly.

3.1. Transient Impedance of Line

We define Uf(s) and If(s) as the voltage and current at the fault point; UfM(s) and IfM(s) are the voltage and current at the measuring point, so they have the following relationship:
U f ( s ) I f ( s ) = ch γ x Z C sh γ x   1 2 sh γ x ch γ x U fM ( s ) I fM ( s )
where γ represents the line propagation coefficient, and its calculation formula is γ ( s ) = ( R + s L ) ( G + s C ) . R, L, G, and C represent resistance, inductance, conductance, and capacitance, respectively. According to Equation (6), the characteristic impedance expression of the line is
Z C = ( R + s L ) / ( G + s C )
Because the fault information in the transient phase contains a large number of broadband signals, the impedance of the DC line is related to the parameters and frequency of the line unit length.
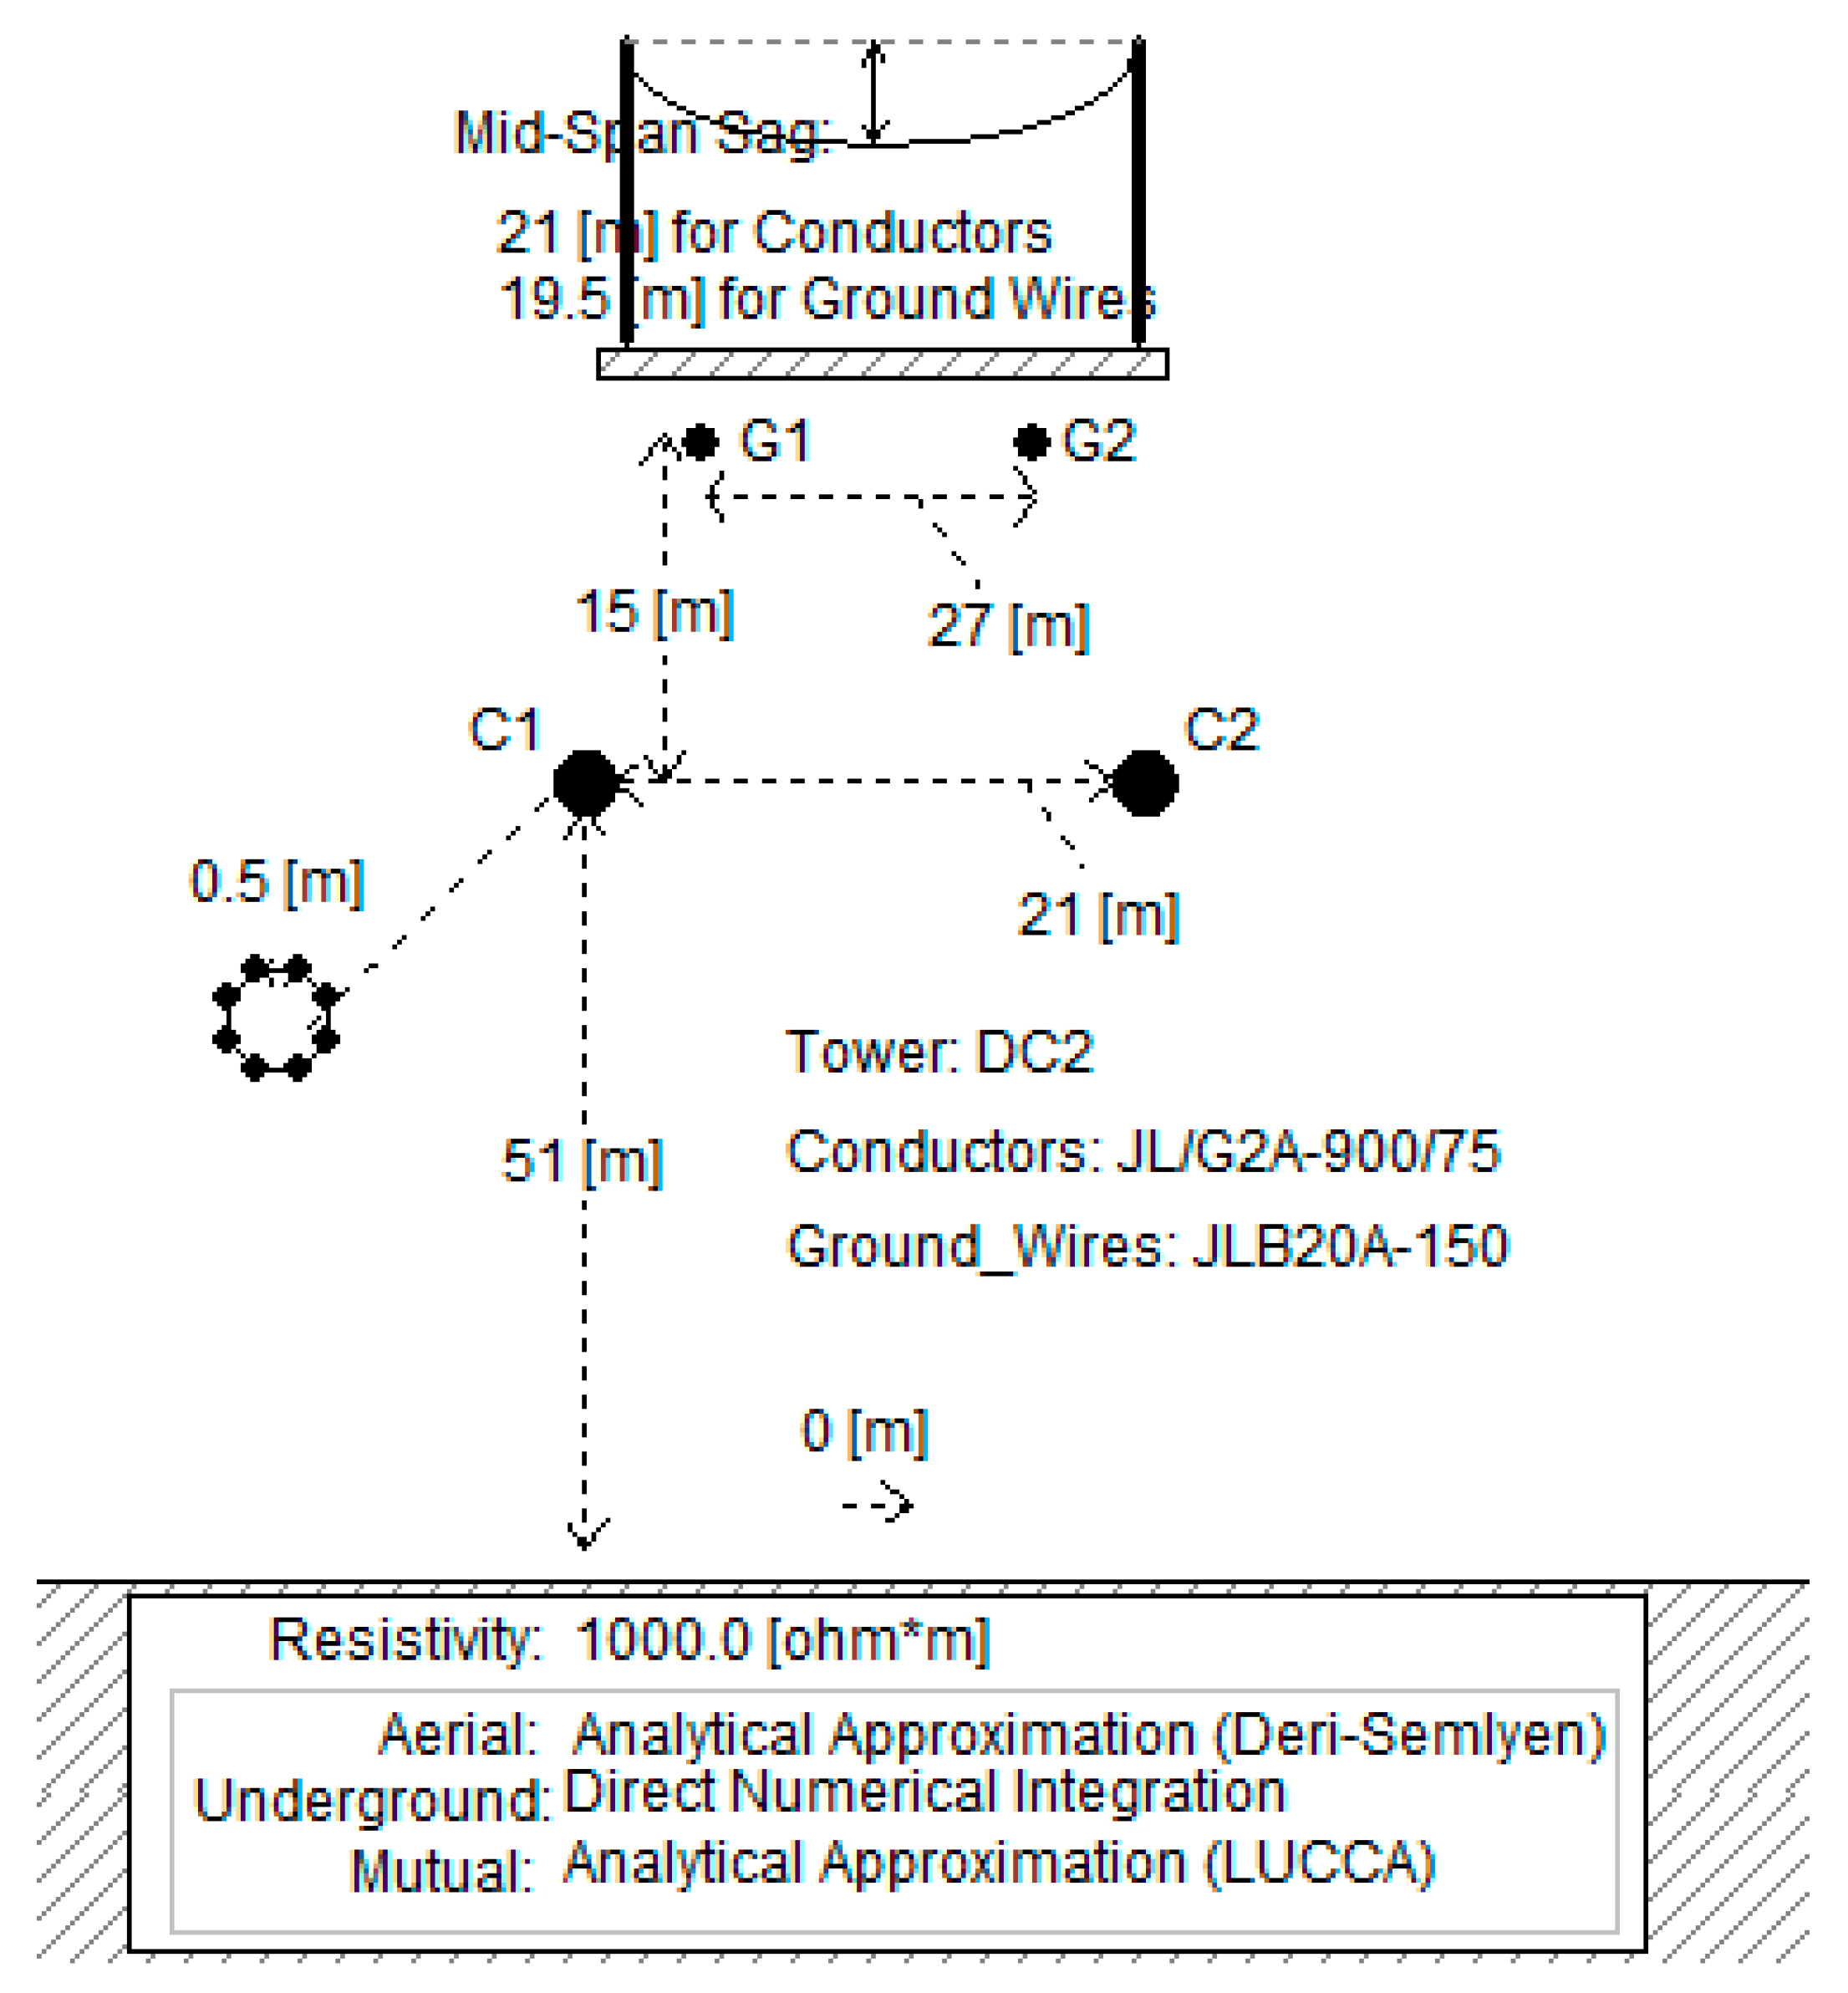
To study the trend of the DC line wave impedance changing with frequency, a frequency-dependent DC line model is established in PSCAD. Its parameters are shown in Table 1 and Figure 4. The line structure is a DC2 tower, and the tower parameters refer to the G1 tower shape in the project.
Table 2 shows the amplitude frequency characteristics of line mode wave impedance and ground mode wave impedance of the DC2 tower DC transmission line. It can be seen from Table 2 that the amplitude of line wave impedance decreases with the increase in frequency, and finally tends to be stable. The amplitude of ground mode wave impedance tends to be stable slowly with frequency change, while the line mode wave impedance tends to be stable rapidly with a frequency increase. Because the line mode wave impedance is more stable than the ground mode wave impedance, this paper chooses the line mode wave impedance to realize the protection criterion.
In conclusion, line impedance is closely related to frequency. The low-frequency impedance changes greatly, while the high-frequency impedance hardly changes.

3.2. Transient Impedance of Voltage Source Converter

The VSC converter modeled in Figure 1 uses two topologies, a half-bridge submodule (Figure 5a) and a full-bridge submodule (Figure 5b). A single MMC converter has three phase units, each phase unit has two bridge arms, upper and lower, and each bridge arm includes N sub-modules and a bridge arm reactor, Larm. The losses of switching devices such as IGBTs are represented by R0.
Reference studies have shown that the failure mechanisms of half-bridge MMC and full-bridge MMC are similar at the early stage of failure, mainly manifesting as sub-module capacitance discharge. Therefore, the equivalent circuit of the VSC converter during a bipolar short-circuit fault is shown in Figure 5c [15]. The equivalent impedances of the converters VSC1 and VSC2 can be obtained from the equivalent circuit diagram as
Z VSC 1 = Z VSC 2 = 2 / 3 R 0 + 2 / 3 s L arm + 1 / ( 6 C sm / N 1 )

3.3. Transient Impedance of Current Limiting Reactor and DC/DC Converters

The fault current rise rate of a flexible DC distribution system is large, and the fault current can reach its peak within a few ms. Additionally, a large number of IGBTs of the converter are vulnerable to high current shocks and are expensive. Therefore, a current-limiting reactor can be configured on the outside of the protection device to suppress the rising rate of the fault current to achieve the purpose of protecting the converter. In the case of a fault, the current-limiting reactor can be equated to a large inductor, and its equivalent impedance is calculated as follows:
s L = 2 π f L
In DC distribution networks, DC/DC converters can be divided into medium-voltage and low-voltage levels depending on the application. The DC transformer composed of dual-active-bridge (DAB) modules has the double function of electrical isolation and voltage conversion and can realize bi-directional power flow, so it is often used as a medium-voltage-level DC transformer to connect medium and low voltages.
The topology of the sub-module of the dual active full bridge DC/DC converter used in this paper is shown in Figure 6. A plurality of sub-modules shown in Figure 6 can form a DC/DC converter. It can be seen that the main component of this sub-module is capacitance. Considering the rich high-frequency transient information of the fault device, the DC/DC converter can be equivalent to the high-voltage side outlet support capacitor.
Z DC = 1 2 π f C DC
where CDC represents the equivalent capacitance of the DC/DC converter.

3.4. Transient Impedance of Photovoltaics

The main parts of a PV are the PV array and the DC/DC converter. A photovoltaic array consists of a certain number of connected low-power photovoltaic cells. Figure 7 shows the equivalent circuit model of the PV cell, which consists of a photogenerated current source, a parallel diode, a parallel junction capacitor, a parallel resistor, and a series resistor. The photogenerated current Iγ is proportional to the light intensity γ of the incident light and the area of the PV cell. The current Id flowing through the diode varies with the junction voltage Ud and the reverse saturation current I0. The series resistance Rs is mΩ, while the parallel resistance Rp is approximately 200–300 Ω.
Based on Figure 7, the exact mathematical equation of the PV output current can be obtained as
I = I γ I 0 [ exp ( q ( U + I R s ) A K T ) 1 ] U + I R R P
The explicit expressions for the load voltage U and current I cannot be derived using this equation. We define Ud as Ud = U + IRS. Then, Equation (10) can be expressed as
I = I γ I 0 [ exp ( q U d A K T ) 1 ] U d R P
where A is the ideal factor of the diode, K is the Boltzmann constant, T is the absolute temperature, and q is the electronic charge. Accordingly, the equivalent impedance d of the PV cell is obtained as
Z PV 1 , 2 , 3 = U I = U d / ( I γ I 0 [ exp ( q U d A K T ) 1 ] U d R P ) R s
It is easy to see that the equivalent impedance of the PV cell is variable. Therefore, the existing PV plant is built using a dynamic impedance scheme.

3.5. Transient Impedance of ESS

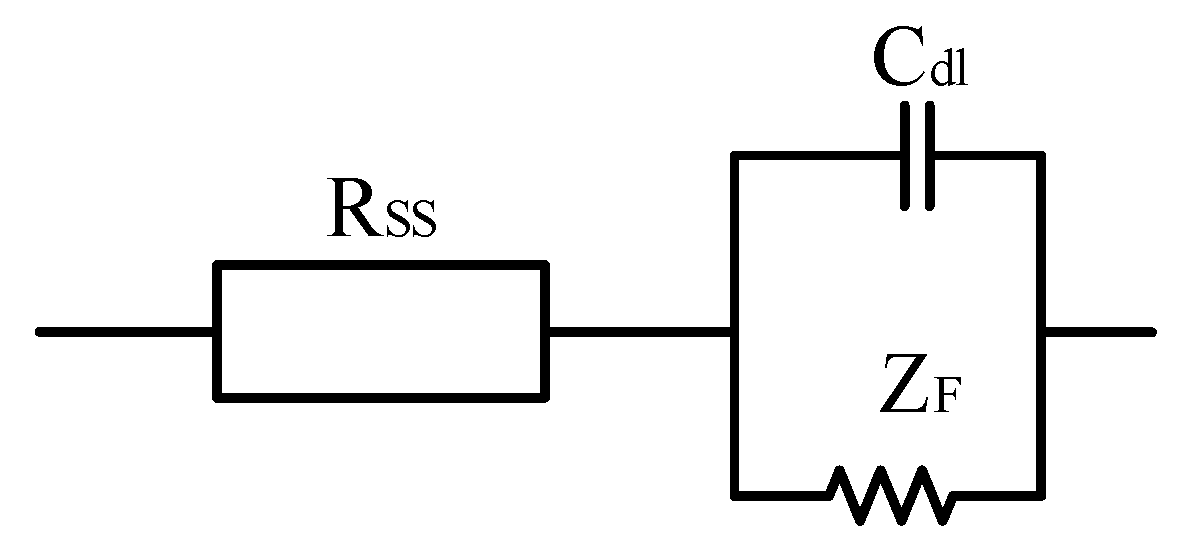
Lithium-ion batteries are commonly used for energy storage. A more accepted impedance model of the lithium-ion battery electrode system is shown in Figure 8.
RSS denotes the solution resistance, Cdl denotes the capacitance of the electrode to the electrolyte solution, and ZF denotes the Faraday impedance. The expression of the impedance of the cell can be obtained as
Z E S S = R S S + 1 j ω C d l + 1 / Z F
where
Z F = Z F 0 + Z d Z d = 1 Y .0 ( 2 ω ) 0.5 ( 1 j ) Y .0 = n F C s D λ R t | I F |
where n is the stoichiometric coefficient, F is the Faraday constant, Cs is the electrode surface activity, D is the diffusion coefficient, and λ is the number of reaction stages. Obviously, the impedance of the Li-ion battery is also dynamically changing. Therefore, the energy storage battery system should be dynamic equivalent impedance.
The analysis presented in Section 2 shows that the transient impedance of the reverse fault at the measurement point is the line impedance, while the transient impedance of the forward fault is a combination of the components. Based on the analysis of the equivalent impedance of each component in Section 3, Table 3 can be obtained.
Table 3 shows that the transient impedance of the forward fault is an uncertain value, which should be a dynamic model. Additionally, the transient impedance of the reverse fault is only related to the line parameters. For example, the transient impedance of both M11 and M12 in the forward fault (F1) in Line1 is very different from ZC, while, in the reverse fault (F1 or F3), there is always a transient impedance of ZC for M11 or M12. Therefore, the difference in transient impedance is the fault area used in this paper.

4. DTW-Based Protection Scheme

4.1. DTW Distance

If the line impedance ZC is used as a template and the similarity is used as a benchmark, the transient impedance of the forward fault is the least similar to the template, while the transient impedance of the reverse fault is the most similar to the template. Therefore, a suitable similarity algorithm needs to be selected in this paper. The Euclidean distance is the fastest similarity measure to be calculated, and its formula is shown as follows:
D ( x , y ) = ( x 1 x 2 ) 2 + ( y 1 y 2 ) 2
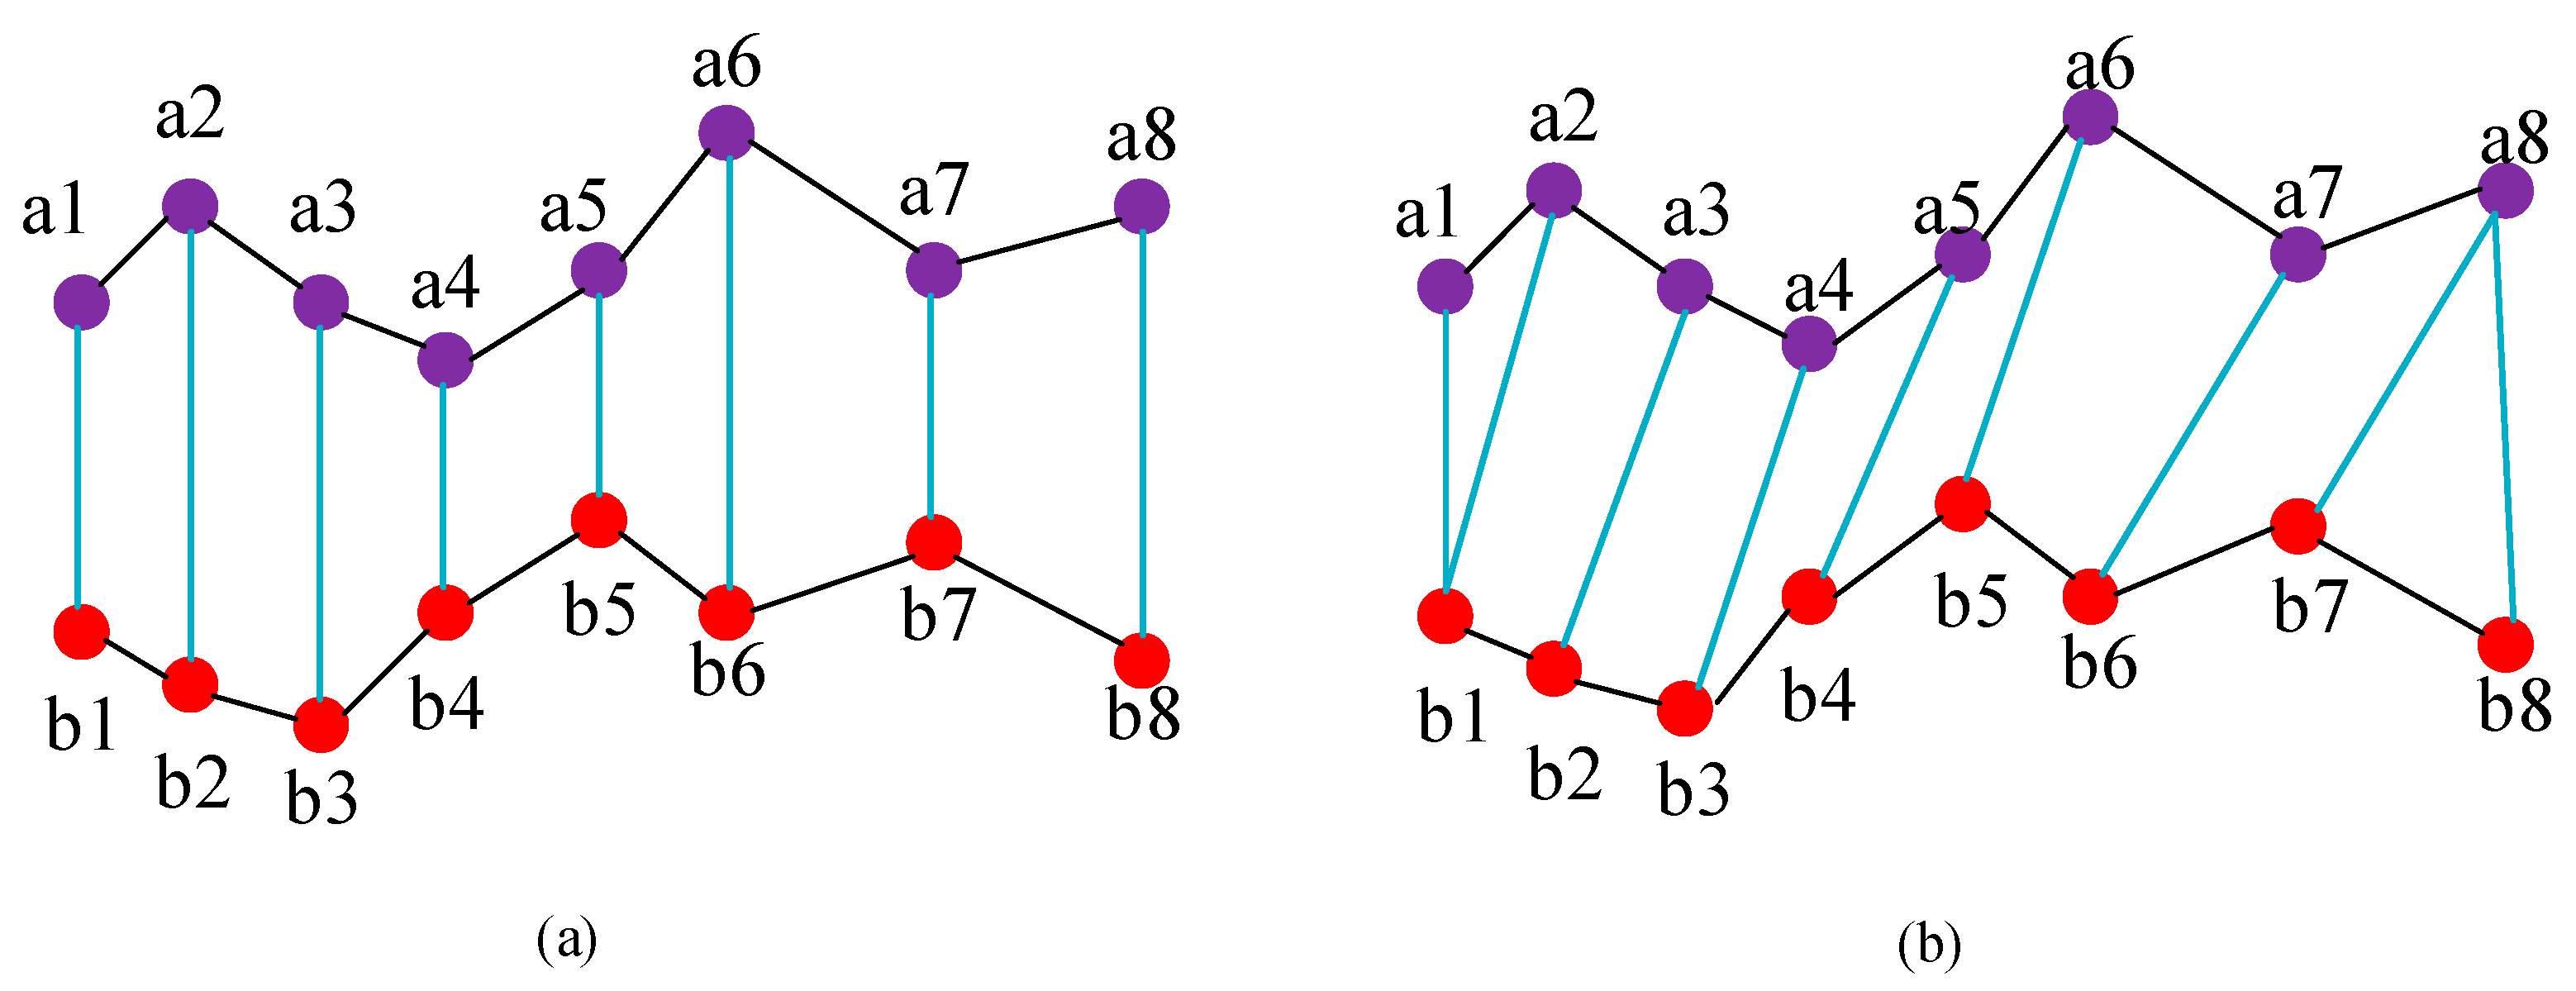
where D(x,y) represents the Euclidean distance between the vector x(x1, x2) and the vector y(y1,y2). The Euclidean distance is the most widely used distance metric in data mining. However, it is sensitive to changes in the data and requires a long period of time, leading to the difficulty of applying this algorithm experienced in this paper. Unlike the Euclidean distance, the DTW algorithm can match the data points of a time series by bending the time domain of the time series. The algorithm can measure not only the morphology of time series but also time series with unequal data length.
A comparison of the Euclidean distance and the DTW distance is shown in Figure 9. In Figure 9, a1–a8 and b1–b8 represent two sets of data. Figure 9a represents the calculation of Euclidean distance, while Figure 9b represents the calculation of DTW distance. The DTW algorithm can be used to measure the degree of similarity of equal- or unequal-length signals. Obviously, the transient impedance analyzed in this paper is more in line with the distribution law of Figure 9b. Therefore, the DTW algorithm is the best choice for this paper.
The basic principle of the DTW distance algorithm is to first find the correspondence with the minimum cumulative distance by calculating the cumulative distance between any two numerical sequences to determine an optimal regularization function. The detailed procedure of the DTW distance algorithm is shown as follows:
1.
Suppose two time series of data length m and n are A and B, where A = (a1, a2, …, am), B = (b1, b2, …, bn). Then, construct the data matrix C with m rows and n columns using A and B.
C = d ( a 1 , b 1 ) d ( a 1 , b 2 )   d ( a 1 , b n ) d ( a 2 , b 1 ) d ( a 2 , b 2 ) d ( a 2 , b n ) d ( a m , b 1 ) d ( a m , b 2 ) d ( a m , b n )
where cij = |aibj| denotes the Euclidean distance between point ai of time series A and point bj of time series B.
2.
Define the bending path as P = {p1, p2, …, pk} and the Kth element of P as pk. The conditions to be satisfied by this dynamic bending path are as follows:
A.
Boundedness: max{m, n} ≤ k ≤ m + n − 1;
B.
Boundary conditions: p1 = c11, pm = cmn;
C.
Monotonicity and continuity: 0 ≤ ii’ ≤ 1, 0 ≤ jj’ ≤ 1.
3.
Calculate the minimum dynamic bending distance of the two sequences:
d(Pk) denotes the distance between ai and bj, which can be interpreted as the bending cost of ai and bj, and is usually taken as cij = d(ai, bj) = |a bj|. Among these paths, there exists a path such that the total bending cost is minimized.
R DTW ( A , B ) = min k = 1 K d ( p k )
In order to solve the above equation, a cumulative cost matrix R can be constructed by dynamic programming.
R ( i , j ) = d ( i , j ) + min R ( i , j 1 ) R ( i 1 , j 1 ) R ( i 1 , j )
where i = 1, 2, …, m; j = 1, 2, …, n; R(0, 0) = 0; R(i, 0) = R(o, j) = +∞. R(m, n) is the DTW metric.

4.2. Protection Scheme

The previous analysis shows that there are differences in the transient impedance of different fault areas. The transient impedance at the measurement of the forward fault is not similar to ZC, while the transient impedance of the reverse fault is almost the same as ZC. Therefore, the fault is as follows:
Internal   fault : R M > R set R N > R set External   fault : R M R set R N R set
where Rset represents the threshold value. RM and RN represent the DTW distances on both sides of the line, respectively, which are calculated as
R M , R N = R ( Z MI , Z C )
where ZMI represents the transient impedance at the measurement and ZC represents the extracted line mode impedance, which can be derived from the line parameters.
To ensure that the protection scheme does not start frequently due to disturbances, we set the starting elements as follows:
| i | > 0.1 I N
where i represents the current increment and IN represents the DC rated current.
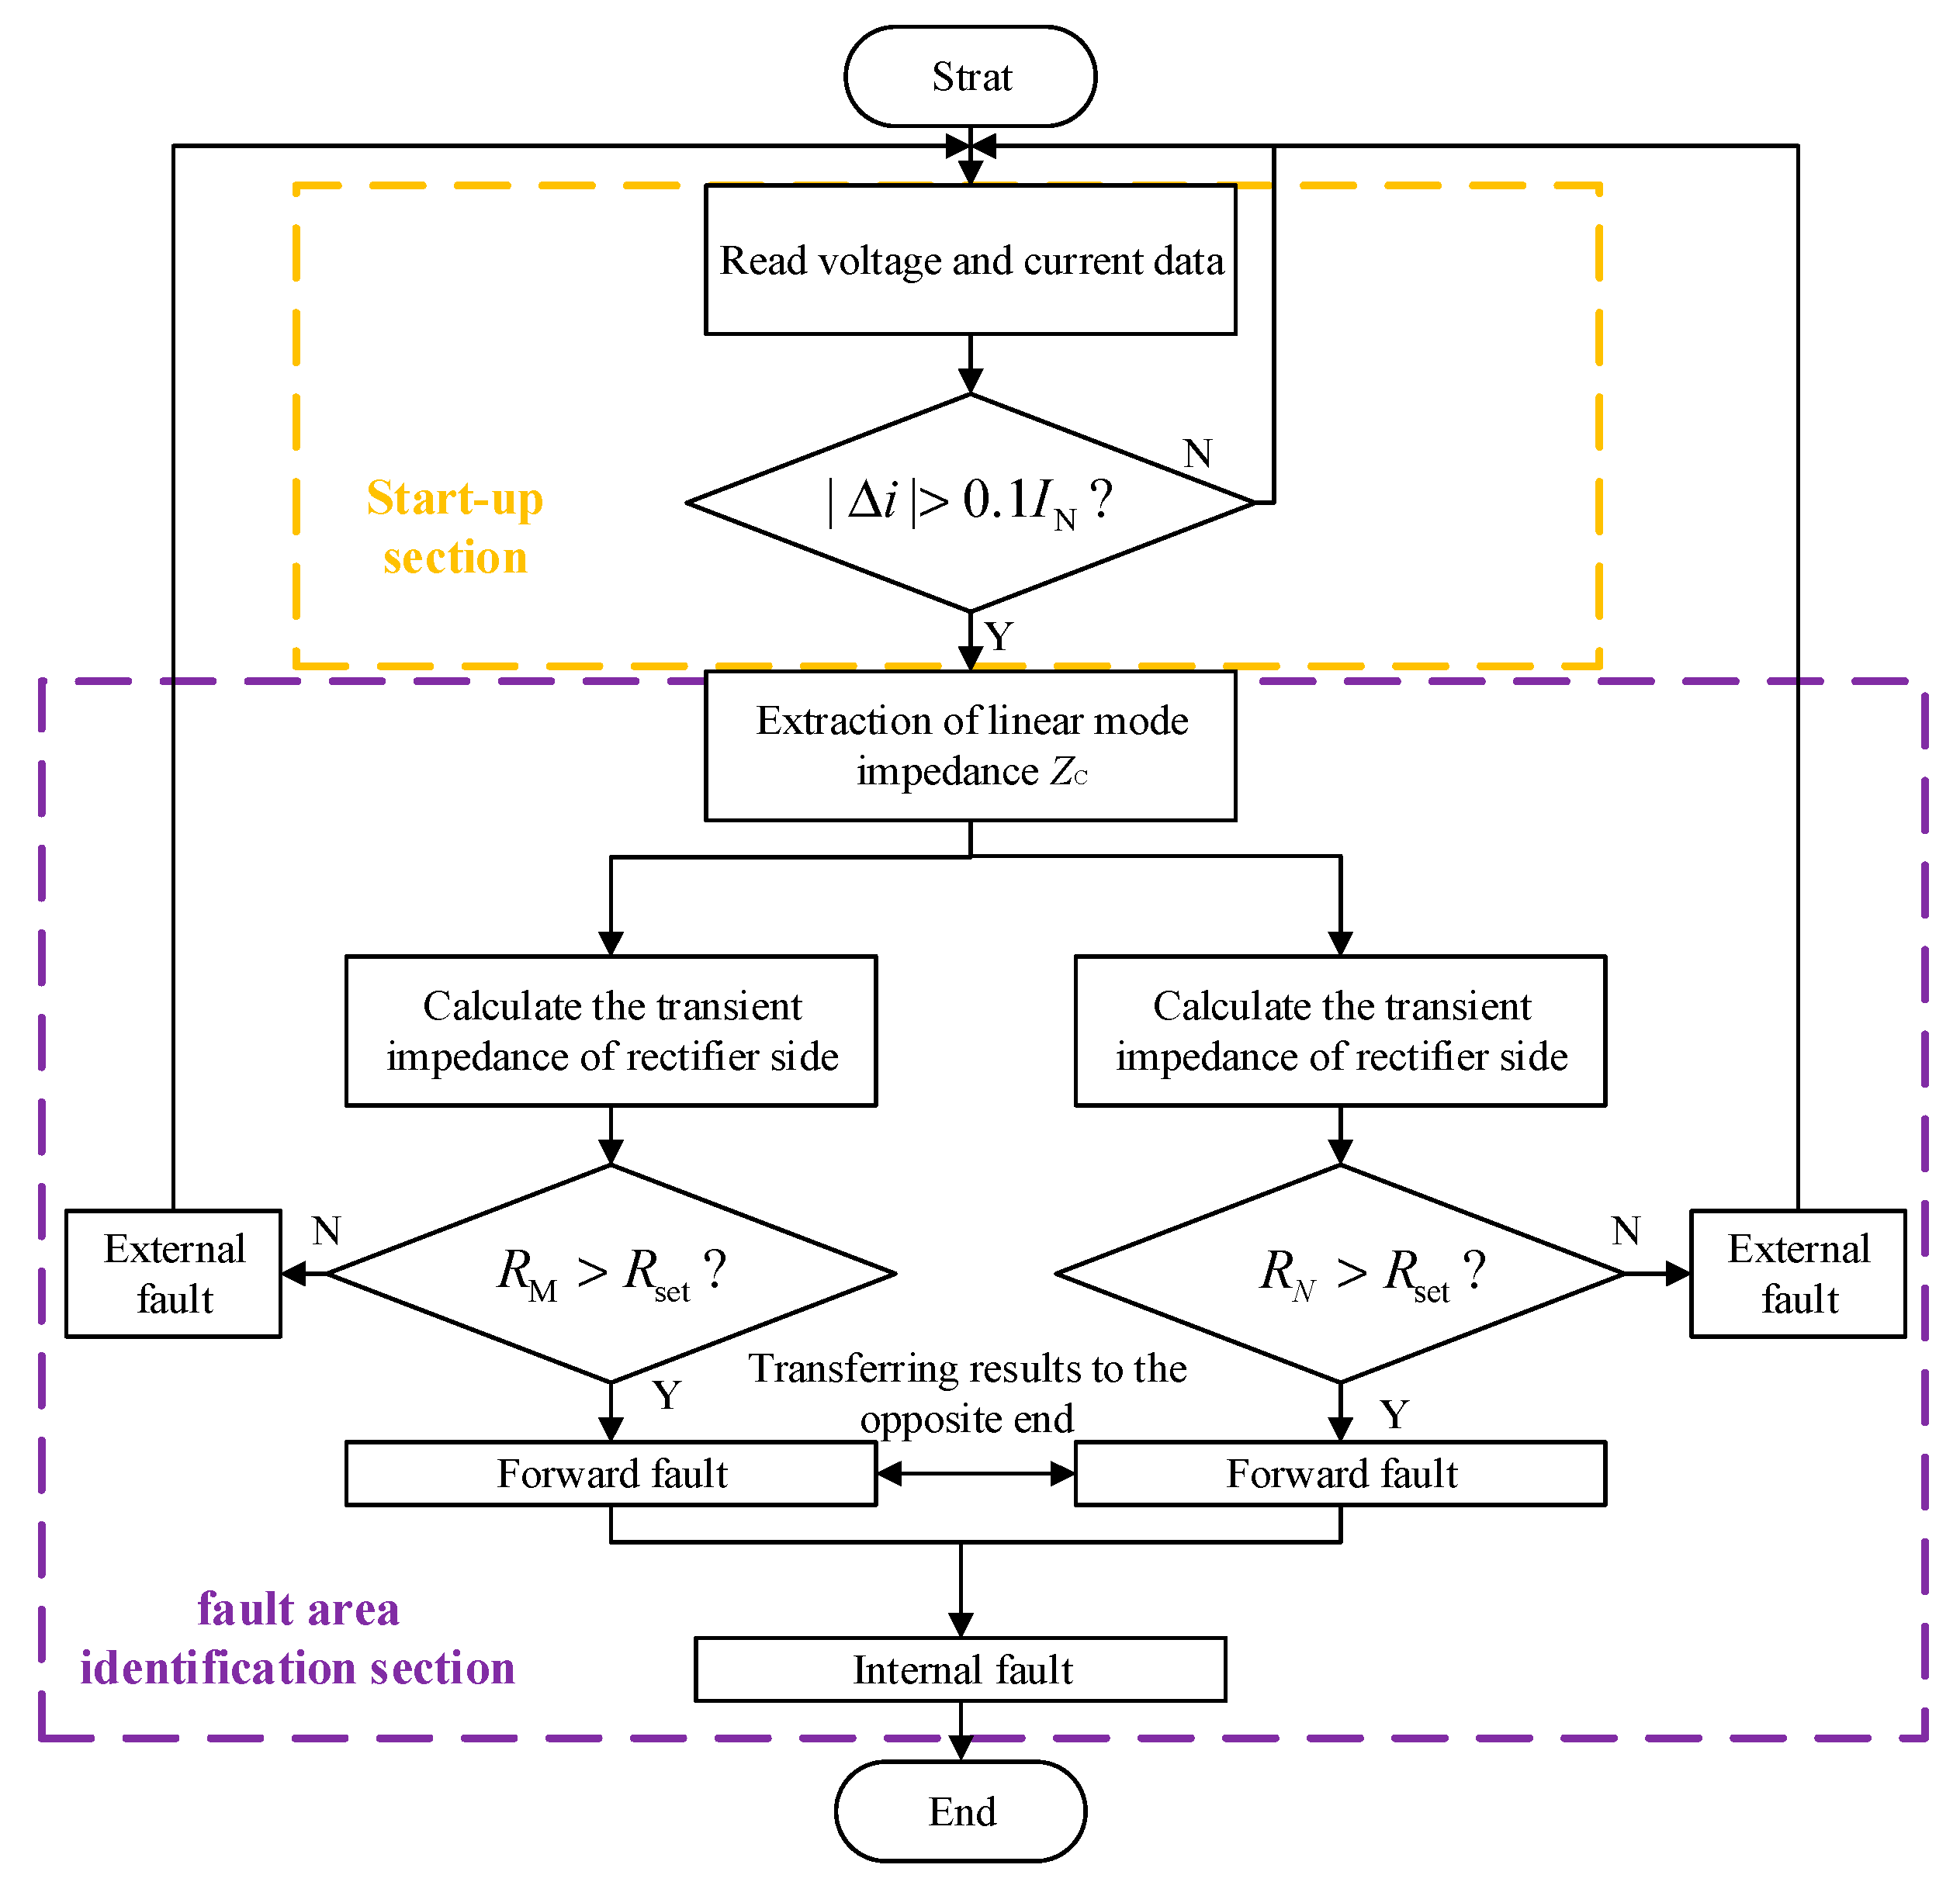
In summary, the DTW distance-based protection scheme consists of two parts: the start-up element and the fault area identification element. The detailed flow of the scheme is shown in Figure 10.
(1)
Program start: start reading fault voltage and current data.
(2)
Calculate whether the absolute value of the current increment is higher than the threshold value; if it is higher than the threshold value, then go to the next step, and otherwise return.
(3)
Extract ZC, which is calculated from the line parameters.
(4)
Calculate the transient impedance and DTW distance on both sides of the line, respectively, and transmit the results to the opposite end. If the DTW distance on both sides is higher than the threshold value, it is judged that an internal fault occurs in the protection. To enhance the resistance to synchronization errors, forward faults are marked as 1, and reverse faults are marked as 0 for transmission to the opposite end.
(5)
End.

5. Simulation

To verify the correctness and performance of the proposed transient impedance DTW distance scheme, the toroidal flexible DC distribution system shown in Figure 1 is constructed and simulated for verification. Since the four lines have the same parameters and similar fault characteristics, only M11 and M12 of Line1 are simulated as an example. F1 represents internal faults, F2 and F3 represent external faults, and the sampling frequency is 50 kHz. Analysis shows that the line wave impedance is stable above 10 kHz, so the frequency of transient impedance is chosen as 12.5–50 kHz. Considering the large variability in DTW distances for different waveforms, the following equation is used to normalize them for easy observation:
R GM \ GN = 1 1 + R M \ N / k
where RGM\GN is the normalized DTW distance, which takes values in the range of 0 to 1. k represents the reduction factor, which is determined by the magnitude of the transient impedance.

5.1. Correctness

A.
Internal fault
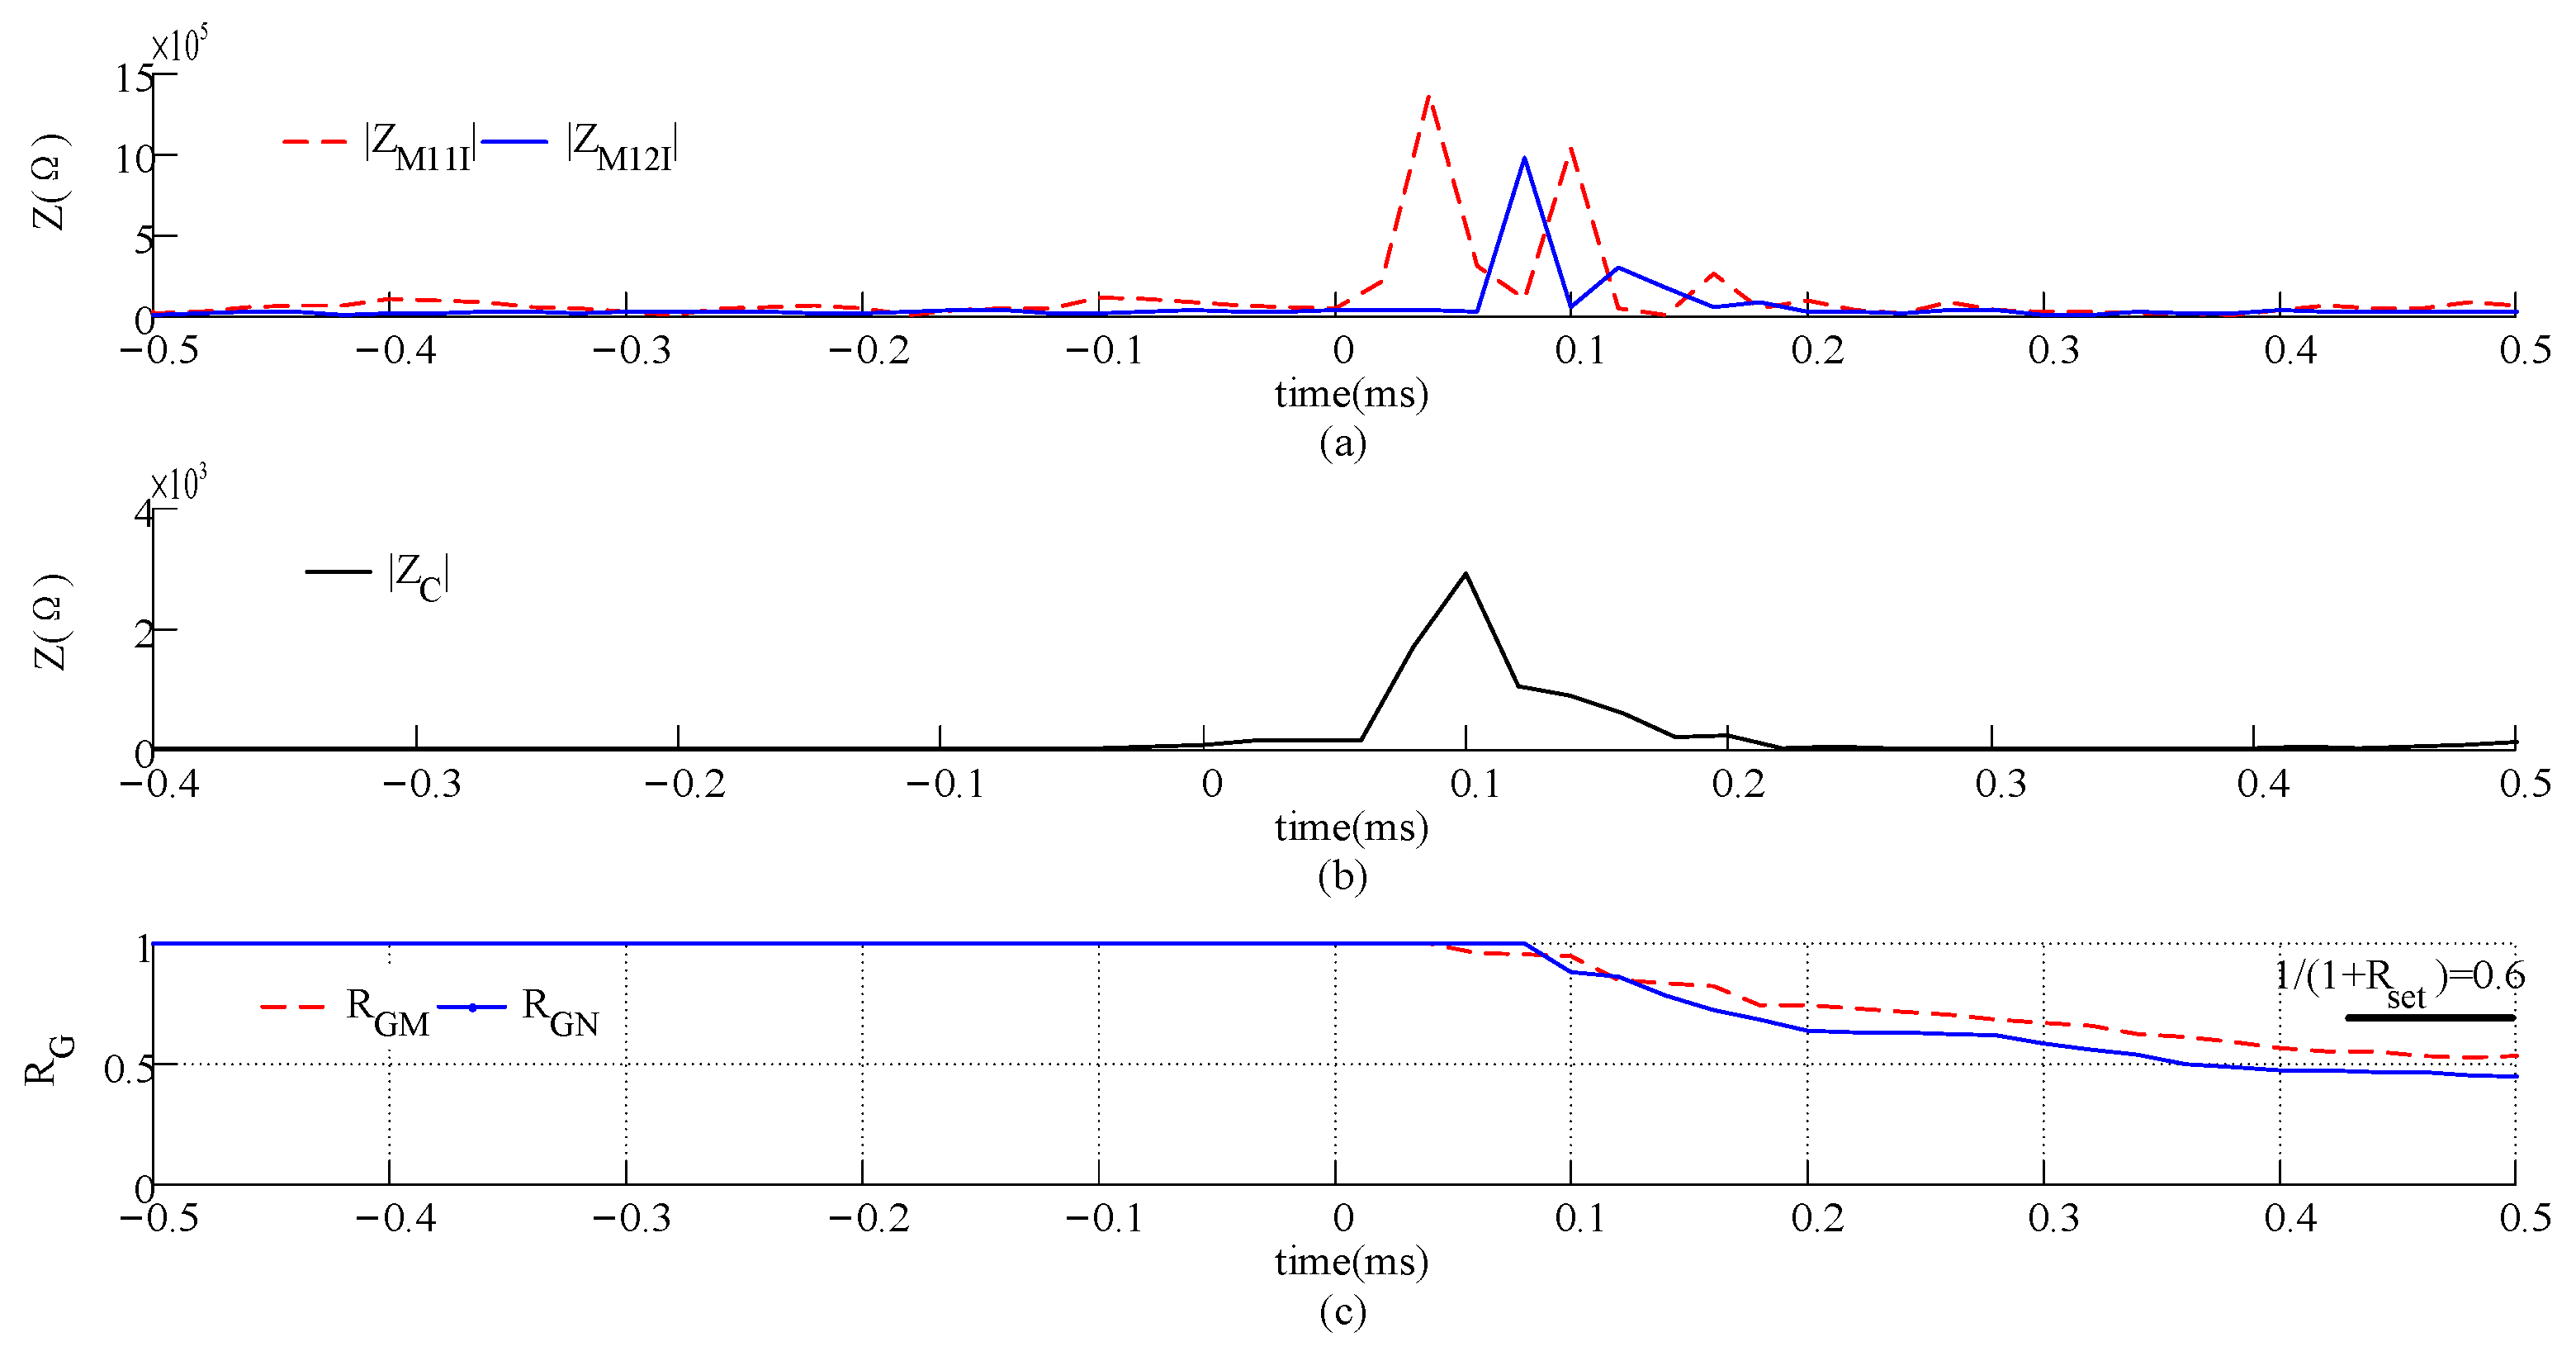
The simulation results of the internal fault are shown in Figure 11. The voltage and current signals are collected at measurement points M11 and M22, respectively, and the transient impedance is calculated as shown in Figure 11a. The analysis in Section 2 shows that there is a difference in the backside equivalent impedance of the two measurement points, so there is a numerical difference between |ZM11I| and |ZM12I|.
The DTW calculation is performed for the transient impedance of Figure 11a and the line mode impedance ZC of Figure 11b, and the normalized DTW distance is obtained as shown in Figure 11c. RGM and RGN are the normalized DTW distances of M11 and M12, respectively. Since the transient impedance is 0 when no fault occurs, the DTW distance before the 0 moments of Figure 11c is 1. After a fault occurs, the transient impedances on both sides are significantly different from ZC, and the DTW distance after the 0 moments of Figure 11c is less than the threshold value of 0.6. The results verify that the scheme can identify internal faults.
B.
External fault
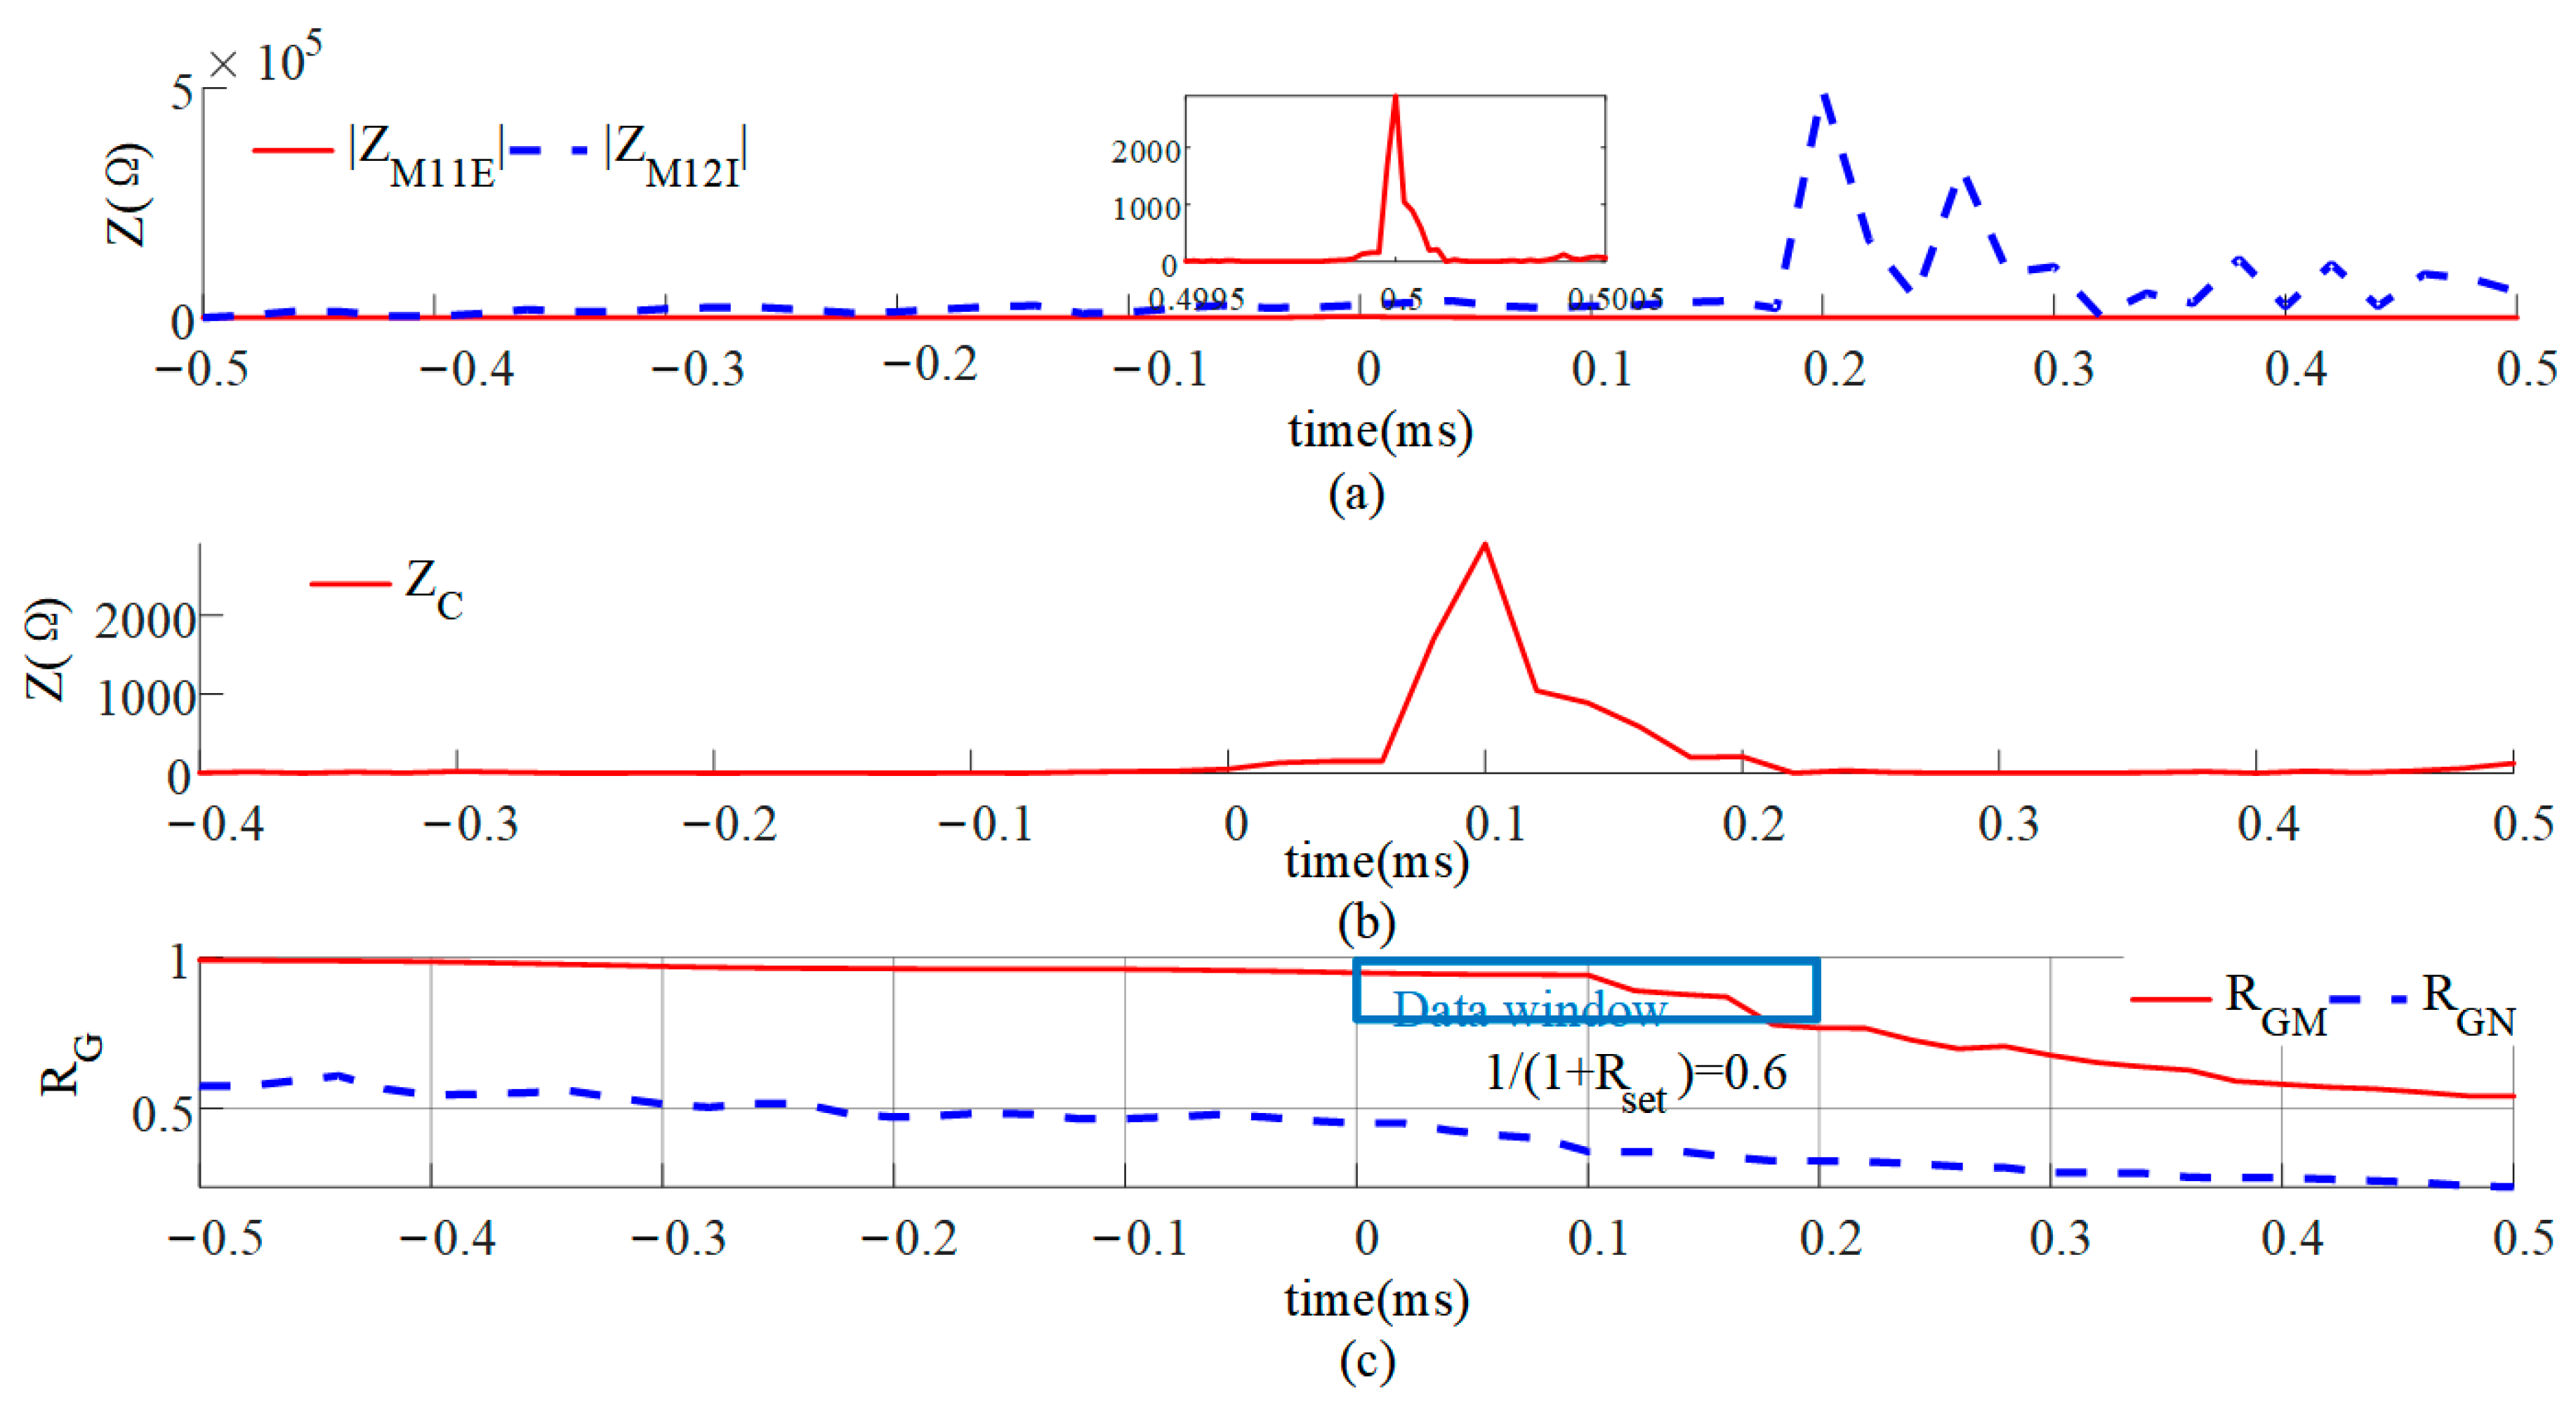
We set the reverse external fault F1, and the test results are shown in Figure 12. When F1 faults, the transient impedance of M11 is |ZM11E|, as shown in Figure 12a, and the transient impedance of M12 is |ZM12I|, as also shown in Figure 12a. Obviously, the impedance obtained from M11 is the same as the line mode impedance ZC of Line1, while the impedance obtained from M12 is the backside equivalent impedance. Therefore, the simulation result given in Figure 12c shows that the DTW distance RGM of M11 is higher than the threshold value of 0.6, while the DTW distance RGN of M11 is lower than the threshold value. Based on the fault identification criteria, the fault area can be correctly determined.

5.2. Distributed Capacitance

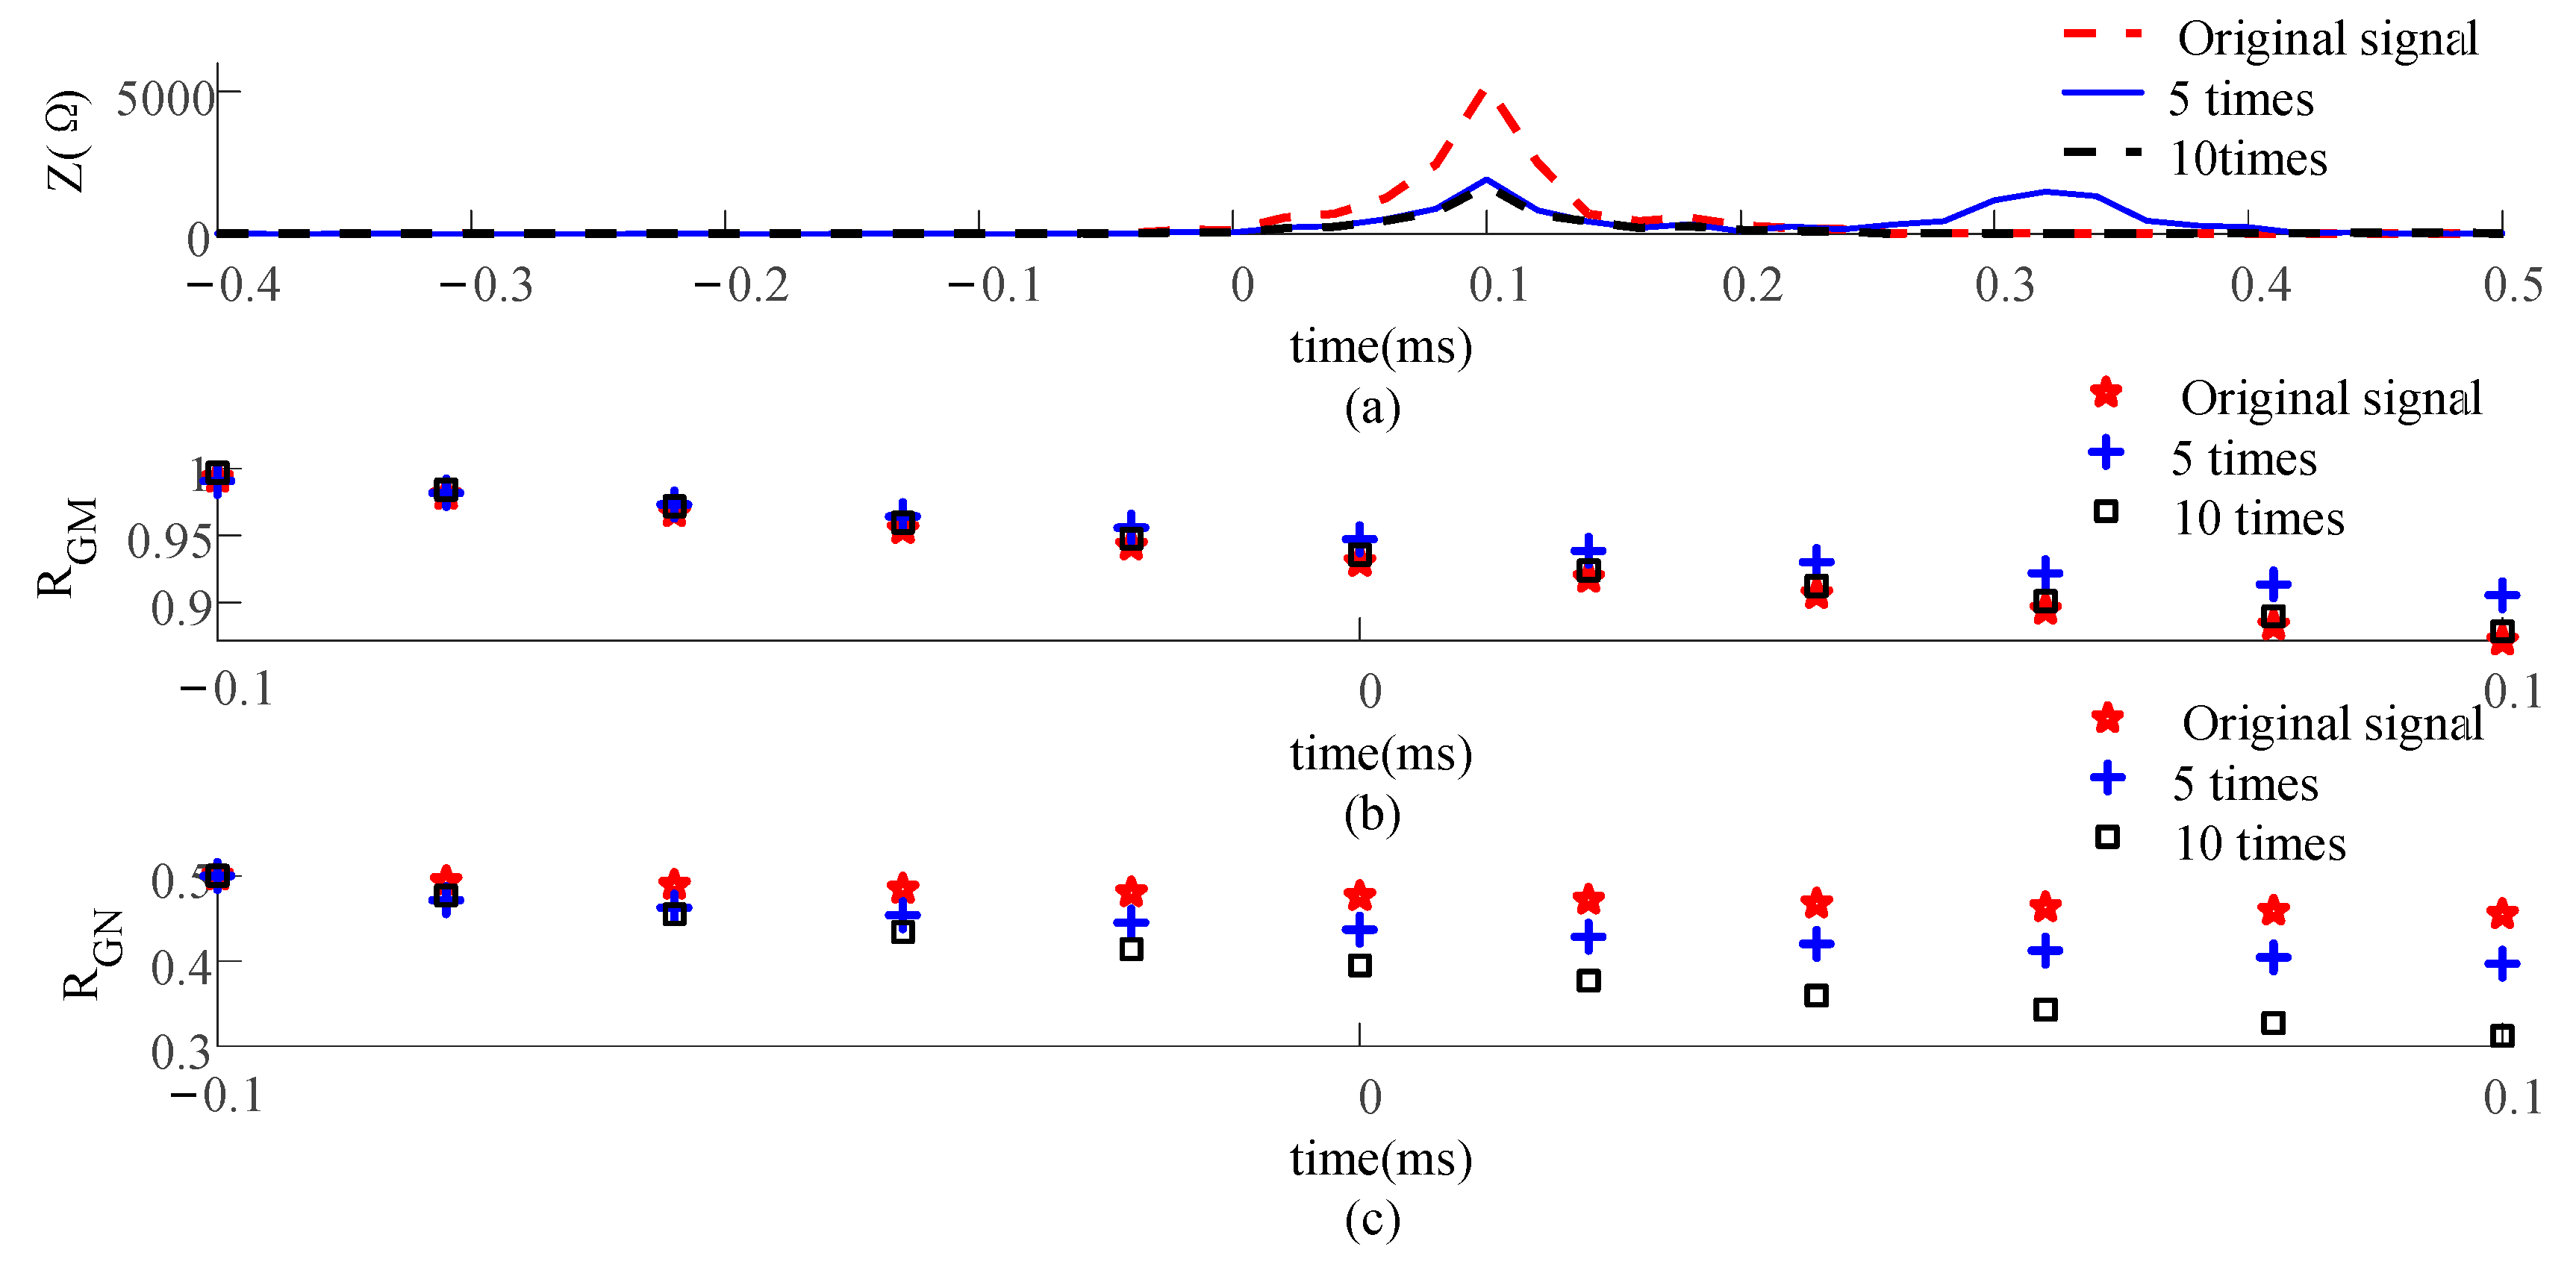
When the DC line is internally faulted, the charging and discharging states of the line distribution capacitors include (1) all capacitors discharging at the same time; (2) all capacitors charging at the same time; and (3) partial capacitor discharging and charging. The disorder characteristics of these three states will lead to the existence of oscillations in the fault current. The transient current characteristics of distributed capacitor electricity lead to the reduced performance of traditional current longitudinal protection. For the proposed scheme, the line distribution capacitance is only related to the line impedance ZC. Table 2 shows that the trend of ZC is to stabilize a certain value. The change in the distributed capacitance can only change the ZC at a certain frequency but cannot affect the trend of the whole ZC. According to Table 3, the variation in ZC does not change the difference between internal and external faults, i.e., the transient impedance of internal faults is different from ZC, while the transient impedance of external faults always exists at one end with the same ZC. Therefore, the proposed scheme is not affected by the distributed capacitance. The five times and ten times distributed capacitance are set up to verify the theory, respectively.
The test results for different distributed capacitances are shown in Figure 13. The results in Figure 13a show that the ZC decreases at this frequency when the distributed capacitance increases, which is characterized following Equation (6). The DTW distances of M11 and M12 are calculated separately, and the results are shown in Figure 13b,c, respectively. The RGM of the DTW distance of M11 is higher than the threshold, while the RGN of M12 is lower than the threshold and satisfies the criterion. Therefore, the distributed capacitance does not affect the reliability of the scheme.

5.3. Communication Delay

In practical engineering applications, protection devices generally use the ping–pong timing method, the accuracy of which is related to the transmission time difference. The sampling frequency of the proposed scheme is 50 kHz and the data window time is 0.2 ms, i.e., 10 sampling points. Considering that the transmission speed of the fiber optic signal is 4.9 μs/km, the transmission time of Line1 is 0.49 μs. Therefore, the action time of the scheme is no more than 0.3 ms.
We set the communication delay time as 0.1~0.5 ms, and the simulation results are shown in Table 4. Since the calculation of the DTW distance of the proposed scheme is performed at the local end, only the relative end transmits the judgment result. Therefore, the effect of a communication delay is very small, which is also verified by the results in Table 4.

5.4. Fault Resistance and Noise

Since the proposed scheme uses the characteristic value of the transient impedance, its nature is that it is not affected by the fault resistance [12]. Different fault resistances are set separately and the DTW distances are obtained as shown in Table 5. The DC distribution system considers 30 Ω as a high resistance fault and sets the fault resistance to 0~50 Ω considering the influence of the starting element. The test results verify its ability to accept resistance.
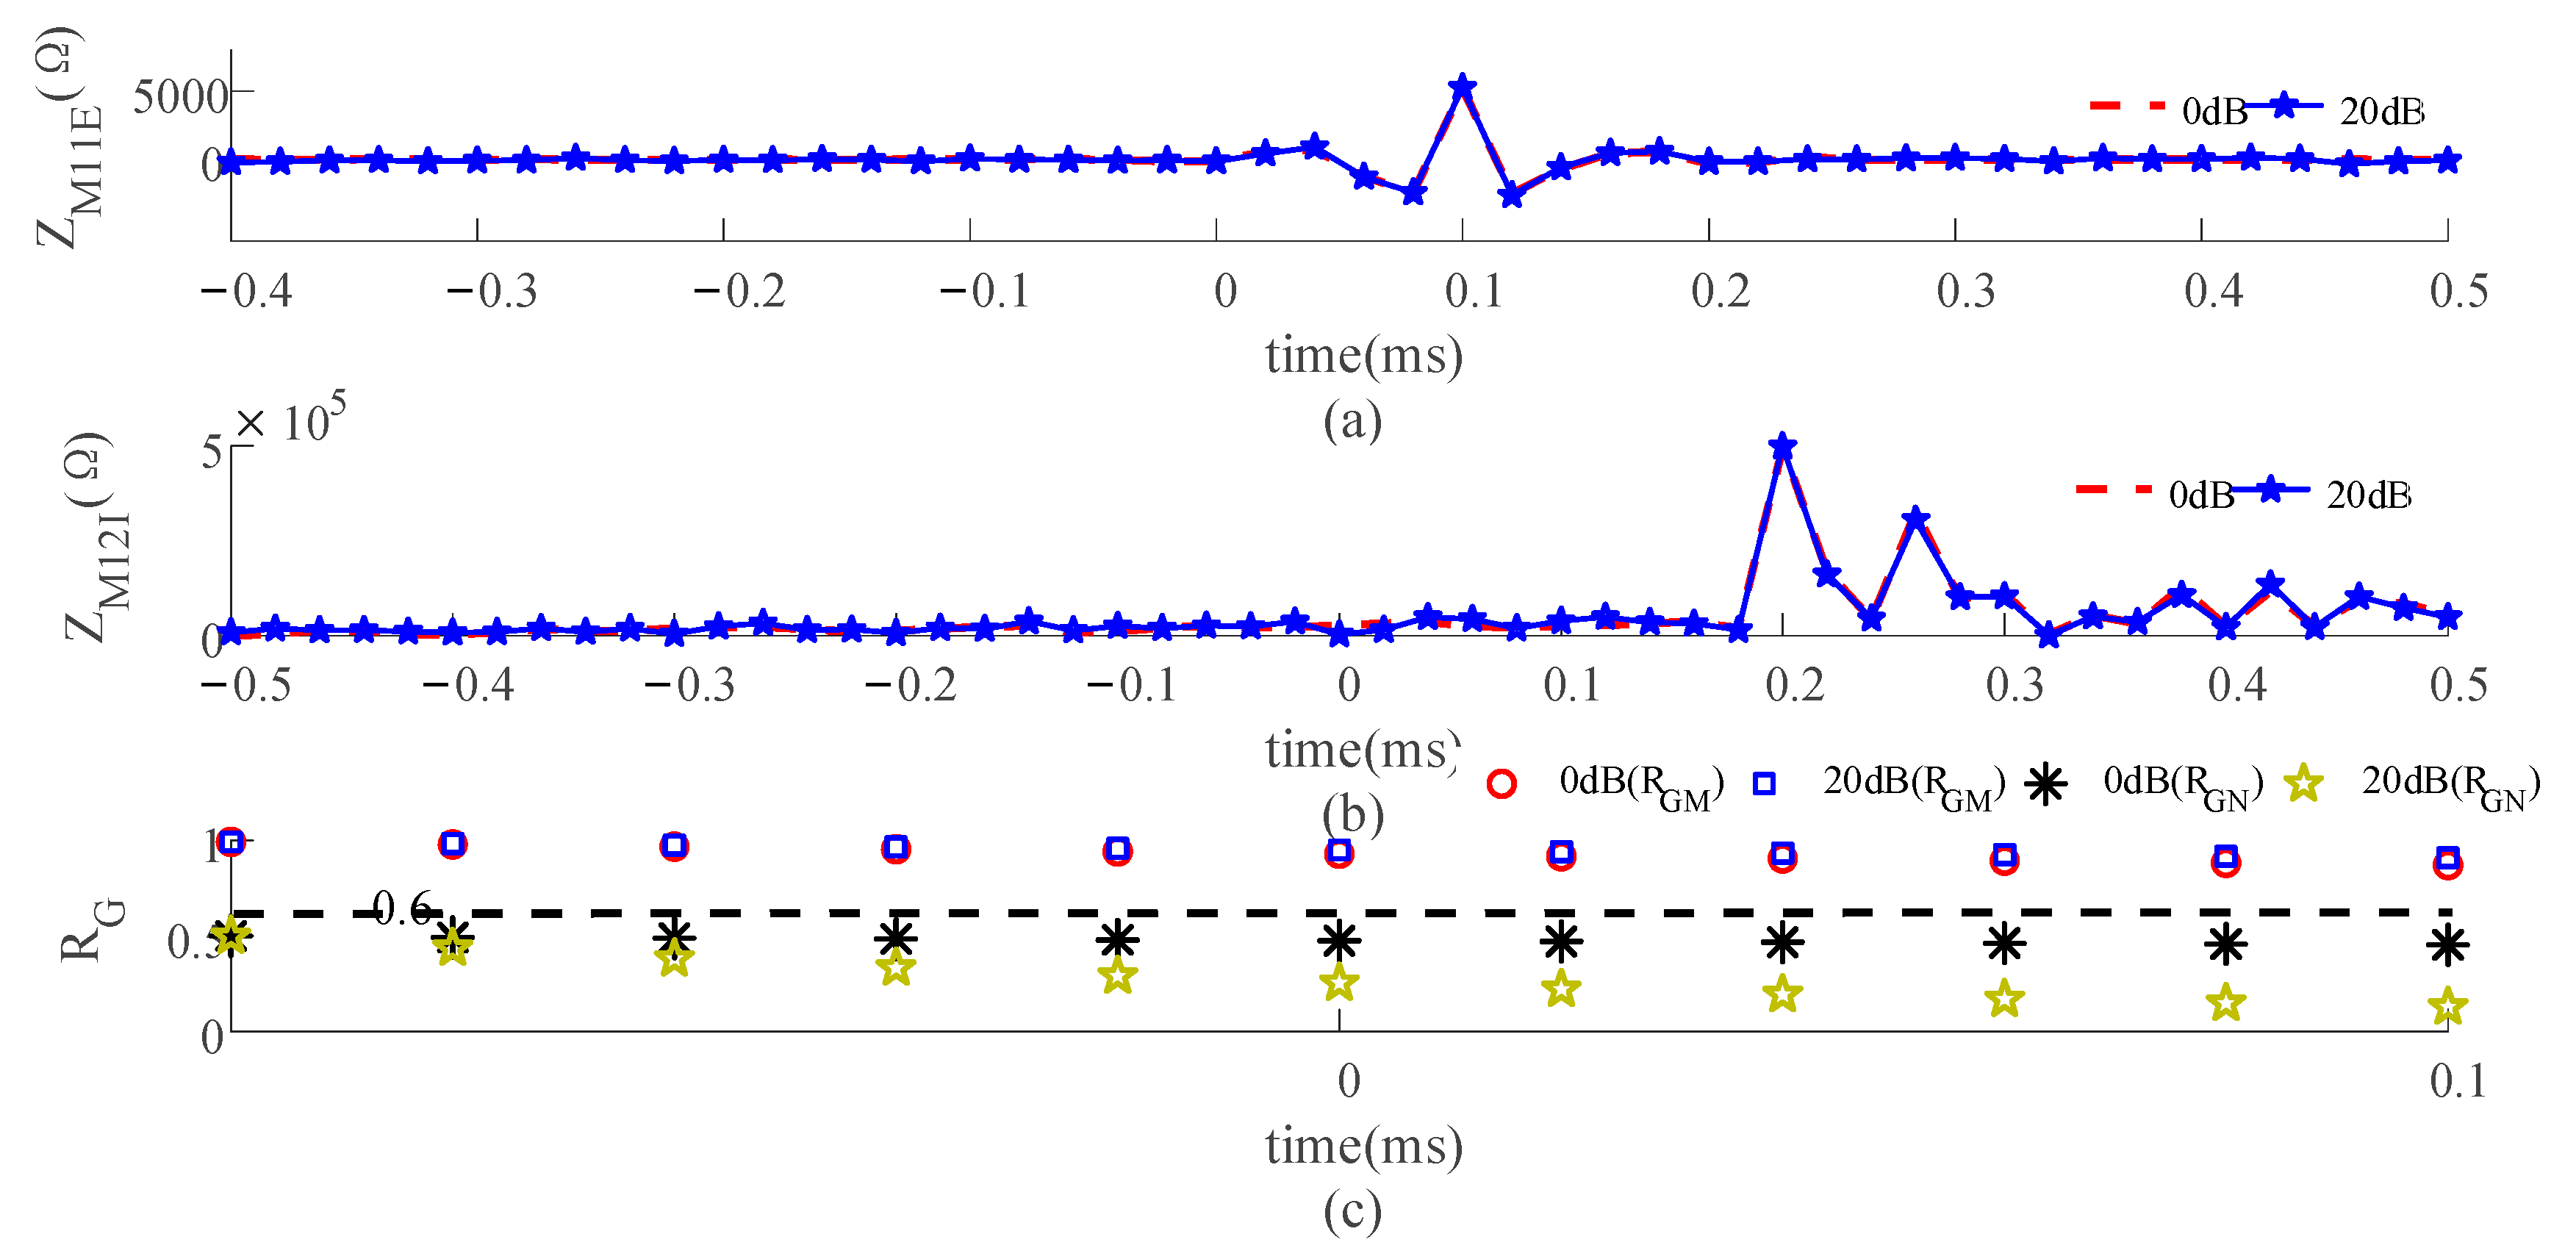
Noise interference is a factor that cannot be ignored. The worst case in DC systems is 20 dB of noise. We add 20 dB of white noise to the fault information to test its noise resistance. The simulation results are shown in Figure 14. Figure 14a,b represent the transient impedances of M11 and M12, respectively, and it is clear that the addition of noise does not have a significant effect on their values. Therefore, the DTW distance shown in Figure 14c still satisfies the criterion. The different noises have less influence on the proposed scheme.

5.5. Performance Comparison

Many protection schemes for flexible DC systems exist. To test the superiority of the proposed schemes, several typical schemes are compared. The schemes include current differential protection (CDP [11]), current direction protection (CDP [12]), high-speed directional pilot protection (HSDPP [14]), waveform-matching pilot protection (WMPP [17]), high-sensitivity current differential protection (HSCDP [21]), and AC/DC transient information protection (TIP [22]). The schemes are compared in terms of operation time, fault resistance, sampling frequency, noise, communication delay, and distributed capacitance, respectively, and the results are shown in Table 6. The comparison results show that, although not all performances of the proposed scheme are better than the other schemes, the performance in terms of key metrics (time, communication delay, and distributed capacitance) is better.

6. Conclusions

To solve the problems of distributed capacitance and communication delay, a protection technique based on normalized transient impedance DTW distance is proposed. Firstly, an equivalence model of the ring-shaped flexible DC distribution system is established. Based on this model, the fault equivalence circuit is analyzed and the expression of transient impedance is derived. Subsequently, the expressions of each part of the transient impedance are split and their amplitude–frequency characteristics are analyzed. It is worth noting that the distributed power of the transient impedance is also analyzed. This study shows that there is an internal fault when the transient impedance for each component is equivalent to the line impedance, while, for the external fault, there is always one end of the transient impedance for the line impedance. Finally, the normalized DTW distance is proposed to express the transient impedance characteristics of the local end to determine the forward and reverse faults. The DTW distance is transmitted to the opposite end to determine internal faults and external faults. The main innovations of the program are as follows:
(1)
An expression for the transient impedance of a flexible DC distribution network containing distributed power is derived for the first time, and its fault characteristics are analyzed.
(2)
Compared with the traditional current differential protection and current direction protection, the use of transient impedance makes the scheme independent of the distributed capacitance and fault resistance.
(3)
The use of normalized DTW distances allows the scheme to accept longer communication delays than traditional waveform-matching-based schemes.
However, the proposed program still has some issues that require further study:
(1)
Although the simulation model in Figure 1 is derived from actual engineering, its reliability in complex environments still needs to be considered. For example, whether transient faults occurring frequently can be detected and whether the transformer can operate accurately when the error is large need to be determined. Therefore, the reliability verification of the proposed scheme under responsible working conditions is a direction for future research.
(2)
As the DC distribution grid is connected to a large number of distributed power sources, such as photovoltaics, wind power, electric vehicles, etc., the equivalent impedance of the system is bound to change. Therefore, studying the impedance characteristics of other distributed power sources is also a direction for future work.

Author Contributions

P.N.: conceptualization, methodology, software, writing—original draft; J.H.: conceptualization, supervision, writing—review and editing; C.W.: resources, software, validation; D.Z.: conceptualization, methodology; Z.Y.: conceptualization, review; Z.X.: conceptualization, software, review. All authors have read and agreed to the published version of the manuscript.

Funding

This work is supported by the Science and Technology Project of the State Grid Corporation of China (No. 5400-202256273A-2-0-XG).

Institutional Review Board Statement

Not applicable.

Informed Consent Statement

Not applicable.

Data Availability Statement

The data that were used are confidential.

Conflicts of Interest

The authors declare that they have no known competing financial interests or personal relationships that could have appeared to influence the research reported in this study.

Abbreviations

DTWdynamic time warping
DCdirect current
ACalternating current
VSCvoltage source converter
ESSenergy storage system
PVphotovoltaic
ZVSC1 and ZVSC2converter impedance
ZL1, ZL2, ZL3, ZL4current-limiting reactor impedance
ZCline wave impedance
ZDCimpedance of DC/DC converter
ZESSimpedance of energy storage
ZPV1impedance of PV
Uf1, Uf2, and Uf3fault voltage source
M11, M12circuit breaker for Line1
M21, M22circuit breaker for Line2
M31, M32circuit breaker for Line3
M41, M42circuit breaker for Line4
F1reverse external fault
F2internal fault
F3positive external fault
ZM11Itransient impedance of M11 of external fault
ZM11Etransient impedance of M11 of internal fault
ZM12Itransient impedance of M12 of external fault
ZM12Etransient impedance of M12 of internal fault
ZM31Itransient impedance of M31 of external fault
ZM31Etransient impedance of M31 of internal fault
ZM32Itransient impedance of M32 of external fault
ZM32Etransient impedance of M32 of internal fault
ZM21I, ZM22I, ZM41I and ZM42Itransient impedance of M21, M22, M41, and M42
ZM21E, ZM22E, ZM41E and ZM42Etransient impedance of reverse fault
Uf(s)fault voltage
If(s)fault current
UfM (s)measuring point voltage
IfM(s)measuring point current
γ line propagation coefficient
R, L, G, and Cresistance, inductance, conductance, and capacitance
R0equivalent resistance of the converter
Larmequivalent inductance for bridge arms
Csmequivalent capacitance of the converter
N1number of submodules
CDCequivalent capacitance of the DC/DC converter
Iγphotogenerated current
γlight intensity
Udjunction voltage
I0reverse saturation current
Rsseries resistance
Rpparallel resistance
Uload voltage
Iload current
Aideal factor of the diode
KBoltzmann constant
Tabsolute temperature
qelectronic charge
RSSsolution resistance
Cdlcapacitance of the electrode to the electrolyte solution
ZFFaraday impedance
nstoichiometric coefficient
FFaraday constant
Cselectrode surface activity
Ddiffusion coefficient
λ the number of reaction stages
D(x,y)Euclidean distance between the vector x(x1, x2) and the vector y(y1,y2)
Cdata matrix
Rsetthreshold value
RM and RNDTW distances
ZMItransient impedance
i current increment
INDC rated current
RGM\GNnormalized DTW distance
CDP [11]current differential protection of [11]
CDP [12]current differential protection of [12]
HSDPPhigh-speed directional pilot protection
WMPPwaveform-matching pilot protection
HSCDPhigh-sensitivity current differential protection
TIPtransient information protection

References

  1. Baran, M.E.; Mahajan, N.R. DC distribution for industrial systems: Opportunities and challenges. IEEE Trans. Ind. Appl. 2003, 39, 1596–1601. [Google Scholar] [CrossRef]
  2. Wang, Y.; Song, Q.; Sun, Q.; Zhao, B.; Li, J.; Liu, W. Multilevel MVDC Link Strategy of High-Frequency-Link DC Transformer Based on Switched Capacitor for MVDC Power Distribution. IEEE Trans. Ind. Electron. 2017, 64, 2829–2835. [Google Scholar] [CrossRef]
  3. Castill-Calzadilla, T.; Cuesta, M.A.; Quesada, C.; Olivares-Rodriguez, C.; Macarulla, A.M.; Legarda, J.; Borges, C.E. Is a massive deployment of renewable-based low voltage direct current microgrids feasible? Converters, protections, controllers, and social approach. Energy Rep. 2022, 8, 12302–12326. [Google Scholar]
  4. Meghwani, A.; Srivastava, S.C.; Chakrabarti, S. A Non-unit Protection Scheme for DC Microgrid Based on Local Measurements. IEEE Trans. Power Deliv. 2017, 32, 172–181. [Google Scholar] [CrossRef]
  5. Aeishwarya, B.; Kaushik, D.; Matti, K.; Anca, D.H. Multi-Voltage Level Active Distribution Network With Large Share of Weather-Dependent Generation. IEEE Tran. Power Sys. 2022, 37, 4874–4884. [Google Scholar]
  6. Zhang, L.; Liang, J.; Tang, W.; Li, G.; Cai, Y.; Sheng, W. Converting AC converting AC distribution lines to DC to increase transfer capacity and DG penetration. IEEE Trans. Smart Grid 2019, 10, 1477–1487. [Google Scholar] [CrossRef]
  7. Li, B.; He, J.; Li, Y.; Li, R. A novel solid-state circuit breaker with selfadapt fault current limiting capability for LVDC distribution network. IEEE Trans Power Electron 2019, 34, 3516–3529. [Google Scholar] [CrossRef]
  8. Duan, J.D.; Li, Z.N.; Zhou, Y.; Wei, Z.Y. Study on the voltage level sequence of future urban DC distribution network in China: A Review. Int. J. Electr. Power Energy Syst. 2020, 117, 105640. [Google Scholar]
  9. Emhemed Abdullah, A.S.; Kenny, F.; Steven, F.; Graeme, M.B. Validation of fast and selective protection scheme for an LVDC distribution network. IEEE Trans. Power Deliv. 2017, 32, 1432–1440. [Google Scholar] [CrossRef]
  10. Wu, T.H.; Dai, W.; Li, X.D. Protection scheme and device development of flexible dc distribution network. Autom. Electr. Power Syst. 2019, 43, 123–130. [Google Scholar]
  11. Fletcher, S.D.A.; Norman, P.J.; Fong, K.; Galloway, S.J.; Burt, G.M. High-Speed Differential Protection for Smart DC Distribution Systems. IEEE Trans. Smart Grid 2014, 5, 2610–2617. [Google Scholar] [CrossRef]
  12. Song, G.; Cai, X.; Li, D.; Gao, S.; Suonan, J. A novel pilot protection principle for VSC-HVDC cable lines based on fault component current. In Proceedings of the 2012 Power Engineering and Automation Conference, Wuhan, China, 18–20 September 2012; pp. 1–4. [Google Scholar]
  13. Song, G.B.; Hou, J.J.; Guo, B. Pilot protection of flexible dc grid based on active detection. Power Syst. Technol. 2020, 5, 6. [Google Scholar]
  14. Li, B.; He, J.; Li, Y.; Li, B.; Wen, W. High-speed directional pilot protection for MVDC distribution systems. Int. J. Electr. Power Energy Syst. 2020, 121, 106141. [Google Scholar] [CrossRef]
  15. Song, G.B.; Luo, J.; Gao, S.P.; Wang, X.W.; Tassawar, K. Detection method for single-pole grounded faulty feeder based on parameter identification in MVDC distribution grids. Int. J. Electr. Power Energy Syst. 2018, 97, 85–92. [Google Scholar] [CrossRef]
  16. Shi, B.; Li, Y.; Sun, G. DC fault protection strategy for multi-terminal flexible DC distribution network based on full fault current information. High Voltage Eng. 2019, 45, 3076–3083. [Google Scholar]
  17. Qin, Y.; Wen, M.; Bai, Y.; Wang, Y.; Wang, X.; Fang, Z. A novel pilot protection scheme for HVDC lines based on waveform matching. Int. J. Electr. Power Energy Syst. 2020, 120, 106028. [Google Scholar] [CrossRef]
  18. Li, Z.; Zou, G.B.; Tong, B.B.; Gao, H.L.; Feng, Q. Novel traveling wave protection method for high voltage DC transmission line. In Proceedings of the 2015 IEEE Power & Energy Society General Meeting, Denver, CO, USA, 26–30 July 2015; pp. 1–5. [Google Scholar]
  19. Liu, J.; Tai, N.L.; Fan, C.J. Transient-voltage-based protection scheme for DC line faults in the multiterminal VSC-HVDC system. IEEE Trans. Power Deliv. 2017, 32, 1483–1494. [Google Scholar] [CrossRef]
  20. He, J.; Li, B.; Li, Y.; Qiu, H.; Wang, C.; Dai, D. A fast directional pilot protection scheme for the MMC-based MTDC grid. Proc. CSEE 2017, 37, 6878–6887. [Google Scholar]
  21. Liu, H.; Li, B.; Wen, W.; Green, T.C.; Zhang, J.; Zhang, N.; Chen, L. Ultra-fast current differential protection with high-sensitivity for HVDC transmission lines. Int. J. Elect. Power Energy Syst. 2021, 126, 106580. [Google Scholar] [CrossRef]
  22. He, Y.; Zheng, X.; Tai, N.; Wang, J.; Nadeem, M.H.; Liu, J. A DC line protection scheme for MMC-Based DC grids based on AC/DC transient information. IEEE Trans. Power Del. 2020, 35, 2800–2811. [Google Scholar] [CrossRef]
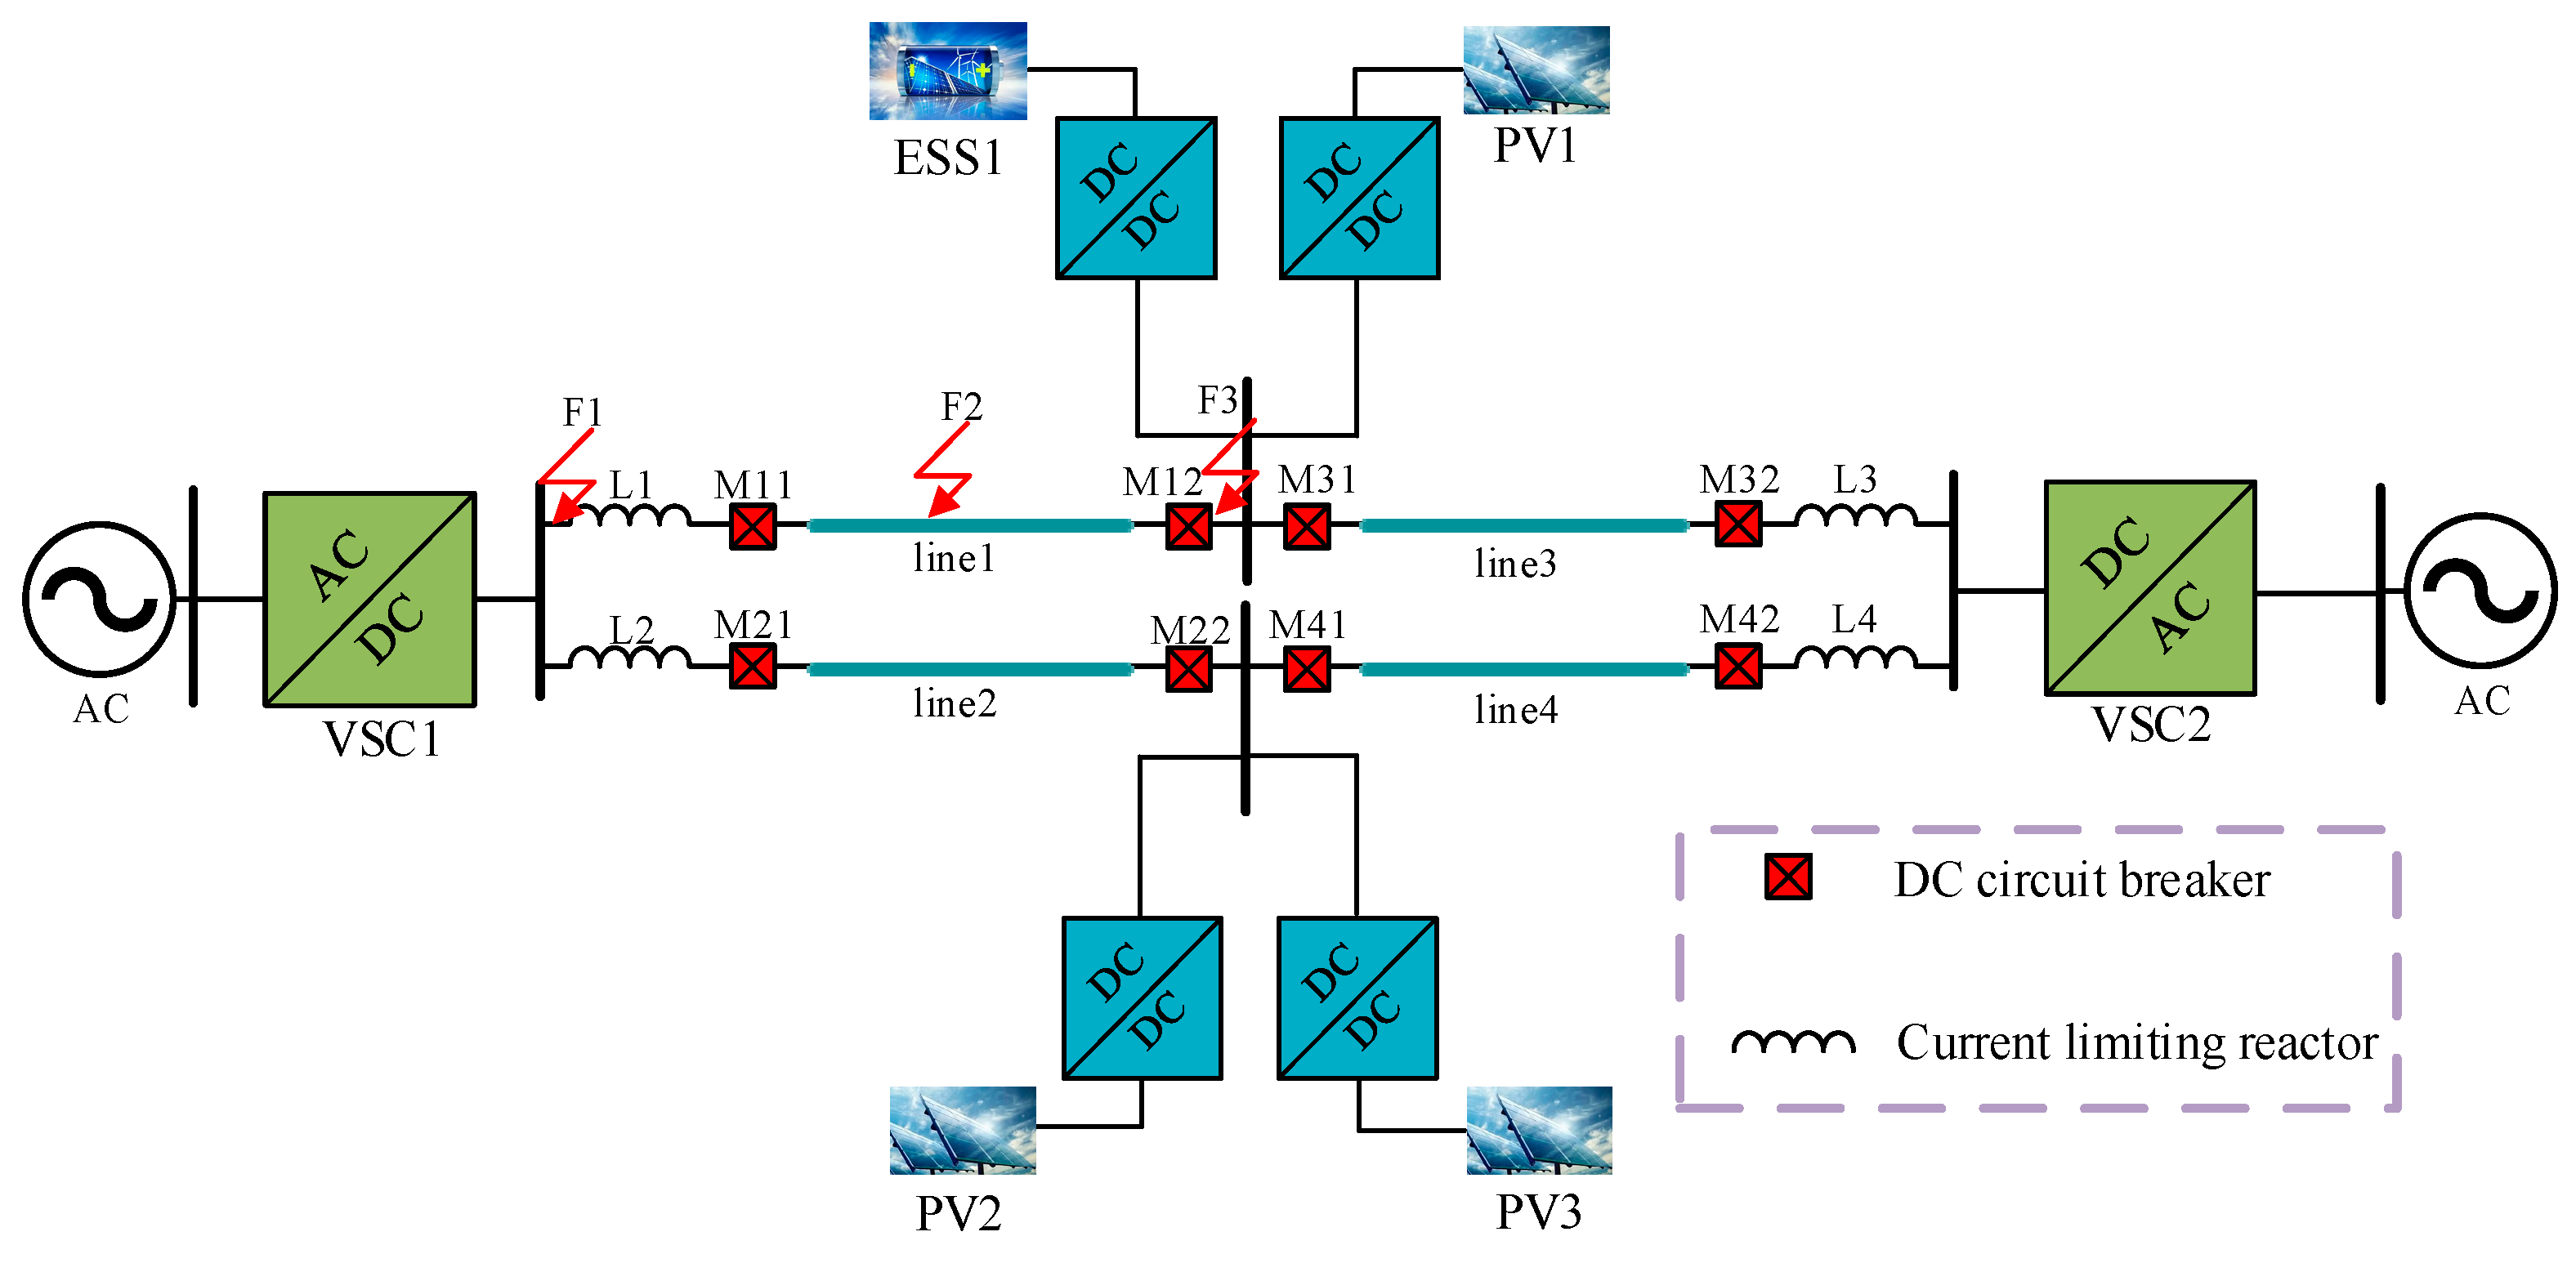
Figure 1. Structure diagram of ring-shaped flexible DC power distribution system.
Sustainability 15 12745 g001
Figure 2. (a) Fault equivalent circuit of Line1; (b) fault equivalent circuit of Line3.
Sustainability 15 12745 g002
Figure 3. (a) Fault equivalent circuit of Line2; (b) fault equivalent circuit of Line4.
Sustainability 15 12745 g003
Figure 4. Tower DC2 of the DC transmission line.
Sustainability 15 12745 g004
Figure 5. (a) Half-bridge sub-module; (b) full-bridge sub-module; (c) MMC equivalent circuit of fault phase.
Sustainability 15 12745 g005
Figure 6. The topology of dual-active-bridge DC converters.
Sustainability 15 12745 g006
Figure 7. Accurate equivalent circuit model of a photovoltaic cell.
Sustainability 15 12745 g007
Figure 8. Impedance model of lithium-ion battery electrode system.
Sustainability 15 12745 g008
Figure 9. (a) Euclidean distance; (b) DTW.
Sustainability 15 12745 g009
Figure 10. Flow chart of the proposed protection operation.
Sustainability 15 12745 g010
Figure 11. Simulation results of the internal fault: (a) transient impedance of M11 and M12; (b) line-mode impedance of Line1; and (c) DTW distance for M11 and M12.
Sustainability 15 12745 g011
Figure 12. Simulation results of the external fault (F1): (a) transient impedance of M11 and M12; (b) line-mode impedance of Line1; and (c) DTW distance for M11 and M12.
Sustainability 15 12745 g012
Figure 13. Test results of distributed capacitance (F1): (a) ZC with different distributed capacitance; (b) DTW distance of M11 with different distributed capacitance; and (c) DTW distance of M12 with different distributed capacitance.
Sustainability 15 12745 g013
Figure 14. Test results of noise (F1): (a) ZM11E with different noise; (b) ZM12I with different noise; and (c) DTW distance of M11 and M12.
Sustainability 15 12745 g014
Table 1. Parameters of the DC transmission line.
Line TypeParameterValue and Unit
WireWire radius0.0203454 (m)
DC resistance0.03206 Ω (km)
Ground wireGround radius0.0055245 (m)
DC resistance2.8645 Ω (km)
Ground resistivity100 Ω·m
Table 2. Amplitude–frequency characteristics of line impedance.
Impedance TypeFrequency (Hz)Impedance (Ω)
Line-mode wave impedance0.01798.5
1312.4
100256.7
10,000255.1
1,000,000254.5
Ground-mode wave impedance0.01803.1
1782.8
100650.8
10,000512.5
1,000,000455.3
Table 3. Summary of transient impedance variability.
ForwardReverseFormula
M11ZL1 + ZVSC1//(ZL2 + ZC)ZCZVSC1,2,3,4 = 2/3R0 + 2/3sLarm + 1/(6Csm/N1)
ZL1,2,3,4 = 2πfL
ZC = [(R + sL)/(G + sC)]1/2
ZDC = ½πCDC
ZESS = RSS + 1/(jωCdl + 1/ZF)
Z PV 1 , 2 , 3 = U I = U d / ( I γ I 0 [ exp ( q U d A K T ) 1 ] U d R P ) R s
M12ZVSC2//(ZDC + ZESS)//(ZDC + ZPV1)//(ZL3 + ZC)
M21ZL1 + ZVSC1//(ZL1 + ZC)
M22ZVSC1//(ZDC + ZPV2)//(ZDC + ZPV3)//(ZL4 + ZC)
M31ZVSC1//(ZDC + ZESS)//(ZDC + ZPV1)//(ZL1 + ZC)
M32ZL3 + ZVSC1//(ZL4 + ZC)
M41ZVSC1//(ZL2 + ZC)//(ZDC + ZPV2)//(ZDC + ZPV3)
M41ZL4 + ZVSC2//(ZL3 + ZC)
Table 4. Test results of communication delay (F2).
Communication Delay (ms)RGMRGNResult
0.10.9870.979Operation
0.20.9750.963
0.30.8740.820
0.40.9410.917
0.50.9150.845
Table 5. Test results of fault resistance (F2).
Fault Resistance (Ω)RGMRGNResult
100.9910.966Operation
200.9320.950
300.9170.901
400.9810.947
500.9750.950
Table 6. Comparison results of program performance.
ConditionsProposedCDP [11]CDP [12]HSDPP [14]WMPP [17]HSCDP [21]TIP [22]
Time (ms)0.3201522>3.015
Fault resistance (Ω)505050100100100100
Sampling frequency (kHz)50101050101020
Noise (dB)20303030203030
Communication delay (ms)0.50.10.30.10.20.20.1
Distributed capacitance (times)10356574
Disclaimer/Publisher’s Note: The statements, opinions and data contained in all publications are solely those of the individual author(s) and contributor(s) and not of MDPI and/or the editor(s). MDPI and/or the editor(s) disclaim responsibility for any injury to people or property resulting from any ideas, methods, instructions or products referred to in the content.