Article

Analyses of Vineyard Microclimate in the Eastern Foothills of the Helan Mountains in Ningxia Region, China

1
Key Laboratory for Meteorological Disaster Monitoring Early Warning and Risk Management of Characteristic Agriculture in Arid Regions, China Meteorological Administration, Yinchuan 750002, China
2
Ningxia Hui Autonomous Region Institute of Meteorological Sciences, Yinchuan 750002, China
3
School of Agriculture, Ningxia University, Yinchuan 750021, China
*
Author to whom correspondence should be addressed.
Sustainability 2023, 15(17), 12740; https://doi.org/10.3390/su151712740
Submission received: 6 July 2023 / Revised: 9 August 2023 / Accepted: 21 August 2023 / Published: 23 August 2023

Abstract

:
Vineyard microclimate is a main determining factor for grape yield and quality. In the Eastern Foothills of the Helan Mountains in the Ningxia region, China, grape is a critical economic crop for wine making. The microclimate of vineyards in 2019 and 2020 was analyzed on the basis of observations from eight vineyards microclimate stations and a national reference station. The vineyard microclimate was compared with the larger-scale local weather conditions, and the vineyard microclimate was compared within and among different climatic zones. In addition, the climate was evaluated at the four study wine grape areas. The results showed that: (1) In the same wine-grape-growing area where the climate was similar, vineyard microclimate was affected by elevation, topography, and soil texture. (2) Excepting average wind velocity, there were no statistically significant (p < 0.05) differences in minimum and maximum air temperatures or relative humidity between the study field microclimate observation stations and the local national reference station. (3) Among the four climate-zone-based wine-grape-growing areas, vineyard microclimate was related to topography, geographical location, and soil type. In particular, the Yinchuan and Qingtongxia areas had an abundant heat resource, and the Hongsipu area had sufficient precipitation and high photosynthetically active radiation (PAR). By contrast, the Shizuishan area had a relatively low-to-moderate amount of heat, precipitation, and radiation resources for grape. (4) According to the climate assessment of agricultural products—wine grape (QX/T 557—2020), the climate was superior in 2019 than in 2020 for wine grapes. In particular, the climate for grape was better in the Yinchuan area than in other study areas. The results of this study are evidence-based and could be used to assist the local wine grape community in making decisions about cultivars, management practices, area expansions, marketing strategies, etc.

1. Introduction

Chinese culture has a long history of grape cultivation. Among all the main wine grape-growing regions (30°–45° N) in China, the Eastern Foothills of the Helan Mountains (37.72°–39.38° N and 105.75°–106.78° E, situated in Northwest China) has the most suitable hydrothermal conditions for wine grape. As of 2018, the regional planting area for wine grape has reached 380 km2; as of 2020, it has become a new high-quality wine grape region in China [1,2]. However, climate change has been negatively affecting the ripening of wine grape. The area of climate zones suitable for wine grape production showed a shrinking trend in both historical analyses [3] and future scenario projections [4].
All aspects of the soil–plant–atmosphere interactions are known to control grape berry composition [5,6]. Changes in climatic elements within the year affect grape growth, grape quality potential and, hence, wine making [7,8,9]. From macro- to micro-climate, the climate can be divided into different interdependent scales [10]. Vineyard microclimate is related to not only the macroclimate background but also the growth, development, and physiological activities of grape plants, soil, water, and other cultivation conditions. The superposition of various elements constitutes the variation law and spatial distribution of microclimate elements in a vineyard, making it more complex and diverse. The vineyard microclimate has a relatively small scale, and the internal climatic elements do not easily mingle with the external factors in a larger-scale environment. The vineyard microclimate greatly impacts the growth and development of grapevines and, ultimately, the quality of wine grapes. Different sources of spatial variations were examined from mesoscale to microscale in vineyards [11]. The effect of microclimate on hilly vineyards has been studied [12]. Matese et al. [13] developed a new indices able to discriminate differences in microclimates.
Climate quality assessment focusing on wine-grape-growing regions has been reported in other countries [14] but rarely in China.
In this study, the objectives of the study were as follows: (1) Comprehensively assess the characteristics of the microclimate at eight typical local vineyards, and comprehensively analyze differences between the same and different production areas at those vineyards. (2) Compare the vineyard microclimate with the larger-scale local climate to quantify the variances, and (3) evaluate the climatic quality of Cabernet Sauvignon and Chardonnay in four wine grape sub-appellations for 2019 and 2020 according to the climate quality evaluation model (QX/T 557—2020). The results of this study are scientific evidence that could be used to assist local wine grape producers in making decisions in cultivar selection, management practices, winery expansion, wine price setting, etc.

2. Materials and Methods

2.1. Study Region

This study focused on the four major climate-zone-based wine-grape-growing areas (also the administrative divisions) in the Eastern Foothills of the Helan Mountains in the Ningxia region, China: Shizuishan, Yinchuan, Qingtongxia, and Hongsipu. The elevations of the research areas range from 1090 to 1736 m, with an increase from the north to the south (Figure 1). There are eight typical wineries in the four research areas (Table 1), and the largest-scale winery is D. F. Yuxing Winery in the Hongsipu area. In the Yinchuan area, Chateau Yunmo Greatwall is on a larger scale than the remaining three wineries. During the research period of 2019–2020, the daily data were obtained from one national reference station and 5 min data from eight field microclimate automatic observation stations from Ningxia Information Center. The weather elements include: air temperature (°C), precipitation (mm), relative humidity (RH) (%), wind velocity (m·s−1), soil temperature (°C), and photosynthetically active radiation (PAR) (W·m−2). The microclimate elements include air temperature at 50 and 150 cm; past 1 h precipitation; precipitation day; relative humidity at 50 and 150 cm; PAR; mean soil temperature at 10, 20, 30, 40, and 50 cm; average wind velocity; and wind direction at 600 cm. Due to a system error, wind direction data in 2019 were missing at all eight microclimate automatic observation stations. In northern China, the period of burying wine grapes usually lasts from late October until March of the next year, the period of unearthed wine grapes is in April, the period of veraison is in July and August, and the ripening period is in September and October.

2.2. Climate Quality Assessment

Climate assessment for agricultural products—Wine grape (QX/T 557—2020) (Equation (1)) [15] is provided by the China Meteorological Administration, along with the grading scales (Table 2).
The climate quality index IQ was calculate as following:
I Q = i = 1 5 a i M i
where IQ is the climate assessment index for wine grape; ai is the weight coefficient of climatic indicator i; a1a5 is the corresponding weight of water heating value (IRT, Equation (2)) (0.3), total effective temperature (Ae, Equation (3)) (0.2), sunshine hours during the growing period for grape (S) (0.2), precipitation during the 30 days before harvest (R30) (0.2), and average temperature during the 30 days before harvest (T30) (0.1); and Mi is the hierarchical assignment of climatic indicator i (Table 3).
I R T = j = m n ( P j · T j )
where IRT is the water heating value (°C·mm); j indicates the serial number of month; m indicates the serial number of wine grape germination month; n indicates the serial number of wine grape maturity month; Pj (mm) is the total precipitation during the grape growing month j (if fewer than 30 days, precipitation will be summed up for all the actual days); and Tj is the mean temperature during the grape-growing month j (if fewer than 30 days, mean daily temperature will be averaged for all the actual days).
A e = k = p q ( T k 10 )
where Ae (°C·d) is the total effective temperature; Tk is the daily average temperature; and p and q are the beginning and ending dates of the period of interest (when daily average temperature is consecutively greater than or equal to 10 °C within the growing period for grape), respectively.
S is sunshine hours in grape growth period. R30 is precipitation 30 days before harvest. And T30 is average temperature 30 days before harvest.

2.3. Statistical Analyses

In SPSS 22 (IBM, Armonk, NY, USA), the Mann–Whitney test was used to determine the statistical significance (at p < 0.05) of the differences in meteorological elements between various groups [16].

3. Results

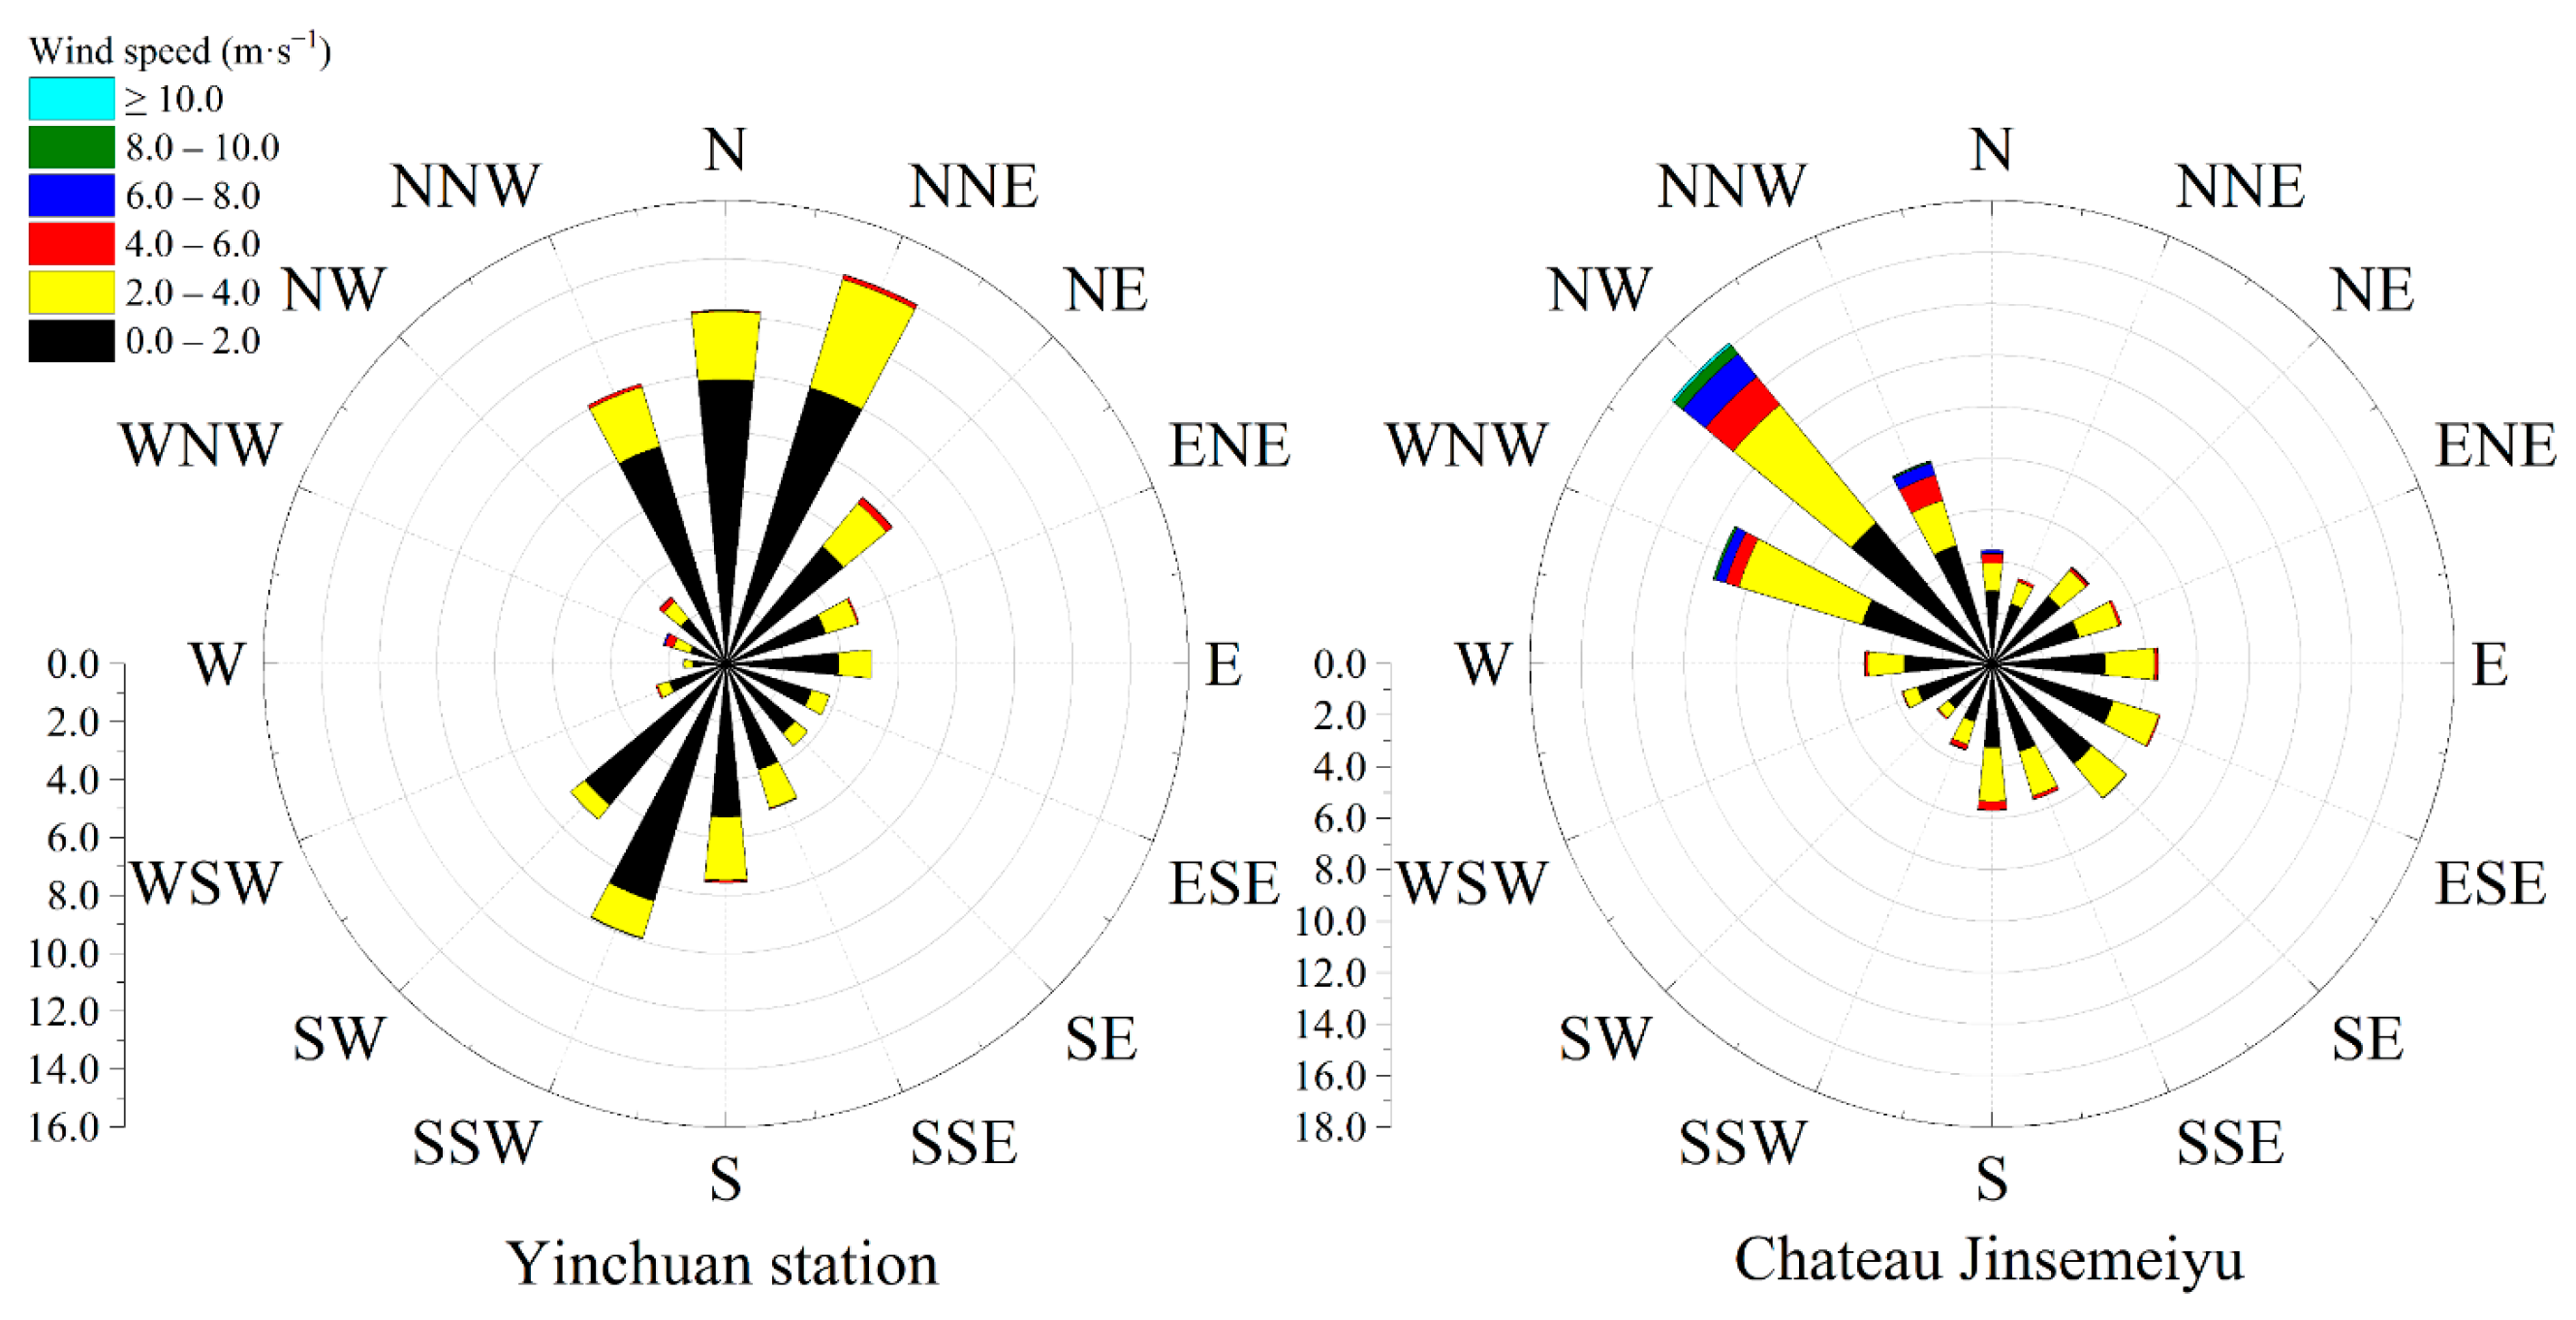
3.1. Vineyard Microclimate at Chateau Jinsemeiyu

3.1.1. Microclimate during the Year and the Growing Period for Grape at Chateau Jinsemeiyu

Chateau Jinsemeiyu was chosen as the representative vineyard to depict the typical microclimate in the study areas. The annual maximum temperature (Tmax) at Chateau Jinsemeiyu in 2019 and 2020 was comparable. During the growing period for grapes, the majority of annual precipitation was concentrated within the grape-growing period. Additionally, both soil temperature at a depth of 20 cm and PAR were averaged higher during the grape-growing period than during the year (Table 4).
Windbreak and sand fixation trap snow or hold precipitation over winter, and they are very important for protecting the ecological environment of vineyards. In 2020, the average wind velocity was higher at Chateau Jinsemeiyu than at the national reference station, Yinchuan. At Chateau Jinsemeiyu, the maximum wind velocity was 12.1 m·s−1 and the main wind direction was northwest (accounting for 16% of the total wind) (Figure 2).
During both the year and the growing period for grape, mean RH at 50 cm was slightly higher than mean RH at 150 cm. The soil temperature at the five depths of 10, 20, 30, 40, and 50 cm was greater during the growing period for grape (above 18 °C) than during the year (above 12 °C) (Table 5).

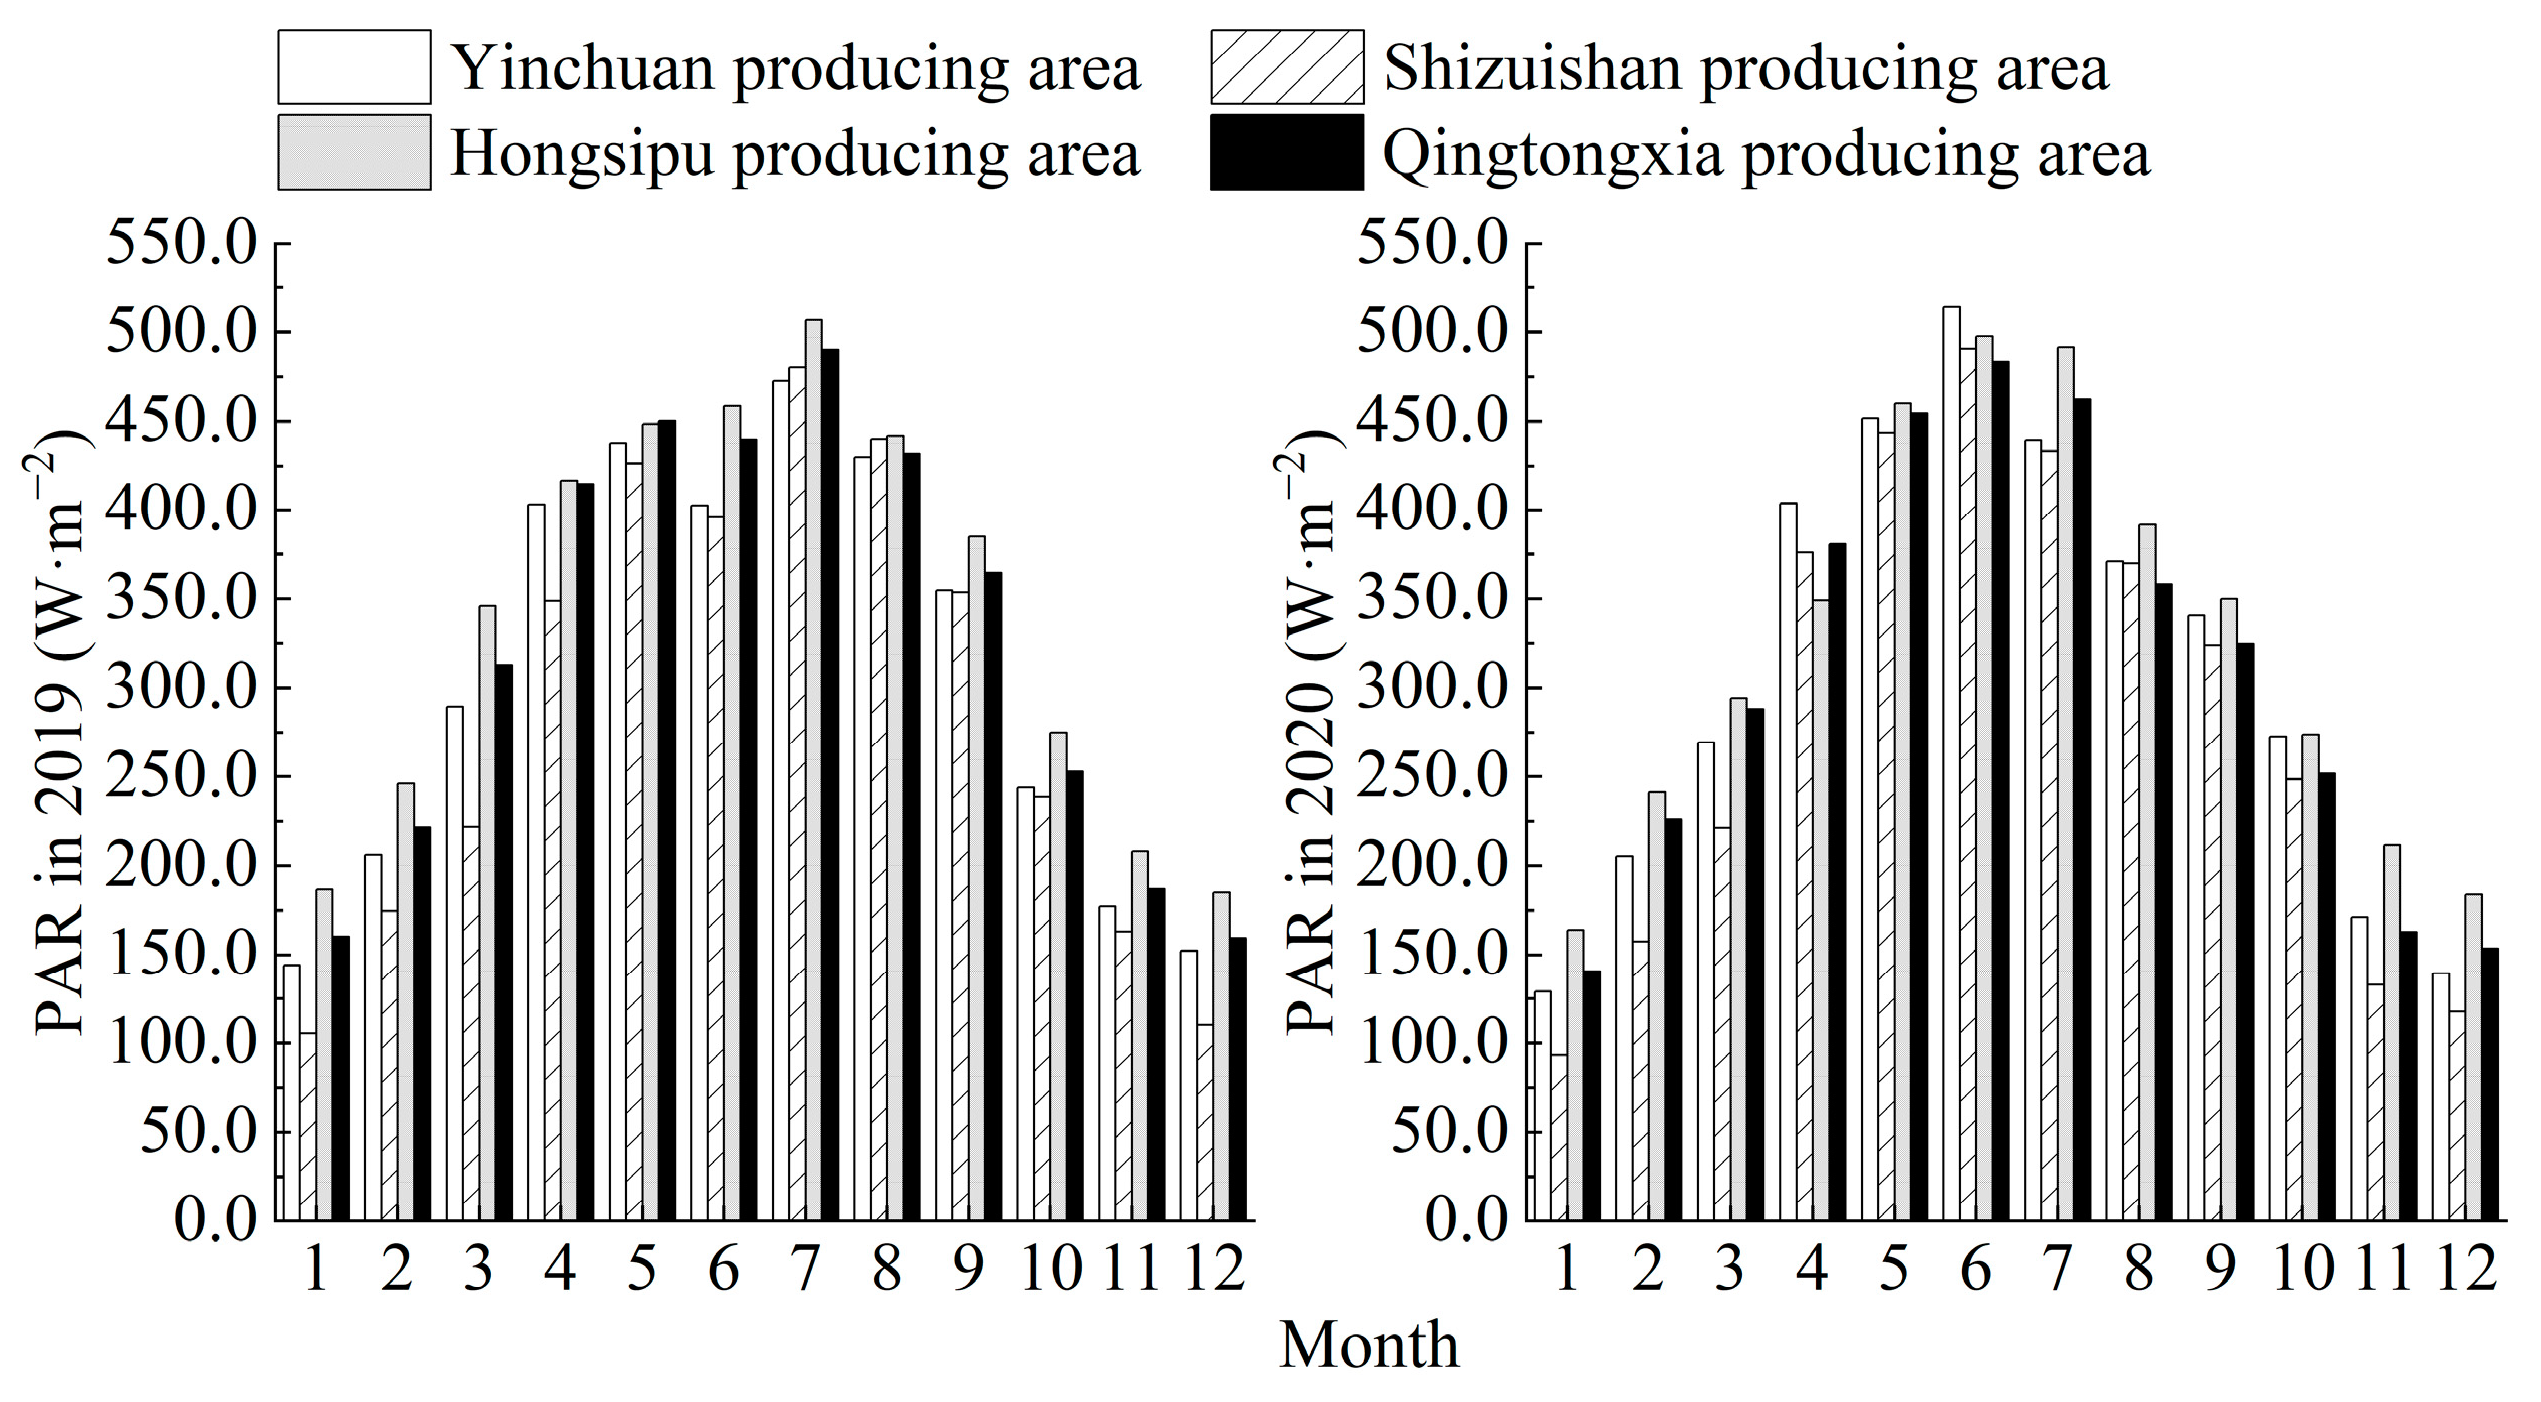
3.1.2. Monthly Microclimate at Chateau Jinsemeiyu

At Chateau Jinsemeiyu, the monthly minimum air temperature in 2020 was overall lower than that in 2019. In particular, the December minimum air temperature was below −20 °C in 2020 (Figure S1). The monthly precipitation was relatively high from May to September. In 2019, the number of days with precipitation peaked in June at Chateau Jinsemeiyu. In 2020, the number of days with precipitation was similar in July, September, and October (Figure S2). The monthly mean RH was lower in 2019 than in 2020. In both years, the monthly mean RH was the lowest in March and the highest in September (Figure S3a). The monthly PAR during the year showed a normal distribution, with a peak in July in 2019 and in June in 2020 (Figure S3b). The magnitudes of soil temperature range at all three depths were greater in 2020 than in 2019. The variations of monthly soil temperature at 10, 20, and 40 cm were similar to the variations of monthly air temperatures in both 2019 and 2020 (Figure S3c). The monthly RH at 50 and 150 cm was the highest in September and the lowest in April. The monthly RH at 50 cm showed similar values and variations to the monthly RH at 150 cm, with an exception in October when the RH at 50 cm was slightly higher than the RH at 150 cm (Figure S4).

3.1.3. Microclimate on Typical Sunny Days during the Four Seasons at Chateau Jinsemeiyu

In order to avoid the disturbance of cloud and precipitation temperature, four typical sunny days were chosen in 2020 (i.e., 22 January, 11 April, 19 July, and 4 October) at Chateau Jinsemeiyu for seasonal analysis. The diurnal temperature range was relatively greater on the sunny day in winter, but smaller on the sunny days in spring and summer (Figure S5). The hourly mean RH varied more on the sunny day in summer than that in autumn (Figure S6a). By contrast, the hourly soil temperature at 10 cm depth varied less on the sunny day in summer than in other seasons (Figure S6b). The highest hourly PAR was 1729.6 and 691.2 W·m−2 on the sunny day in summer and winter, respectively (Figure S6c). The highest hourly average wind velocity occurred at 8:00 (4.3 m·s−1) on the sunny day in spring (Figure S6d). The soil temperature at different depths was the highest on the sunny day in summer, followed by spring, autumn, and winter (Figure S7). On the typical sunny days in winter, spring, summer, and autumn, the hourly RH at 50 and 150 cm both showed a decrease at first but then an increase (Figure S8).

3.1.4. Chateau Jinsemeiyu Microclimate Compared with Local Weather

At Chateau Jinsemeiyu, the growth and development of wine grape was greatly affected by mean, maximum, and minimum air temperatures at 150 cm; precipitation; mean RH at 150 cm; average wind velocity; and soil temperature at 10 cm depth. On the two timescales of interest (i.e., monthly and on 24 sunny days throughout the four seasons of the year), meteorological elements were compared between the field microclimate observation station and the national reference station in the vicinity. Between the field microclimate observation station and the national reference station, the differences in average wind velocity were not statistically significant (p < 0.05) on the monthly timescale but were statistically significant on the (selected sunny) daily timescale. No statistically significant differences were observed in other meteorological elements between the field microclimate observation station and the national reference station (Table 6). On the selected 24 sunny days, the reanalyzed meteorological data were mostly similar between the microclimate stations and the national reference stations, with an exception in wind speed (which showed a statistically significant difference) (Figure S9).

3.2. Vineyard Microclimate in Yinchuan Wine-Grape-Growing Area

In the Yinchuan wine-grape-growing area, four vineyards (i.e., Legacy Peak Estate, Chateau Yunmo Greatwall, Domaine Chandon Ningxia, and Chateau Yuquan) were chosen for the vineyard microclimate comparison among different elevations in the same climate zone. The elevation of the vineyard was the highest at Chateau Yunmo Greatwall and the lowest at Chateau Yuquan (located in a plain) (Figure 3).

3.2.1. Microclimate during the Year and the Growing Period for Grape in Yinchuan Wine-Grape-Growing Area

During the two observation years, the mean annual temperature was above 10 °C and the mean growth cycle temperature was above 18 °C in the Yinchuan wine-grape-growing area. Despite the relatively high elevation, air temperature was relatively high at Chateau Yunmo Greatwall due to the high gravel content of the soil. There were no large differences in annual or growth cycle RH, wind velocity, and PAR among the four vineyards in the Yinchuan wine-grape-growing area. Both precipitation and the number of days with precipitation during the year, as well as the growing period for grape, were higher in 2019 than in 2020. At the Chateau Yunmo Greatwall, precipitation was much lower in 2020 than in 2019, though the number of days with precipitation was higher (Table 7).

3.2.2. Monthly Microclimate in Yinchuan Wine-Grape-Growing Area

There were no substantial differences in monthly maximum, minimum, and mean air temperatures among the four study vineyards in the Yinchuan wine-grape-growing region (Figure S10). In 2019 and 2020, the monthly precipitation was concentrated in August and September (which is during the growing period for grape) at the four vineyards (Figure S11). At all four study vineyards, the number of days with precipitation from January to April was smaller in 2020 than in 2019. At Chateau Yunmo Greatwall, the number of days with precipitation from July to September was greater in 2020 than in 2019 (Figure S12). At the four study vineyards, the monthly mean RH was the highest in autumn and the lowest in spring (Figure S13).
At the four study vineyards, the peaks and bottoms of monthly soil temperature occurred at similar times to when monthly air temperature did. At Legacy Peak Estate (gravel content > 10%), the monthly soil temperature at 40 cm depth was lower than the soil temperature at other depths, and the monthly soil temperature at 30 (10) cm depth was the highest in autumn and winter (spring and summer). In both 2019 and 2020, monthly soil temperature variations among different depths and different seasons were similar at Domaine Chandon Ningxia (gravel content > 30%) to those at Legacy Peak Estate. The monthly soil temperature variations among different depths and different seasons were similar at Chateau Yuquan (gravel content is close to zero) to those at Legacy Peak Estate, though the magnitude was greater for the former than for the latter in 2020. At Chateau Yunmo Greatwall (gravel content > 60%), the monthly soil temperature varied greatly among different depths, and the monthly soil temperature at 50 (40) cm depth was the highest in autumn and winter (spring and summer) (Figure S14).
At the four study vineyards, the monthly PAR showed a normal distribution within the year, with the minimum value in January for both 2019 and 2020 and maximum value in July 2019 and June 2020 (Figure S15). The dominant prevailing winds were west (W) and north-northeast (NNE) in 2020 (Figure S16).

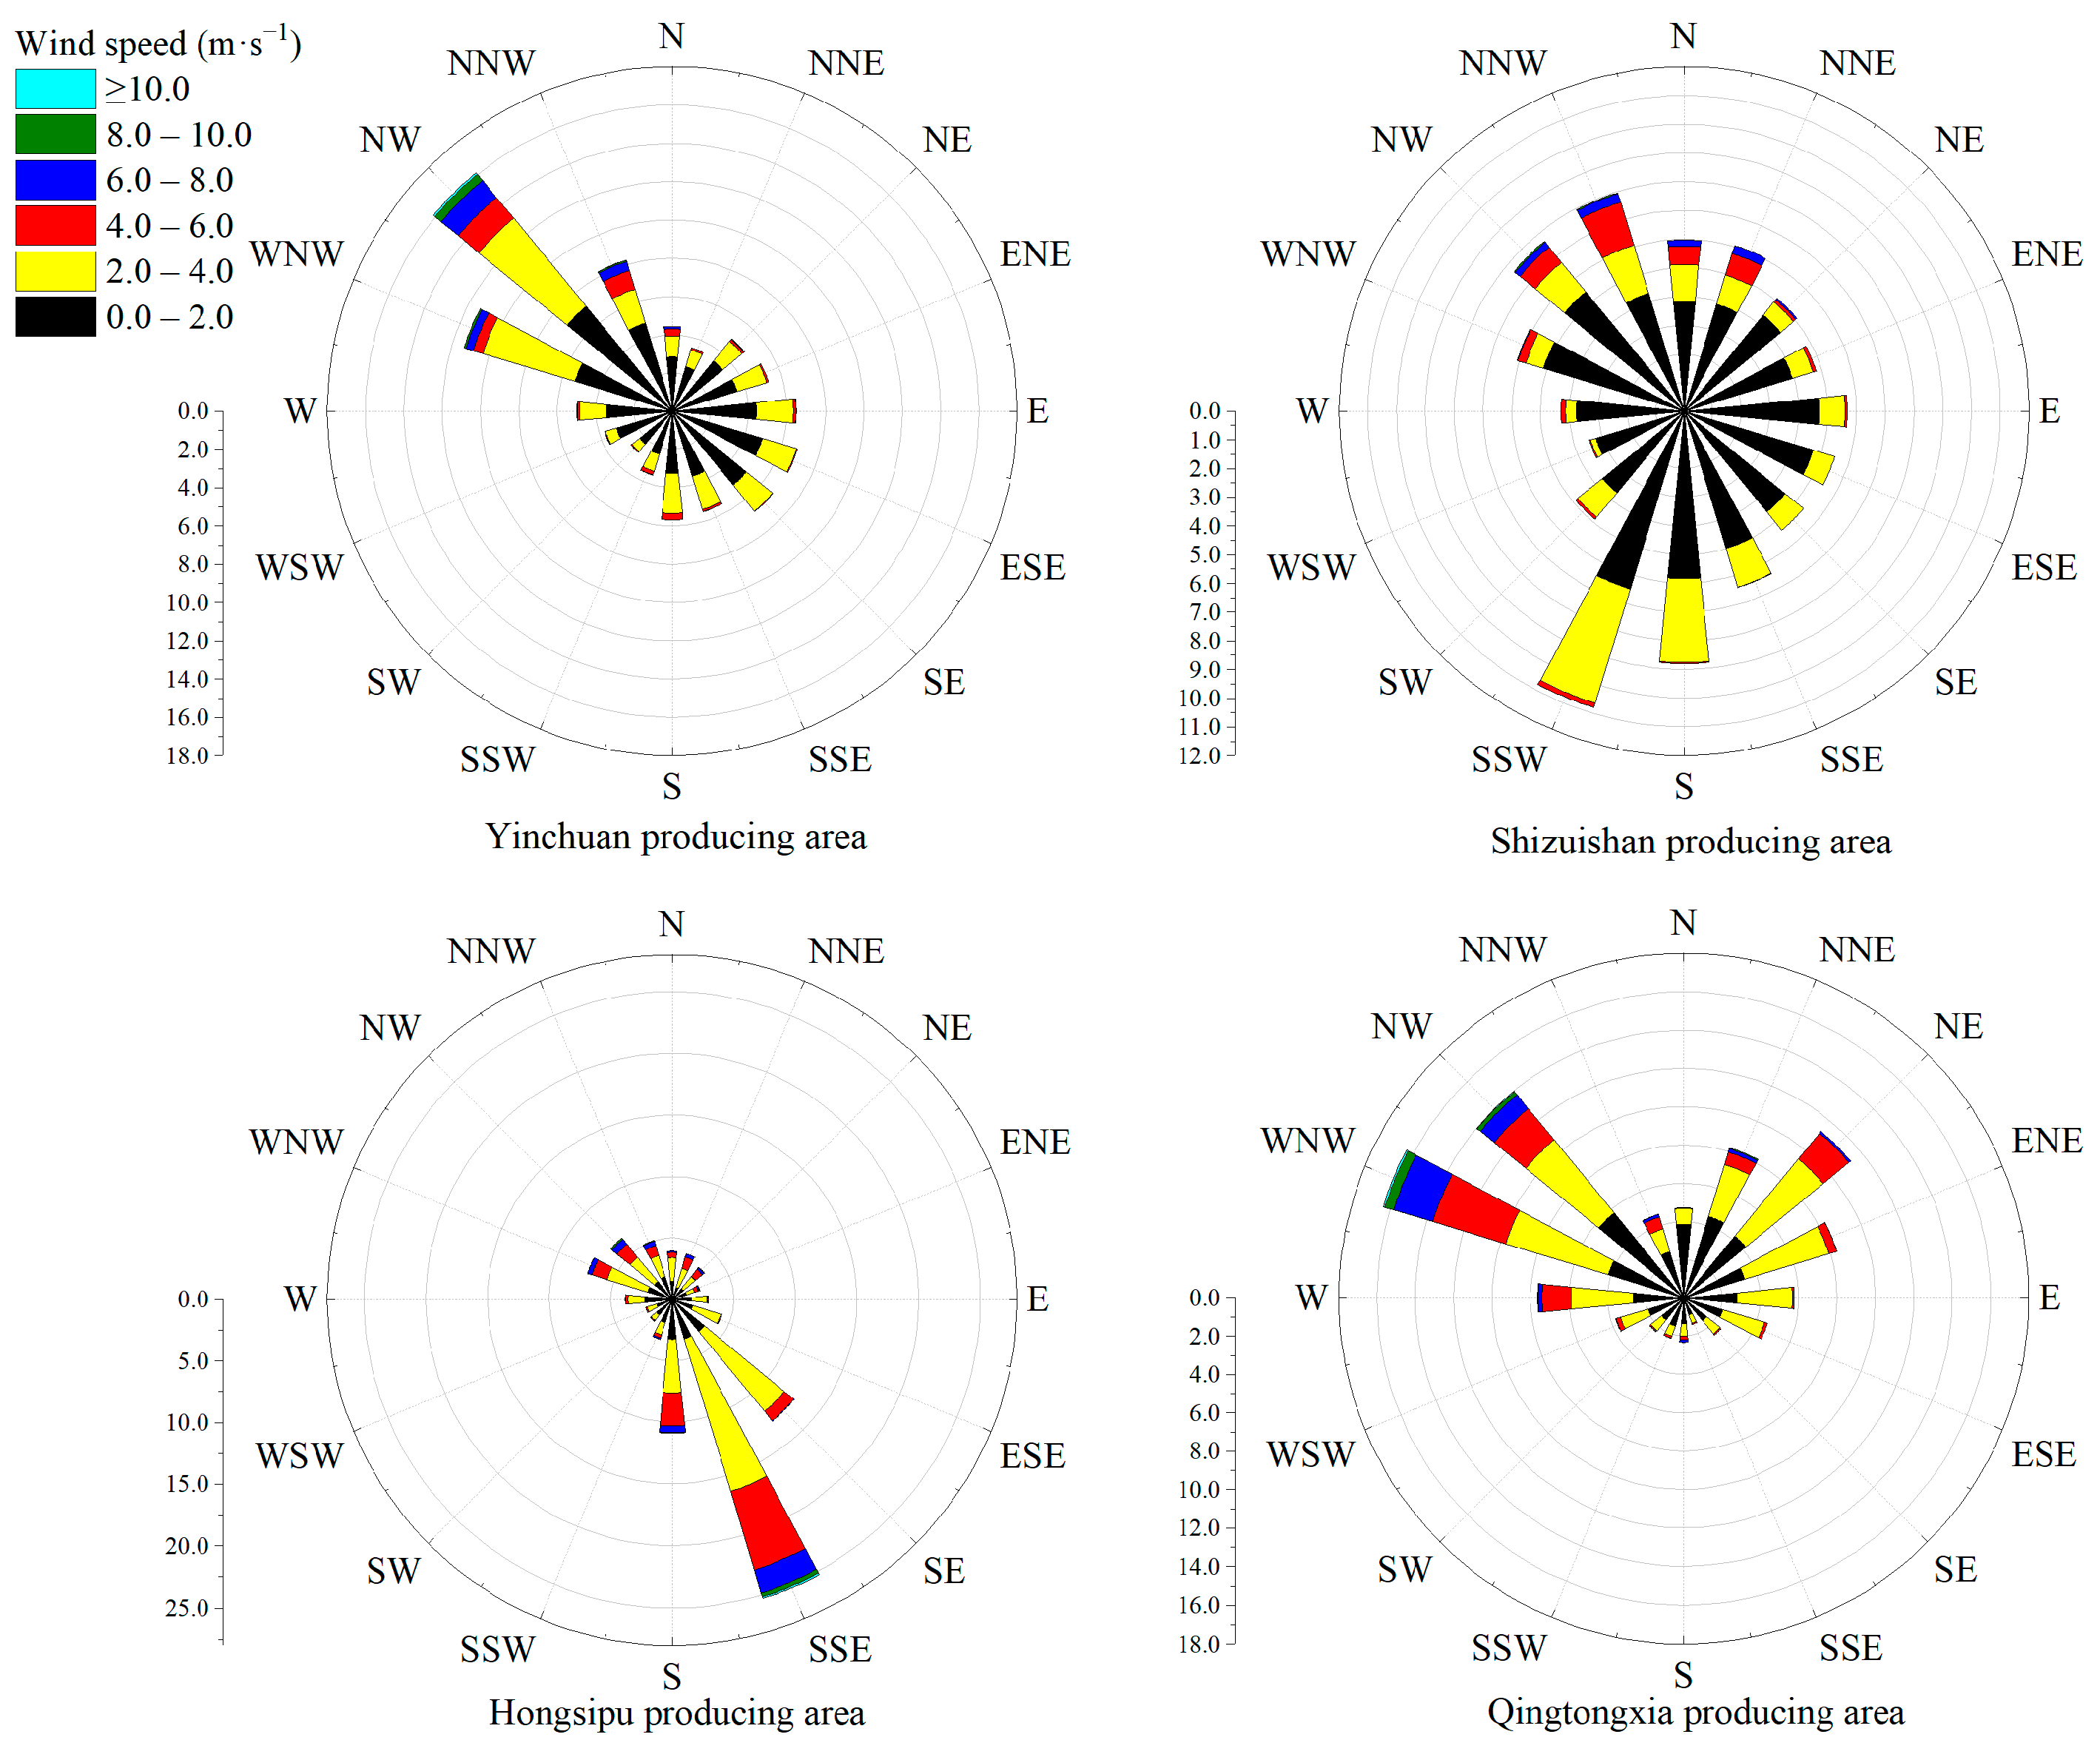
3.3. Comparison of Vineyard Microclimate among the Four Wine-Grape-Growing Areas

3.3.1. Comparison during the Year and the Growing Period for Grape

In the study region, the vineyard microclimates at Chateau Hedong, Chateau Jinsemeiyu, Chateau Yuhuang, and D.F. Yuxing were chosen to present the differences among the Shizuishan area, the Yinchuan area, the Qingtongxia area, and the Hongsipu area, respectively. The annual and growth cycle mean air temperatures in the Qingtonxia area were similar to those in the Yinchuan area. Compared with the Qingtongxia and Yinchuan areas, the annual and growth cycle mean air temperatures were relatively low in the Shizuishan and Hongsipu areas. The highest to lowest in terms of RH at 150 cm was the Shizuishan area, the Hongsipu area, the Qingtongxia area, and the Yinchuan area. Compared with 2019, annual precipitation decreased in 2020 in the Yinchuan, Qingtongxia, and Hongsipu areas, with the highest decrease in the Qingtongxia area. For the annual and growth cycle timescales, precipitation and the number of days with precipitation were the highest in the Hongsipu area, followed by the Yinchuan area, the Shizuishan area, and the lowest in the Qingtongxia area. Meanwhile, average wind velocity and PAR were the highest in the Hongsipu area, followed by the Qingtongxia area, the Yinchuan area, and the lowest in the Shizuishan area (Table 8).
During the growing period for grape, mean air temperature was above 17 °C in the four study climate-zone-based wine-grape-growing areas (highest in Yinchuan area and lowest in Hongsipu area). The high-to-low order of precipitation was the Hongsipu area (234 mm in 2019), Yinchuan area, Qingtongxia, area, and Shizuishan area (114 mm at Chateau Hedong). The high-to-low order of average relative humidity was the Hongsipu area, Qingtongxia area, Shizuishan area, and Yinchuan area. And the high-to-low order of PAR was the Hongsipu area, Qingtongxia area, Yinchuan area, and Shizuishan area.

3.3.2. Comparison between Different Months

The monthly maximum air temperature reached the peak in August in 2019 in the four study main wine-grape-growing areas. In 2020, the August maximum air temperature and December minimum air temperature were 38.2 and −24.6 °C, respectively, in the Qingtongxia area. The high-to-low order of monthly mean air temperature was the Yinchuan area, Qingtongxia area, Shizuishan area, and Hongsipu area. The monthly minimum air temperature was higher in 2020 than in 2019 in all four study areas (Figure 4).
Monthly precipitation showed a normal distribution in the four study areas. Overall, monthly precipitation was relatively higher during the grape-growing months than during the other months. In 2019 (2020), monthly precipitation reached a peak in June (August), with the highest value of 76.7 (131.7) mm in Hongsipu area. The monthly precipitation was much lower in 2020 than in 2019, especially in the Qingtongxia area (with a 45.4% decrease) (Figure 5). In 2019, the number of days with precipitation during the month peaked in June, with the highest value of 13 in the Yinchuan area. From July through October in 2019, the number of days with precipitation was constant around six in all four study areas. In 2020, the number of days with precipitation during the month greatly reduced compared with 2019, especially from July to September. In the Hongispu area, the number of days with precipitation was relatively high in August (12) and September (10) (Figure 6).
In the four main wine-grape-growing areas of the study region, the monthly mean RH was the lowest in spring and the highest in autumn. The high-to-low order of monthly mean RH among the four study areas was the Shizuishan area, Hongsipu area, Qingtongxia area, and Yinchuan area. In 2019 and 2020, the monthly mean RH was relatively higher in September and lower from March through April. The monthly mean RH fluctuated more in 2020 than in 2019. Among all four study areas, the monthly mean RH was the lowest in April in the Qingtongxia area (18.1%) and the highest in September in the Shizuishan area (66.1%) (Figure 7).
In 2019 and 2020, the high-to-low order of monthly PAR was the Hongsipu area, Qingtongxia area, Yinchuan area, and Shizuishan area. Among the four study areas, monthly PAR was the highest in July in the Hongsipu area in 2019 (506.9 W·m−2) and in June in the Yinchuan area in 2020 (514.2 W·m−2); monthly PAR was the lowest in January in the Shizuishan area in both 2019 and 2020 (105.6 and 93.4 W·m−2, respectively). Due to the higher number of rainy days in June 2019, monthly PAR in 2019 was delayed to July in the four study areas (Figure 8).
The monthly soil temperature showed peaks and bottoms at similar times to monthly air temperature at the four wine-grape-producing areas. In the Yinchuan area, the monthly soil temperature at 10 and 30 cm depth was lower than the soil temperature at other depths in 2019 and 2020, respectively. In the Shizuishan area, the monthly soil temperature showed similar variations among different depths and was different in 2019 and 2020. In the Hongsipu area, the monthly soil temperature showed similar variations among different depths in both 2019 and 2020. In the Qingtongxia area, monthly soil temperature varied little across different seasons and depths (Figure 9).
In 2020, the prevailing winds varied among the four main wine-grape-growing areas of the study region. In the Shizuishan area, the prevailing (11%) wind was south-southwest (SSW) and the maximum wind velocity was 8.9 m·s−1; in the Yinchuan area, the prevailing (16%) wind was northwest (NW) and the maximum wind velocity was 12.1 m·s−1; in the Qingtongxia area, the prevailing (16%) wind was west-northwest (WNW) and the maximum wind velocity was 14.3 m·s−1; and in the Hongsipu area, the prevailing (25%) wind was south-southeast SSE and the maximum wind velocity was 11.9 m·s−1 (Figure 10).

3.4. Climate Quality for Wine Grape in 2019 and 2020

According to the Climate Assessment for Agricultural Products—Wine grape (QX/T 557-2020) (Table 2 and Table 3), the climate for wine grape was categorized (i.e., excellent, very good, good, and ordinary) in each study area in 2020. In both 2019 and 2020, the climate quality for Cabernet Sauvignon and Chardonnay were rated good in the Qingtongxia and Yinchuan areas. In 2020, the climate quality for Chardonnay was rated ordinary in the Hongsibao area. Overall, the climate for wine grape was superior in 2019 than in 2020 in the four study areas. In 2019, the climate quality for Cabernet Sauvignon was rated very good in the Hongsipu area and excellent in the Qingtongxia area. In 2020, climate quality for Cabernet Sauvignon was very good in the Yinchuan area and excellent in the Qingtongxia area. In both 2019 and 2020, the climate quality for Cabernet Sauvignon was ideal in the Yinchuan and Qingtongxia areas. The overall climate for grape was slightly better in 2019 than in 2020 (Table 9).

4. Discussion

4.1. Vineyard Microclimate Data

Historical air temperatures for wine-producing areas were drawn from weather stations in the vicinity, which could differ from the air temperatures in the actual vineyard. For example, the two well-known wine producing regions of Bordeaux and Napa Valley were considered to have similar climates based on the weather data from local reference stations. However, comparing the weather data at local reference stations masked the overall differences in climate for these two wine areas [17]. Nowadays, gridded products have been developed to overcome this problem and provide more reliable, effective, and suitable climate data [18,19]. As a result, there are more comprehensive measures available for grape farmers to choose the most suitable cultivars that match the field environment.
Extreme values and outliers are inherent in weather data, and the daily or hourly observation scales could somewhat smooth out these extreme values and outliers. In this study, 5 min data were used to minimize the smoothing effect of the observation scale on the extreme values and outliers of the meteorological elements. In addition, terrain and soil conditions were factored in the analysis, which improved the accuracy of the results. In the Yinchuan area, some meteorological elements showed certain differences between the field microclimate observation stations and the local national reference station. Overall, the field microclimate observation data more accurately reflected the characteristics of the vineyard microclimate than the national reference station data. This result is consistent with a previous study that listed the temperature variation characteristics between a microclimate station and a weather station and concluded that microclimate station data could better represent vineyard climate [11,20,21,22,23,24,25].

4.2. Factors Affecting the Vineyard Microclimate

At the study vineyards in the Eastern Foothills of the Helan Mountains, soil temperature decreased with the increase in soil depth, and relative humidity decreased with the increase in height. In the Yinchuan area, the four study vineyards had similar climate, though the microclimate varied due to their different terrain, elevation, and soil type. Chateau Yunmo Greatwall is located on a hillside. The elevation is relatively high and the soil is mainly covered by gravel, whilst the mean air temperature, precipitation, and average wind velocity were relatively high and the relative humidity was relatively low. Legacy Peak Estate is located in front of the mountains. The precipitation was relatively abundant during the growing period for grape, the mean air temperature and average wind velocity were relatively low, and the relatively humidity was relatively high. Overall, soil temperature was mainly affected by the gravel content in the soil, with a positive correlation. Precipitation was governed by the geographical location, with the highest value at Legacy Peak Estate and the lowest value at Chateau Yunmao Greatwall. With the increase in observation height, relative humidity decreased while wind velocity increased. A previous study mentioned that, besides elevation and terrain, soil type and soil texture also play decisive roles in the simulated vineyard microclimate in mountainous areas [26,27,28,29,30].
In different wine-grape-growing areas, vineyard microclimate was related to the geographical location and topography. For the four grape-growing areas in the Eastern Foothills of the Helan Mountains, air temperature and precipitation gradually decreased from the north to the south, while relative humidity and PAR gradually increased from the north to the south. Due to the complicated terrain of the Eastern Foothills of the Helan Mountains, the microclimate at the eight study vineyards varied but with no apparent sub-regional patterns. At different vineyards, meteorological elements affected the grape cultivars, agricultural management, and wine type [12,31,32,33,34,35,36].

4.3. Climate Quality Assessment

In general, the nutrient content of grape berries is more affected by climate than by the nutrient content of grape berries, followed by soil and variety [7]. Climate assessment focusing on grape has been reported in other countries [37,38,39,40], but rarely in China. In this study, we used our research team’s meteorological standards to assess the climate for grape. Though not without uncertainty, such results could be used to estimate grape quality, which is important for vintage reports and wine pricings. However, grape quality could also be affected by other non-climatic factors.

4.4. Limitations

Due to the limited history of the chosen field microclimate observation stations (built in September 2018), only a two-year study could be conducted. Needless to say, a long-term study would provide more convincing results on the differences in meteorological elements between microclimate observation stations and national reference stations. Therefore, future scholars are strongly encouraged to extend the study across multiple years or even decades to provide continuous support to the local wine grape community in the Eastern Foothills of the Helan Mountains.

5. Conclusions

In this short-term, historical study, the conclusions are as follows:
(1)
In the same wine-grape-growing area, where the climate was similar, the vineyard microclimate was affected by elevation, terrain, and soil texture. Elevation was positively associated with average wind velocity, but negatively associated with precipitation and relative humidity. The gravel content of the soil type was a key factor that positively affected the mean air temperature.
(2)
Except average wind velocity, there were no statistically significant differences in other meteorological elements between the field microclimate observation stations and the local national reference station.
(3)
From the north to the south of the study region, the vineyard air temperature and precipitation both gradually decreased while the vineyard relative humidity and PAR gradually increased.
(4)
The climate quality for grapes was superior in 2019 than in 2020. In particular, Yinchuan had a better climate quality for grape than the other study areas did.

Supplementary Materials

The following supporting information can be downloaded at: https://www.mdpi.com/article/10.3390/su151712740/s1, Figures S1–S4 illustrate monthly air temperature, precipitation, mean relative humidity, photosynthetically active radiation, soil temperature, and relative humidity at different heights at Chateau Jinsemeiyu in 2019 and 2020. Figures S5–S8 illustrate diurnal temperature range, relative humidity, 10-cm soil temperature, photosynthetically active radiation, wind velocity, soil temperature at different depths, and relative humidity at different heights on typical sunny days in the four seasons at Chateau Jinsemeiyu. Figure S9 illustrates the comparisons of reanalyzed meteorological data for the selected 24 sunny days between microclimate stations and national reference stations. Figures S10–S16 illustrate monthly air temperature, precipitation, days with precipitation, mean relative humidity, soil temperature, photosynthetically active radiation, and wind direction at the four study vineyards in the Yinchuan wine-grape-growing region.

Author Contributions

R.C.: writing—review and editing, methodology, writing—original draft, Formal analysis and data processing. X.Z.: writing—review and editing, methodology, supervision, conceptualization. Y.Y. (Yu Yang): methodology, visualization. Y.Y. (Yonge Yang): conceptualization. J.W.: conceptualization, methodology. H.L.: methodology, resources. All authors have read and agreed to the published version of the manuscript.

Funding

The work was supported by the Ningxia Hui Autonomous Region Key Research (2022CJE9007), the Ningxia Hui Autonomous Region Key Research (2022BBF02014), National Natural Science Foundation of China (42165013), and the Ningxia Hui Autonomous Region Development Program Grant (NXNYYZ202101).

Institutional Review Board Statement

Not applicable.

Informed Consent Statement

Not applicable.

Data Availability Statement

Data will be made available upon request.

Acknowledgments

The authors acknowledge the anonymous referees for their valuable comments.

Conflicts of Interest

The authors have no conflict of interest to declare.

References

  1. Li, H.; Zhang, X.; Wang, J.; Zhang, H. Terroir suitability zoning for the six prevailing wine grape varieties in Ningxia Hui Autonomous Region (with a Focus on the Helan Mountain East) of China. J. Agric. Sci. Technol. 2019, A9, 278–293. [Google Scholar]
  2. Wang, J.; Zhang, X.; Su, L.; Li, H.; Wei, J. Global warming effects on climate zones for wine grape in Ningxia region, China. Theor. Appl. Climatol. 2020, 140, 1527–1536. [Google Scholar] [CrossRef]
  3. Jones, G.V.; White, M.A.; Cooper, O.R.; Storchmann, K. Climate change and global wine quality. Clim. Change 2005, 73, 319–343. [Google Scholar] [CrossRef]
  4. Kenny, G.J.; Harrison, P.A. The effects of climate variability and change on grape suitability in Europe. J. Wine Res. 1992, 3, 163–183. [Google Scholar] [CrossRef]
  5. Tonietto, J.; Carbonneau, A. A multicriteria climatic classification system for grape-growing regions worldwide. Agric. For. Meteorol. 2004, 124, 81–97. [Google Scholar] [CrossRef]
  6. Tramontini, S.; Leeuwen, C.; Domec, J.C.; Destrac-Irvine, A.; Basteau, C. Impact of soil texture and water availability on the hydraulic control of plant and grape-berry development. Plant Soil. 2013, 368, 215–230. [Google Scholar] [CrossRef]
  7. Van Leeuwen, C.; Friant, P.; Chone, X.; Tregoat, O.; Koundouras, S.; Dubourdieu, D. The influence of climate, soil and cultivar on terroir. Am. J. Enol. Vitic. 2004, 55, 207–217. [Google Scholar] [CrossRef]
  8. Ubalde, J.M.; Sort, X.; Zayas, A.; Poch, R.M. Effects of soil and climatic conditions on grape ripening and wine quality of cabernet sauvignon. J. Wine Res. 2010, 21, 1–17. [Google Scholar] [CrossRef]
  9. Jones, G.V. The climate component of terroir. Elements 2018, 14, 167–172. [Google Scholar] [CrossRef]
  10. Neethling, E.; Barbeau, G.; Coulon-Leroy, C.; Quénol, H. Spatial complexity and temporal dynamics in viticulture: A review of climate-driven scales. Agric. For. Meteorol. 2019, 107618, 276–277. [Google Scholar] [CrossRef]
  11. Matese, A.; Crisci, A.; Gennaro, S.; Primicerio, J.; Tomasi, D.; Marcuzzo, P.; Guidoni, S. Spatial variability of meteorological conditions at different scales in viticulture. Agric. For. Meteorol. 2014, 189, 159–167. [Google Scholar] [CrossRef]
  12. Zhang, Z.; Shi, P.; Li, X. The effect of microclimate of hilly vineyard on grape and wine quality. J. Northwest A F Univ. 2007, 2007, 193–198, (In Chinese with English abstract). [Google Scholar]
  13. Matese, A.; Crisci, A.; Di Gennaro, F.S.; Fiorillo, E.; Primicerio, J.; Toscano, P.; Vaccari, F.P.; Di Blasi, S.; Genesio, L. Influence of Canopy Management Practices on Vineyard Microclimate: Definition of New Microclimatic Indices. Am. J. Enol. Vitic. 2012, 63, 424–430. [Google Scholar] [CrossRef]
  14. Gutiérrez-Gamboa, G.; Zheng, W.; de Toda, F.M. Current viticultural techniques to mitigate the effects of global warming on grape and wine quality: A comprehensive review. Food Res. Int. 2021, 139, 109946. [Google Scholar] [CrossRef] [PubMed]
  15. QX/T 557—2020; Assessment for Climate Quality of Agricultural Products—Wine Grape. Meteorological Press: Beijing, China, 2020; (In Chinese with English illstration).
  16. Chen, Y.G.; Ding, L.X.; Ge, H.L.; Zhang, M.Z.; Hu, Y. Hyperspectral Bambusoideae Discrimination Based on Mann-Whitney Non-Parametric Test and SVM. Spectrosc. Spect. Anal. 2011, 31, 3010–3013, (In Chinese with English abstract). [Google Scholar]
  17. Jones, G.V.; Moriondo, M.; Bois, B.; Hall, A.; Duff, A. Analysis of the spatial climate structure in viticulture regions worldwide. Bull. OIV 2009, 82, 507–518. [Google Scholar]
  18. Thornton, P.E.; Running, S.W.; White, M.A. Generating surfaces of daily meteorology variables over large regions of complex terrain. J. Hydrol. 1997, 190, 214–251. [Google Scholar] [CrossRef]
  19. De Rességuier, L.; Séverine, M.; Roux, R.L.; Petitjean, T.; Leeuwen, C.V. Temperature variability at local scale in the bordeaux area. Relations with environmental factors and impact on vine phenology. Front. Plant. Sci. 2020, 11, 515. [Google Scholar] [CrossRef]
  20. Strack, T.; Schmidt, D.; Stoll, M. Impact of steep slope management system and row orientation on canopy microclimate. Comparing terraces to downslope vineyards. Agric. For. Meteorol. 2021, 307, 108515. [Google Scholar] [CrossRef]
  21. Gilbert, N.; Anich, N.; Worland, M.; Zuckerberg, B. Microclimate complexities at the trailing edge of the boreal forest. For. Ecol. Manag. 2022, 524, 120533. [Google Scholar] [CrossRef]
  22. Andreoli, V.; Bertoni, D.; Cassardo, C.; Ferrarese, S.; Francone, C.; Spanna, F. Analysis of micrometeorological conditions in Piedmontese vineyards. Ital. J. Agrometeorol. 2018, 2, 27–40. [Google Scholar]
  23. Fraga, H.; Malheiro, A.C.; Moutinho-Pereira, J.; Jones, G.V.; Alves, F.; Pinto, J.G.; Santos, J.A. Very high resolution bioclimatic zoning of Portuguese wine regions: Present and future scenarios. Reg. Environ. Change 2014, 14, 295–306. [Google Scholar] [CrossRef]
  24. Ferretti, C.G.; Febbroni, S. Terroir Traceability in Grapes, Musts and Gewürztraminer Wines from the South Tyrol Wine Region. Horticulturae 2022, 8, 586. [Google Scholar] [CrossRef]
  25. Tomada, S.; Agati, G.; Serni, E.; Michelini, S.; Lazazzara, V.; Pedri, U.; Sanoll, C.; Matteazzi, A.; Robatscher, P.; Haas, F. Non-destructive fluorescence sensing for assessing microclimate, site and defoliation effects on flavonol dynamics and sugar prediction in Pinot blanc grapes. PLoS ONE 2022, 17, e0273166. [Google Scholar] [CrossRef]
  26. Taye, M.; Simane, B.; Selsssie, Y.G.; Zaitchik, B.; Setegn, S. Analysis of the spatial variability of soil texture in a tropical highland: The case of the Jema Watershed, Northwestern Highlands of Ethiopia. Int. J. Environ. Res. Public Health 2018, 15, 1903. [Google Scholar] [CrossRef]
  27. Wang, R.; Sun, Q.; Chang, Q. Soil types effect on grape and wine composition in Helan Mountain area of Ningxia. PLoS ONE 2015, 10, e0116690. [Google Scholar] [CrossRef] [PubMed]
  28. He, F.; Tian, M.B.; Duan, W.P.; Yang, W.M.; Mao, X.; Wang, J.; Duan, C.Q. Effects of Inner-Row Ground Management on the Volatomics of “Cabernet Sauvignon” Grapes and Wines in the Region of the Eastern Foothills of the Ningxia Helan Mountains in Northwest China. Foods 2023, 12, 2472. [Google Scholar] [CrossRef]
  29. Mania, E.; Petrella, F.; Giovannozzi, M.; Piazzi, M.; Wilson, A.; Guidoni, S. Managing Vineyard Topography and Seasonal Variability to Improve Grape Quality and Vineyard Sustainability. Agronomy 2021, 11, 1142. [Google Scholar] [CrossRef]
  30. Sun, Q.; Ebersole, C.; Wong, D.P.; Curtis, K. The Impact of Vineyard Mechanization on Grape and Wine Phenolics, Aroma Compounds, and Sensory Properties. Fermentation 2022, 8, 318. [Google Scholar] [CrossRef]
  31. Novikova, L.Y.; Naumova, L.G. Dependence of fresh grapes and wine taste scores on the origin of varieties and weather conditions of the harvest year in the northern zone of industrial viticulture in Russia. Agronomy 2020, 10, 1613. [Google Scholar] [CrossRef]
  32. Gambetta, J.M.; Bastian, S.E.; Cozzolino, D.; Jeffery, D.W. Factors influencing the aroma composition of Chardonnay wines. J. Agric. Food Chem. 2014, 62, 6512–6534. [Google Scholar] [CrossRef]
  33. Moriondo, M.; Bindi, M.; Fagarazzi, C.; Ferrise, R.; Trombi, G. Framework for high-resolution climate change impact assessment on grapevines at a regional scale. Reg. Environ. Change 2011, 11, 553–567. [Google Scholar] [CrossRef]
  34. Mozell, M.R.; Thach, L. The impact of climate change on the global wine industry: Challenges & solutions. Wine Econ. Policy 2014, 3, 81–89. [Google Scholar]
  35. Ruml, M.; Vuković, A.; Vujadinović, M.; Djurdjević, V.; Ranković-Vasić, Z.; Atanacković, Z.; Sivčev, B.; Marković, N.; Matijašević, S.; Petrović, N. On the use of regional climate models: Implications of climate change for viticulture in Serbia. Agric. For. Meteorol. 2012, 158, 53–62. [Google Scholar] [CrossRef]
  36. Alikadic, A.; Pertot, I.; Eccel, E.; Dolci, C.; Zarbo, C.; Caffarra, A.; Filippi, R.D.; Furlanello, C. The impact of climate change on grapevine phenology and the influence of altitude: A regional study. Agric. For. Meteorol. 2019, 271, 73–82. [Google Scholar] [CrossRef]
  37. Zhang, X.Y.; Kang, Y.L.; Yuan, H.Y.; Zhang, L.; Ma, G.F.; Liu, J.; Han, Y.J. The quality evaluation of wine grape and its response to meteorological conditions. Acta Ecol. Sin. 2007, 27, 740–745, (In Chinese with English abstract). [Google Scholar]
  38. Rendulić Jelušić, I.; ŠakićBobić, B.; Grgić, Z.; Žiković, S.; Osrečak, M.; Puhelek, I.; Anić, M.; Karoglan, M. Grape Quality Zoning and Selective Harvesting in Small Vineyards—To Adopt or Not to Adopt. Agriculture 2022, 12, 852. [Google Scholar] [CrossRef]
  39. Niimi, J.; Tomic, O.; Næs, T.; Bastian, S.E.; Jeffery, D.W.; Nicholson, E.L.; Maffei, S.M.; Boss, P.K. Objective measures of grape quality: From Cabernet Sauvignon grape composition to wine sensory characteristics. LWT 2020, 123, 109105. [Google Scholar] [CrossRef]
  40. Poni, S.; Gatti, M.; Palliotti, A.; Dai, Z.; Duchêne, E.; Truong, T.T.; Ferrara, G.; Matarrese, A.M.S.; Gallotta, A.; Bellincontro, A.; et al. Grapevine quality: A multiple choice issue. Sci. Hortic. 2018, 234, 445–462. [Google Scholar] [CrossRef]
Figure 1. Locations of the one national reference station and eight field microclimate automatic observation stations in the four wine-grape-growing areas of the Eastern Foothills of the Helan Mountains in Ningxia region, China. Numbers 1–9 represent Chateau Hedong, Chateau Jinsemeiyu, Legacy Peak Estate, Chateau Yunmo Greatwall, Domaine Chandon Ningxia, Chateau Yuquan, Chateau Yuhuang, D.F. Yuxing winery, and the national reference station, respectively.
Sustainability 15 12740 g001
Figure 2. Wind velocity and direction diagram in 2020—left: Chateau Jinsemeiyu and right: national reference station Yinchuan in the study region.
Sustainability 15 12740 g002
Figure 3. Elevation and the chateau gravel content of the four study vineyards in Yinchuan wine-grape-growing area of the study region.
Sustainability 15 12740 g003
Figure 4. Scatter plots of monthly maximum, minimum, and mean air temperatures in (I) 2019 and (II) 2020 in the four main wine-grape-growing areas of the study region.
Sustainability 15 12740 g004
Figure 5. Histograms of monthly precipitation in 2019 (left) and 2020 (right) in the four main wine-grape-growing areas of the study region.
Sustainability 15 12740 g005
Figure 6. Histograms of the number of days with precipitation during the month in 2019 (left) and 2020 (right) in the four main wine-grape-growing areas of the study region.
Sustainability 15 12740 g006
Figure 7. Box-and-whisker plots of monthly mean RH in (I) 2019 and (II) 2020 in the four main wine-grape-growing areas of the study region. Box boundaries indicate the 25th and 75th percentiles. The black lines within each box indicate the median.
Sustainability 15 12740 g007
Figure 8. Histograms of monthly PAR in 2019 (left) and 2020 (right) in the four main wine-grape-growing areas of the study region.
Sustainability 15 12740 g008
Figure 9. Scatter plots of monthly soil temperature at 10, 20, 30, 40, and 50 cm depths in (I) 2019 and (II) 2020 at the four study vineyards in the four areas.
Sustainability 15 12740 g009
Figure 10. Wind velocity and direction diagram in 2020 in the four main wine-grape-growing areas of the study region.
Sustainability 15 12740 g010
Table 1. Latitude, longitude, and elevation of the eight study wineries in the four wine-grape-growing areas of the Eastern Foothills of the Helan Mountains in Ningxia region, China.
AreaWineryLatitude (N)Longitude (E)Elevation (m)
ShizuishanChateau Hedong38°59′12″106°18′40″1.108
YinchuanChateau Jinsemeiyu38°37′33″106°00′52″1.178
Legacy Peak Estate38°30′03″106°01′10″1.134
Chateau Yunmo Greatwall38°22′34″105°56′17″1.230
Domaine Chandon Ningxia38°19′30″106°01′12″1.140
Chateau Yuquan38°11′05″105°59′24″1.130
QingtongxiaChateau Yuhuang38°06′30″105°53′17″1.176
HongsipuD.F. Yuxing winery37°19′20″106°05′22″1.388
Table 2. Grading scales of the climate assessment index for wine grape.
GradeIQQuality Grading Reference Value
Sugar Content of Grape (G) (g·L−1)Ratio of Sugar to Acid (H)
ExcellentIQ ≥ 2.7220 ≤ G < 24040 ≤ H < 50
Very good2.5 ≤ IQ < 2.7200 ≤ G < 220 or 240 ≤ G < 26032 ≤ H < 40 or 50 ≤ H < 55
Good1.5 ≤ IQ < 2.5180 ≤ G < 200 or 260 ≤ G < 28025 ≤ H < 32 or 55 ≤ H < 60
OrdinaryIQ < 1.5G < 180 or G ≥ 280H < 25 or H ≥ 60
Table 3. Graded assignment of climate evaluation indicators.
MiIRT (°C·mm)Ae (°C·d)S (h)R30 (mm)T30 (°C)
3IRT ≤ 30001550 ≤ Ae < 2000S ≥ 1550R30 ≤ 3018 < T30 ≤ 20
23000 < IRT ≤ 40001450 ≤ Ae < 1550 or
2000 ≤ Ae < 2200
1400 ≤ S < 155030 < R30 ≤ 5020 < T30 ≤ 22 or
16 < T30 ≤ 18
14000 < IRT ≤ 50001350 ≤ Ae < 1450 or
2200 ≤ Ae < 2400
1250 ≤ S < 140050 < R30 ≤ 10022 < T30 ≤ 24 or
14 < T30 ≤ 16
0IRT > 5000Ae < 1350 or
Ae ≥ 2400
S < 1250R30 > 100T30 > 25 or
T30 ≤ 14
Table 4. Meteorological elements (including maximum, minimum, and mean air temperatures, relative humidity at 150 cm, precipitation, the number of days with precipitation, soil temperature at 10 cm, and PAR) during both the year and the growing period for grape in 2019 and 2020 at Chateau Jinsemeiyu in the study region.
YearTimescaleTmax (°C)Tmin (°C)Tmean (°C)RH at 150 cm (%)P (mm)P DaysSoil Temperature
at 10 cm (°C)
PAR (W·m−2)
2019Annual35.9−17.010.842.6186.25612.4310.2
Growing period35.96.018.744.7171.54720.0392.1
2020Annual37.7−22.711.044.1121.33812.4308.8
Growingperiod37.7−2.3018.842.7120.33119.2388.0
Table 5. RH at 50 and 150 cm as well as soil temperature at 10, 20, 30, 40, and 50 cm depths during the year and the growing period for grape in 2019 and 2020 at Chateau Jinsemeiyu in the study region.
YearTimescaleRH at Different Heights (%)Soil Temperature at Different Depths (°C)
50 cm150 cm10 cm20 cm30 cm40 cm50 cm
2019Annual43.142.612.212.412.412.412.4
Growing period45.344.720.019.819.419.219.0
2020Annual45.144.112.412.612.612.712.7
Growing period44.042.719.319.219.018.818.6
Table 6. Progressive significance of differences in meteorological elements between the field microclimate observation station and the national reference station on the monthly and daily (for the selected 24 sunny days during the four seasons of the year) timescales in 2019 and 2020 at Chateau Jinsemeiyu in the study region. * p < 0.05.
Meteorological ElementProgressive Significance
MonthlyDaily (Selected Sunny Days)
Tmean at 150 cm (°C)0.9590.741
Tmax at 150 cm (°C)0.9020.885
Tmin at 150 cm (°C)0.6430.902
Precipitation (mm)0.942N/A
Mean RH at 150 cm (%)0.5640.364
Average wind velocity (m·s−1)0.0650.016 *
Soil temperature at 10 cm depth (°C)0.5430.621
Table 7. Meteorological elements (including mean air temperature, relative humidity at 150 cm, precipitation, the number of days with precipitation, average wind velocity, and PAR) during the year and the growing period for grape in 2019 and 2020 at the four study vineyards in Yinchuan wine-grape-growing area of the study region.
WineryYearTimescaleTmean (°C)RH at 150 cm (%)P (mm)Days with PAverage
Wind Velocity (m·s−1)
PAR (W·m−2)
Legacy Peak Estate2019Annual10.146.0151.843.01.71299.1
Growth cycle18.449.6151.441.01.6382.8
2020Annual10.144.6131.844.01.7293.5
Growth cycle18.143.6130.640.01.8379.5
Domaine Chandon Ningxia2019Annual10.944.539.547.01.9300.4
Growth cycle18.848.638.543.01.8382.7
2020Annual10.642.235.954.01.6286.5
Growth cycle18.841.333.947.01.6368.1
Chateau Yuquan2019Annual10.246.9126.245.01.8327.7
Growth cycle18.351.4125.841.01.8411.0
2020Annual10.644.9121.634.01.7315.7
Growth cycle18.348.4121.032.01.8405.8
Chateau Yunmo Greatwall2019Annual11.340.3135.543.02.5300.4
Growth cycle19.242.9134.939.02.6379.1
2020Annual11.438.945.651.02.3304.8
Growth cycle19.137.145.651.02.4387.1
Table 8. Meteorological elements (including mean air temperature, relative humidity at 150 cm, precipitation, the number of days with precipitation, average wind velocity, and PAR) during the year and the growing period for grape in 2019 and 2020 in the four main wine-grape-growing areas of the study region.
AreaYearTimescaleTmean (°C)RH at 150 cm (%)P (mm)Days with PAverage Wind Velocity (m·s−1)PAR (W·m−2)
Shizuishan2019Annual8.347.2114.1461.3288.2
Growing period18.050.9112.8411.4383.4
2020Annual9.944.9136.7341.4284.0
Growing period17.944.5135.9311.4383.7
Yinchuan2019Annual9.342.6186.2562.2309.5
Growing period18.944.7171.5472.1392.1
2020Annual11.041.3121.3352.0309.0
Growing period18.839.4120.3312.0399.1
Qingtongxia2019Annual9.344.5111.7472.6323.7
Growing period18.449.0111.7472.4406.3
2020Annual11.041.361.6182.5307.2
Growing period18.445.161.6182.3388.0
Hongsipu2019Annual9.244.6242.9543.0342.1
Growing period17.848.3242.7523.2419.0
2020Annual10.643.6209.7432.9325.7
Growing period17.743.0209.6423.1411.0
Table 9. Ratings of climate for wine grape in 2019 and 2020 for the four wine-grape-growing areas in the study region.
CultivarYearShizuishan AreaYinchuan AreaQingtongxia AreaHongsipu Area
Cabernet Sauvignon2019Very goodGood to ExcellentVery goodExcellent
2020GoodGood to ExcellentExcellentGood
Chardonnay2019Very goodGood to ExcellentVery goodGood
2020GoodGood to ExcellentVery goodOrdinary
Disclaimer/Publisher’s Note: The statements, opinions and data contained in all publications are solely those of the individual author(s) and contributor(s) and not of MDPI and/or the editor(s). MDPI and/or the editor(s) disclaim responsibility for any injury to people or property resulting from any ideas, methods, instructions or products referred to in the content.

