1. Introduction
The diffusion of calcium ions from the pore solution to the surrounding water occurs when cementitious materials are subjected to water with calcium concentrations below the equilibrium concentration. Hydraulic structures and nuclear waste containment may have a high risk of calcium leaching due to a pore solution’s relatively high pH value in concrete. Thus, the long-term durability of concrete structures in aggressive water is of great concern [
1,
2].
Generally, the leaching kinetics of cementitious materials is influenced by the cement composition, mineral admixtures, water-to-cement ratio, interfacial transition zone, characteristics of pores, aggressive water, temperature, etc. Using mineral admixtures, such as fly ash (FA) and silica nanoparticles, reduces calcium leaching [
3,
4,
5,
6]. Catinaud et al. [
7] investigated the influence of limestone powder on the calcium leaching of cementitious materials. They found that calcite directly influences the mechanism of calcium leaching in cementitious materials. Under certain environmental conditions, the calcium leaching of hydration products is mainly related to cementitious materials’ interfacial transition zone and pore structure [
8,
9]. Although calcium leaching, which consists of a progressive dissolution of hydration products due to the diffusion of calcium ions to the aggressive water, is a well-known phenomenon, the degradation mechanism of 3D-printed cement paste (3DPC) has not been investigated yet.
In 3DPC, the mesostructure and pore characteristics are very different from those of cast ones. Owing to the spatial distribution characteristics of the weak interfaces between layers, 3DPC shows a laminated mesostructure [
10,
11]. The weak interface makes it of low strength and easy to leach in aggressive water. Furthermore, the air is inevitably exposed to the interface during printing, which can easily cause small flaws and air voids in the 3DPC. Because of the relatively porous mesoscale structure of the 3DPC, the ions could easily diffuse in or out, which would exacerbate the deterioration of materials. In addition to porosity, the pore size, morphology, orientation, and spatial distribution also significantly influence the performances of 3D-printed concrete [
12,
13,
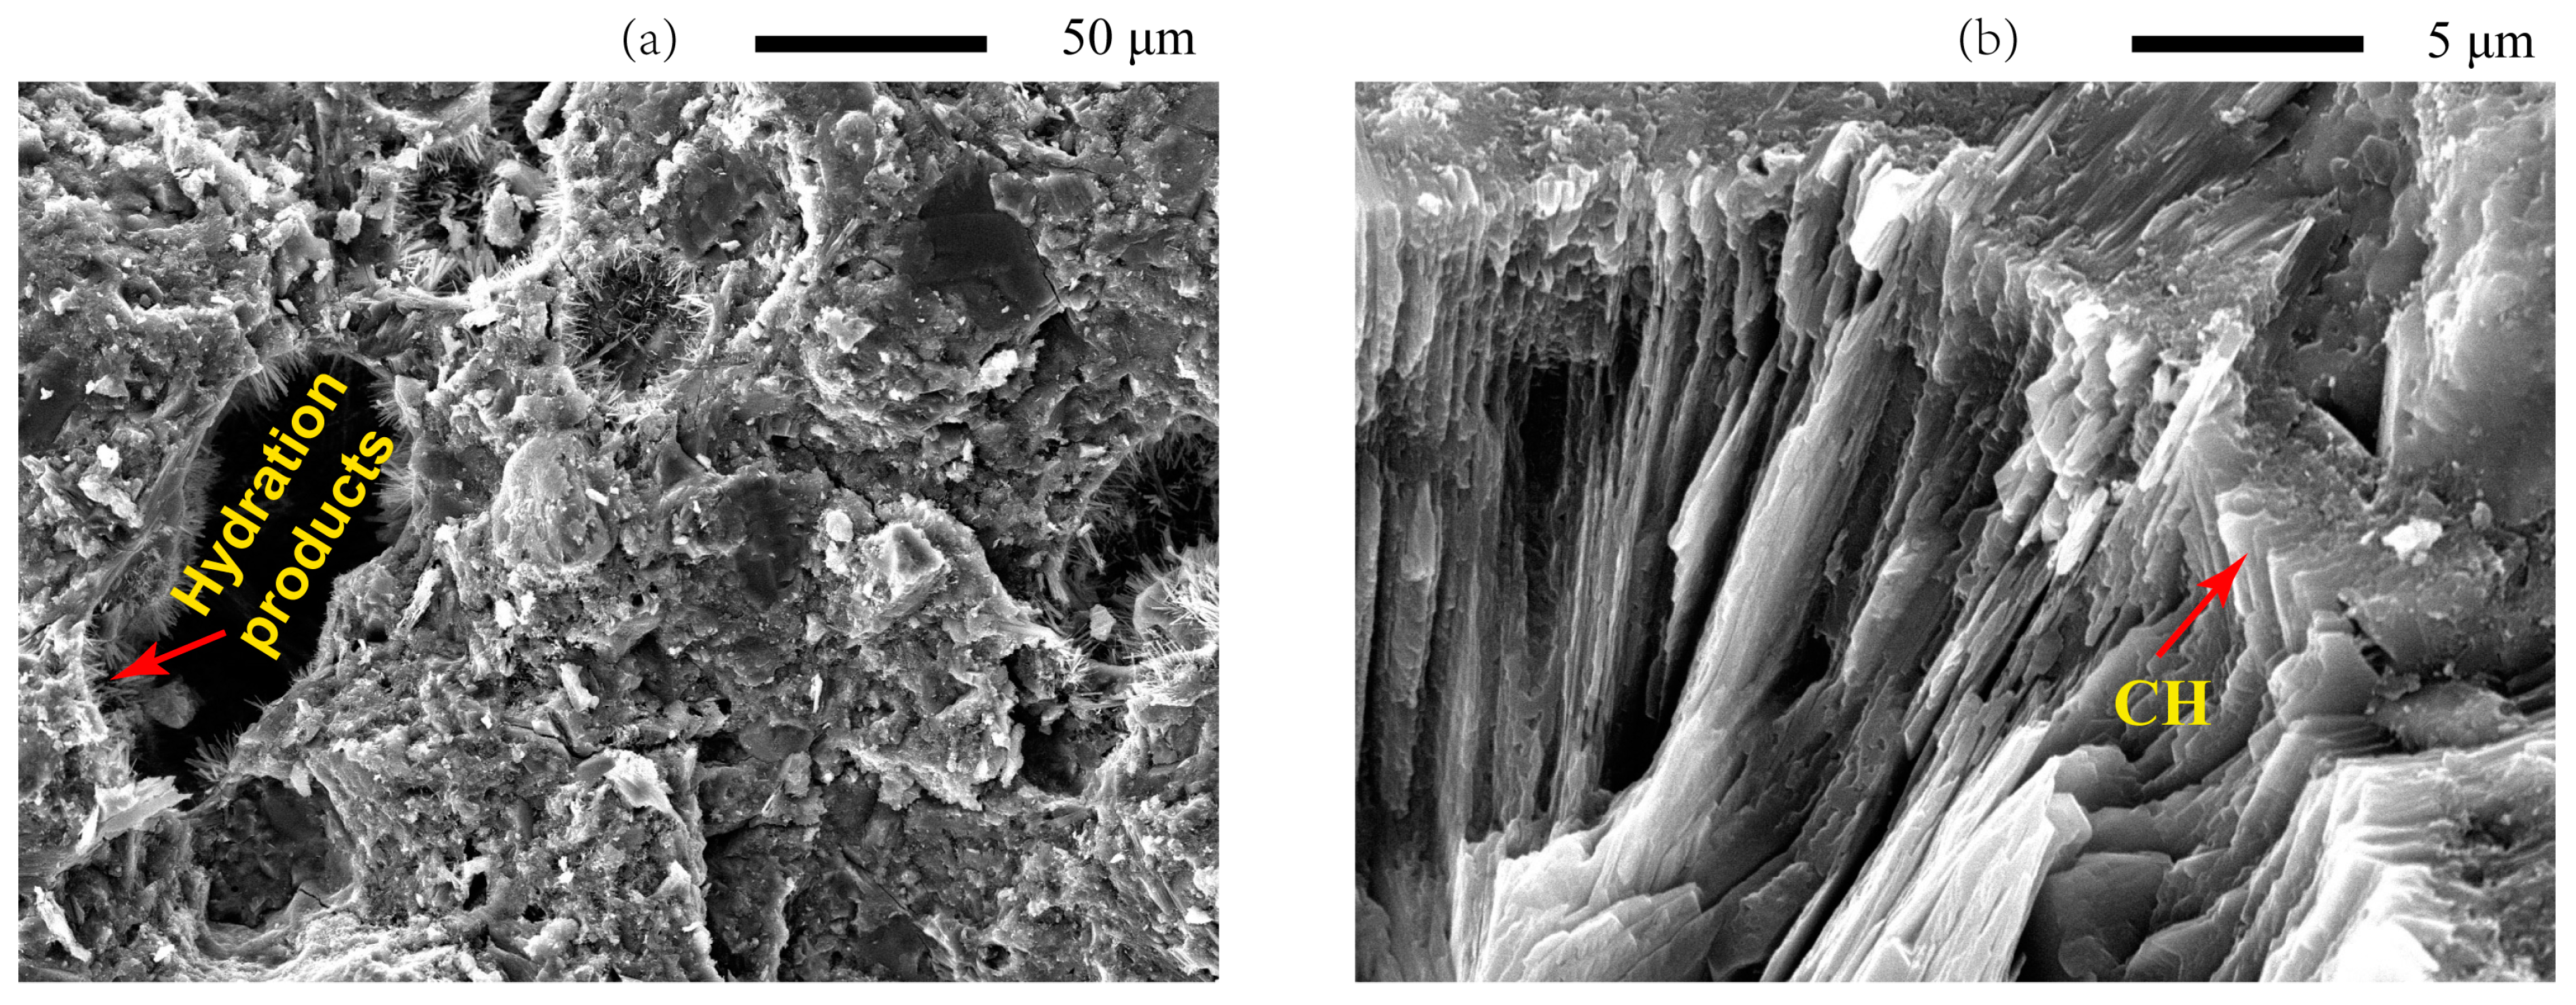
14]. These characteristics of pores, with a large size and long striped morphology, hence, also have a high-volume fraction of portlandite (CH) and other hydration products in the pores shown in
Figure 1a,b. The dissolution of hydration products in pores results in an increase in porosity and changes in pore characteristics. In addition, the dissolution fronts propagate through the pore defects sharply due to the locally quasi-instantaneous dissolution of CH in pores. Thus, these hydration products in pores play a fundamental role in the transport process of ions within the cement matrix.
Generally, the pore solution of cementitious materials is in thermodynamic equilibrium with the C-S-H resulting from the hydration of an unhydrated clinker [
15]. Calcium ions diffuse from the pore solution to the aggressive water due to the concentration gradients between the pore solution and external water when cementitious materials are exposed to aggressive water. The diffusion modifies the chemical equilibrium of the hydration products. The depletion of CH and the decalcification of C-S-H results in the increased porosity and changes in the pore structure of cementitious materials, consequently resulting in a porosity gradient from the core to the surface altered layer [
16,
17,
18,
19]. Thus, the alteration of the hydration products and the pore characteristics is the intrinsic reason for the degradation of cementitious materials [
20]. Though the degradation of cementitious materials in aggressive water due to calcium leaching has been subjected to first studies [
21], little is known about the evolution of hydration products and pore defects of leached 3DPC in ammonium chloride solution.
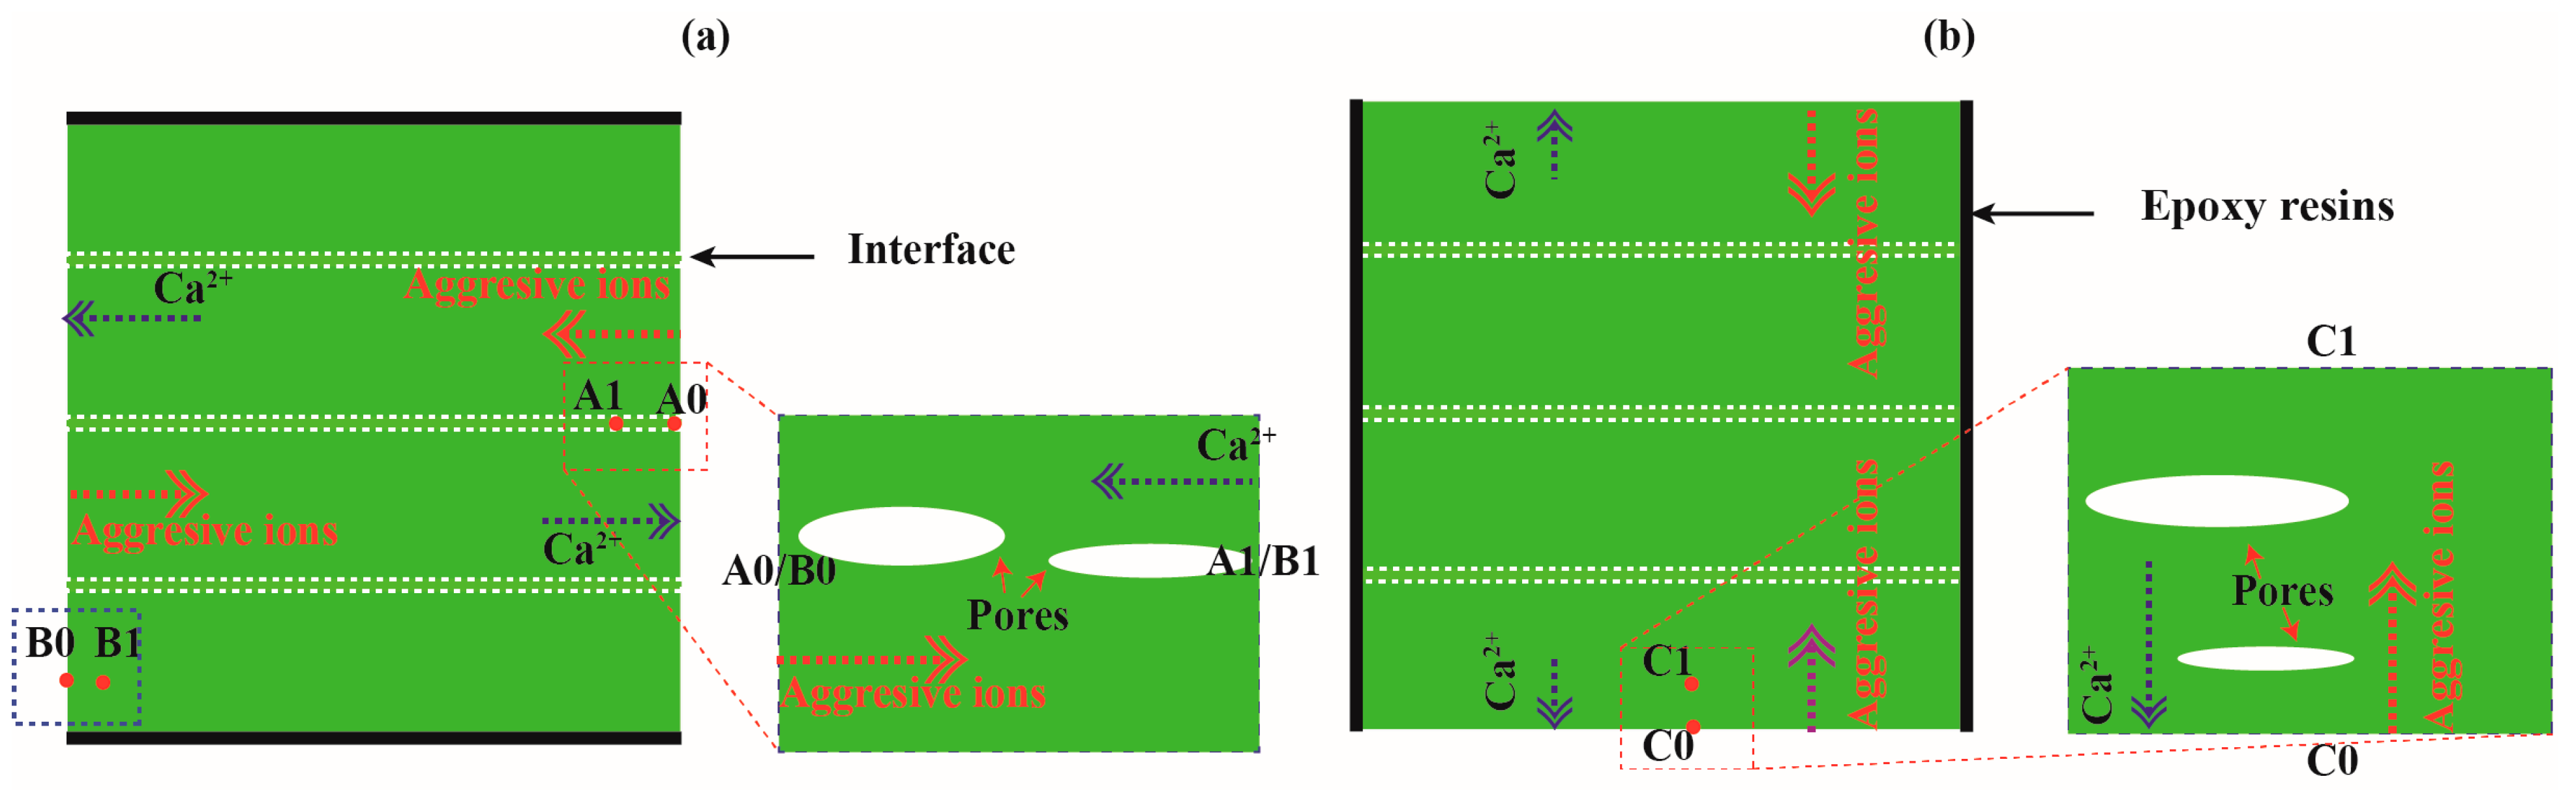
As aforementioned, the transport process of calcium ions in 3DPC will be modified by pore defects with relatively large sizes and long striped morphology. The calcium leaching process of 3DPC due to CH dissolution and C-S-H decalcification may differ from that of cast ones. A hypothesis described the degradation process of the 3DPC during leaching is shown in
Figure 2a,b. The calcium leaching process in the
X or
Y directions significantly differs from that in the
Z direction. It can be seen from the figure that calcium ion concentration gradients parallel to the
X direction or
Y direction are ascribed to the long-striped voids. In contrast, the calcium ion concentration gradients are perpendicular to the
Z direction. Thus, additional porosity can occur even at a certain depth from the surface due to the long-striped voids. Regarding 3DPC leached in the
Z direction, hydration products’ dissolution occurs mainly at the dissolution fronts. Therefore, calcium ions could easily diffuse out from the pore solution in the
X or
Y directions, but it is relatively difficult in the
Z direction. On the other hand, calcium ions leached in the
X or
Y directions are more likely to be partially compensated via weak interfaces than in the
Z direction due to the continued hydration of an unhydrated clinker inside the materials. These additional alkali ions have been reported to significantly reduce the solubility of CH in pores [
22]. The increase in the concentration of calcium ions in the pore solution may be retarded by the decalcification of C-S-H in the surface layer of materials. This indicates that the surface layer of 3DPC leached in the
Z direction may lose more hydration products than in the
X or
Y directions.
Additionally, 3DPC has a higher environmental impact than conventional cementitious materials due to its high cement content. The production of Portland cement releases large amounts of CO
2 due to the calcination of limestone. Therefore, more environmentally friendly building materials are of great interest in reducing the use of Portland cement [
23,
24,
25,
26]. Aggregate micro fines (AMF) and FA have replaced Portland cement in 3DPC to increase the material’s sustainability. The preparation of 3DPC by incorporating environmentally friendly AMF and FA can decrease the consumption of Portland cement, reducing the burden on the environment and decreasing the cost of raw materials. This work investigates the calcium leaching anisotropy of 3DPC with AMF and FA. We compare the performances, such as the bulk density, water absorption, leaching depths, and compressive strength, of 3DPC in different calcium leaching directions. The evolution of hydration products and pores of 3DPC in different calcium leaching directions is also analyzed.
3. Results and Discussion
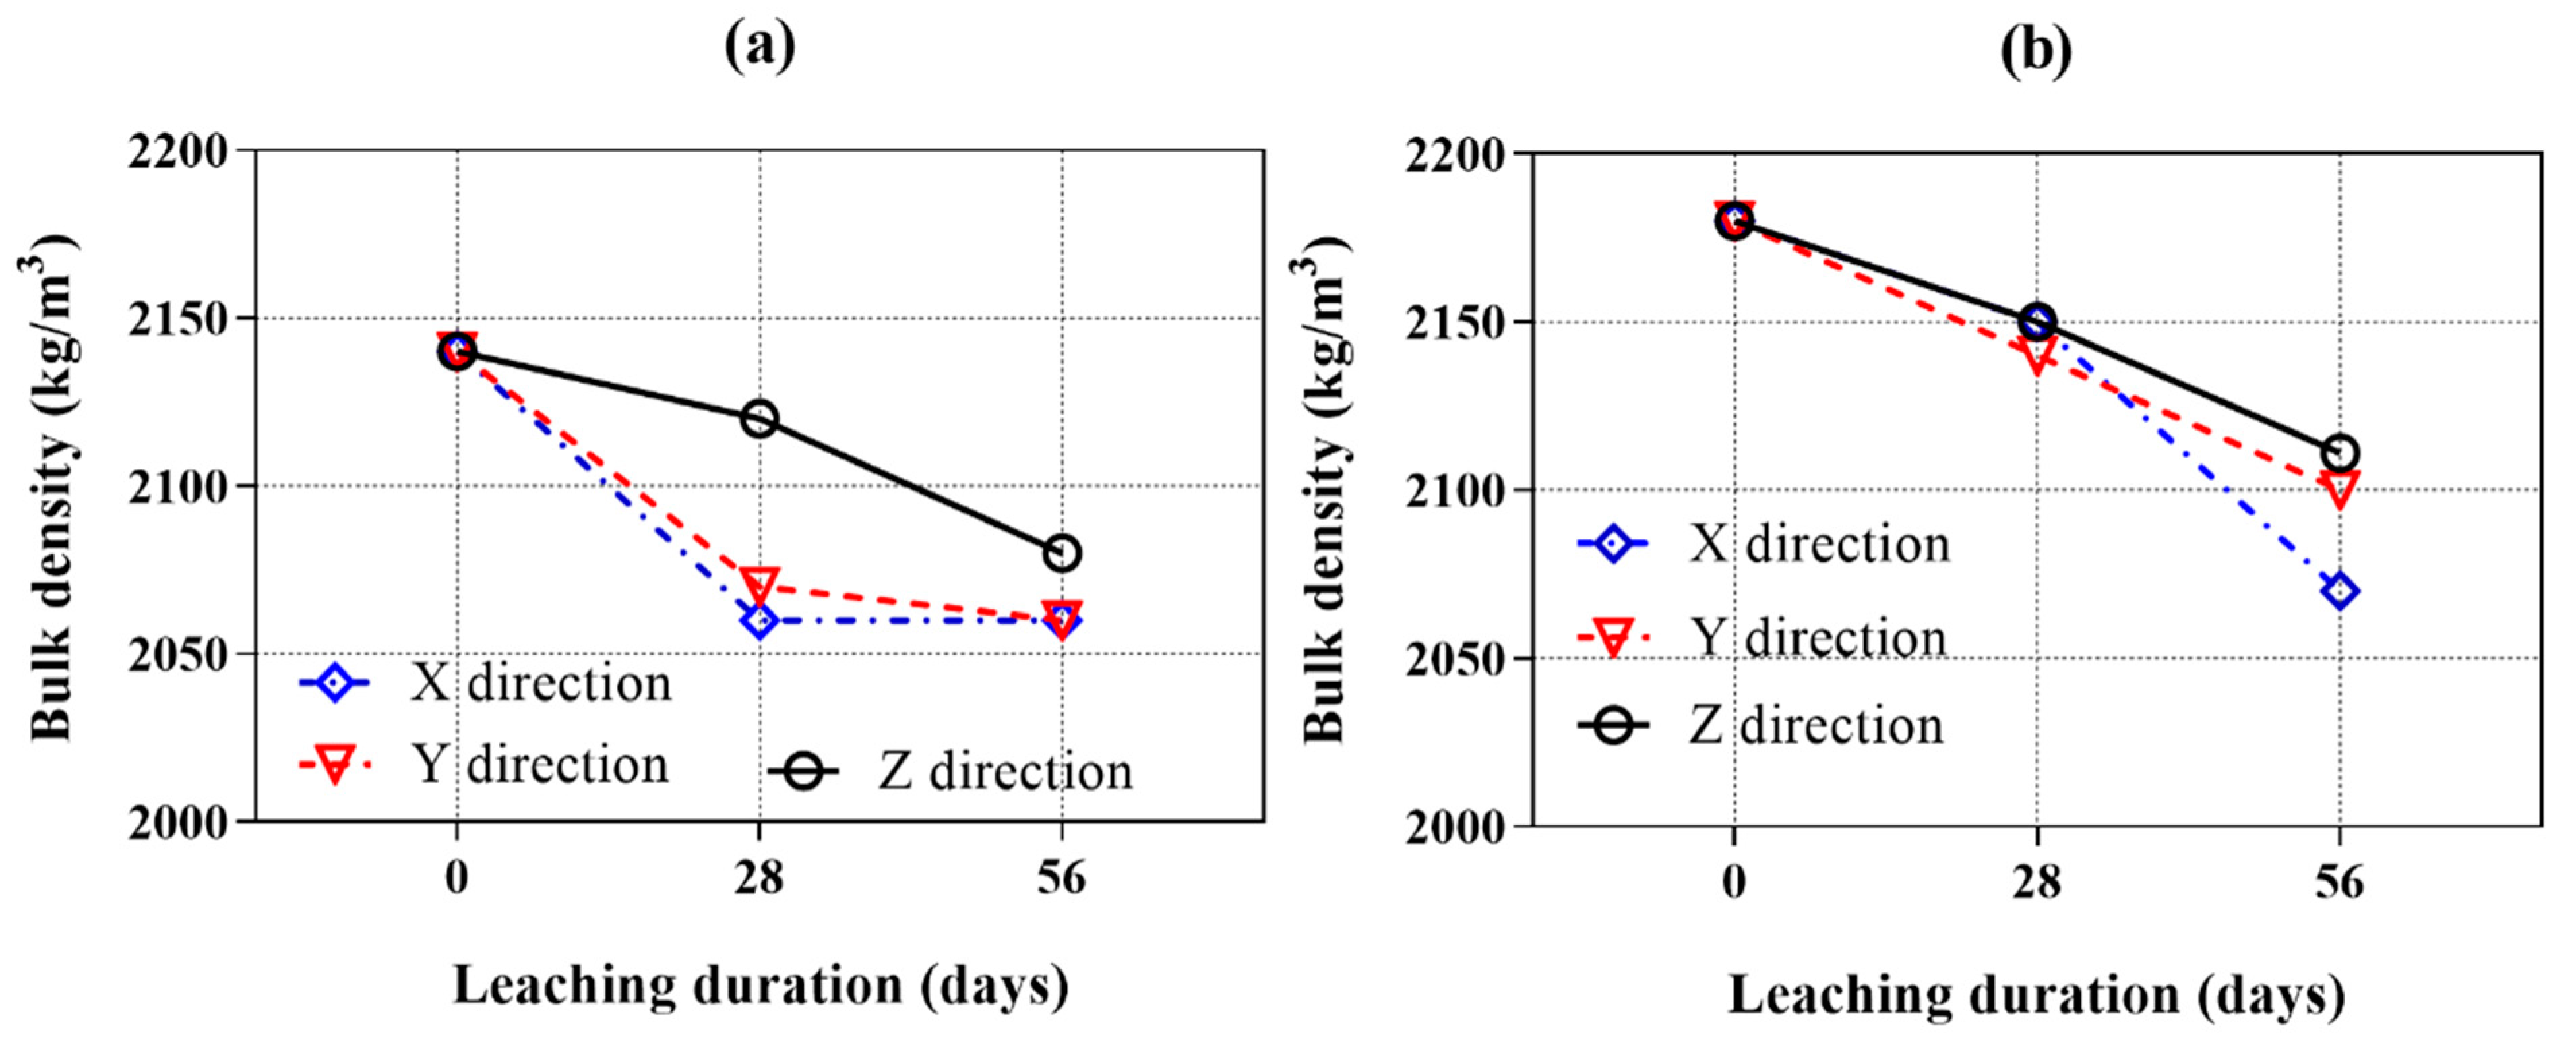
3.1. Decrease in Bulk Density
Figure 8a,b show the bulk density of the samples cured in water for 28 days and those leached for 28 and 56 days in ammonium chloride solution. The initial bulk density of samples with AMF is higher than that of the samples without AMF because of the higher specific gravities of the AMF than the FA.
As expected, the bulk density of all samples decreased with the calcium leaching duration. The longer the calcium leaching duration, the greater the reduction in bulk density. These results indicate that the dissolution of hydration products progressed gradually with the leaching period. It was also shown that the bulk density of AMF0FA20 leached in the Z direction is higher than that in the X and Y directions. After 28 days of calcium leaching, the bulk density of AMF0FA20 leached in the X, Y, and Z directions decreased by 3.7%, 3.3%, and 0.9%, respectively. Then, the bulk density gradually decreased over the calcium leaching time. After 56 days of calcium leaching, the bulk density of the sample leached in the Z direction was still higher than the samples leached in the X and Y directions. As for AMF10FA10, the bulk density of samples leached in the X and Y directions was equal to or less than that in the Z direction at 28 days of calcium leaching. After 56 days of calcium leaching, the bulk density of samples leached in the X and Y directions was lower than the sample leached in the Z direction by 1.9% and 0.5%. Overall, the bulk density of samples leached in the Z direction significantly differed from those leached in the X and Y directions. This demonstrates the calcium leaching anisotropy of 3DPC.
Compared to the AMF0FA20, the AMF10FA10 leached both in the X and Y directions and exhibited a lower calcium leaching speed. This implies that AMF positively affects the calcium leaching anisotropy of 3DPC.
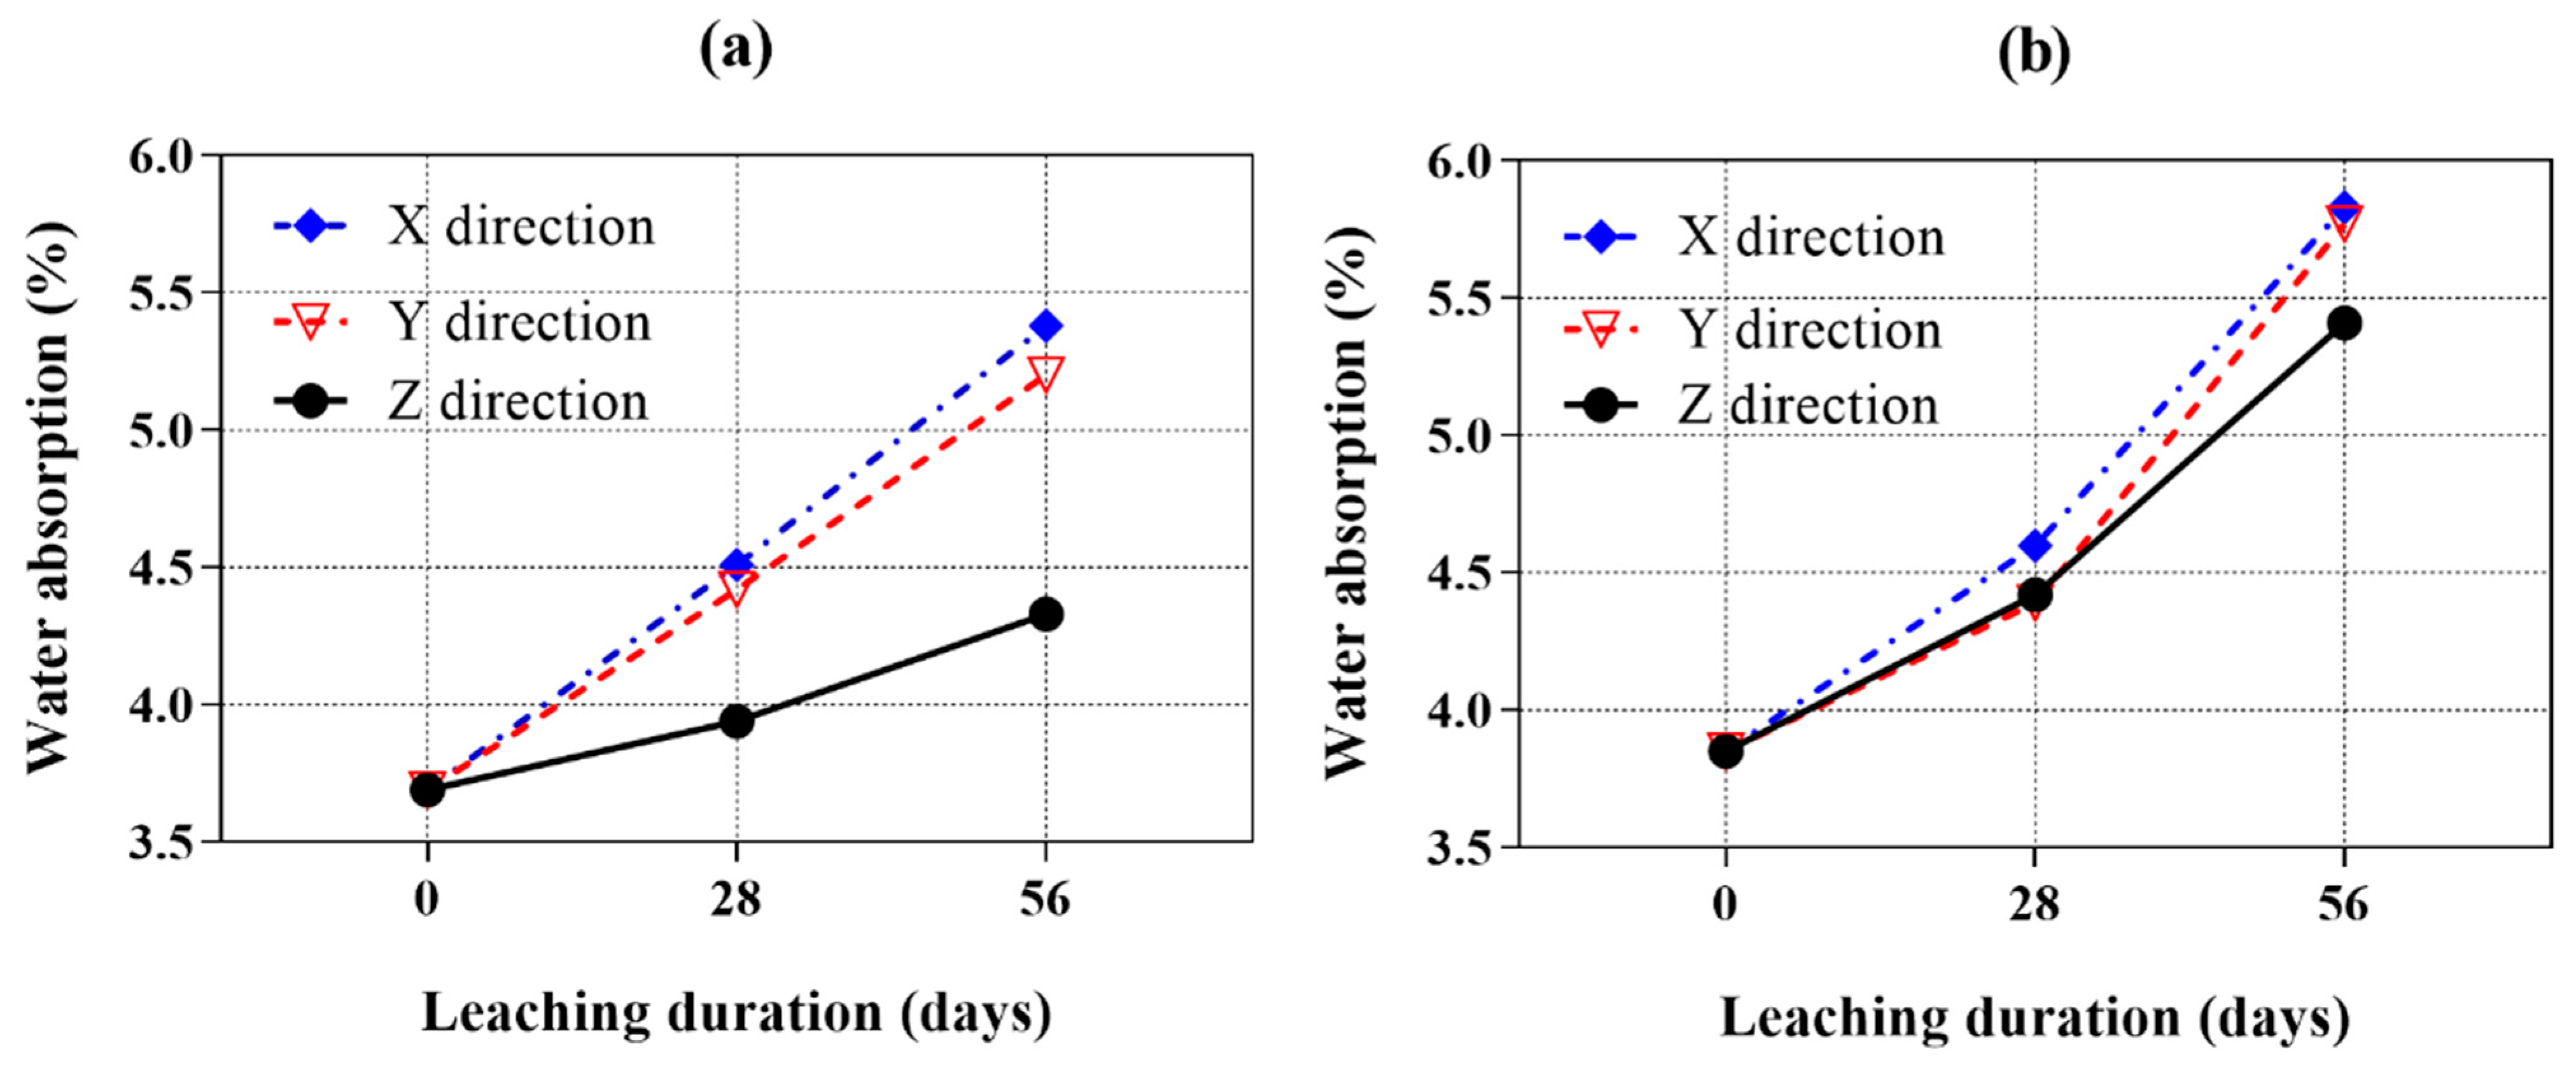
3.2. Water Absorption
The resistivity of calcium leaching mainly depends on the water absorption of the cementitious materials. Thus, variation in water absorption is an important parameter for investigating the calcium leaching behaviors of 3DPC.
Figure 9a,b show the water absorption of all samples after exposure to ammonium chloride solution for 28 and 56 days. It generally showed the opposite trend as the bulk density curves illustrated previously. With exposure, the water absorption increased in all samples due to the ingress of ammonium chloride. The water absorption of samples leached in the
X and
Y directions are similar. However, all samples leached in the
Z direction showed significantly lower water absorption than those leached in the
X and
Y directions, which is consistent with the bulk density results.
The AMF0FA20 leached in the
X direction showed comparable water absorption with respect to the
Y direction. At 28 days of calcium leaching, the water absorption of the samples leached in the
X and
Y directions increased by about 14.5% and 12.2% more than that of leached in the
Z direction. At 56 days of calcium leaching, the water absorption of samples leached in the
X and
Y directions showed a 24.2% and 20.1% increase, respectively, compared to that of leached in the
Z direction. A similar phenomenon was also observed for AMF10FA10 in
Figure 9b. Among all the calcium leaching directions, the AMF10FA10 leached in the
Z direction showed the lowest increase in water absorption value under ammonium chloride solution at 28 and 56 days. In addition, compared to AMF0FA20, AMF10FA10 showed less calcium leaching anisotropy after exposure to ammonium chloride solution for 28 and 56 days.
3.3. Leaching Depths
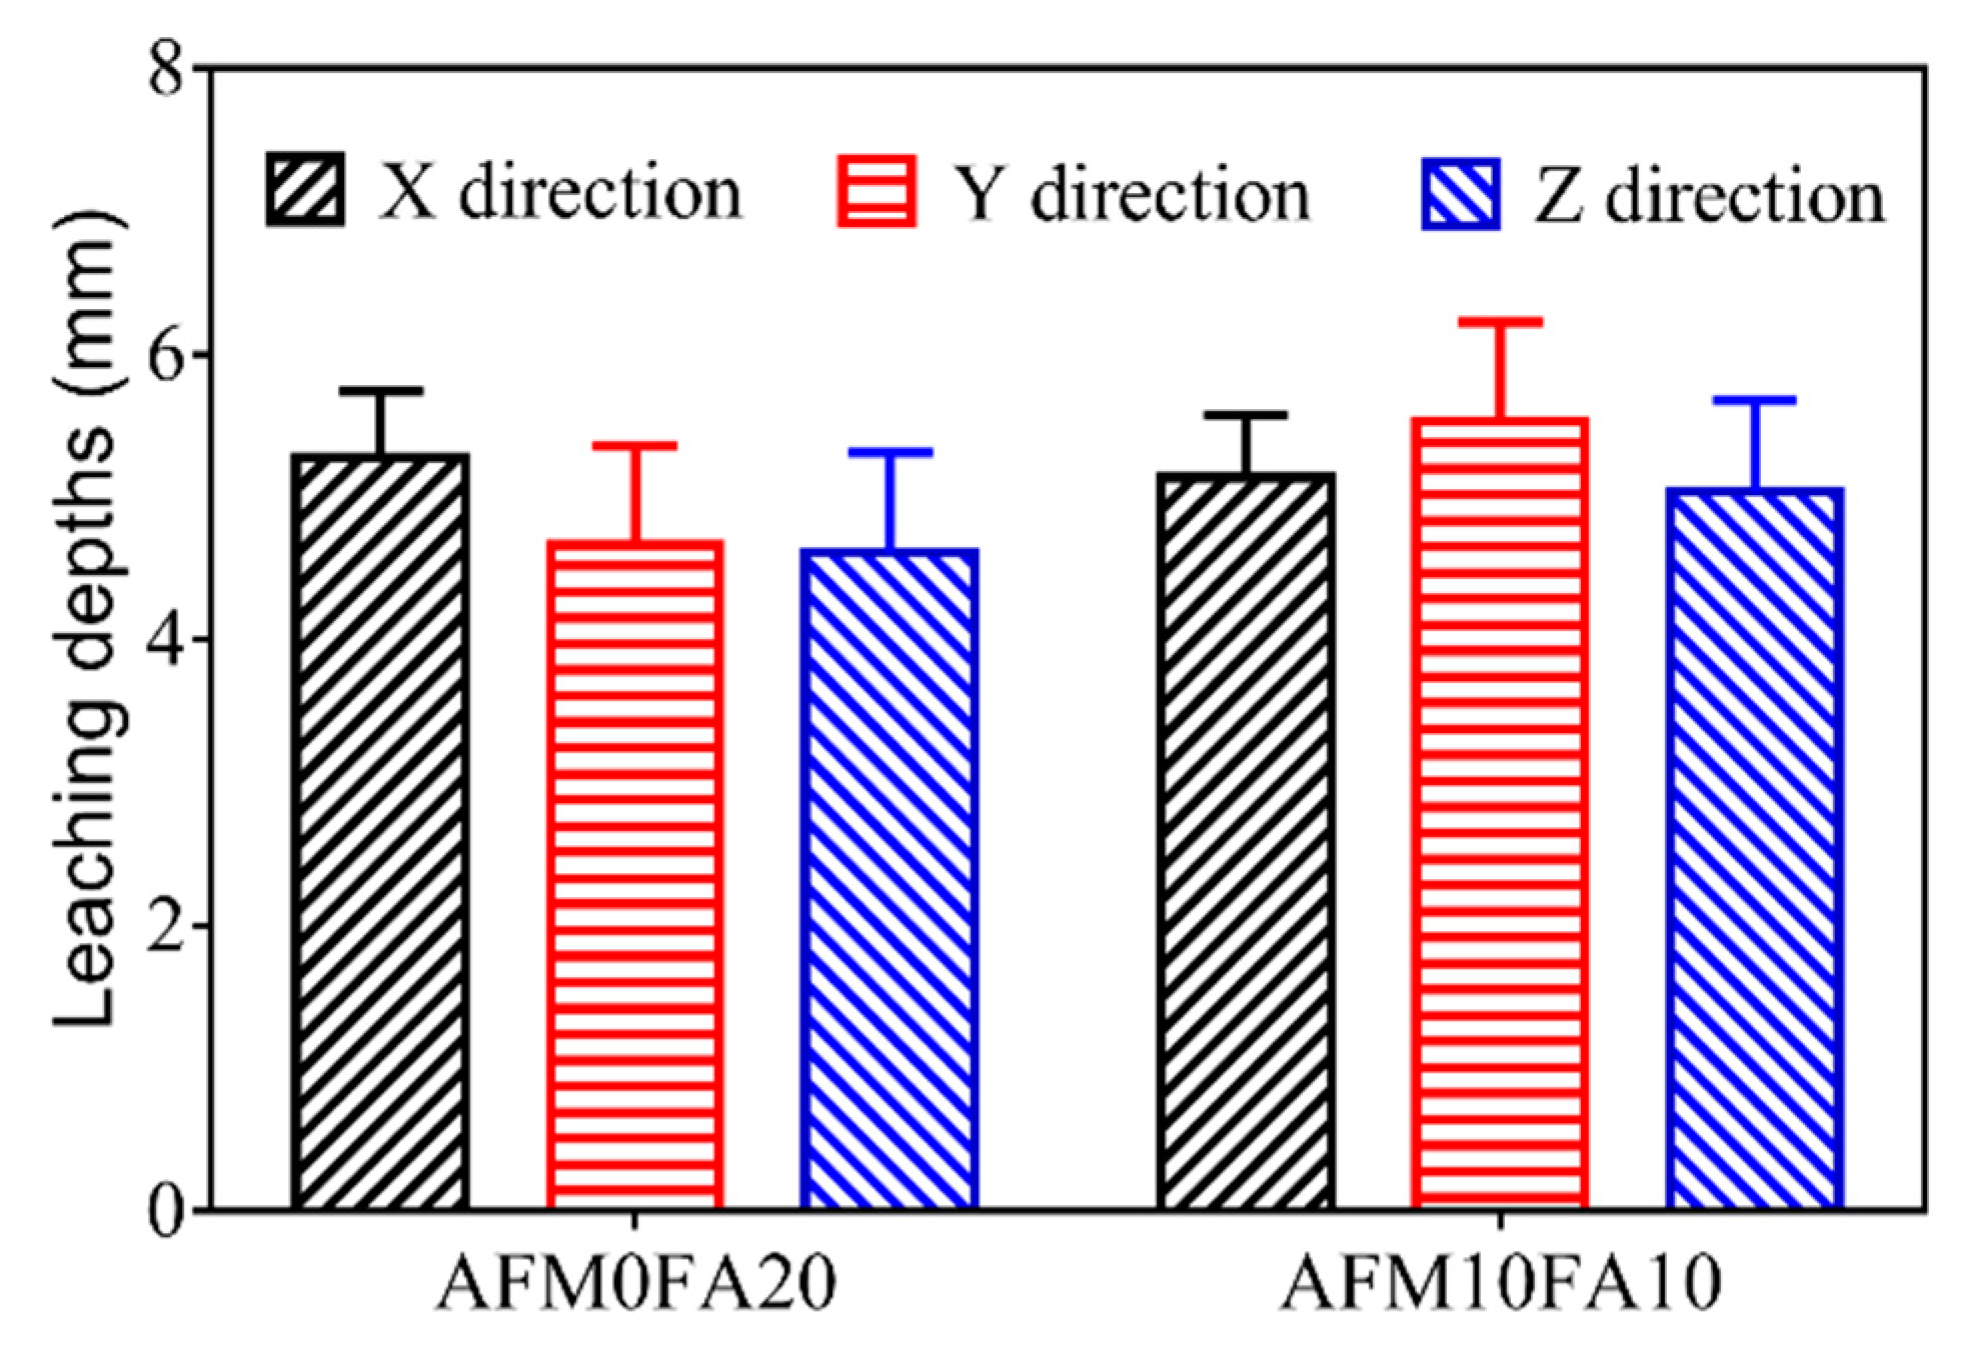
Figure 10 shows the leaching depths for the AMF0FA20 and AMF10FA10 after 56 days of leaching. A leaching depth of 4.6 mm to 5.5 mm is obtained for the samples after 56 days of leaching, which is much higher than the values previously reported for cast cement pastes [
6]. This phenomenon can be attributed to the higher porosity of 3DPC than cast ones. The AMF10FA10 shows higher leaching depths in all three directions than AMF0FA20, indicating a higher leaching resistance for the AMF0FA20. The reason for this observation could be the pozzolanic effects of FA, resulting in the generation of C-S-H with a low Ca-Si molar ratio and then densifying the microstructure of materials. In addition, all samples in the
Z direction show smaller leaching depths than in the
X and
Y directions, indicating the calcium leaching anisotropy of 3DPC.
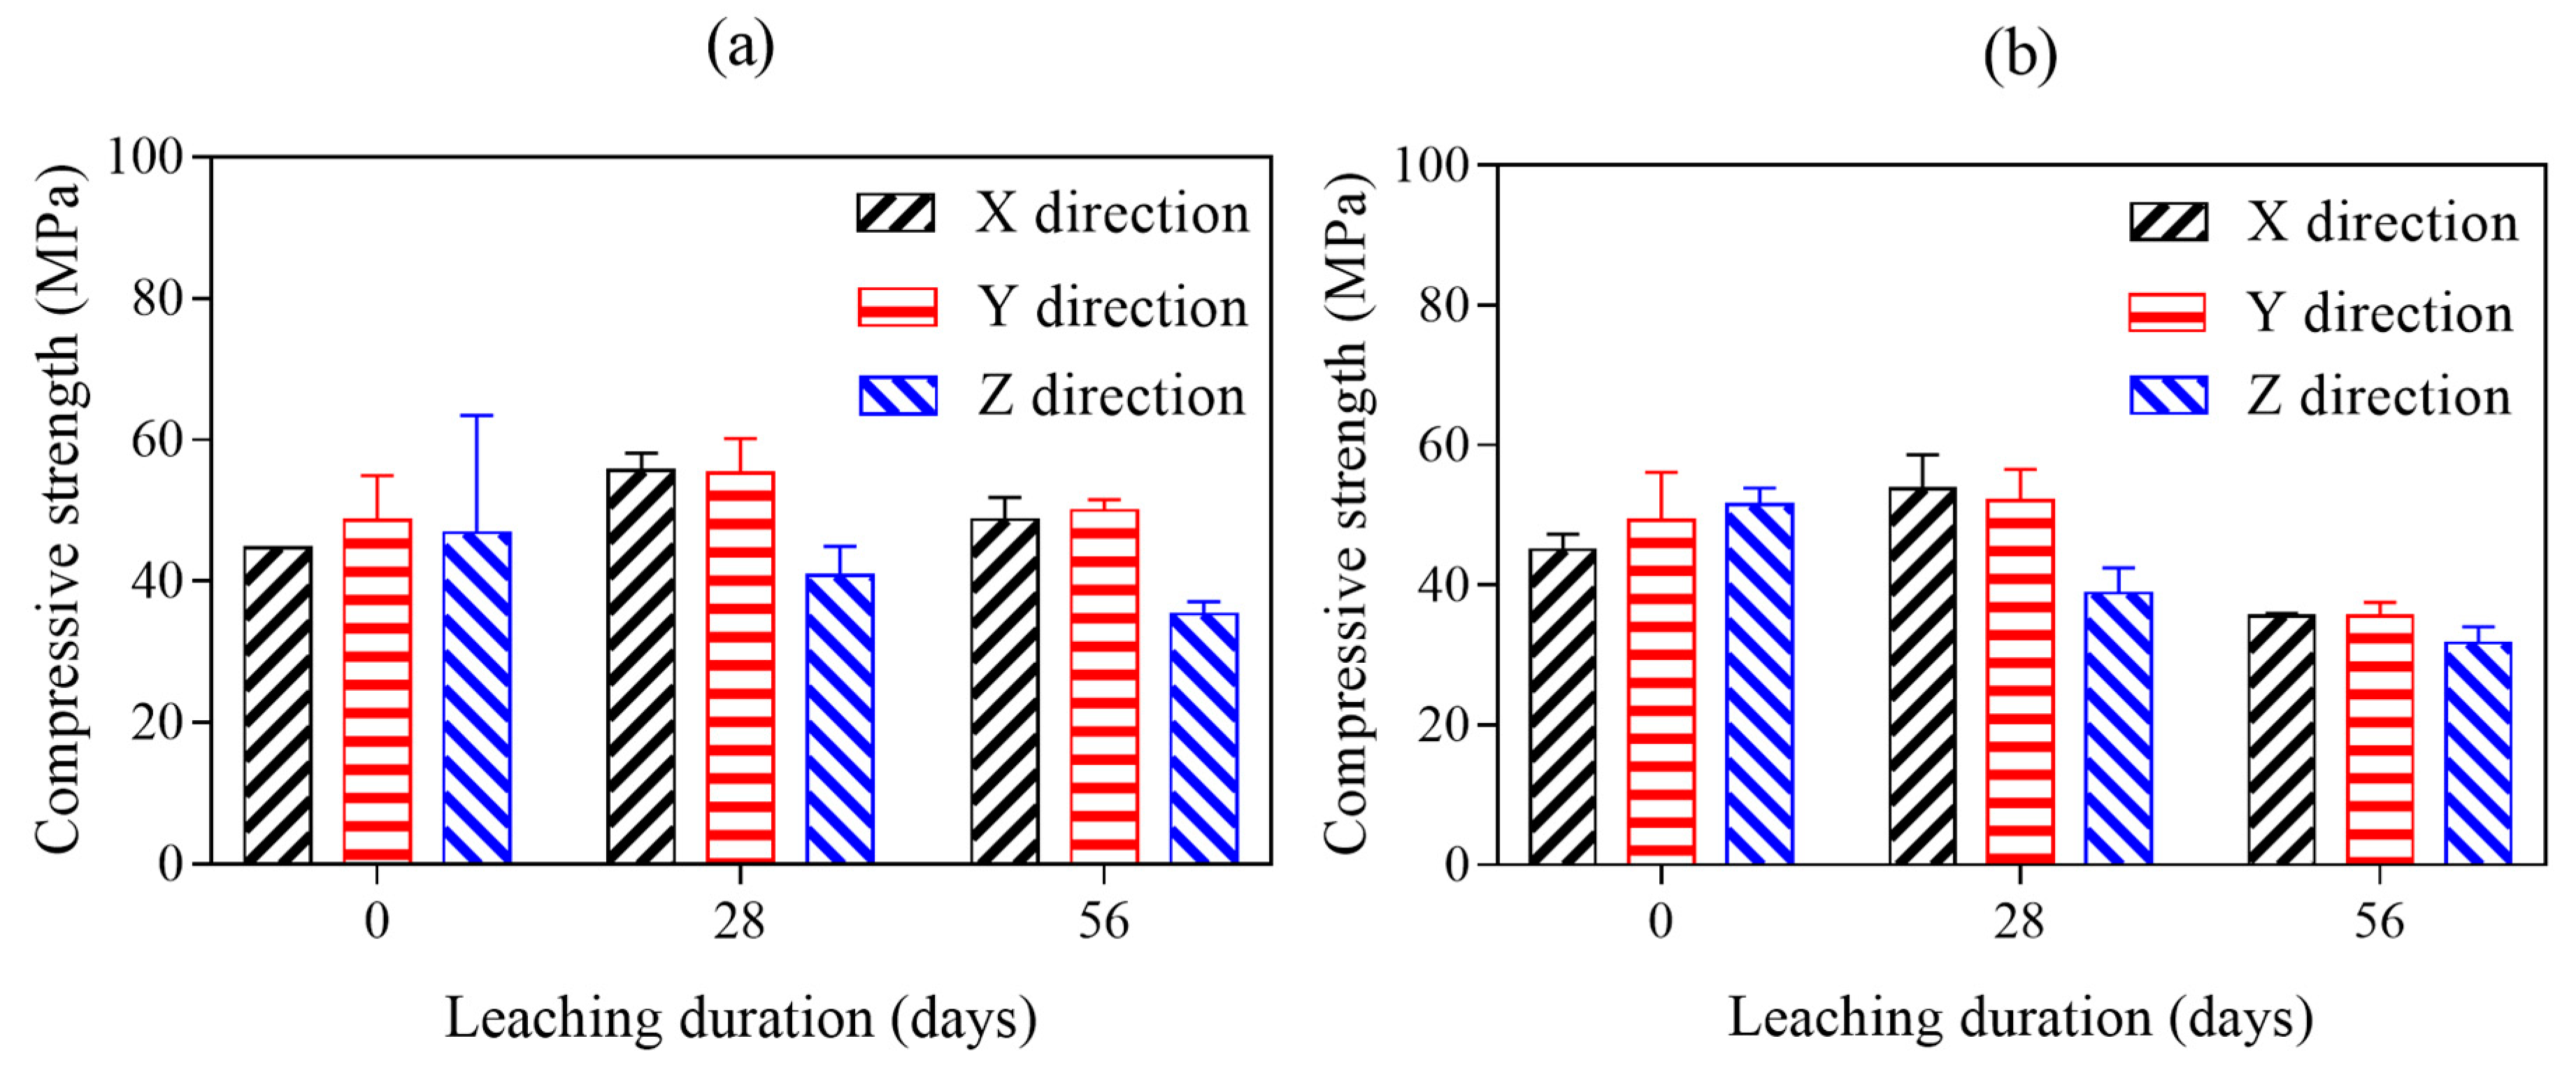
3.4. Mechanical Anisotropy
The compressive strength test is the usual way to evaluate the mechanical anisotropy of 3D-printed cement pasts exposed in ammonium chloride solution. The compressive strength results of 28-day cured and 28- and 56-day ammonium-chloride-exposed AMF0FA20 and AMF10FA10 are given in
Figure 11a,b. Compared to reference samples (28 days cured and before ammonium chloride exposed 3DPC), the compressive strength of all samples leached in the
X and
Y direction is still increasing after exposure to an aggressive environment for 28 days. An unreacted clinker, detected in the samples by XRD analysis (see
Figure 12), is one of the main reasons for the increased compressive strength after 28 days of calcium leaching. The new hydration products filled the pores of samples, making it more difficult for the ammonium chloride solution to get into them.
All samples leached in X or Y directions showed the highest compressive strength at 28 days of calcium leaching. AMF0FA20 leached in the X and Y directions still had higher compressive strength than references even after 56 calcium leaching days. It can be confirmed that the increase in the compressive strength of samples leached in the X direction or Y direction due to the hydration of cement was higher than that of the decrease in compressive strength due to the erosion of the ammonium chloride before 28 days of calcium leaching. After that, the compressive strength of the samples leached in the X direction or Y direction decreased so rapidly that its growth could no longer compensate for its decrease. As for samples leached in the Z direction, the compressive strength consistently decreased with calcium leaching duration. Among all the calcium leaching directions, samples leached in the Z direction showed the least reduction in compressive strength value under ammonium chloride exposure at 28 and 56 days. It was indicated that the increase in compressive strength of samples leached in the Z direction due to the hydration of cement was lower than that of the decrease in compressive strength due to the erosion of the ammonium chloride during calcium leaching.
In order to get a clear picture of variations in mechanical anisotropy of 3DPC after long-term exposure to ammonium chloride solution, the mechanical anisotropy coefficients of all samples after calcium leaching for 28 and 56 days are given in
Table 3. The mechanical anisotropy coefficients of 28 days of cured samples before calcium leaching are also listed in this table.
The first thing that becomes apparent from
Table 3 is the samples’ significantly different mechanical anisotropy coefficients before and after calcium leaching. As shown in this table, the
IX,
IY, and
IZ of AMF0FA20 increased due to the ingress of ammonium and chloride ions in the ammonium chloride solution. Compared to the
IX and
IY of AMF0FA20,
IZ showed the lowest value before calcium leaching. After exposure to ammonium chloride solution for up to 28 days, all directions showed a progressive increase in compressive strength anisotropy coefficient. The
Z direction showed the highest compressive strength anisotropy coefficient. Further, during exposure to the ammonium chloride solution,
IZ maintained the highest compressive strength anisotropy coefficient for up to 56 days among all the calcium leaching directions. As for AMF10FA10, the
Z direction showed a comparable compressive strength anisotropy coefficient with respect to the
X and
Y directions before calcium leaching. After 28 days of calcium leaching, the compressive strength anisotropy coefficient in the
X,
Y, and
Z directions increased marginally by 64.7%, 160%, and 292.3%, respectively. However, all three directions showed a decline in compressive strength anisotropy coefficient after 56 days of exposure.
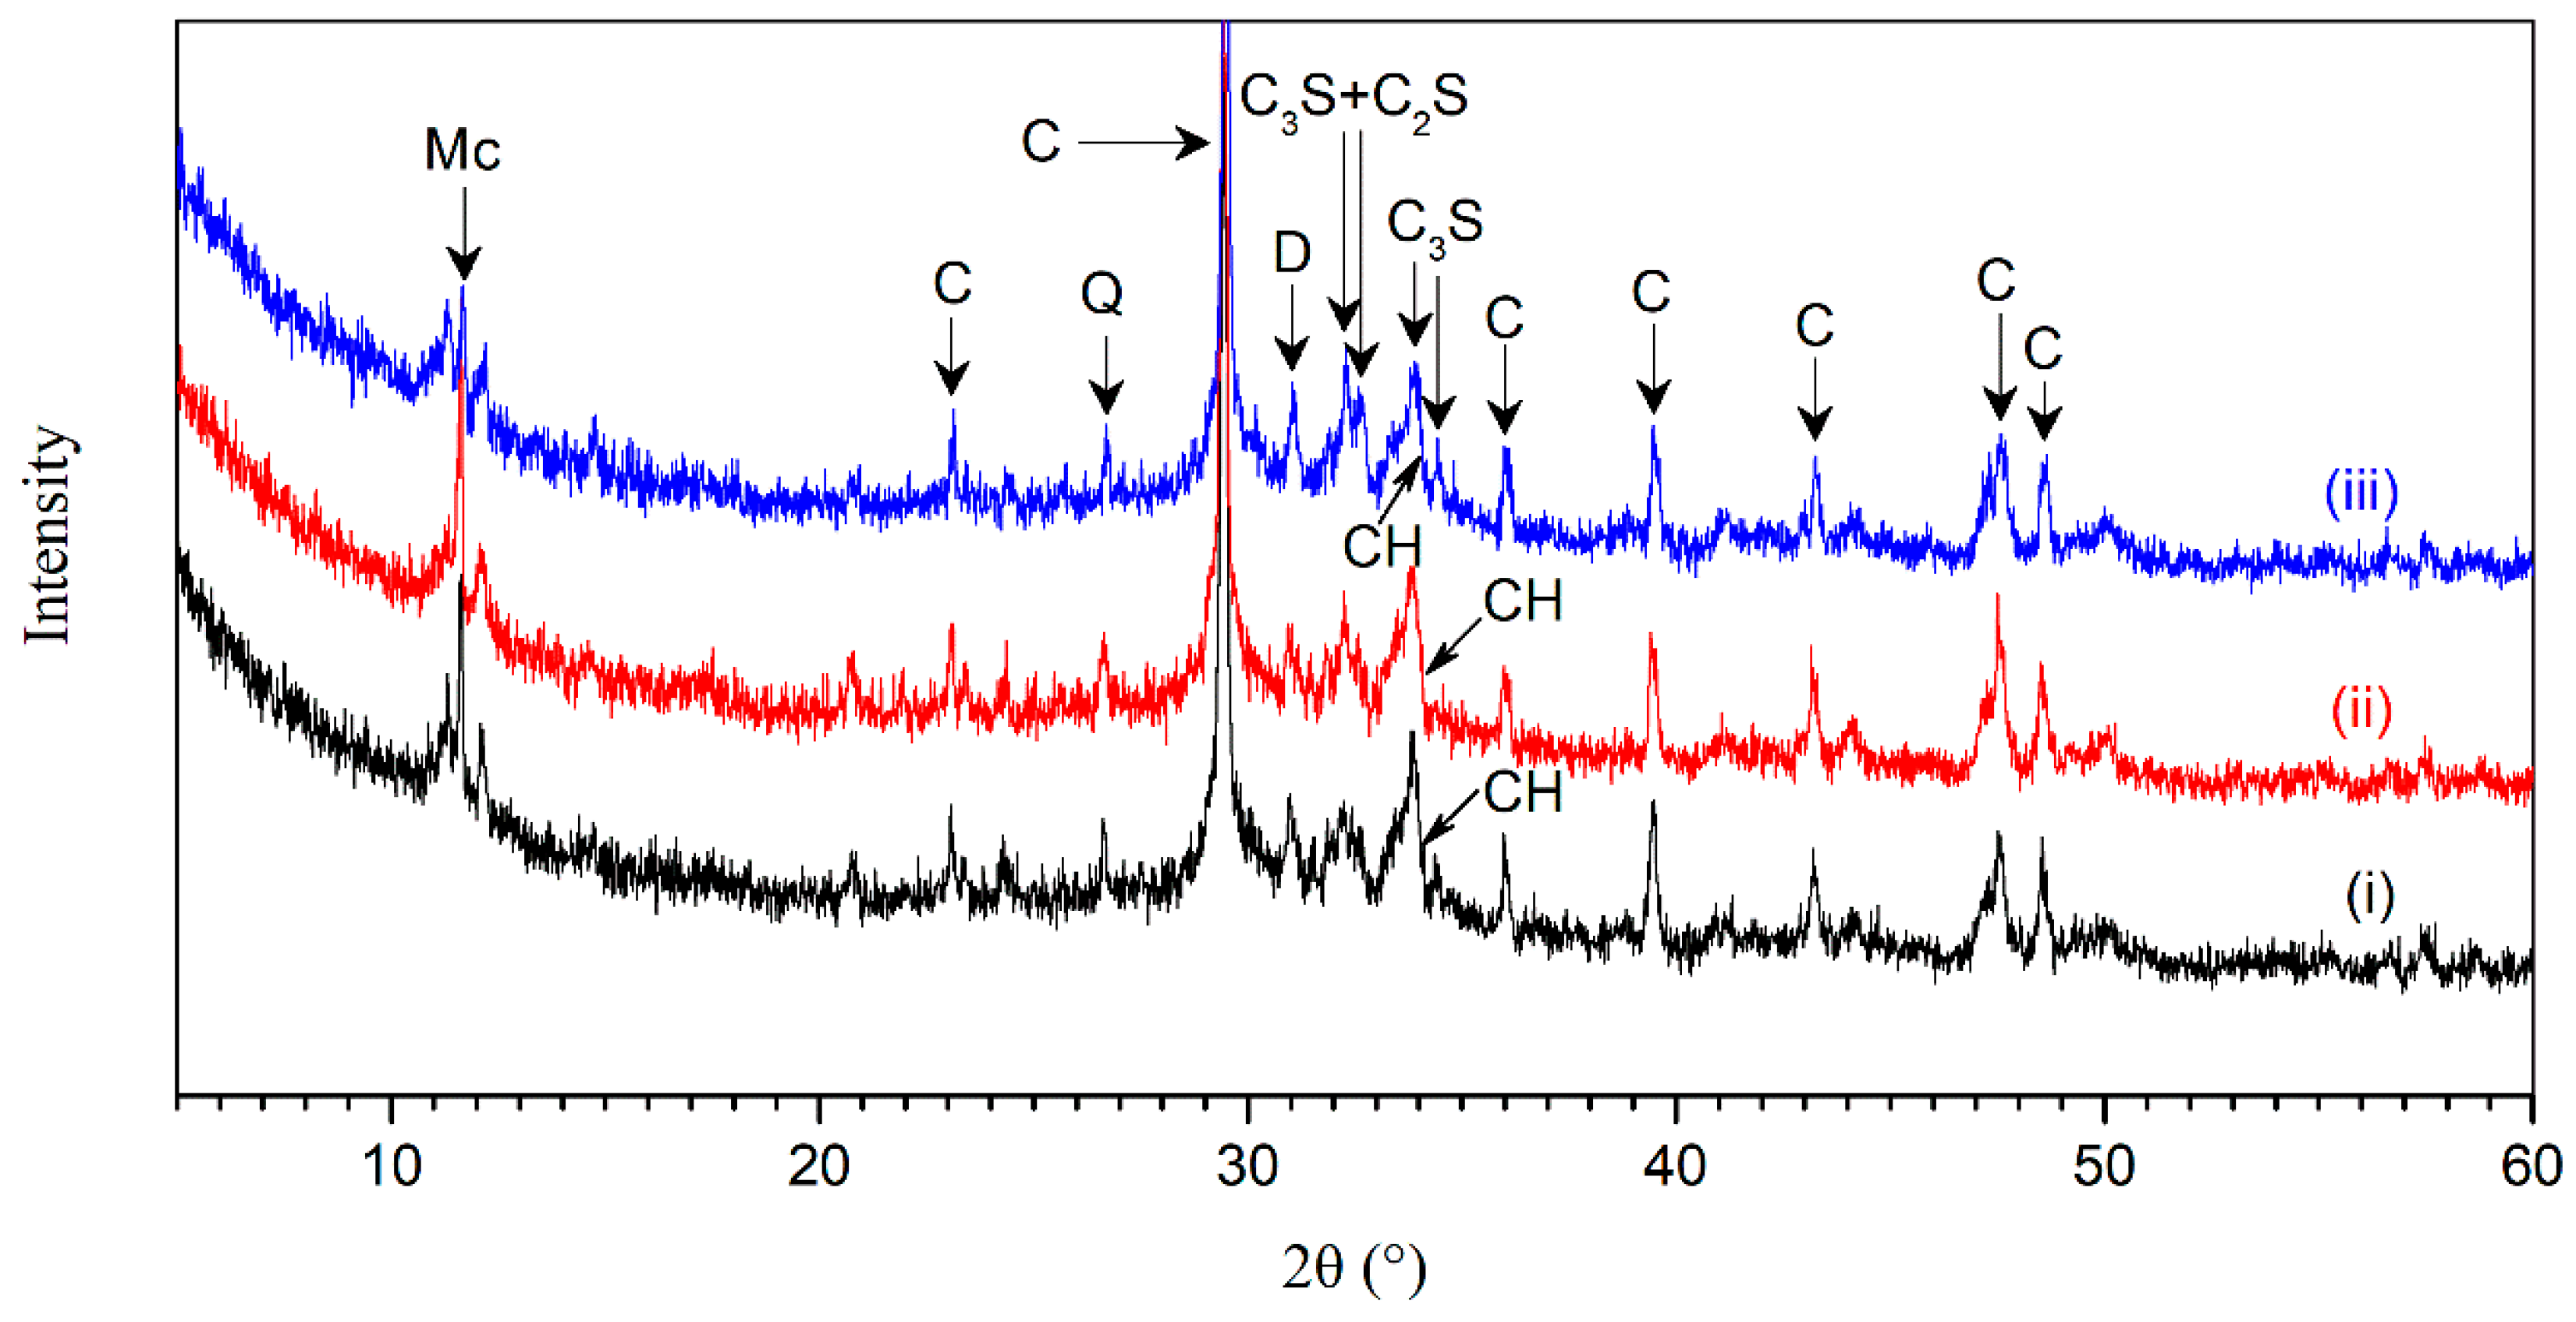
3.5. XRD Analysis
Figure 12 shows the X-ray diffractogram of AMF10FA10 leached in
X,
Y, and
Z directions after exposure to the ammonium chloride solution for 56 days. The diffraction spectra analysis in samples indicated the following mineral compounds: calcite (C), quartz (Q), dolomite (D), C
3S (alite), C
2S (belite), CH, and monocarbonate (Mc). The monocarbonate was found since AMF, mainly composed of calcite, was present in the AMF10FA10. The presence of monocarbonate indicated a reaction between calcite and aluminum phases in cement [
32], which prevented the conversion of AFt into AFm [
33]. Catinaud et al. have reported that the formation of monocarbonate is due to the depletion of CH [
7]. The diffraction peaks for monocarbonate in all samples are relatively high, which implies it has high stability in the ammonium chloride solution. The remaining C
3S and C
2S in the samples indicate that the Portland cement was not fully hydrated even after 56 days of leaching.
The CH peaks during calcium leaching were considered the primary indicator of hydration product stability in 3DPC in this work. It can be observed that the intensity height for CH located at the 2-theta angle of 34.07° was relatively low after exposure, which indicated that the hydration products in samples were substantially decomposed due to the calcium leaching.
The peaks for AMF10FA10 leached in the X, Y, and Z directions appeared similar. However, the intensity height for CH at a 2-theta angle of 34.07° in the Z direction is lower by 24.2% and 10.1% than in the X and Y directions, respectively. It is interesting to note that the results were the opposite of what we had expected. This phenomenon is also found in DTG−TG analysis, as shown in the next section. In addition, the results in this figure also showed a relatively lower intensity height of monocarbonate in the Z direction than that in the X and Y directions. These observations indicate the calcium leaching anisotropy of 3DPC in ammonium chloride solution.
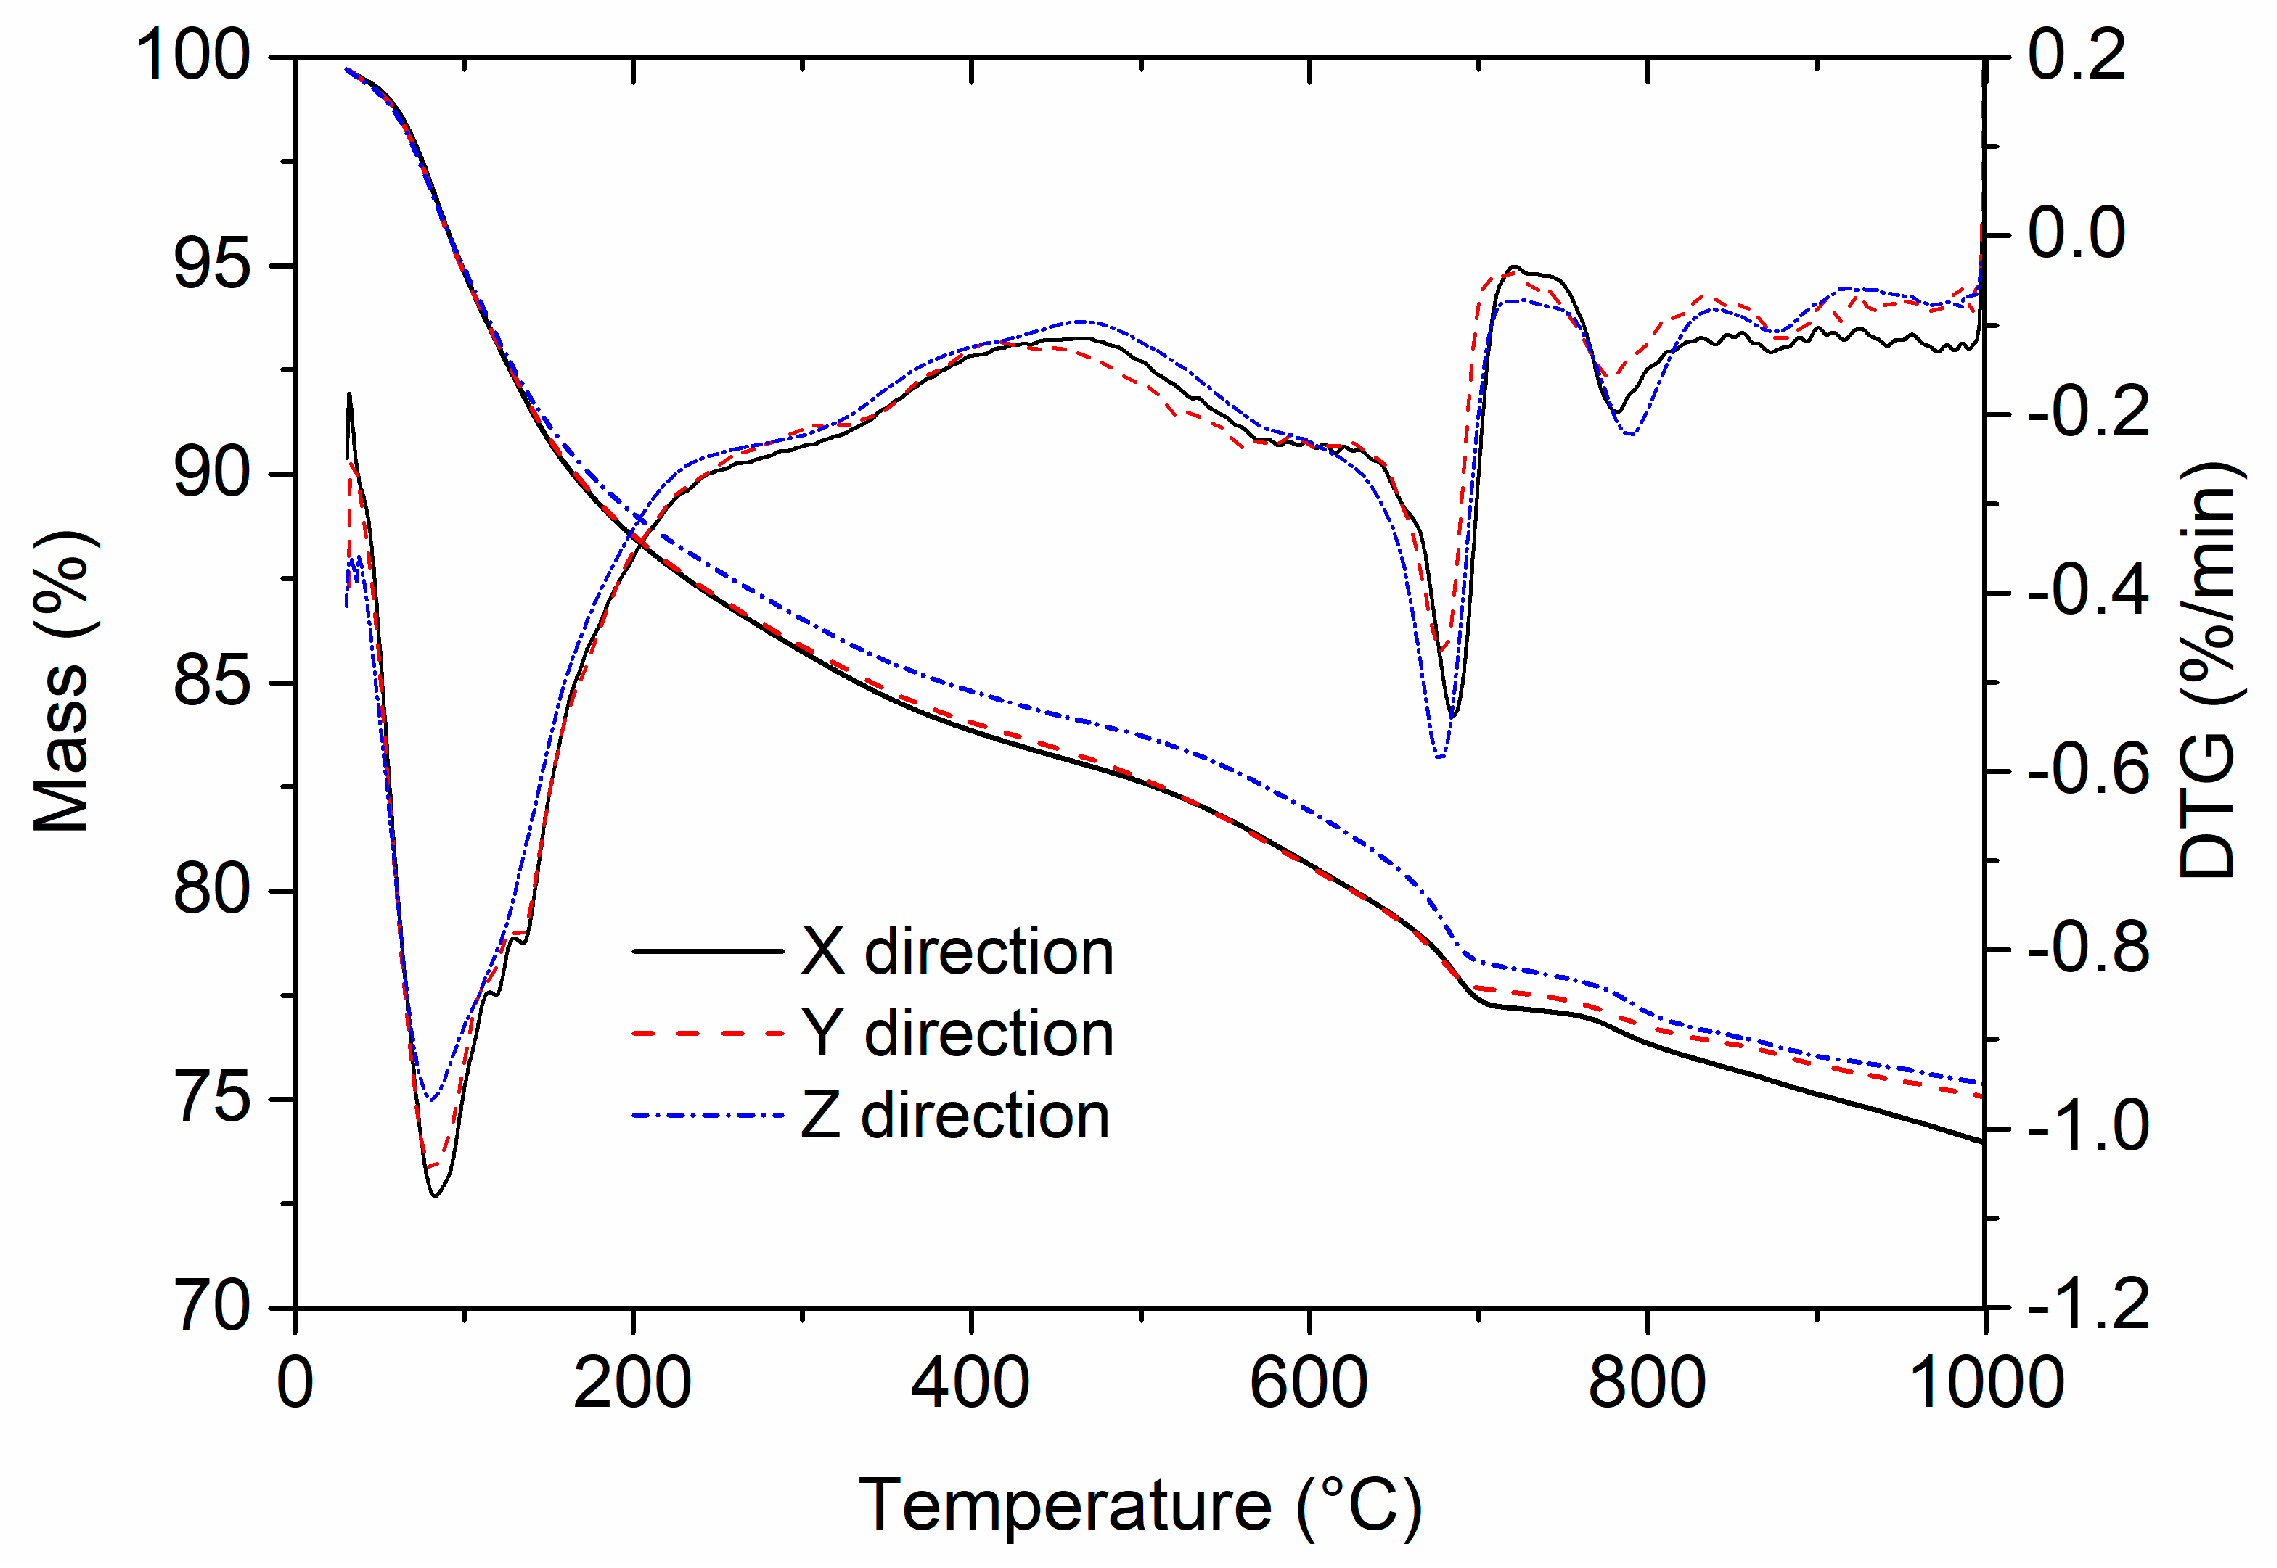
3.6. DTG−TG Analysis
The DTG−TG curves of 56-day leached AMF10FA10 gave details on the mass loss due to the decomposition of CH, decomposition of C-S-H, and decarbonization of CaCO
3, as shown in
Figure 13. It can be interpreted from the DTG curve that the first endothermal peak at about 80–90 °C is related to the dehydration of C-S-H. The second endothermal peak at around 600–700 °C corresponds with the decomposition of CaCO
3. The typical endothermal peak at approximately 400–500 °C, which represents the decomposition of CH, can hardly be observed. This indicates that many hydration products, particularly CH, have leached out after 56 days. Furthermore, the TG curves were almost identical for samples of calcium leached in the
X and
Y directions. However, the mass loss for sample calcium leached in the
Z direction is lower than that of calcium leached in the other two directions, suggesting that more hydration products were leached from the
Z direction than the other two.
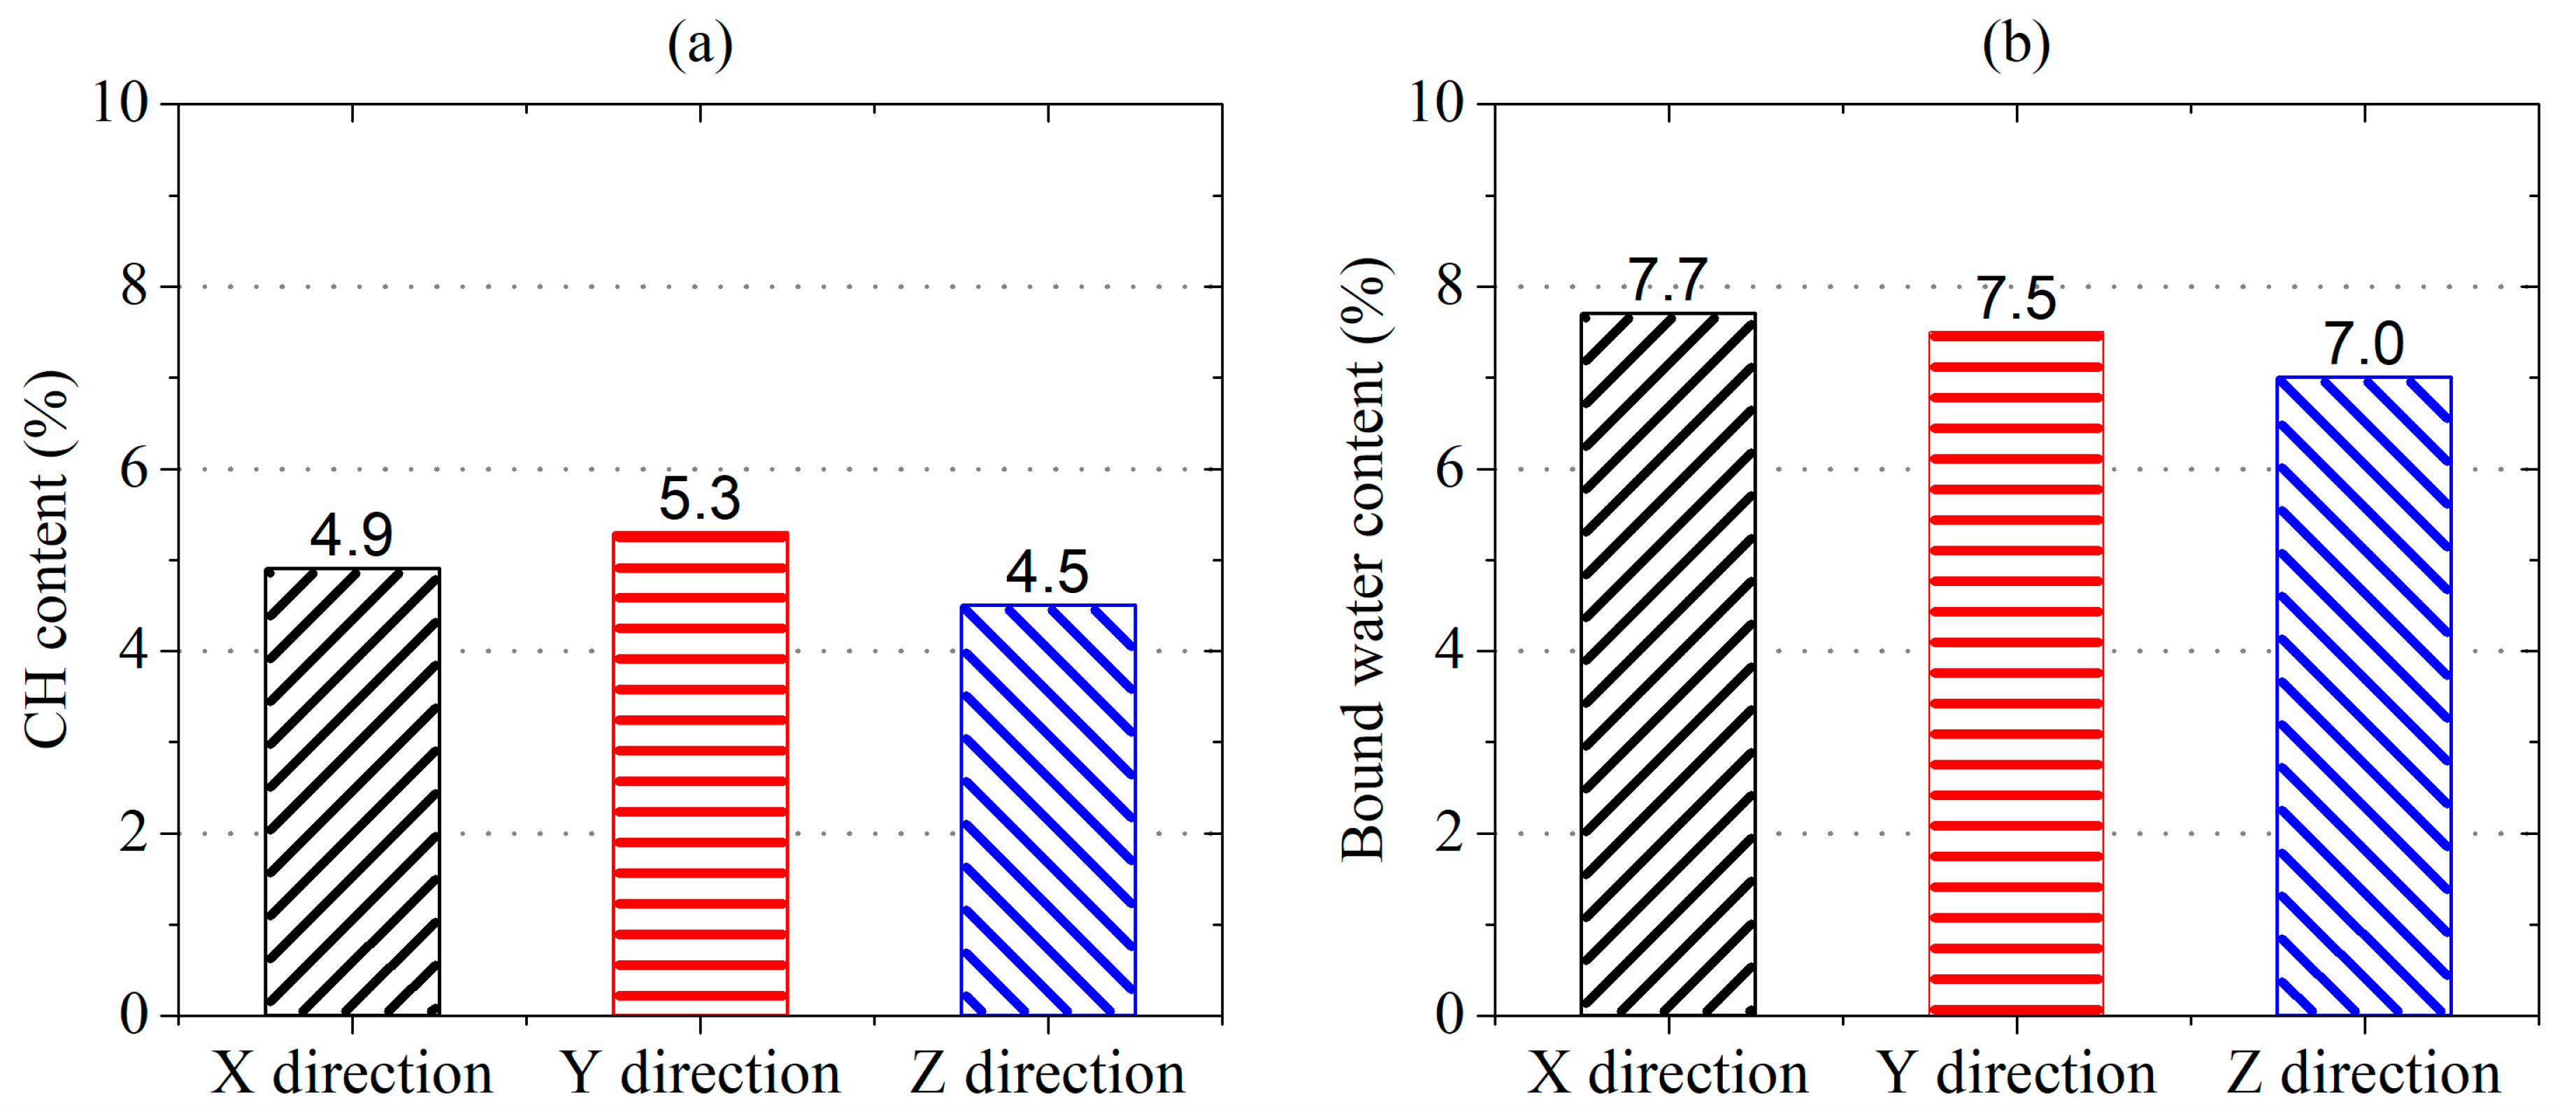
CH generated by cement hydration is critical for the stability of C-S-H in aggressive water, and the dissolution of CH is essential for the increase in porosity and the decrease in strength [
21].
Figure 14a,b show the percentage of CH and bound water content remaining in the AMF10FA10 exposure to ammonium chloride solution for 56 days, as determined from the TG curves. As shown in these figures, CH content in samples leached in the
Z direction was lower, 8.9% and 17.8%, than in the
X and
Y directions. The bound water content in samples leached in the
Z direction lowers by 10.0% and 7.1% more than in the
X and
Y directions. This indicates that the samples leached in the
Z direction lost more hydration products, such as C-S-H, than those leached in other directions during the calcium leaching duration. The greater bound water content reduction in the
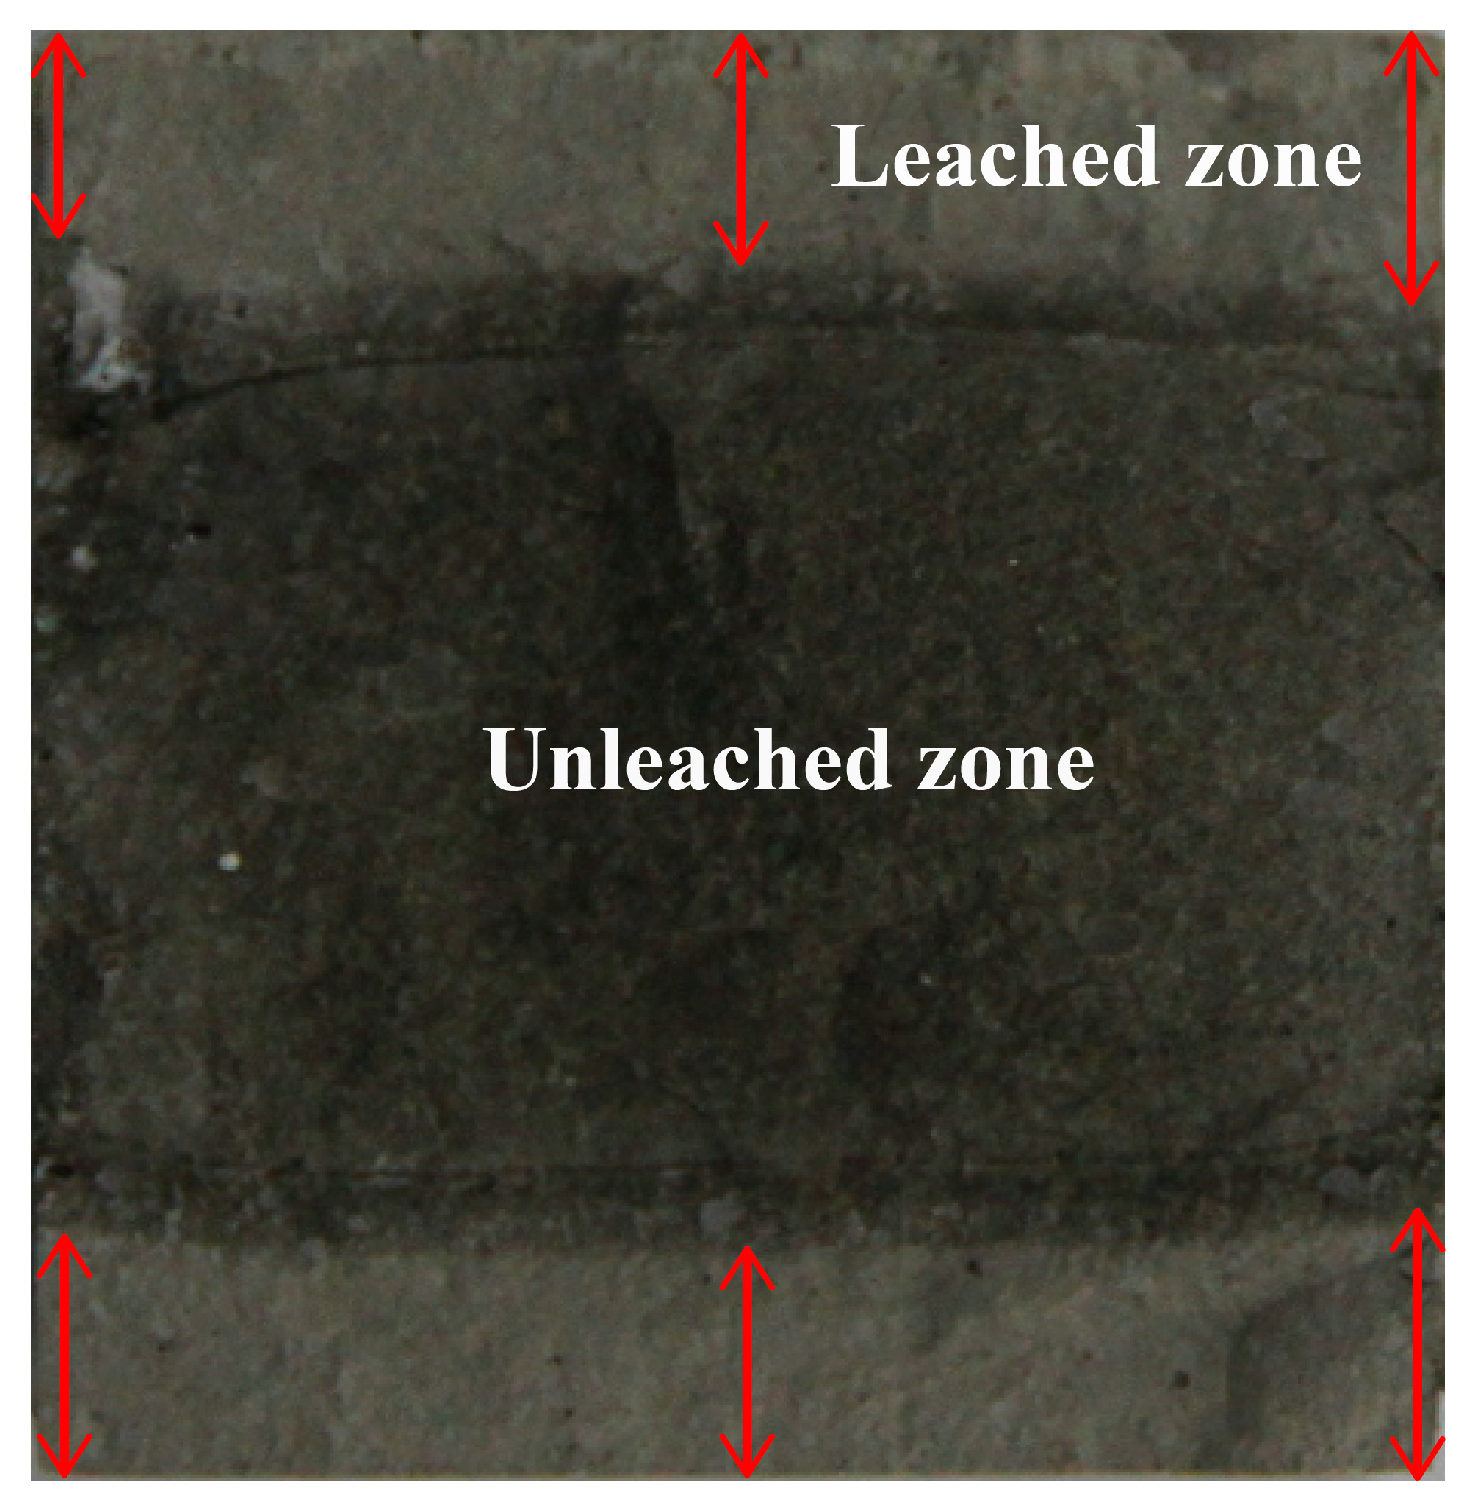
Z direction may be due to the lower lime concentration at the zone for microstructure analysis, as indicated in
Figure 6. A lack of CH content results in the decomposition of C-S-H and is likely a contributing factor to the reduced compressive strength in
Z direction calcium leached at 28 and 56 days. Therefore, the calcium leaching direction greatly influences the CH and bound water content of 3DPC.
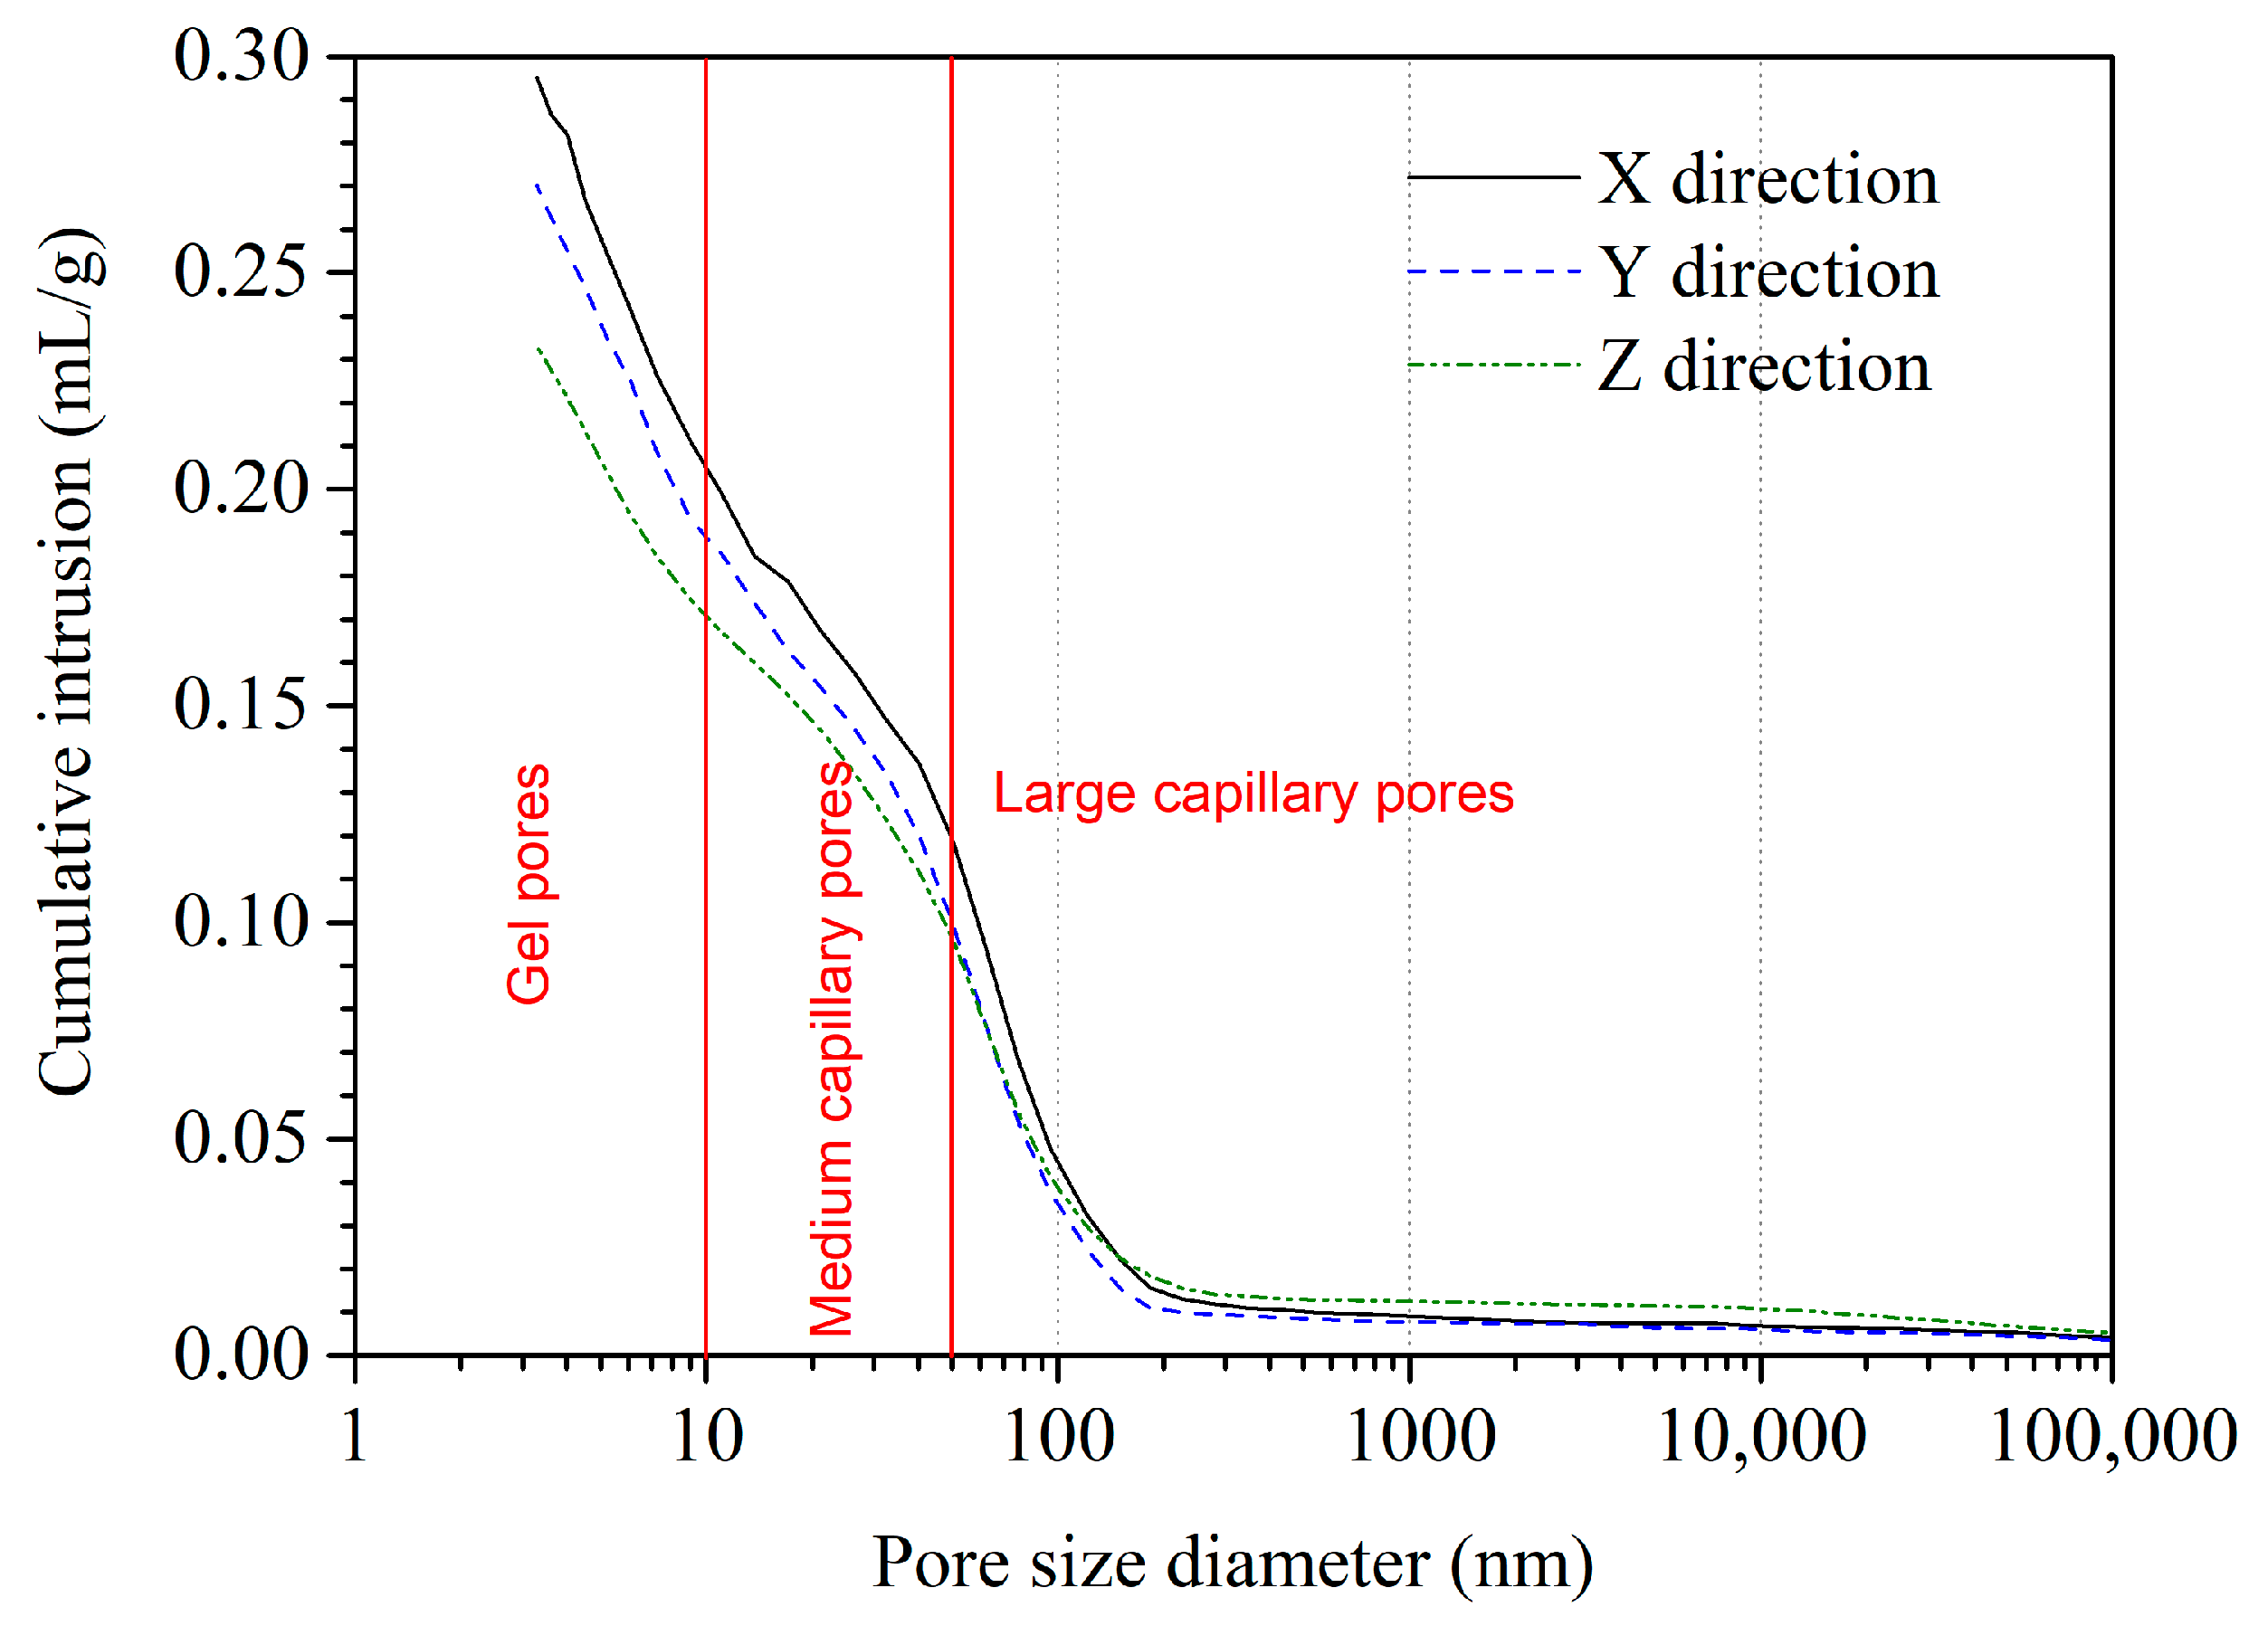
3.7. MIP Analysis
Because of the nature of calcium leaching, pores in 3DPC play a fundamental role in the transport process of Ca
2+ due to its relatively porous structure. Thus, the characterization of the pores is necessary to understand the calcium leaching behavior of 3DPC.
Table 4 shows the results from the MIP test conducted after 56 days of calcium leaching. The porosity, total pore area, total intrusion volume, average pore diameter, and median pore diameter are listed for the AMF10FA10 leached in the
X,
Y, and
Z directions. Compared to the sample leached in the
Z direction, it is visible that the sample leached in the
X and
Y direction exhibited a lower porosity, total pore area, and total intrusion volume but a higher average pore diameter and median pore diameter. The reason for the porosity, pore area, and total intrusion volume of the sample leached in the
Z direction being lower could be associated with the lower porosity before calcium leaching compared to the other directions. The increments in the average pore diameter and median pore diameter of the sample leached in the
Z direction suggest that more calcium was leached in this direction than in the other two directions. The increased pore size is related to the dissolution of CH in pores. The reduction of CH content is also found in XRD and DTG−TG analysis, as discussed in the previous section. In addition, the results indicate the calcium leaching anisotropy of 3DPC in ammonium chloride solution.
The cumulative intrusion curves of AMF10FA10 after calcium leaching for 56 days are presented in
Figure 15. It shows the relationship between cumulative intrusion and pore diameter in the 1–100,000 nm range. Pores in concrete that are smaller than 10 nm, ranging from 10–50 nm, and greater than 50 nm are classified as gel, medium, and large capillary pores [
34]. The appearance of macro-pores, whose size is about the same as the capillary pores, is due to the depletion of CH, while the appearance of micropores can be ascribed to the decalcification of C-S-H [
16]. As shown in this figure, the cumulative intrusion curves of all samples have the same general shape, and the initial pore entry diameter is no distinct difference. However, the total intrusion volume of the sample leached in the
Z direction is about 0.233 mL/g, which is lower than 26.6% and 15.9%, which are those of the sample leached in the
X and
Y directions, respectively. In addition, it was also observed that the gel pores and medium capillary pores of the sample leached in the
Z direction were lower than that of the other two directions, while the large capillary pores larger than 150 nm were higher than that of the other two directions. More hydration products, such as CH and C-S-H, have leached from the
Z direction than the other two. These results also confirmed the XRD and DTG−TG results showing less residual CH content in the
Z direction than in the other two.
As discussed formerly, the test results of the XRD and DTG−TG analysis supported these conclusions. Furthermore, the more hydration products are leached, the greater the large capillary pores and, consequently, the lower the compressive strength. The test results of MIP and compressive strength also confirmed this phenomenon.
4. Conclusions
This paper reports the test results of 3DPC with AMF and FA exposed to NH4Cl solution. The influence of the calcium leaching direction on the bulk density, water absorption, and leaching depth of 3DPC was investigated, and the reason for the anisotropic performance was investigated by XRD, DTG−TG, and MIP analysis. The following conclusions are drawn from this study:
- (1)
The bulk density of 3DPC decreased with the leaching duration, and the water absorption increased with the leaching duration.
- (2)
The 3DPC showed a remarkable anisotropic calcium leaching behavior in the NH4Cl solution. The 3DPC leached in the X direction had a similar performance to that in the Y direction. The bulk density in the Z direction was higher than that in the X and Y directions, while the water absorption in the Z direction was lower than that in the other two directions; the leaching depths in the Z direction were lower than that in the X and Y directions; the compressive strength of samples unleached in the Z direction was higher than that in the X and Y directions. However, the compressive strength of samples leached in the Z direction was lower than that in the other two directions; the compressive anisotropy coefficients of all leached samples showed a significantly increased trend.
- (3)
Hydration products such as CH and C-S-H leached from the pore defects are fundamental contributors to the performance anisotropy of 3DPC.
- (4)
The XRD analysis showed that the surface layer of the 3DPC leached in the Z direction has lower CH content than that leached in the X or Y direction. The DTG−TG analysis confirmed these results.
- (5)
The porosity of samples leached in the Z direction is lower than those leached in the X and Y directions. On the other hand, the average and median pore diameters of samples leached in the Z direction are higher than those in the other two directions. This is the fundamental reason for the mechanical anisotropy of 3DPC after exposure to the NH4Cl solution.
There remain large areas of need for research in 3DPC under various environmental exposures. These include, for example, the printing process and mixture proportions. The quantitative determination of air voids distribution and morphology as a result of the extrusion process is identified as a major research priority. The authors’ future work will focus on the influence of printing parameters, mix proportions, and key materials on the anisotropic performance of 3D-printed cementitious materials exposed to aggressive water. Further work is also planned to establish the relationship between the characteristic of the air voids and the anisotropic behavior of the 3D-printed cementitious materials in aggressive water.


