
Sector-Specific Pathways to Sustainability: Unravelling the Most Promising Renewable Energy Options


Abstract
:1. Introduction
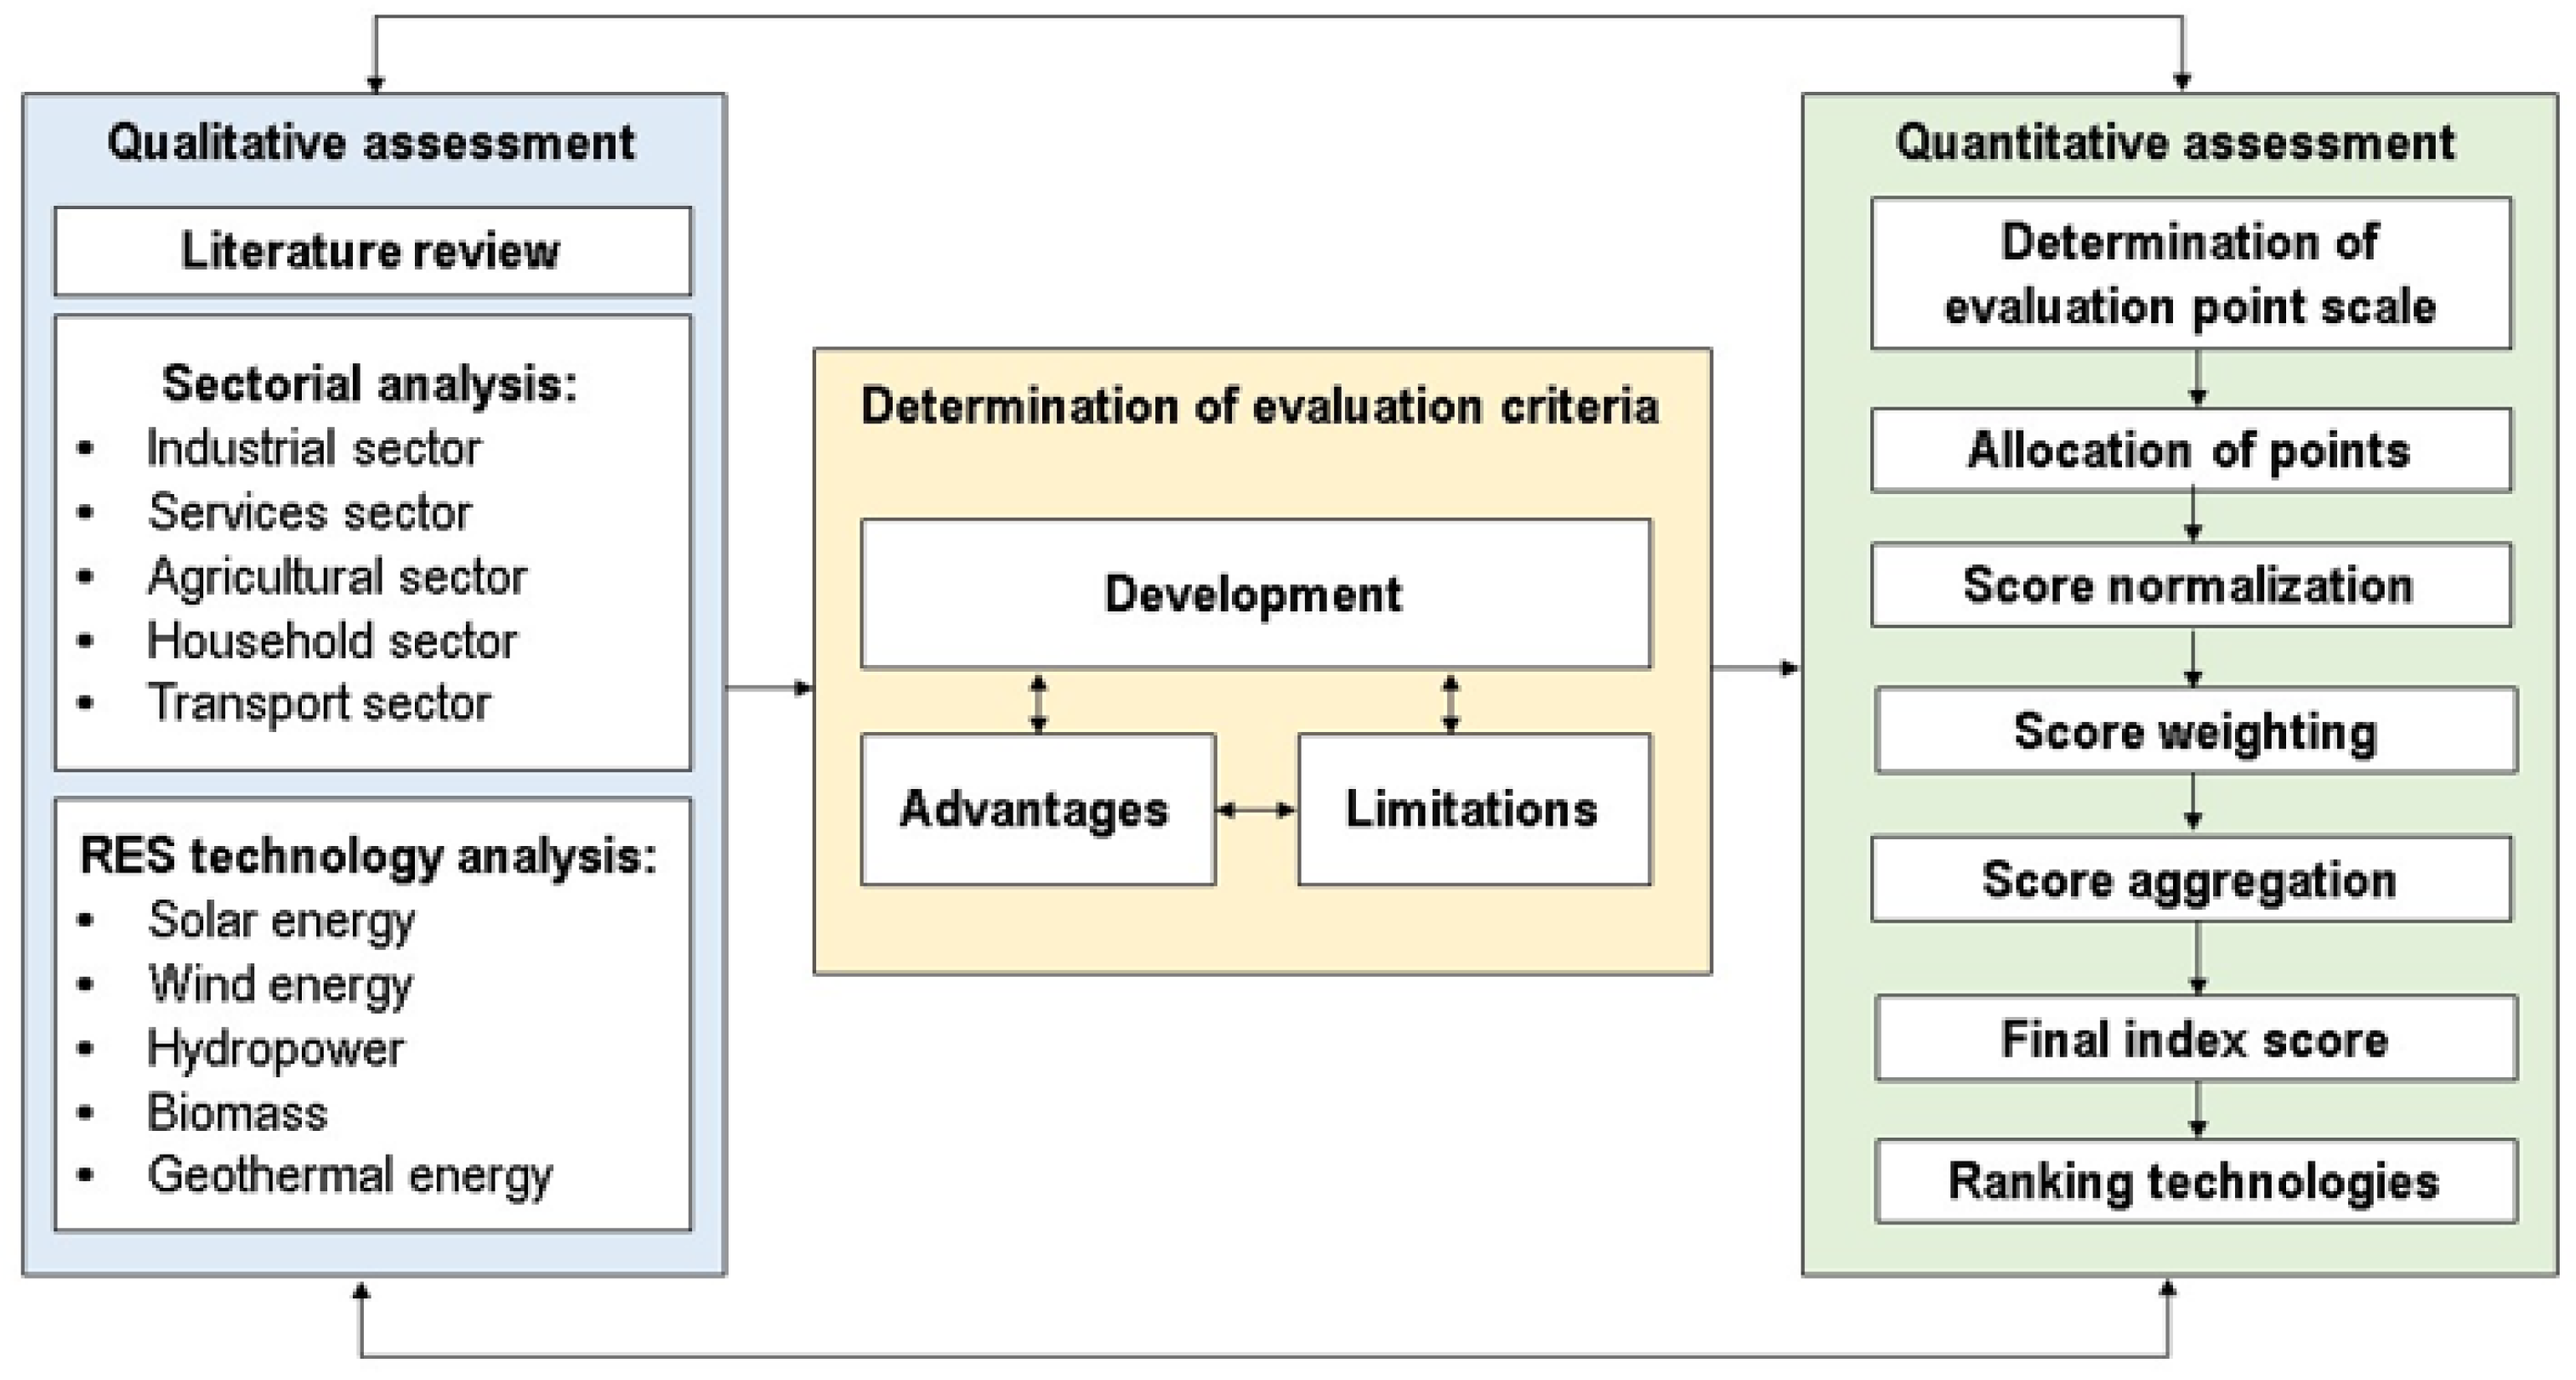
2. Methodology
2.1. Description of the Methodology for Qualitative Assessment
- The increase in the use of technology in the future;
- Technological development and increase in utilisation rate;
- RES technology innovation opportunities and technology combinations;
- Using solar energy (for heat and electricity) technology combined with smart technology;
- The presence of any restrictions on the use of the resource;
- The availability of RESs as a limiting factor for resource use. Payback period of investments (years);
- Cost savings (EUR, %);
- Energy savings (kWh, MWh, %);
- CO2 reduction.
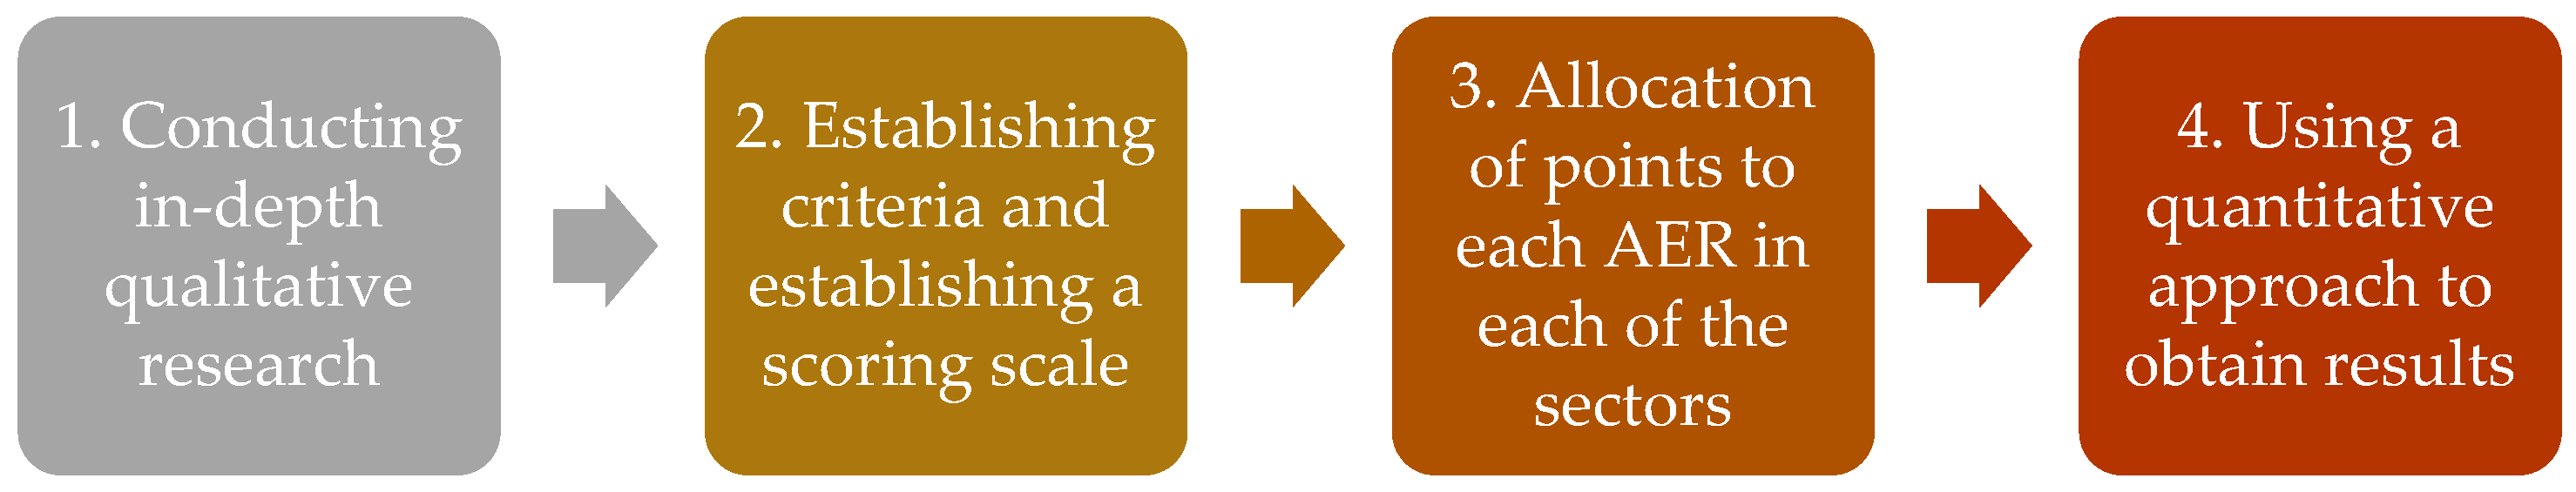
2.2. Description of the Methodological for Quantitative Assessment
2.2.1. Determination of Evaluation Point Scale and Allocation of Points
2.2.2. Data Normalisation, Score Weighting, and Final Index Score
3. Results and Discussion
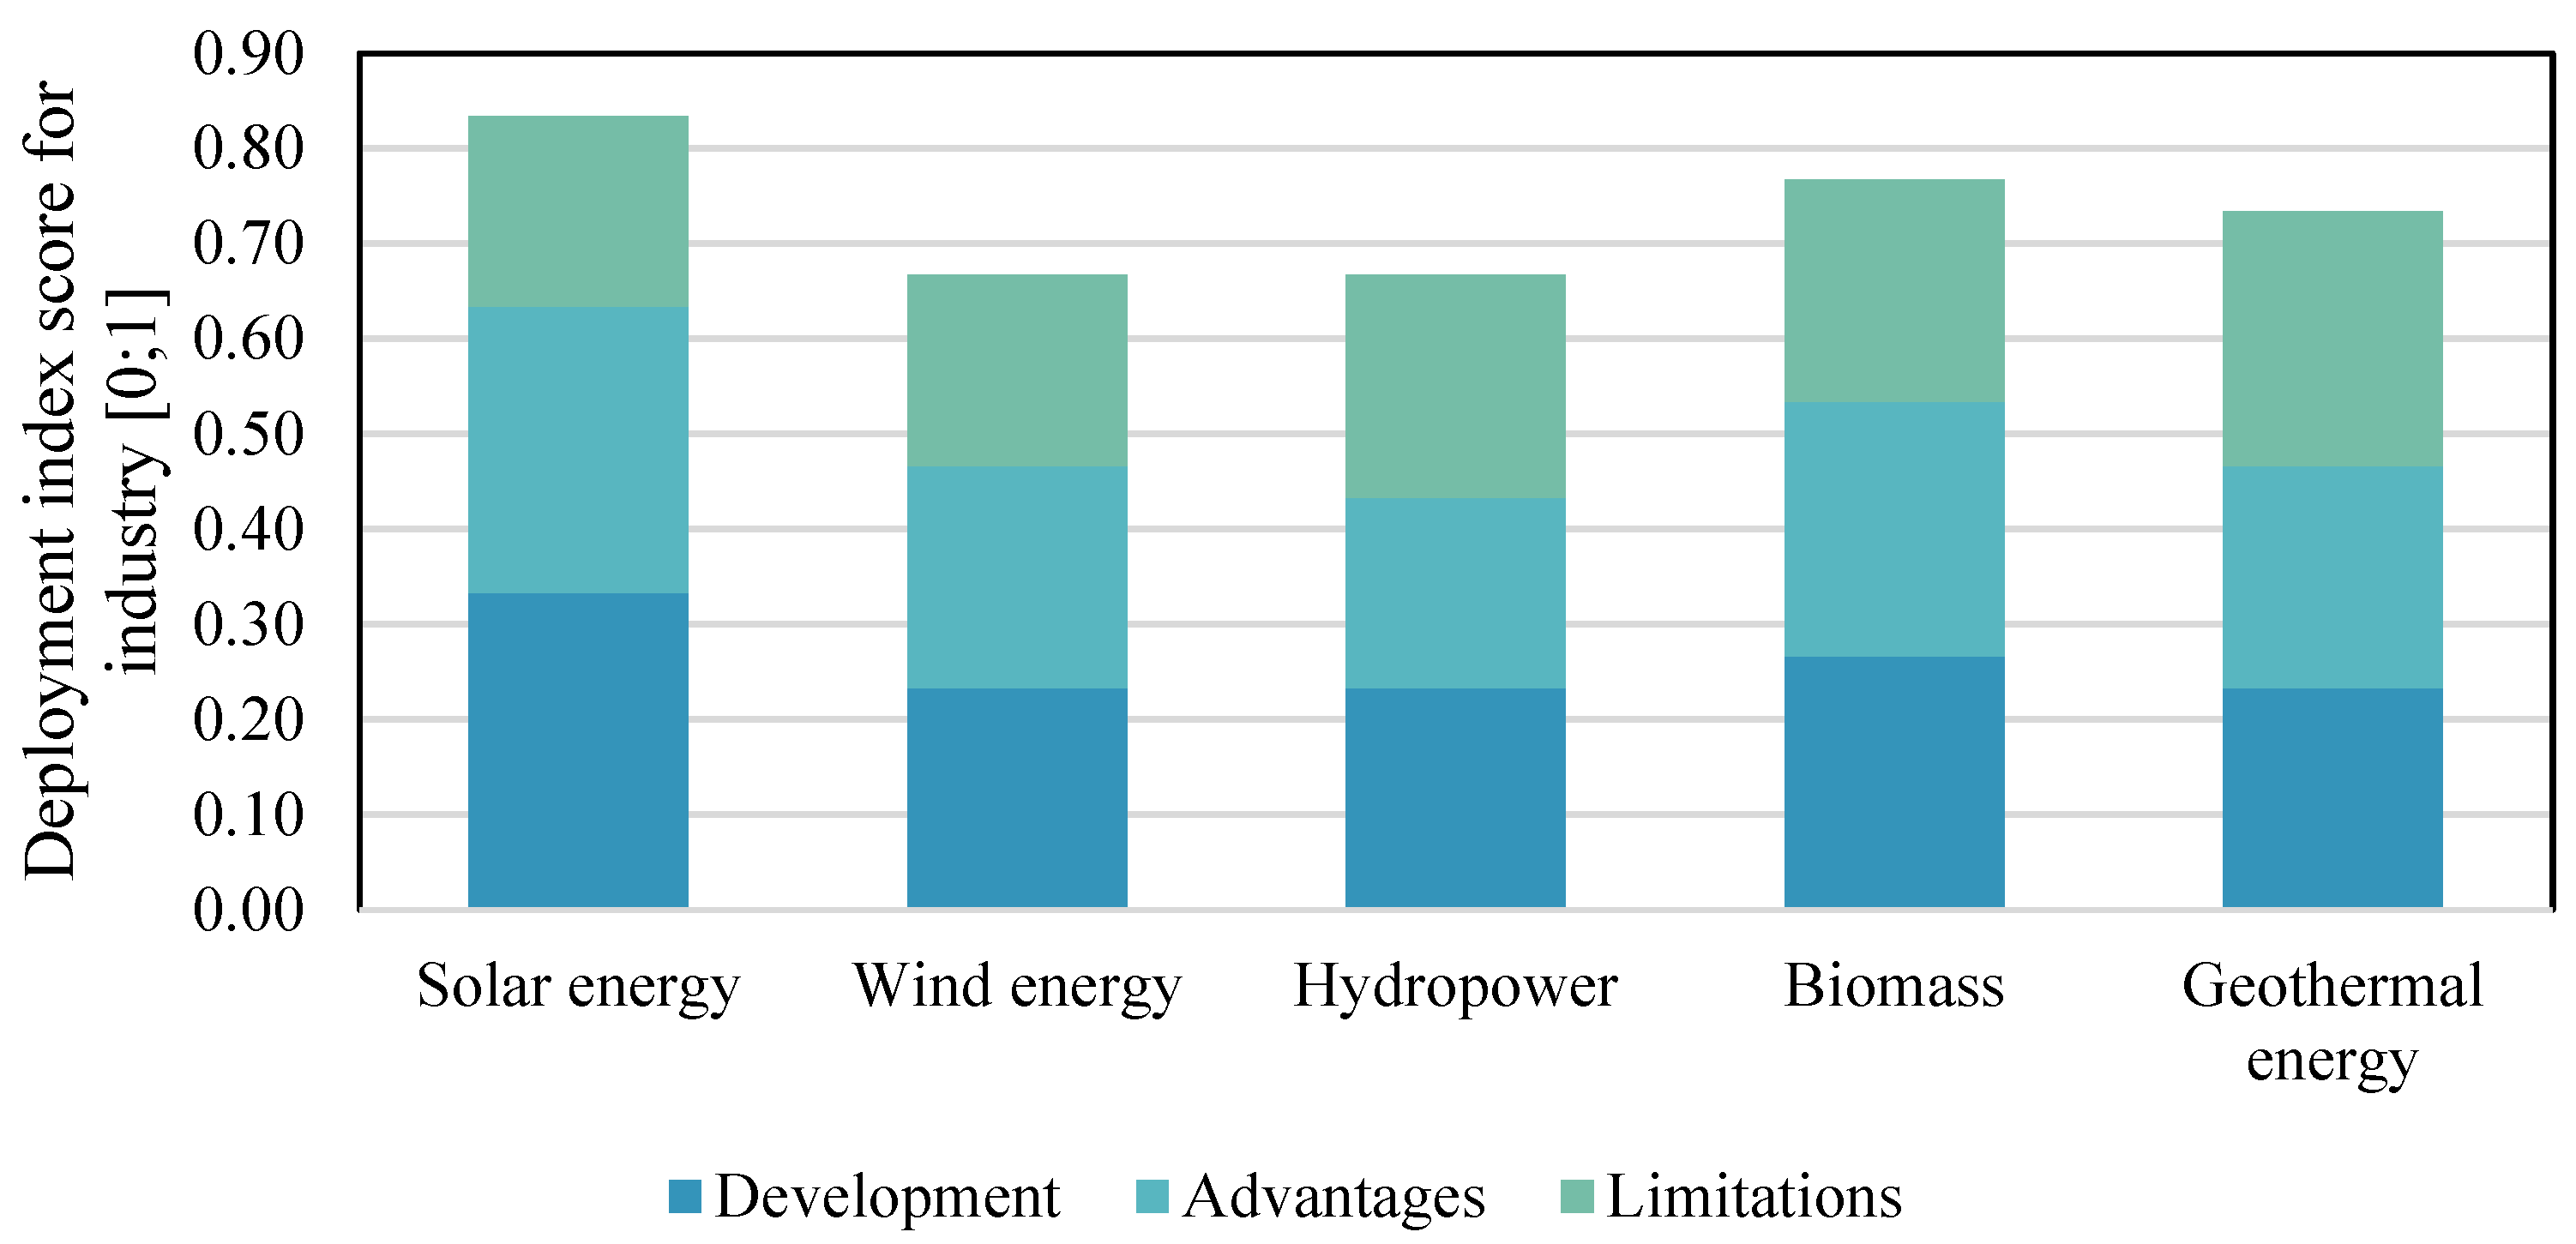
3.1. Industrial Sector
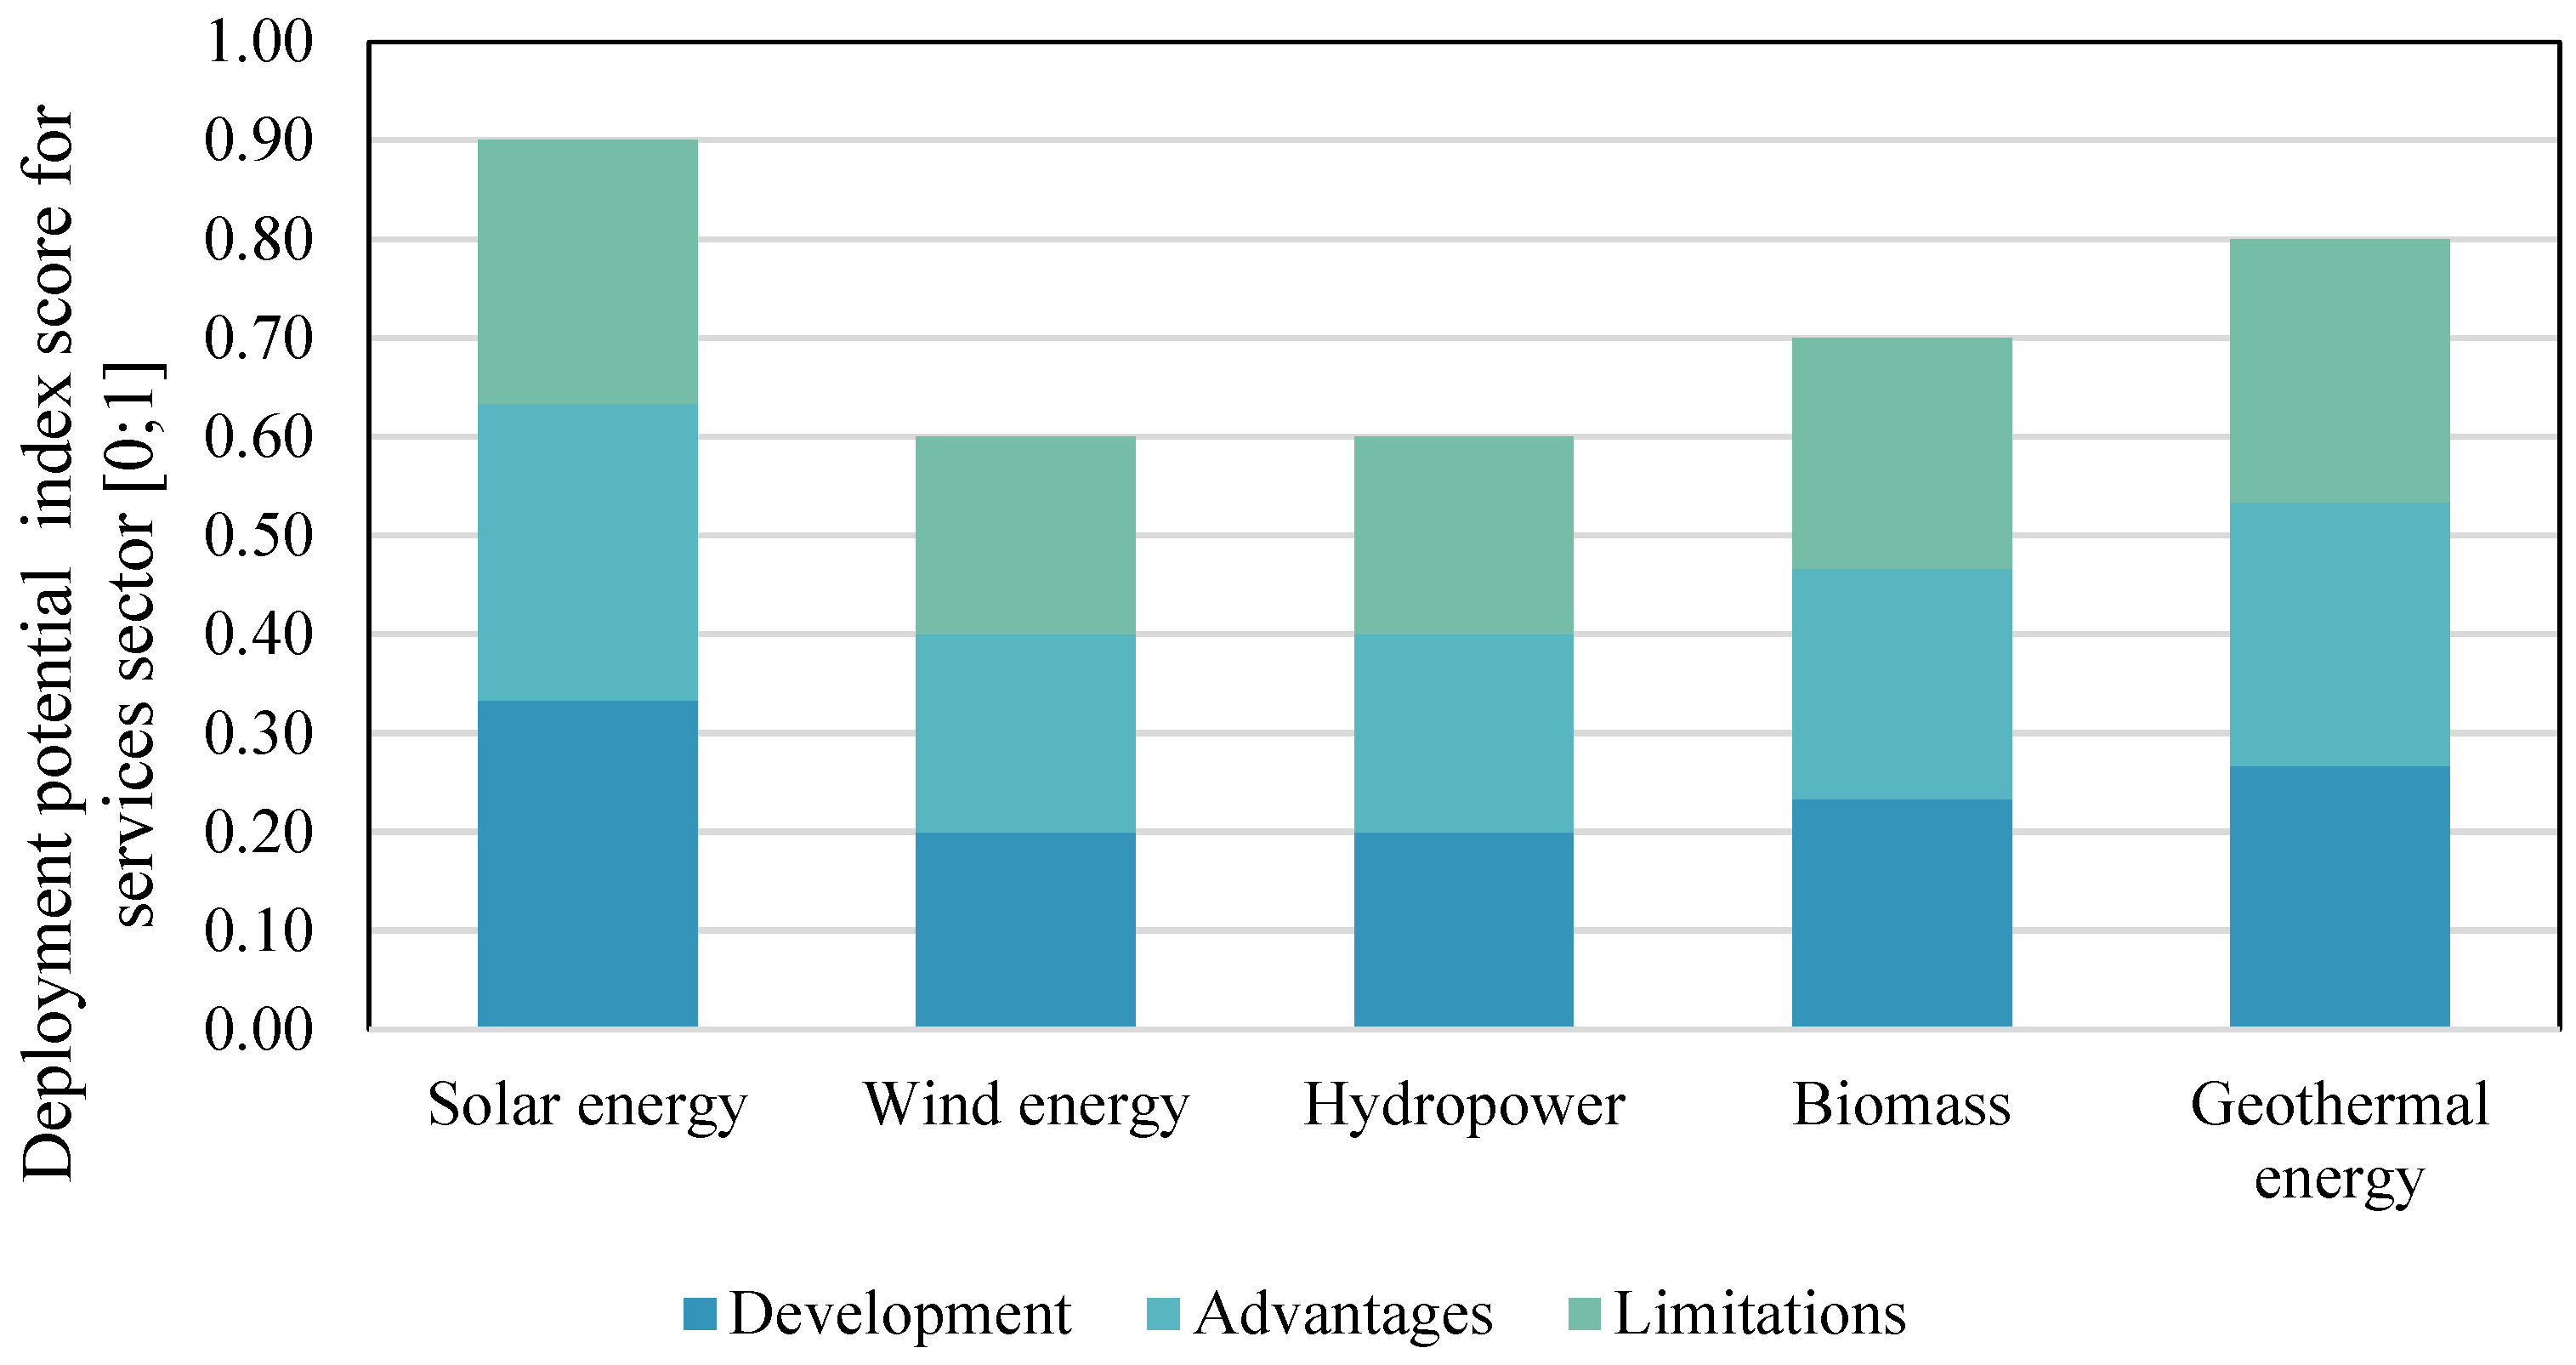
3.2. Service Sector
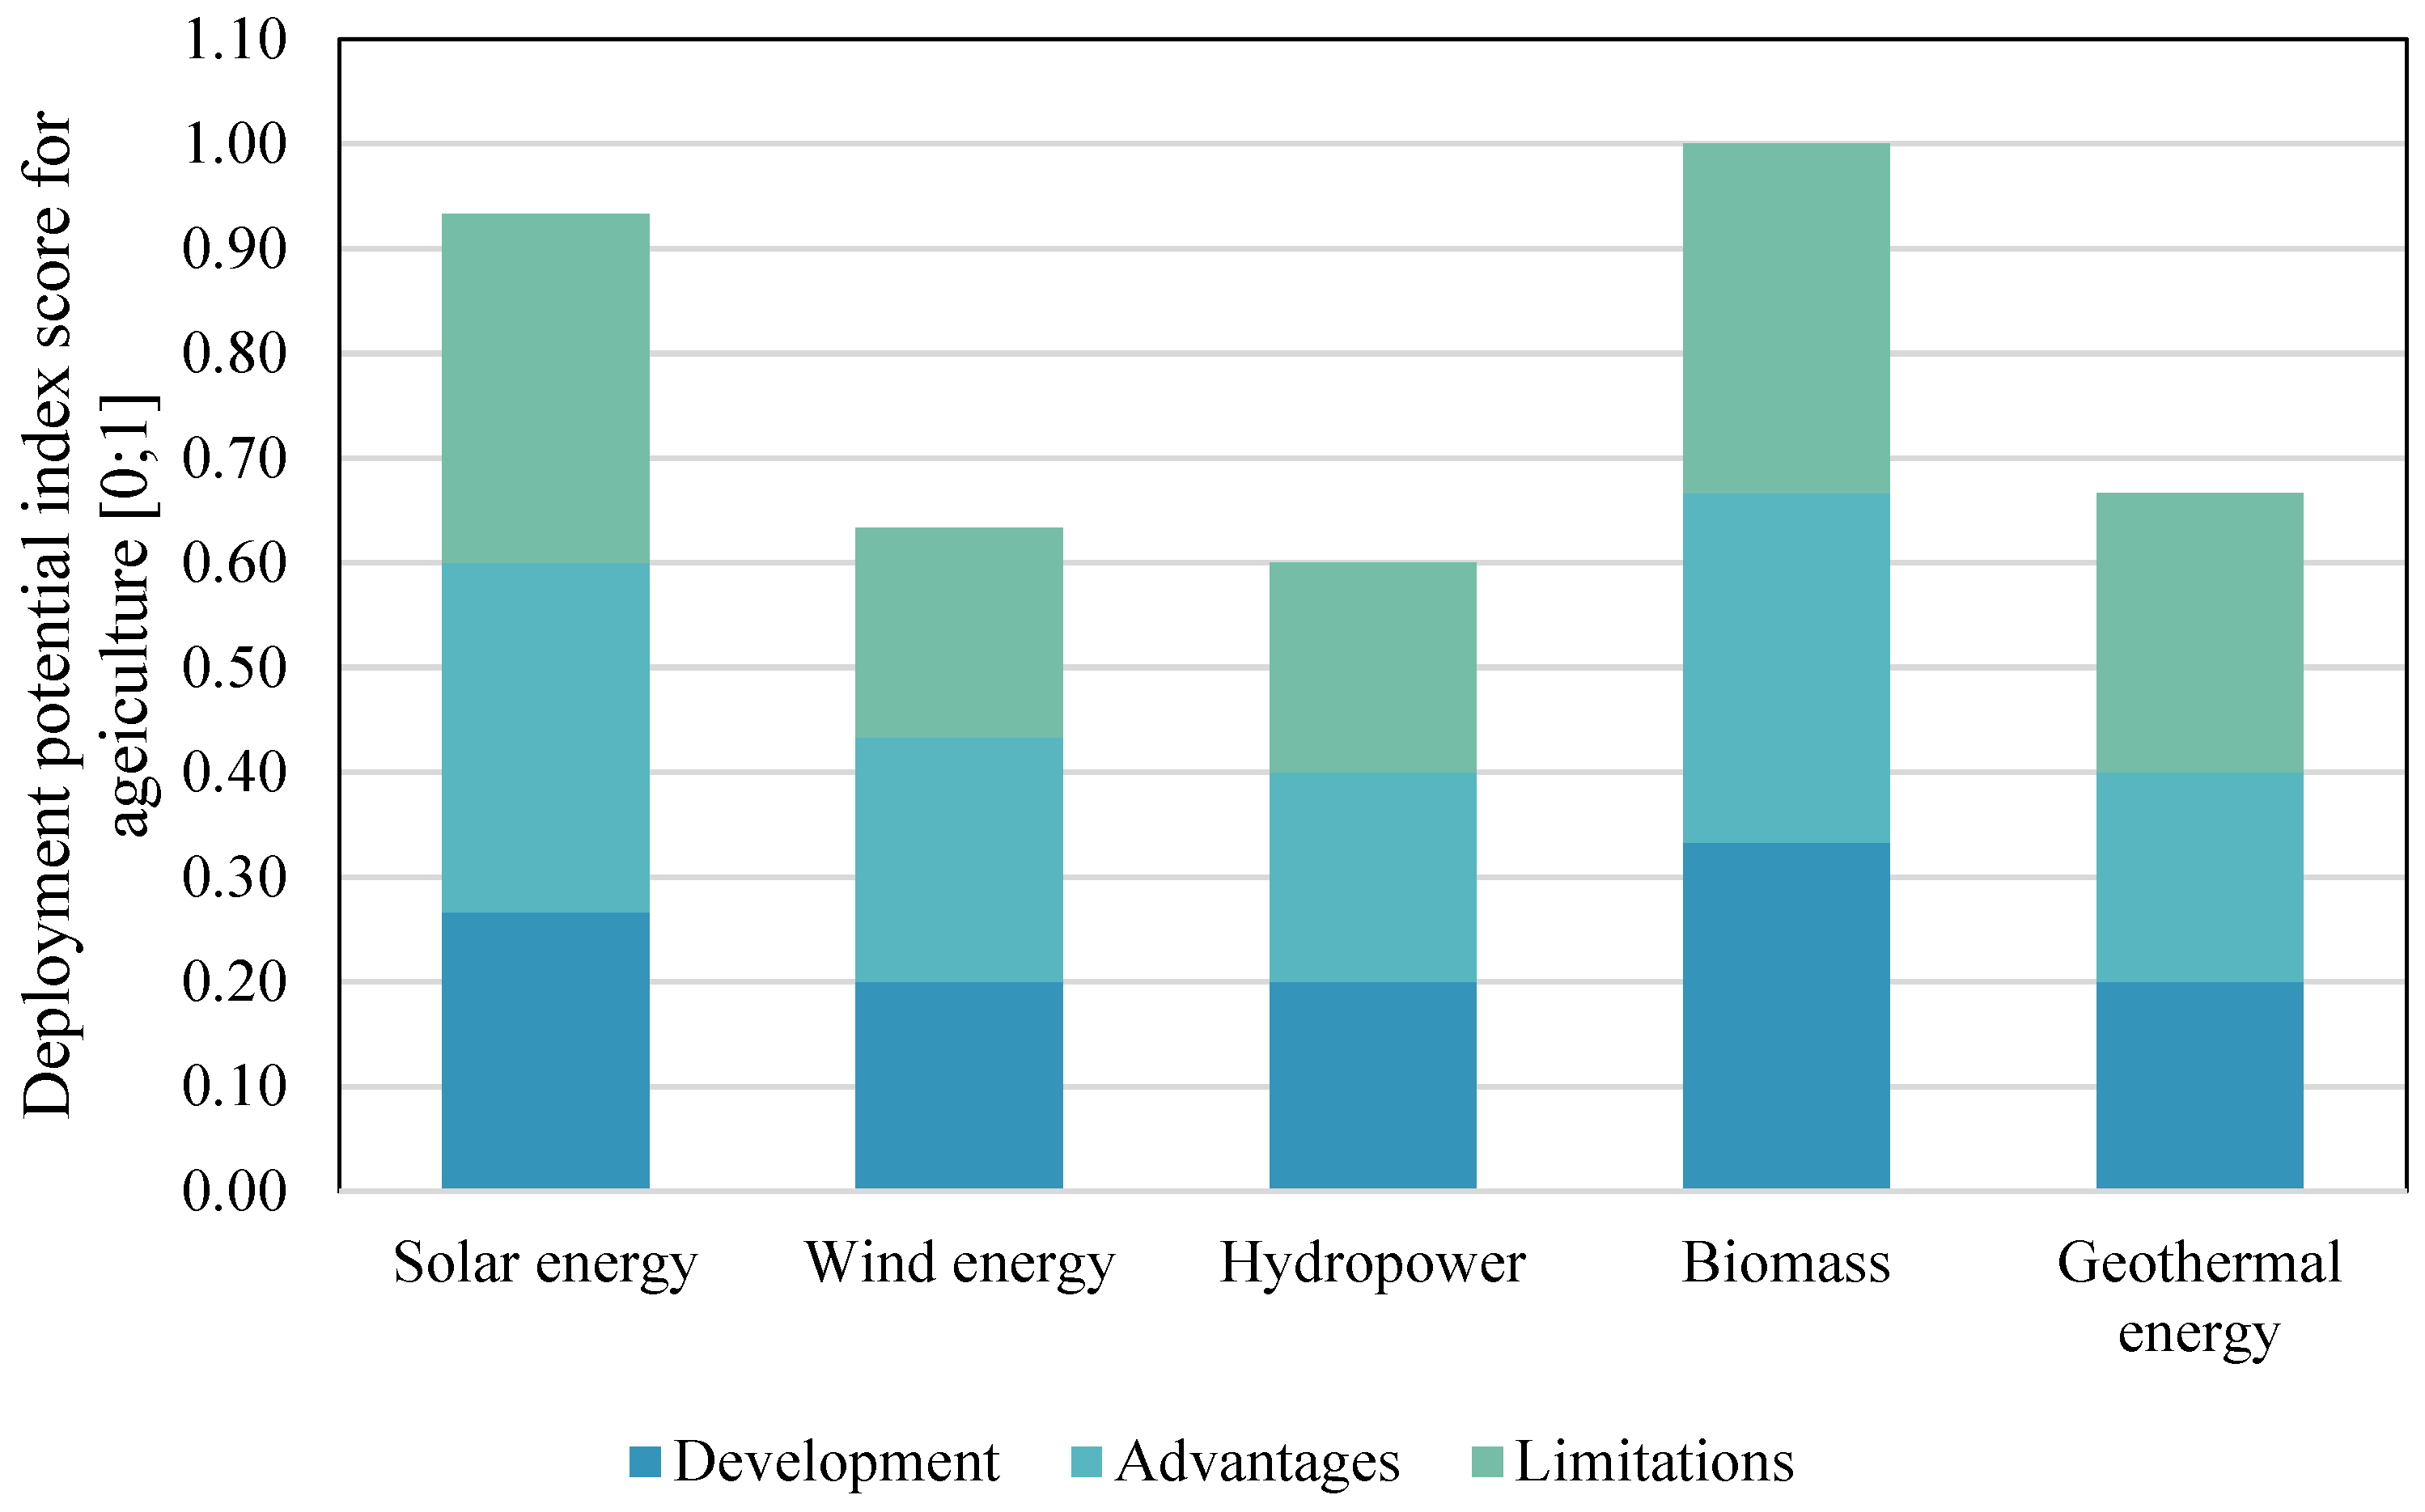
3.3. Agricultural Sector
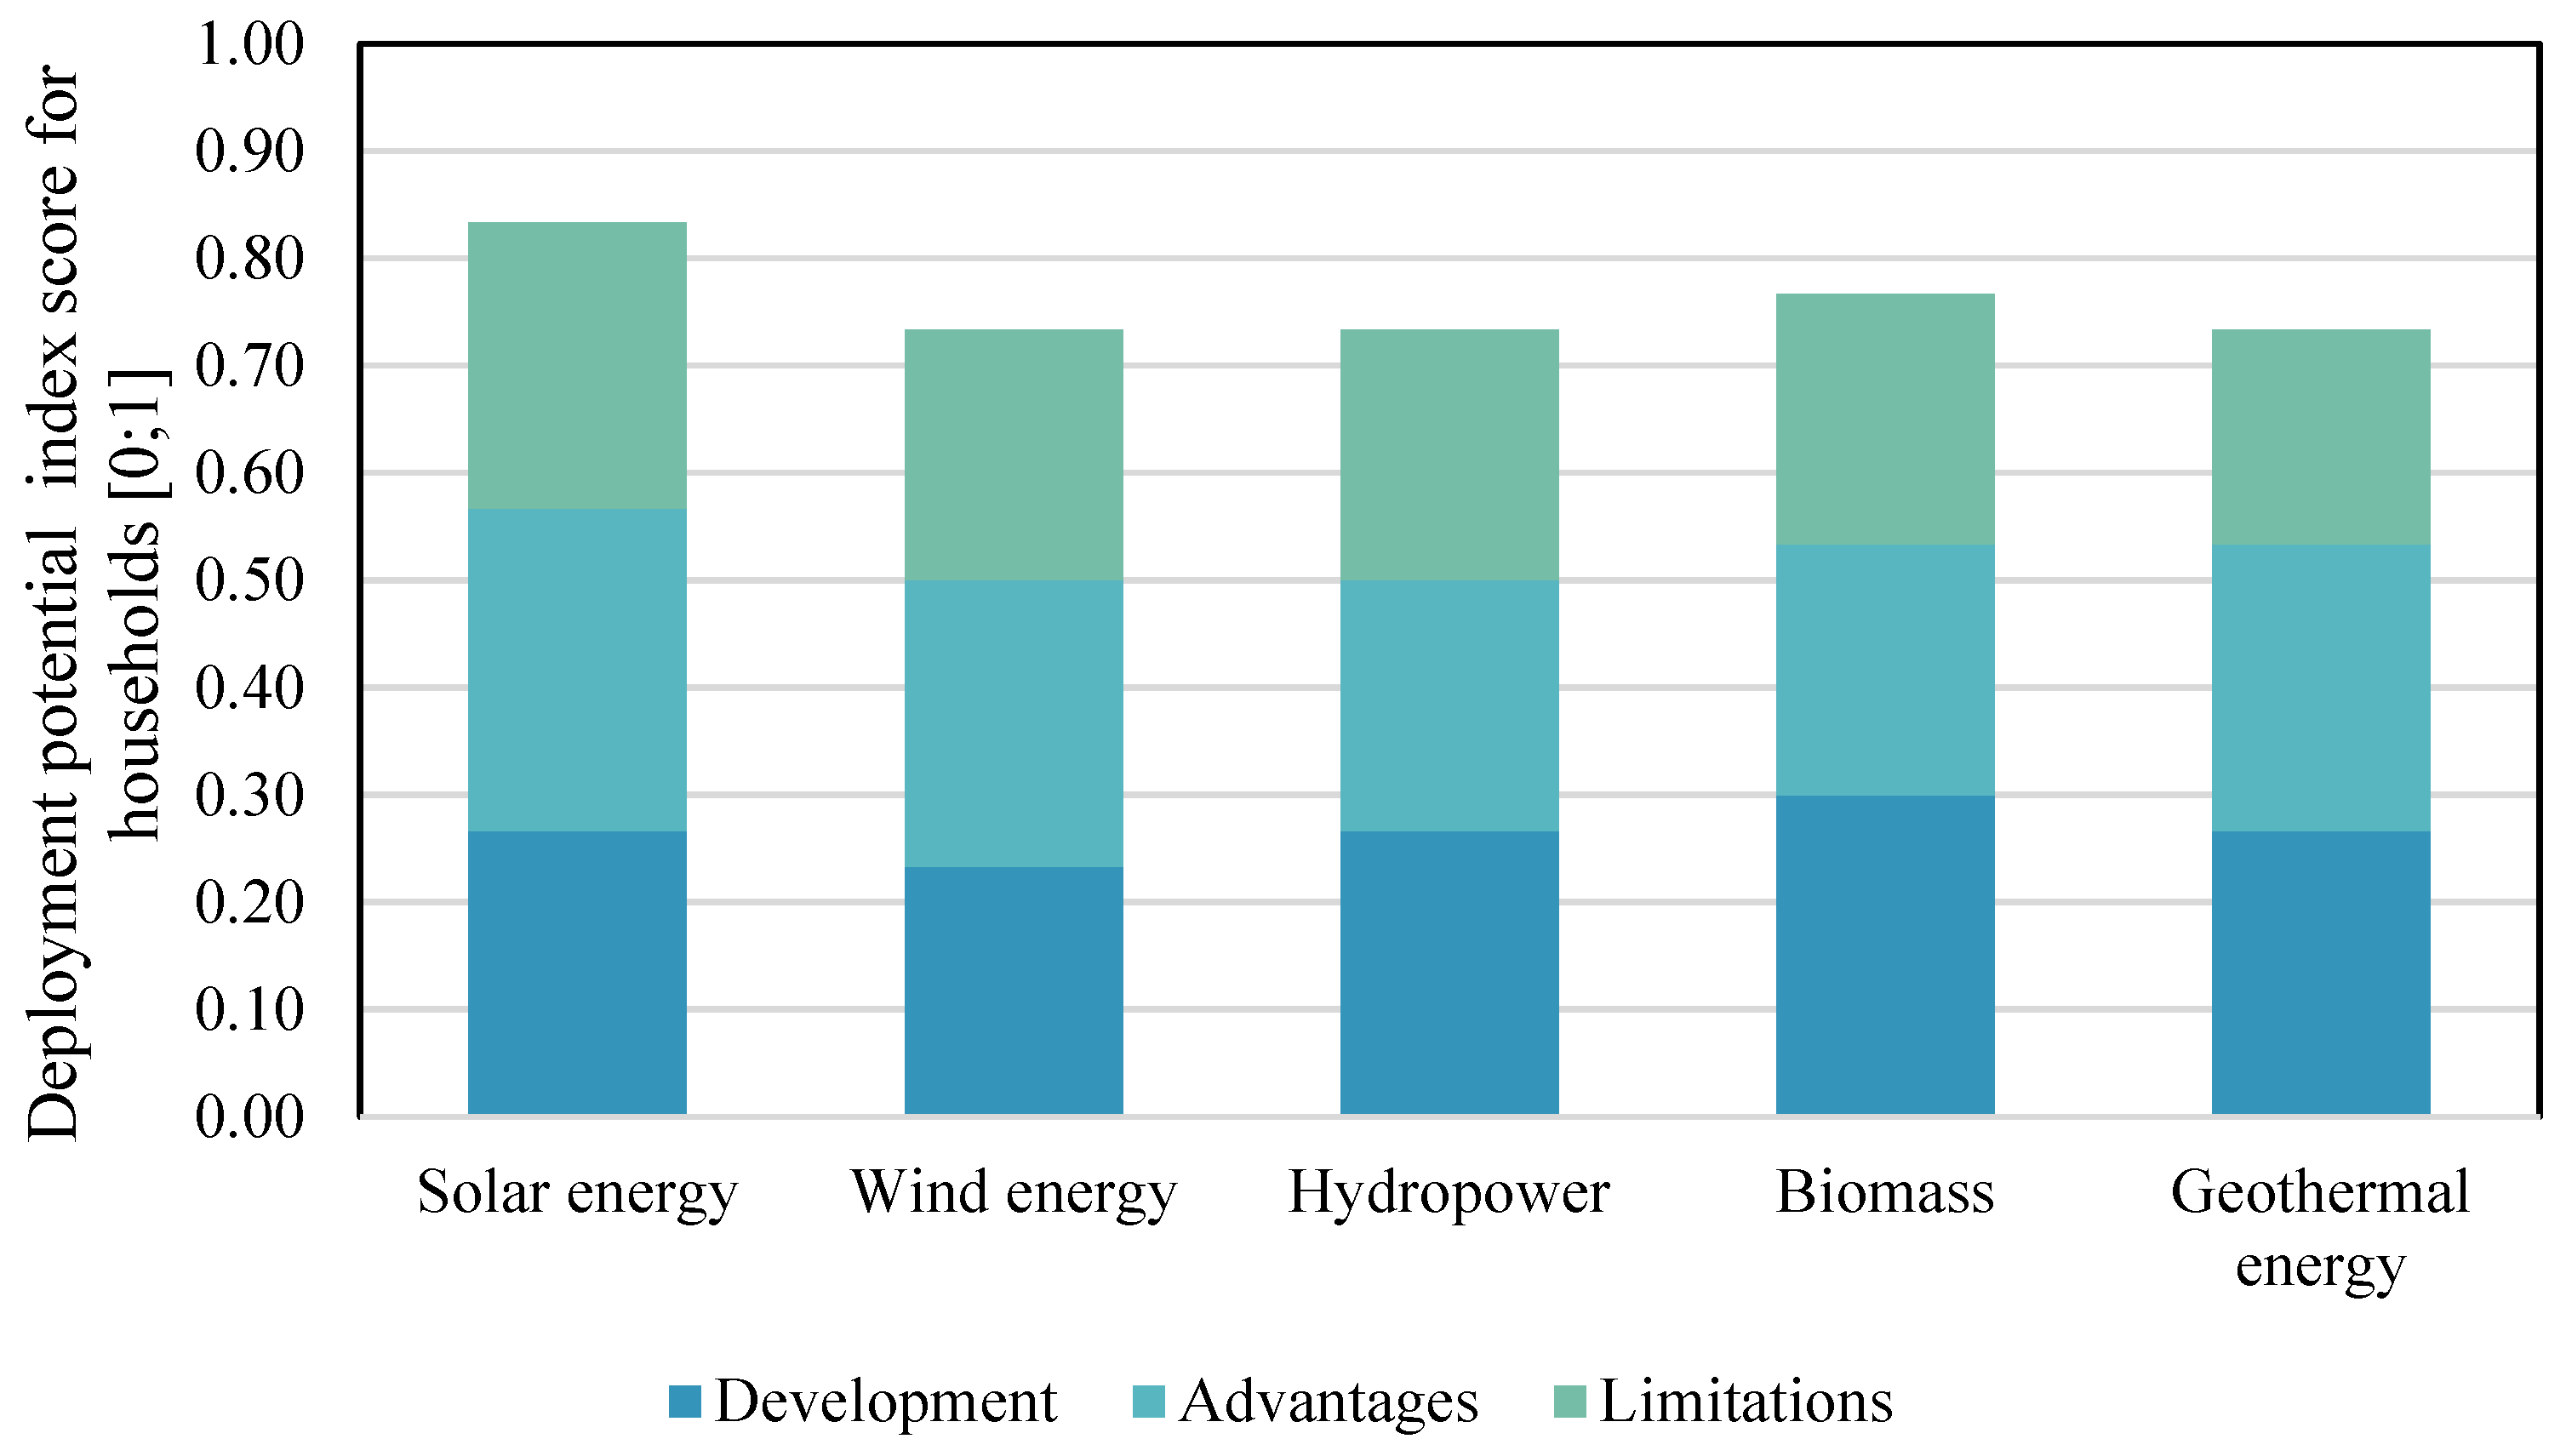
3.4. Household Sector
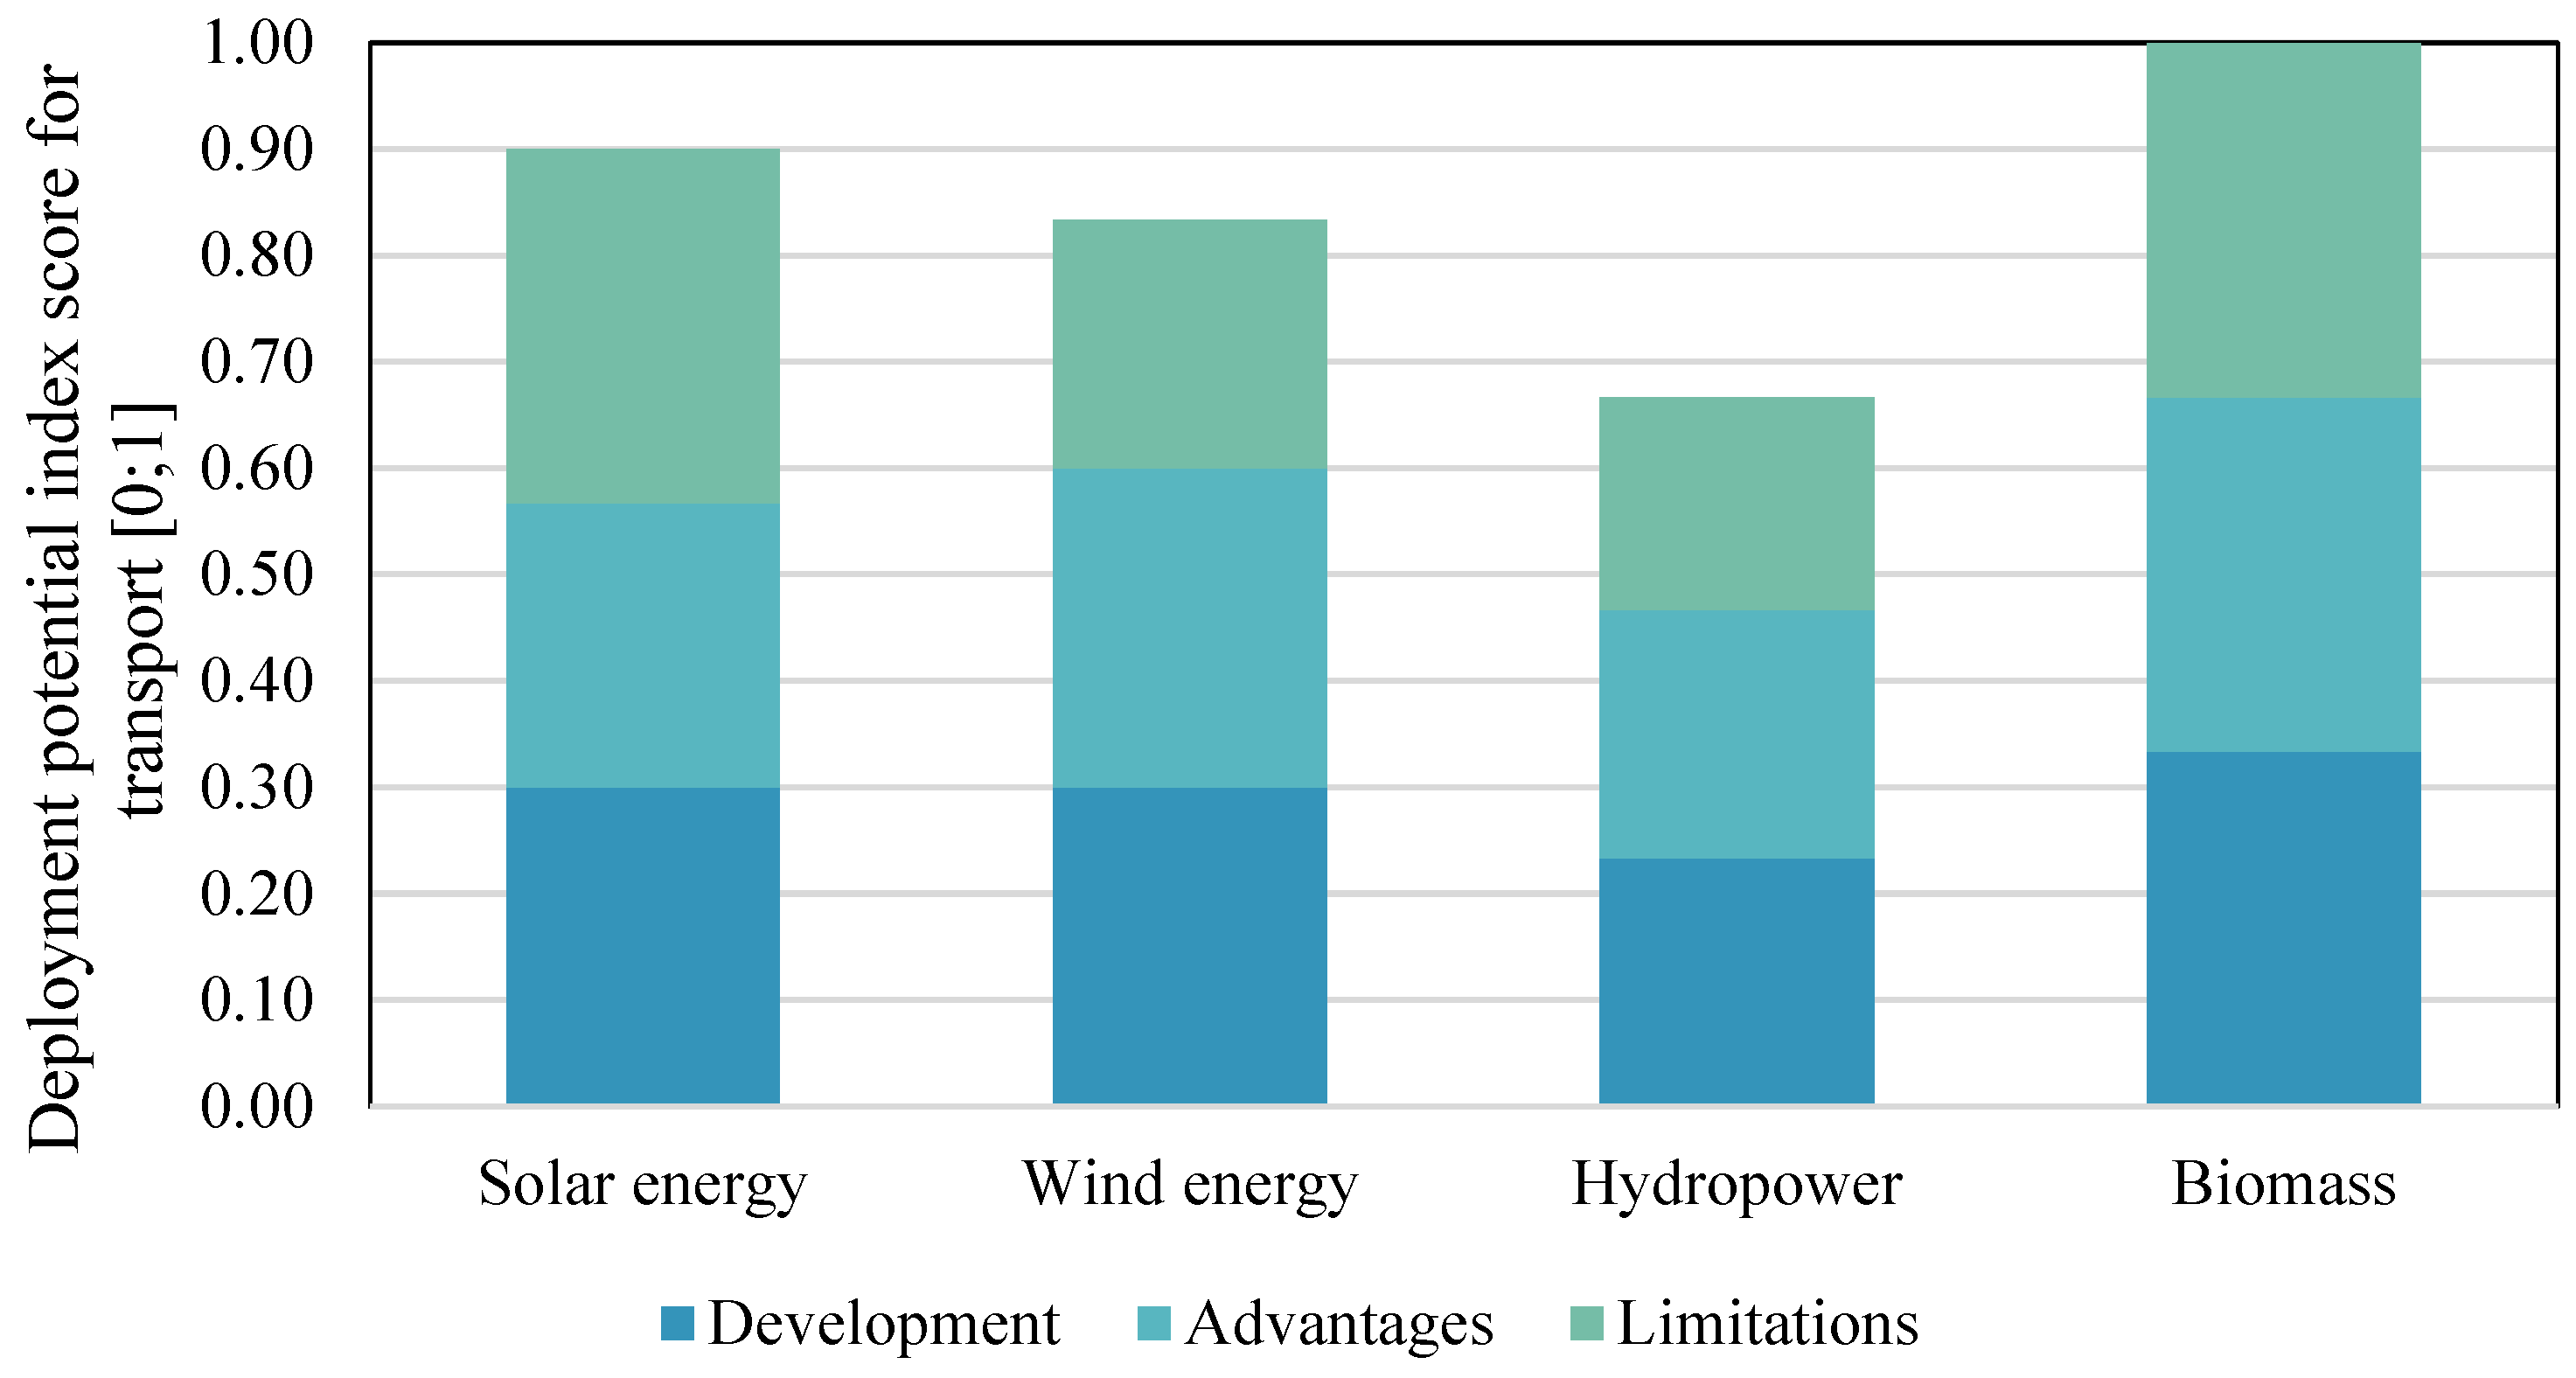
3.5. Transport Sector
3.6. A Cross-Sector Comparison to Assess the Sustainability Potential of the Use of RES
3.6.1. Solutions for the Development of Solar Energy and Biomass Use
Solar Energy
Biomass
3.6.2. Previous Research
3.6.3. Limitations of the Study
4. Conclusions
Author Contributions
Funding
Conflicts of Interest
References
- Camara, N.F.; Xu, D.; Binyet, E. Enhancing household energy consumption: How should it be done? Renew. Sustain. Energy Rev. 2018, 81, 669–681. [Google Scholar] [CrossRef]
- García-Pozo, A.; Marchante-Mera, A.J.; Campos-Soria, J.A. Innovation, environment, and productivity in the Spanish service sector: An implementation of a CDM structural model. J. Clean. Prod. 2018, 171, 1049–1057. [Google Scholar] [CrossRef]
- Zhang, G.; Lin, B. Impact of structure on unified efficiency for Chinese service sector—A two-stage analysis. Appl. Energy 2018, 231, 876–886. [Google Scholar] [CrossRef]
- Yang, Z.; Zhang, J.; Kintner-Meyer, M.C.W.; Lu, X.; Choi, D.; Lemmon, J.P.; Liu, J. Electrochemical energy storage for green grid. Chem. Rev. 2011, 111, 3577–3613. [Google Scholar] [CrossRef] [PubMed]
- Xiao, H.; Shan, Y.; Zhang, N.; Zhou, Y.; Wang, D.; Duan, Z. Comparisons of CO2 emission performance between secondary and service industries in Yangtze River Delta cities. J. Environ. Manag. 2019, 252, 109667. [Google Scholar] [CrossRef]
- Chen, C.; Pinar, M.; Stengos, T. Renewable energy consumption and economic growth nexus: Evidence from a threshold model. Energy Policy 2020, 139, 111295. [Google Scholar] [CrossRef]
- Voulis, N.; Warnier, M.; Brazier, F.M.T. Impact of service sector loads on renewable resource integration. Appl. Energy 2017, 205, 1311–1326. [Google Scholar] [CrossRef]
- Gao, Y.; Gao, X.; Zhang, X. The 2 °C Global Temperature Target and the Evolution of the Long-Term Goal of Addressing Climate Change—From the United Nations Framework Convention on Climate Change to the Paris Agreement. Engineering 2017, 3, 272–278. [Google Scholar] [CrossRef]
- Fu, X.; Zhou, Y. Collaborative Optimization of PV Greenhouses and Clean Energy Systems in Rural Areas. IEEE Trans. Sustain. Energy 2023, 14, 642–656. [Google Scholar] [CrossRef]
- Chow, T.T. A review on photovoltaic/thermal hybrid solar technology. Appl. Energy 2010, 87, 365–379. [Google Scholar] [CrossRef]
- Ben-Salha, O.; Hkiri, B.; Aloui, C. Sectoral energy consumption by source and output in the U.S.: New evidence from wavelet-based approach. Energy Econ. 2018, 72, 75–96. [Google Scholar] [CrossRef]
- Shukla, A.K.; Sudhakar, K.; Baredar, P. Renewable energy resources in South Asian countries: Challenges, policy and recommendations. Resour. Effic. Technol. 2017, 3, 342–346. [Google Scholar] [CrossRef]
- Fu, X. Statistical machine learning model for capacitor planning considering uncertainties in photovoltaic power. Prot. Control Mod. Power Syst. 2022, 7, 5. [Google Scholar] [CrossRef]
- Malico, I.; Nepomuceno Pereira, R.; Gonçalves, A.C.; Sousa, A.M.O. Current status and future perspectives for energy production from solid biomass in the European industry. Renew. Sustain. Energy Rev. 2019, 112, 960–977. [Google Scholar] [CrossRef]
- Samuel, M.P.; Murali, S.; Delfiya, A.; Krishnan, S. Engineering Tools and Technologies for Energy Efficient Fish Processing Operations; Central Institute of Fisheries Technology: Kerala, Inida, 2019. [Google Scholar]
- Awasthi, M.K.; Sarsaiya, S.; Patel, A.; Juneja, A.; Singh, R.P.; Yan, B.; Awasthi, S.K.; Jain, A.; Liu, T.; Duan, Y.; et al. Refining biomass residues for sustainable energy and bio-products: An assessment of technology, its importance, and strategic applications in circular bio-economy. Renew. Sustain. Energy Rev. 2020, 127, 109876. [Google Scholar] [CrossRef]
- Çiftçioğlu, G.A.; Kadırgan, F.; Kadırgan, M.A.N.; Kaynak, G. Smart agriculture through using cost-effective and high-efficiency solar drying. Heliyon 2020, 6, e03357. [Google Scholar] [CrossRef]
- Andrić, I.; Pina, A.; Ferrão, P.; Fournier, J.; Lacarrière, B.; Le Corre, O. Assessing the Feasibility of Using the Heat Demand-Outdoor Temperature Function for a Long-Term District Heat Demand Forecast. Energy Procedia 2017, 116, 460–469. [Google Scholar] [CrossRef]
- Mehta, D.P. Impacts of the save energy now (SEN) program. Energy Eng. J. Assoc. Energy Eng. 2010, 107, 43–59. [Google Scholar] [CrossRef]
- Abdelaziz, E.A.; Saidur, R.; Mekhilef, S. A review on energy saving strategies in industrial sector. Renew. Sustain. Energy Rev. 2011, 15, 150–168. [Google Scholar] [CrossRef]
- Alzahrani, A.; Petri, I.; Rezgui, Y. Modelling and implementing smart micro-grids for fish-processing industry. In Proceedings of the 2019 IEEE International Conference on Engineering, Technology and Innovation, ICE/ITMC 2019, Valbonne Sophia-Antipolis, France, 17–19 June 2019. [Google Scholar] [CrossRef]
- Andersson, E.; Arfwidsson, O.; Thollander, P. Benchmarking energy performance of industrial small and medium-sized enterprises using an energy efficiency index: Results based on an energy audit policy program. J. Clean. Prod. 2018, 182, 883–895. [Google Scholar] [CrossRef]
- Andersson, E.; Karlsson, M.; Thollander, P.; Paramonova, S. Energy end-use and efficiency potentials among Swedish industrial small and medium-sized enterprises—A dataset analysis from the national energy audit program. Renew. Sustain. Energy Rev. 2018, 93, 165–177. [Google Scholar] [CrossRef]
- Lingayat, A.B.; Chandramohan, V.P.; Raju, V.R.K.; Meda, V. A review on indirect type solar dryers for agricultural crops—Dryer setup, its performance, energy storage and important highlights. Appl. Energy 2020, 258, 114005. [Google Scholar] [CrossRef]
- Gude, V.G. Renewable Energy Powered Desalination Handbook: Application and Thermodynamics. In Renewable Energy Powered Desalination Handbook: Application and Thermodynamics; Butterworth-Heinemann: Oxford, UK, 2018; pp. 1–622. [Google Scholar] [CrossRef]
- Tiwari, G.N.; Sahota, L. Exergy and Technoeconomic Analysis of Solar Thermal Desalination. In Renewable Energy Powered Desalination Handbook: Application and Thermodynamics; Elsevier: Amsterdam, The Netherlands, 2018; pp. 517–580. [Google Scholar] [CrossRef]
- Hidayatno, A.; Destyanto, A.R.; Handoyo, B.A. A Conceptualization of Renewable Energy-Powered Industrial Cluster Development in Indonesia. Energy Procedia 2019, 156, 7–12. [Google Scholar] [CrossRef]
- Hussain, A.; Sarangi, G.K.; Pandit, A.; Ishaq, S.; Mamnun, N.; Ahmad, B.; Jamil, M.K. Hydropower development in the Hindu Kush Himalayan region: Issues, policies and opportunities. Renew. Sustain. Energy Rev. 2019, 107, 446–461. [Google Scholar] [CrossRef]
- Jia, T.; Huang, J.; Li, R.; He, P.; Dai, Y. Status and prospect of solar heat for industrial processes in China. Renew. Sustain. Energy Rev. 2018, 90, 475–489. [Google Scholar] [CrossRef]
- Kylili, A.; Fokaides, P.A.; Ioannides, A.; Kalogirou, S. Environmental assessment of solar thermal systems for the industrial sector. J. Clean. Prod. 2018, 176, 99–109. [Google Scholar] [CrossRef]
- Mayyas, M.; Nekouei, R.K.; Sahajwalla, V. Valorization of lignin biomass as a carbon feedstock in steel industry: Iron oxide reduction, steel carburizing and slag foaming. J. Clean. Prod. 2019, 219, 971–980. [Google Scholar] [CrossRef]
- Nazir, M.S.; Ali, N.; Bilal, M.; Iqbal, H.M.N. Potential environmental impacts of wind energy development: A global perspective. Curr. Opin. Environ. Sci. Health 2020, 13, 85–90. [Google Scholar] [CrossRef]
- Penghao, C.; Pingkuo, L.; Hua, P. Prospects of hydropower industry in the Yangtze River Basin: China’s green energy choice. Renew. Energy 2019, 131, 1168–1185. [Google Scholar] [CrossRef]
- Sari, M.A.; Badruzzaman, M.; Cherchi, C.; Swindle, M.; Ajami, N.; Jacangelo, J.G. Recent innovations and trends in in-conduit hydropower technologies and their applications in water distribution systems. J. Environ. Manag. 2018, 228, 416–428. [Google Scholar] [CrossRef]
- Wang, Y.; Yan, W.; Zhuang, S.; Zhang, Q. Competition or complementarity? The hydropower and thermal power nexus in China. Renew. Energy 2019, 138, 531–541. [Google Scholar] [CrossRef]
- Sovacool, B.K.; Walter, G. Major hydropower states, sustainable development, and energy security: Insights from a preliminary cross-comparative assessment. Energy 2018, 142, 1074–1082. [Google Scholar] [CrossRef]
- Abriyantoro, D.; Dong, J.; Hicks, C.; Singh, S.P. A stochastic optimisation model for biomass outsourcing in the cement manufacturing industry with production planning constraints. Energy 2019, 169, 515–526. [Google Scholar] [CrossRef]
- Bogdanov, D.; Gulagi, A.; Fasihi, M.; Breyer, C. Full energy sector transition towards 100% renewable energy supply: Integrating power, heat, transport and industry sectors including desalination. Appl. Energy 2021, 283, 116273. [Google Scholar] [CrossRef]
- Oliveira, A.M.; Beswick, R.R.; Yan, Y. A green hydrogen economy for a renewable energy society. Curr. Opin. Chem. Eng. 2021, 33, 100701. [Google Scholar] [CrossRef]
- Olabi, A.G.; Abdelkareem, M.A. Renewable energy and climate change. Renew. Sustain. Energy Rev. 2022, 158, 112111. [Google Scholar] [CrossRef]
- Ahlström, J.M.; Zetterholm, J.; Pettersson, K.; Harvey, S.; Wetterlund, E. Economic potential for substitution of fossil fuels with liquefied biomethane in Swedish iron and steel industry—Synergy and competition with other sectors. Energy Convers. Manag. 2020, 209, 112641. [Google Scholar] [CrossRef]
- Anser, M.K.; Usman, M.; Sharif, M.; Bashir, S.; Shabbir, M.S.; Yahya Khan, G.; Lopez, L.B. The dynamic impact of renewable energy sources on environmental economic growth: Evidence from selected Asian economies. Environ. Sci. Pollut. Res. 2021, 29, 3323–3335. [Google Scholar] [CrossRef]
- Carvajal, P.E.; Li, F.G.N.; Soria, R.; Cronin, J.; Anandarajah, G.; Mulugetta, Y. Large hydropower, decarbonisation and climate change uncertainty: Modelling power sector pathways for Ecuador. Energy Strategy Rev. 2019, 23, 86–99. [Google Scholar] [CrossRef]
- Luong, N.D. A critical review on Energy Efficiency and Conservation policies and programs in Vietnam. Renew. Sustain. Energy Rev. 2015, 52, 623–634. [Google Scholar] [CrossRef]
- Easterly, J. Assessment of Bio-oil as a Replacement for Heating Oil. Northeast Reg. Biomass Program 2002, 1, 1–15. [Google Scholar]
- Farjana, S.H.; Huda, N.; Mahmud, M.A.P.; Saidur, R. Solar process heat in industrial systems—A global review. Renew. Sustain. Energy Rev. 2018, 82, 2270–2286. [Google Scholar] [CrossRef]
- Fekete, H.; Kuramochi, T.; Roelfsema, M.; den Elzen, M.; Forsell, N.; Höhne, N.; Luna, L.; Hans, F.; Sterl, S.; Olivier, J.; et al. A review of successful climate change mitigation policies in major emitting economies and the potential of global replication. Renew. Sustain. Energy Rev. 2021, 137, 110602. [Google Scholar] [CrossRef]
- Gao, J.; Hou, H.; Zhai, Y.; Woodward, A.; Vardoulakis, S.; Kovats, S.; Wilkinson, P.; Li, L.; Song, X.; Xu, L.; et al. Greenhouse gas emissions reduction in different economic sectors: Mitigation measures, health co-benefits, knowledge gaps, and policy implications. Environ. Pollution. 2018, 240, 683–698. [Google Scholar] [CrossRef]
- Jordan, M.; Millinger, M.; Thrän, D. Robust bioenergy technologies for the German heat transition: A novel approach combining optimization modeling with Sobol’sensitivity analysis. Appl. Energy 2020, 262, 114534. [Google Scholar] [CrossRef]
- Jordan, M.; Lenz, V.; Millinger, M.; Oehmichen, K.; Thrän, D. Future competitive bioenergy technologies in the German heat sector: Findings from an economic optimization approach. Energy 2019, 189, 116194. [Google Scholar] [CrossRef]
- Mi, Z.; Guan, D.; Liu, Z.; Liu, J.; Viguié, V.; Fromer, N.; Wang, Y. Cities: The core of climate change mitigation. J. Clean. Prod. 2019, 207, 582–589. [Google Scholar] [CrossRef]
- Reid, L.; Ellsworth-Krebs, K. Demanding expectations: Exploring the experience of distributed heat generation in Europe. Energy Res. Soc. Sci. 2021, 71, 101821. [Google Scholar] [CrossRef]
- Salah, W.A.; Abuhelwa, M.; Bashir, M.J. The key role of sustainable renewable energy technologies in facing shortage of energy supplies in Palestine: Current practice and future potential. J. Clean. Prod. 2021, 293, 125348. [Google Scholar] [CrossRef]
- Suresh, N.S.; Rao, B.S. Solar energy for process heating: A case study of select Indian industries. J. Clean. Prod. 2017, 151, 439–451. [Google Scholar] [CrossRef]
- Wang, M.; Peng, J.; Li, N.; Yang, H.; Wang, C.; Li, X.; Lu, T. Comparison of energy performance between PV double skin facades and PV insulating glass units. Appl. Energy 2017, 194, 148–160. [Google Scholar] [CrossRef]
- El Bassam, N.; Maegaard, P.; Schlichting, M.L. Current Distributed Renewable Energy Rural and Urban Communities. In Distributed Renewable Energies for Off-Grid Communities; Elsevier: Amsterdam, The Netherlands, 2019; pp. 215–283. [Google Scholar] [CrossRef]
- Asere, L.; Mols, T.; Blumberga, A. Assessment of Indoor Air Quality in Renovated Buildings of Liepāja Municipality. Energy Procedia 2016, 91, 907–915. [Google Scholar] [CrossRef]
- Barbato, M.; Cirillo, L.; Menditto, L.; Moretti, R.; Nardini, S. Feasibility study of a geothermal energy system for indoor swimming pool in Campi Flegrei area. Therm. Sci. Eng. Prog. 2018, 6, 421–425. [Google Scholar] [CrossRef]
- Xing, R.; Hanaoka, T.; Kanamori, Y.; Masui, T. Estimating energy service demand and CO2 emissions in the Chinese service sector at provincial level up to 2030. Resour. Conserv. Recycl. 2018, 134, 347–360. [Google Scholar] [CrossRef]
- Burns, G.L.; Haraldsdóttir, L. Hydropower and tourism in Iceland: Visitor and operator perspectives on preferred use of natural areas. J. Outdoor Recreat. Tour. 2019, 25, 91–101. [Google Scholar] [CrossRef]
- Chan, E.S.W.; Okumus, F.; Chan, W. What hinders hotels’ adoption of environmental technologies: A quantitative study. Int. J. Hosp. Manag. 2020, 84, 102324. [Google Scholar] [CrossRef]
- Guo, S.; Li, Y.; Hu, Y.; Xue, F.; Chen, B.; Chen, Z.M. Embodied energy in service industry in global cities: A study of six Asian cities. Land Use Policy 2020, 91, 104264. [Google Scholar] [CrossRef]
- Frangou, M.; Aryblia, M.; Tournaki, S.; Tsoutsos, T. Renewable energy performance contracting in the tertiary sector Standardization to overcome barriers in Greece. Renew. Energy 2018, 125, 829–839. [Google Scholar] [CrossRef]
- Bellocchi, S.; Manno, M.; Noussan, M.; Prina, M.G.; Vellini, M. Electrification of transport and residential heating sectors in support of renewable penetration: Scenarios for the Italian energy system. Energy 2020, 196, 117062. [Google Scholar] [CrossRef]
- Lönnqvist, T.; Anderberg, S.; Ammenberg, J.; Sandberg, T.; Grönkvist, S. Stimulating biogas in the transport sector in a Swedish region—An actor and policy analysis with supply side focus. Renew. Sustain. Energy Rev. 2019, 113, 109269. [Google Scholar] [CrossRef]
- Ulewicz, R.; Siwiec, D.; Pacana, A.; Tutak, M.; Brodny, J. Multi-Criteria Method for the Selection of Renewable Energy Sources in the Polish Industrial Sector. Energies 2021, 14, 2386. [Google Scholar] [CrossRef]
- Christopher, S.; Vikram, M.P.; Bakli, C.; Thakur, A.K.; Ma, Y.; Ma, Z.; Xu, H.; Cuce, P.M.; Cuce, E.; Singh, P. Renewable energy potential towards attainment of net-zero energy buildings status—A critical review. J. Clean. Prod. 2023, 405, 136942. [Google Scholar] [CrossRef]
- Wang, Y.; Zhang, D.; Ji, Q.; Shi, X. Regional renewable energy development in China: A multidimensional assessment. Renew. Sustain. Energy Rev. 2020, 124, 109797. [Google Scholar] [CrossRef]
- Dhirasasna, N.N.; Becken, S.; Sahin, O. A systems approach to examining the drivers and barriers of renewable energy technology adoption in the hotel sector in Queensland, Australia. J. Hosp. Tour. Manag. 2020, 42, 153–172. [Google Scholar] [CrossRef]
- Farfan, J.; Lohrmann, A.; Breyer, C. Integration of greenhouse agriculture to the energy infrastructure as an alimentary solution. Renew. Sustain. Energy Rev. 2019, 110, 368–377. [Google Scholar] [CrossRef]
- Scarlat, N.; Fahl, F.; Lugato, E.; Monforti-Ferrario, F.; Dallemand, J.F. Integrated and spatially explicit assessment of sustainable crop residues potential in Europe. Biomass Bioenergy 2019, 122, 257–269. [Google Scholar] [CrossRef]
- Ganiyu, S.O.; Martínez-Huitle, C.A.; Rodrigo, M.A. Renewable energies driven electrochemical wastewater/soil decontamination technologies: A critical review of fundamental concepts and applications. Appl. Catal. B Environ. 2020, 270, 118857. [Google Scholar] [CrossRef]
- Vakalis, S.; Moustakas, K.; Heimann, R.; Loizidou, M. The renewable battery concept via conversion of agricultural waste into biocoal using frictional pyrolysis. J. Clean. Prod. 2019, 229, 1183–1188. [Google Scholar] [CrossRef]
- García-Valladares, O.; Ortiz, N.M.; Pilatowsky, I.; Menchaca, A.C. Solar thermal drying plant for agricultural products. Part 1: Direct air heating system. Renew. Energy 2020, 148, 1302–1320. [Google Scholar] [CrossRef]
- Moustakas, K.; Parmaxidou, P.; Vakalis, S. Anaerobic digestion for energy production from agricultural biomass waste in Greece: Capacity assessment for the region of Thessaly. Energy 2020, 191, 116556. [Google Scholar] [CrossRef]
- Rikkonen, P.; Tapio, P.; Rintamäki, H. Visions for small-scale renewable energy production on Finnish farms—A Delphi study on the opportunities for new business. Energy Policy 2019, 129, 939–948. [Google Scholar] [CrossRef]
- Ambriz-Díaz, V.M.; Rubio-Maya, C.; Pacheco Ibarra, J.J.; Galván González, S.R.; Martínez Patiño, J. Analysis of a sequential production of electricity, ice and drying of agricultural products by cascading geothermal energy. Int. J. Hydrogen Energy 2017, 42, 18092–18102. [Google Scholar] [CrossRef]
- Lamidi, R.O.; Jiang, L.; Pathare, P.B.; Wang, Y.D.; Roskilly, A.P. Recent advances in sustainable drying of agricultural produce: A review. Appl. Energy 2019, 233–234, 367–385. [Google Scholar] [CrossRef]
- Lin, L.; Yang, J.; Ni, S.; Wang, X.; Bian, H.; Dai, H. Resource utilization and ionization modification of waste starch from the recycling process of old corrugated cardboard paper. J. Environ. Manag. 2020, 271, 111031. [Google Scholar] [CrossRef]
- Gojiya, A.; Deb, D.; Iyer, K.K.R. Feasibility study of power generation from agricultural residue in comparison with soil incorporation of residue. Renew. Energy 2019, 134, 416–425. [Google Scholar] [CrossRef]
- Safieddin Ardebili, S.M.; Khademalrasoul, A. An analysis of liquid-biofuel production potential from agricultural residues and animal fat (case study: Khuzestan Province). J. Clean. Prod. 2018, 204, 819–831. [Google Scholar] [CrossRef]
- Akkoli, K.M.; Gangavati, P.B.; Ingalagi, M.R.; Chitgopkar, R.K. Assessment and characterization of agricultural residues. Mater. Today Proc. 2018, 5, 17548–17552. [Google Scholar] [CrossRef]
- Lozano, F.J.; Lozano, R. Assessing the potential sustainability benefits of agricultural residues: Biomass conversion to syngas for energy generation or to chemicals production. J. Clean. Prod. 2018, 172, 4162–4169. [Google Scholar] [CrossRef]
- Go, A.W.; Conag, A.T.; Igdon, R.M.B.; Toledo, A.S.; Malila, J.S. Potentials of agricultural and agro-industrial crop residues for the displacement of fossil fuels: A Philippine context. Energy Strategy Rev. 2019, 23, 100–113. [Google Scholar] [CrossRef]
- Morato, T.; Vaezi, M.; Kumar, A. Assessment of energy production potential from agricultural residues in Bolivia. Renew. Sustain. Energy Rev. 2019, 102, 14–23. [Google Scholar] [CrossRef]
- Venturini, G.; Pizarro-Alonso, A.; Münster, M. How to maximise the value of residual biomass resources: The case of straw in Denmark. Appl. Energy 2019, 250, 369–388. [Google Scholar] [CrossRef]
- Bentsen, N.S.; Jørgensen, J.R.; Stupak, I.; Jørgensen, U.; Taghizadeh-Toosi, A. Dynamic sustainability assessment of heat and electricity production based on agricultural crop residues in Denmark. J. Clean. Prod. 2019, 213, 491–507. [Google Scholar] [CrossRef]
- Gourdo, L.; Fatnassi, H.; Tiskatine, R.; Wifaya, A.; Demrati, H.; Aharoune, A.; Bouirden, L. Solar energy storing rock-bed to heat an agricultural greenhouse. Energy 2019, 169, 206–212. [Google Scholar] [CrossRef]
- Narvarte, L.; Fernández-Ramos, J.; Martínez-Moreno, F.; Carrasco, L.M.; Almeida, R.H.; Carrêlo, I.B. Solutions for adapting photovoltaics to large power irrigation systems for agriculture. Sustain. Energy Technol. Assess. 2018, 29, 119–130. [Google Scholar] [CrossRef]
- Tomaszewska, B.; Akkurt, G.G.; Kaczmarczyk, M.; Bujakowski, W.; Keles, N.; Jarma, Y.A.; Baba, A.; Bryjak, M.; Kabay, N. Utilization of renewable energy sources in desalination of geothermal water for agriculture. Desalination 2021, 513, 115151. [Google Scholar] [CrossRef]
- Pata, U.K. Linking renewable energy, globalization, agriculture, CO2 emissions and ecological footprint in BRIC countries: A sustainability perspective. Renew. Energy 2021, 173, 197–208. [Google Scholar] [CrossRef]
- Chandio, A.A.; Akram, W.; Ozturk, I.; Ahmad, M.; Ahmad, F. Towards long-term sustainable environment: Does agriculture and renewable energy consumption matter? Environ. Sci. Pollut. Res. 2021, 28, 53141–53160. [Google Scholar] [CrossRef]
- Abraham, A.; Mathew, A.K.; Park, H.; Choi, O.; Sindhu, R.; Parameswaran, B.; Pandey, A.; Park, J.H.; Sang, B.I. Pretreatment strategies for enhanced biogas production from lignocellulosic biomass. Bioresour. Technol. 2020, 301, 122725. [Google Scholar] [CrossRef]
- Banja, M.; Sikkema, R.; Jégard, M.; Motola, V.; Dallemand, J.F. Biomass for energy in the EU—The support framework. Energy Policy 2019, 131, 215–228. [Google Scholar] [CrossRef]
- Schipfer, F.; Kranzl, L. Techno-economic evaluation of biomass-to-end-use chains based on densified bioenergy carriers (dBECs). Appl. Energy 2019, 239, 715–724. [Google Scholar] [CrossRef]
- Sharma, H.; Haque, A.; Jaffery, Z.A. Maximization of wireless sensor network lifetime using solar energy harvesting for smart agriculture monitoring. Ad Hoc. Netw. 2019, 94, 101966. [Google Scholar] [CrossRef]
- Tajeddin, A.; Roohi, E. Designing a reliable wind farm through hybridization with biomass energy. Appl. Therm. Eng. 2019, 154, 171–179. [Google Scholar] [CrossRef]
- Askeland, K.; Bozhkova, K.N.; Sorknæs, P. Balancing Europe: Can district heating affect the flexibility potential of Norwegian hydropower resources? Renew. Energy 2019, 141, 646–656. [Google Scholar] [CrossRef]
- Bać, A.; Nemś, M.; Nemś, A.; Kasperski, J. Sustainable Integration of a Solar Heating System into a Single-Family House in the Climate of Central Europe—A Case Study. Sustainability 2019, 11, 4167. [Google Scholar] [CrossRef]
- Bonnet, J.; Coll-Martínez, E.; Renou-Maissant, P. Evaluating Sustainable Development by Composite Index: Evidence from French Departments. Sustainability 2021, 13, 761. Available online: https://ideas.repec.org/a/gam/jsusta/v13y2021i2p761-d480315.html (accessed on 3 February 2023). [CrossRef]
- Barton, J.; Davies, L.; Dooley, B.; Foxon, T.J.; Galloway, S.; Hammond, G.P.; O’Grady, Á.; Robertson, E.; Thomson, M. Transition pathways for a UK low-carbon electricity system: Comparing scenarios and technology implications. Renew. Sustain. Energy Rev. 2018, 82, 2779–2790. [Google Scholar] [CrossRef]
- Briguglio, M.; Formosa, G. When households go solar: Determinants of uptake of a Photovoltaic Scheme and policy insights. Energy Policy 2017, 108, 154–162. [Google Scholar] [CrossRef]
- Chen, C.F.; Wang, Y.U.; Adua, L.; Bai, H. Reducing fossil fuel consumption in the household sector by enabling technology and behavior. Energy Res. Soc. Sci. 2020, 60, 101402. [Google Scholar] [CrossRef]
- Comino, E.; Dominici, L.; Ambrogio, F.; Rosso, M. Mini-hydro power plant for the improvement of urban water-energy nexus toward sustainability—A case study. J. Clean. Prod. 2020, 249, 119416. [Google Scholar] [CrossRef]
- Cruz, T.; Schaeffer, R.; Lucena, A.F.P.; Melo, S.; Dutra, R. Solar water heating technical-economic potential in the household sector in Brazil. Renew. Energy 2020, 146, 1618–1639. [Google Scholar] [CrossRef]
- Dianshu, F.; Sovacool, B.K.; Vu, K. The barriers to energy efficiency in China: Assessing household electricity savings and consumer behavior in Liaoning Province. Energy Policy 2010, 38, 1202–1209. [Google Scholar] [CrossRef]
- Fikru, M.G.; Gelles, G.; Ichim, A.M.; Smith, J.D. Notes on the Economics of Residential Hybrid Energy System. Energies 2019, 12, 2639. [Google Scholar] [CrossRef]
- Hakimi, S.M.; Saadatmandi, M.; Shafie-Khah, M.; Catalão, J.P.S. Smart household management systems with renewable generation to increase the operation profit of a microgrid. IET Smart Grid 2019, 2, 522–528. [Google Scholar] [CrossRef]
- Krikser, T.; Profeta, A.; Grimm, S.; Huther, H. Willingness-to-Pay for District Heating from Renewables of Private Households in Germany. Sustainability 2020, 12, 4129. [Google Scholar] [CrossRef]
- Las-Heras-Casas, J.; López-Ochoa, L.M.; Paredes-Sánchez, J.P.; López-González, L.M. Implementation of biomass boilers for heating and domestic hot water in multi-family buildings in Spain: Energy, environmental, and economic assessment. J. Clean. Prod. 2018, 176, 590–603. [Google Scholar] [CrossRef]
- Marczinkowski, H.M.; Østergaard, P.A. Evaluation of electricity storage versus thermal storage as part of two different energy planning approaches for the islands SamsØ and Orkney. Energy 2019, 175, 505–514. [Google Scholar] [CrossRef]
- Marczinkowski, H.M.; Østergaard, P.A. Residential versus Communal Combination of Photovoltaic and Battery in Smart Energy Systems. Energy 2018, 152, 466–475. [Google Scholar] [CrossRef]
- Martin, R. Making sense of renewable energy: Practical knowledge, sensory feedback and household understandings in a Scottish island microgrid. Energy Res. Soc. Sci. 2020, 66, 101501. [Google Scholar] [CrossRef]
- Nilsson, A.; Wester, M.; Lazarevic, D.; Brandt, N. Smart homes, home energy management systems and real-time feedback: Lessons for influencing household energy consumption from a Swedish field study. Energy Build. 2018, 179, 15–25. [Google Scholar] [CrossRef]
- Piekut, M.; Rodrigues Gaspar, A. The Consumption of Renewable Energy Sources (RES) by the European Union Households between 2004 and 2019. Energies 2021, 14, 5560. [Google Scholar] [CrossRef]
- Tuomela, S.; de Castro Tomé, M.; Iivari, N.; Svento, R. Impacts of home energy management systems on electricity consumption. Appl. Energy 2021, 299, 117310. [Google Scholar] [CrossRef]
- Ziaei, S.M. The impacts of household social benefits, public expenditure on labour markets, and household financial assets on the renewable energy sector. Renew. Energy 2022, 181, 51–58. [Google Scholar] [CrossRef]
- Kulisic, B.; Dimitriou, I.; Mola-Yudego, B. From preferences to concerted policy on mandated share for renewable energy in transport. Energy Policy 2021, 155, 112355. [Google Scholar] [CrossRef]
- Potrč, S.; Čuček, L.; Martin, M.; Kravanja, Z. Sustainable renewable energy supply networks optimization—The gradual transition to a renewable energy system within the European Union by 2050. Renew. Sustain. Energy Rev. 2021, 146, 111186. [Google Scholar] [CrossRef]
- Ajanovic, A.; Haas, R. Economic prospects and policy framework for hydrogen as fuel in the transport sector. Energy Policy 2018, 123, 280–288. [Google Scholar] [CrossRef]
- Darda, S.; Papalas, T.; Zabaniotou, A. Biofuels journey in Europe: Currently the way to low carbon economy sustainability is still a challenge. J. Clean. Prod. 2019, 208, 575–588. [Google Scholar] [CrossRef]
- Godil, D.I.; Yu, Z.; Sharif, A.; Usman, R.; Khan, S.A.R. Investigate the role of technology innovation and renewable energy in reducing transport sector CO2 emission in China: A path toward sustainable development. Sustain. Dev. 2021, 29, 694–707. [Google Scholar] [CrossRef]
- Jung, C.; Nagel, L.; Schindler, D.; Grau, L. Fossil fuel reduction potential in Germany’s transport sector by wind-to-hydrogen. Int. J. Hydrogen Energy 2018, 43, 23161–23167. [Google Scholar] [CrossRef]
- Korberg, A.D.; Skov, I.R.; Mathiesen, B.V. The role of biogas and biogas-derived fuels in a 100% renewable energy system in Denmark. Energy 2020, 199, 117426. [Google Scholar] [CrossRef]
- Navas-Anguita, Z.; García-Gusano, D.; Iribarren, D. A review of techno-economic data for road transportation fuels. Renew. Sustain. Energy Rev. 2019, 112, 11–26. [Google Scholar] [CrossRef]
- Onarheim, K.; Hannula, I.; Solantausta, Y. Hydrogen enhanced biofuels for transport via fast pyrolysis of biomass: A conceptual assessment. Energy 2020, 199, 117337. [Google Scholar] [CrossRef]
- Qyyum, M.A.; Haider, J.; Qadeer, K.; Valentina, V.; Khan, A.; Yasin, M.; Aslam, M.; De Guido, G.; Pellegrini, L.A.; Lee, M. Biogas to liquefied biomethane: Assessment of 3P’s–Production, processing, and prospects. Renew. Sustain. Energy Rev. 2020, 119, 109561. [Google Scholar] [CrossRef]
- Cîrstea, S.; Moldovan-Teselios, C.; Cîrstea, A.; Turcu, A.; Darab, C. Evaluating Renewable Energy Sustainability by Composite Index. Sustainability 2018, 10, 811. [Google Scholar] [CrossRef]
- Pandian, G.S. Composite Performance Index for Sustainability. IOSR J. Environ. Sci. Toxicol. Food Technol. 2013, 3, 91–102. [Google Scholar] [CrossRef]
- Salvati, L.; Carlucci, M. A composite index of sustainable development at the local scale: Italy as a case study. Ecol. Indic. 2014, 43, 162–171. [Google Scholar] [CrossRef]
- Balode, L.; Dolge, K.; Lund, P.D.; Blumberga, D. How to Assess Policy Impact in National Energy and Climate Plans. Environ. Clim. Technol. 2021, 25, 405–421. [Google Scholar] [CrossRef]
- Balode, L.; Dolge, K.; Blumberga, D. The Contradictions between District and Individual Heating towards Green Deal Targets. Sustainability 2021, 13, 3370. [Google Scholar] [CrossRef]
- Ben Jebli, M.; Farhani, S.; Guesmi, K. Renewable energy, CO2 emissions and value added: Empirical evidence from countries with different income levels. Struct. Change Econ. Dyn. 2020, 53, 402–410. [Google Scholar] [CrossRef]
- Eryilmaz, D.; Homans, F.R. How does uncertainty in renewable energy policy affect decisions to invest in wind energy? Electr. J. 2016, 29, 64–71. [Google Scholar] [CrossRef]
- Irene. Cities, Towns and Renewable Energy: Yes in My Front Yard; OECD Library: Berlin, Germany, 2016; pp. 1–186. [Google Scholar] [CrossRef]
- Dupré la Tour, M.-A. Photovoltaic and wind energy potential in Europe—A systematic review. Renew. Sustain. Energy Rev. 2023, 179, 113189. [Google Scholar] [CrossRef]
- Bobinaite, V.; Tarvydas, D. Financing instruments and channels for the increasing production and consumption of renewable energy: Lithuanian case. Renew. Sustain. Energy Rev. 2014, 38, 259–276. [Google Scholar] [CrossRef]
- Wang, D.; Orehounig, K.; Carmeliet, J. A Study of District Heating Systems with Solar Thermal Based Prosumers. Energy Procedia 2018, 149, 132–140. [Google Scholar] [CrossRef]


| Sector | Topic | Source of Literature |
|---|---|---|
| Industry |
| [11,14,19,20,21,22,23,24,25,26,27,28,29,30,31,32,33,34,35,36,37,38,39,40,41,42,43,44,45,46,47,48,49,50,51,52,53,54,55] |
| Services |
| [38,51,56,57,58,59,60,61,62,63,64,65,66,67,68,69] |
| Agriculture |
| [17,20,55,70,71,72,73,74,75,76,77,78,79,80,81,82,83,84,85,86,87,88,89,90,91,92,93,94,95] |
| Households |
| [17,20,24,55,70,71,72,74,75,76,77,78,79,80,81,84,86,87,88,96,97,98,99,100,101,102,103,104,105,106,107,108,109,110,111,112,113,114,115,116,117] |
| Transport |
| [38,51,56,118,119,120,121,122,123,124,125,126,127] |
| Criteria | Research Question | Evaluation Scale |
|---|---|---|
| Development | How fast is the technological development of a specific type of RES? | 5—the most rapid development 4—fast development, there are limiting factors 3—limited development 2—very slow development 1—no development observed |
| Advantages | Which of the RES has the greatest advantages in use? | 5—greatest advantages 4—second-greatest advantages 3—fewer advantages, there are significant constraints 2—there are many constraints 1—no significant advantages observed |
| Limitations | How significant are the constraints and limitations of a specific type of RES in the sector? | 5—almost no limiting factors or severe limitations are observed 4—minor limitations are observed that affect the use of the specific RES 3—there are few disadvantages that limit the use of the specific RES 2—numerous disadvantages limit the use of the source 1—Many limitations hinder the utilisation of RESs |
| Sector | |||||
|---|---|---|---|---|---|
| Industry Sector | Solar Energy | Wind Energy | Hydropower | Biomass | Geothermal Energy |
| Development | 5.0 | 3.5 | 3.5 | 4.0 | 3.5 |
| Advantages | 4.5 | 3.5 | 3.0 | 4.0 | 3.5 |
| Limitations | 3.0 | 3.0 | 3.5 | 3.5 | 4.0 |
| Total | 12.5 | 10.0 | 10.0 | 11.5 | 11.0 |
| Service sector | |||||
| Development | 5.0 | 3.0 | 3.0 | 3.5 | 4.0 |
| Advantages | 4.5 | 3.0 | 3.0 | 3.5 | 4.0 |
| Limitations | 4.0 | 3.0 | 3.0 | 3.5 | 4.0 |
| Total | 13.5 | 9.0 | 9.0 | 10.5 | 12.0 |
| Agriculture sector | |||||
| Development | 4.0 | 3.0 | 3.0 | 5.0 | 3.0 |
| Advantages | 5.0 | 3.5 | 3.0 | 5.0 | 3.0 |
| Limitations | 5.0 | 3.0 | 3.0 | 5.0 | 4.0 |
| Total | 14.0 | 9.5 | 9.0 | 15.0 | 10.0 |
| Household sector | |||||
| Development | 4.0 | 3.5 | 4.0 | 4.5 | 4.0 |
| Advantages | 4.5 | 4.0 | 3.5 | 3.5 | 4.0 |
| Limitations | 4.0 | 3.5 | 3.5 | 3.5 | 3.0 |
| Total | 12.5 | 11.0 | 11.0 | 11.5 | 11.0 |
| Transport sector | |||||
| Development | 4.5 | 4.5 | 3.5 | 5.0 | 3.0 |
| Advantages | 4.0 | 4.5 | 3.5 | 5.0 | 3.0 |
| Limitations | 5.0 | 3.5 | 3.0 | 5.0 | 3.0 |
| Total | 13.5 | 12.5 | 10.0 | 15.0 | 9.0 |
| Solar Energy | Wind Energy | Hydropower | Biomass | Geothermal Energy | |
|---|---|---|---|---|---|
| Criteria | |||||
| Development | 5 | 3.5 | 3.5 | 4 | 3.5 |
| Advantages | 4.5 | 3.5 | 3 | 4 | 3.5 |
| Limitations | 3 | 3 | 3.5 | 3.5 | 4 |
| Total | 12.5 | 10 | 10 | 11.5 | 11 |
| RES Technologies | |||||
|---|---|---|---|---|---|
| Solar energy | Wind Energy | Hydropower | Biomass | Geothermal Energy | |
| Criteria | |||||
| Development | 1 | 0.7 | 0.7 | 0.8 | 0.7 |
| Advantages | 0.9 | 0.7 | 0.6 | 0.8 | 0.7 |
| Limitations | 0.6 | 0.6 | 0.7 | 0.7 | 0.8 |
| Development | 0.33 | 0.23 | 0.23 | 0.27 | 0.23 |
| Advantages | 0.30 | 0.23 | 0.20 | 0.27 | 0.23 |
| Limitations | 0.20 | 0.20 | 0.23 | 0.23 | 0.27 |
| Total | 0.83 | 0.67 | 0.67 | 0.77 | 0.73 |
| Sector | Solar Energy | Wind Energy | Hydropower | Biomass | Geothermal Energy |
|---|---|---|---|---|---|
| Industry Sector | |||||
| Development | 0.33 | 0.23 | 0.23 | 0.27 | 0.23 |
| Advantages | 0.30 | 0.23 | 0.20 | 0.27 | 0.23 |
| Limitations | 0.20 | 0.20 | 0.23 | 0.23 | 0.27 |
| Total | 0.83 | 0.67 | 0.67 | 0.77 | 0.73 |
| Service sector | |||||
| Development | 0.33 | 0.20 | 0.20 | 0.23 | 0.27 |
| Advantages | 0.30 | 0.20 | 0.20 | 0.23 | 0.27 |
| Limitations | 0.27 | 0.20 | 0.20 | 0.23 | 0.27 |
| Total | 0.90 | 0.60 | 0.60 | 0.70 | 0.80 |
| Agriculture sector | |||||
| Development | 0.27 | 0.20 | 0.20 | 0.33 | 0.20 |
| Advantages | 0.33 | 0.23 | 0.20 | 0.33 | 0.20 |
| Limitations | 0.33 | 0.20 | 0.20 | 0.33 | 0.27 |
| Total | 0.93 | 0.63 | 0.60 | 1.00 | 0.67 |
| Household sector | |||||
| Development | 0.27 | 0.23 | 0.27 | 0.30 | 0.27 |
| Advantages | 0.30 | 0.27 | 0.23 | 0.23 | 0.27 |
| Limitations | 0.27 | 0.23 | 0.23 | 0.23 | 0.20 |
| Total | 0.83 | 0.73 | 0.73 | 0.77 | 0.73 |
| Transport sector | |||||
| Development | 0.30 | 0.30 | 0.23 | 0.33 | 0.00 |
| Advantages | 0.27 | 0.30 | 0.23 | 0.33 | 0.00 |
| Limitations | 0.33 | 0.23 | 0.20 | 0.33 | 0.00 |
| Total | 0.90 | 0.83 | 0.67 | 1.00 | 0.00 |
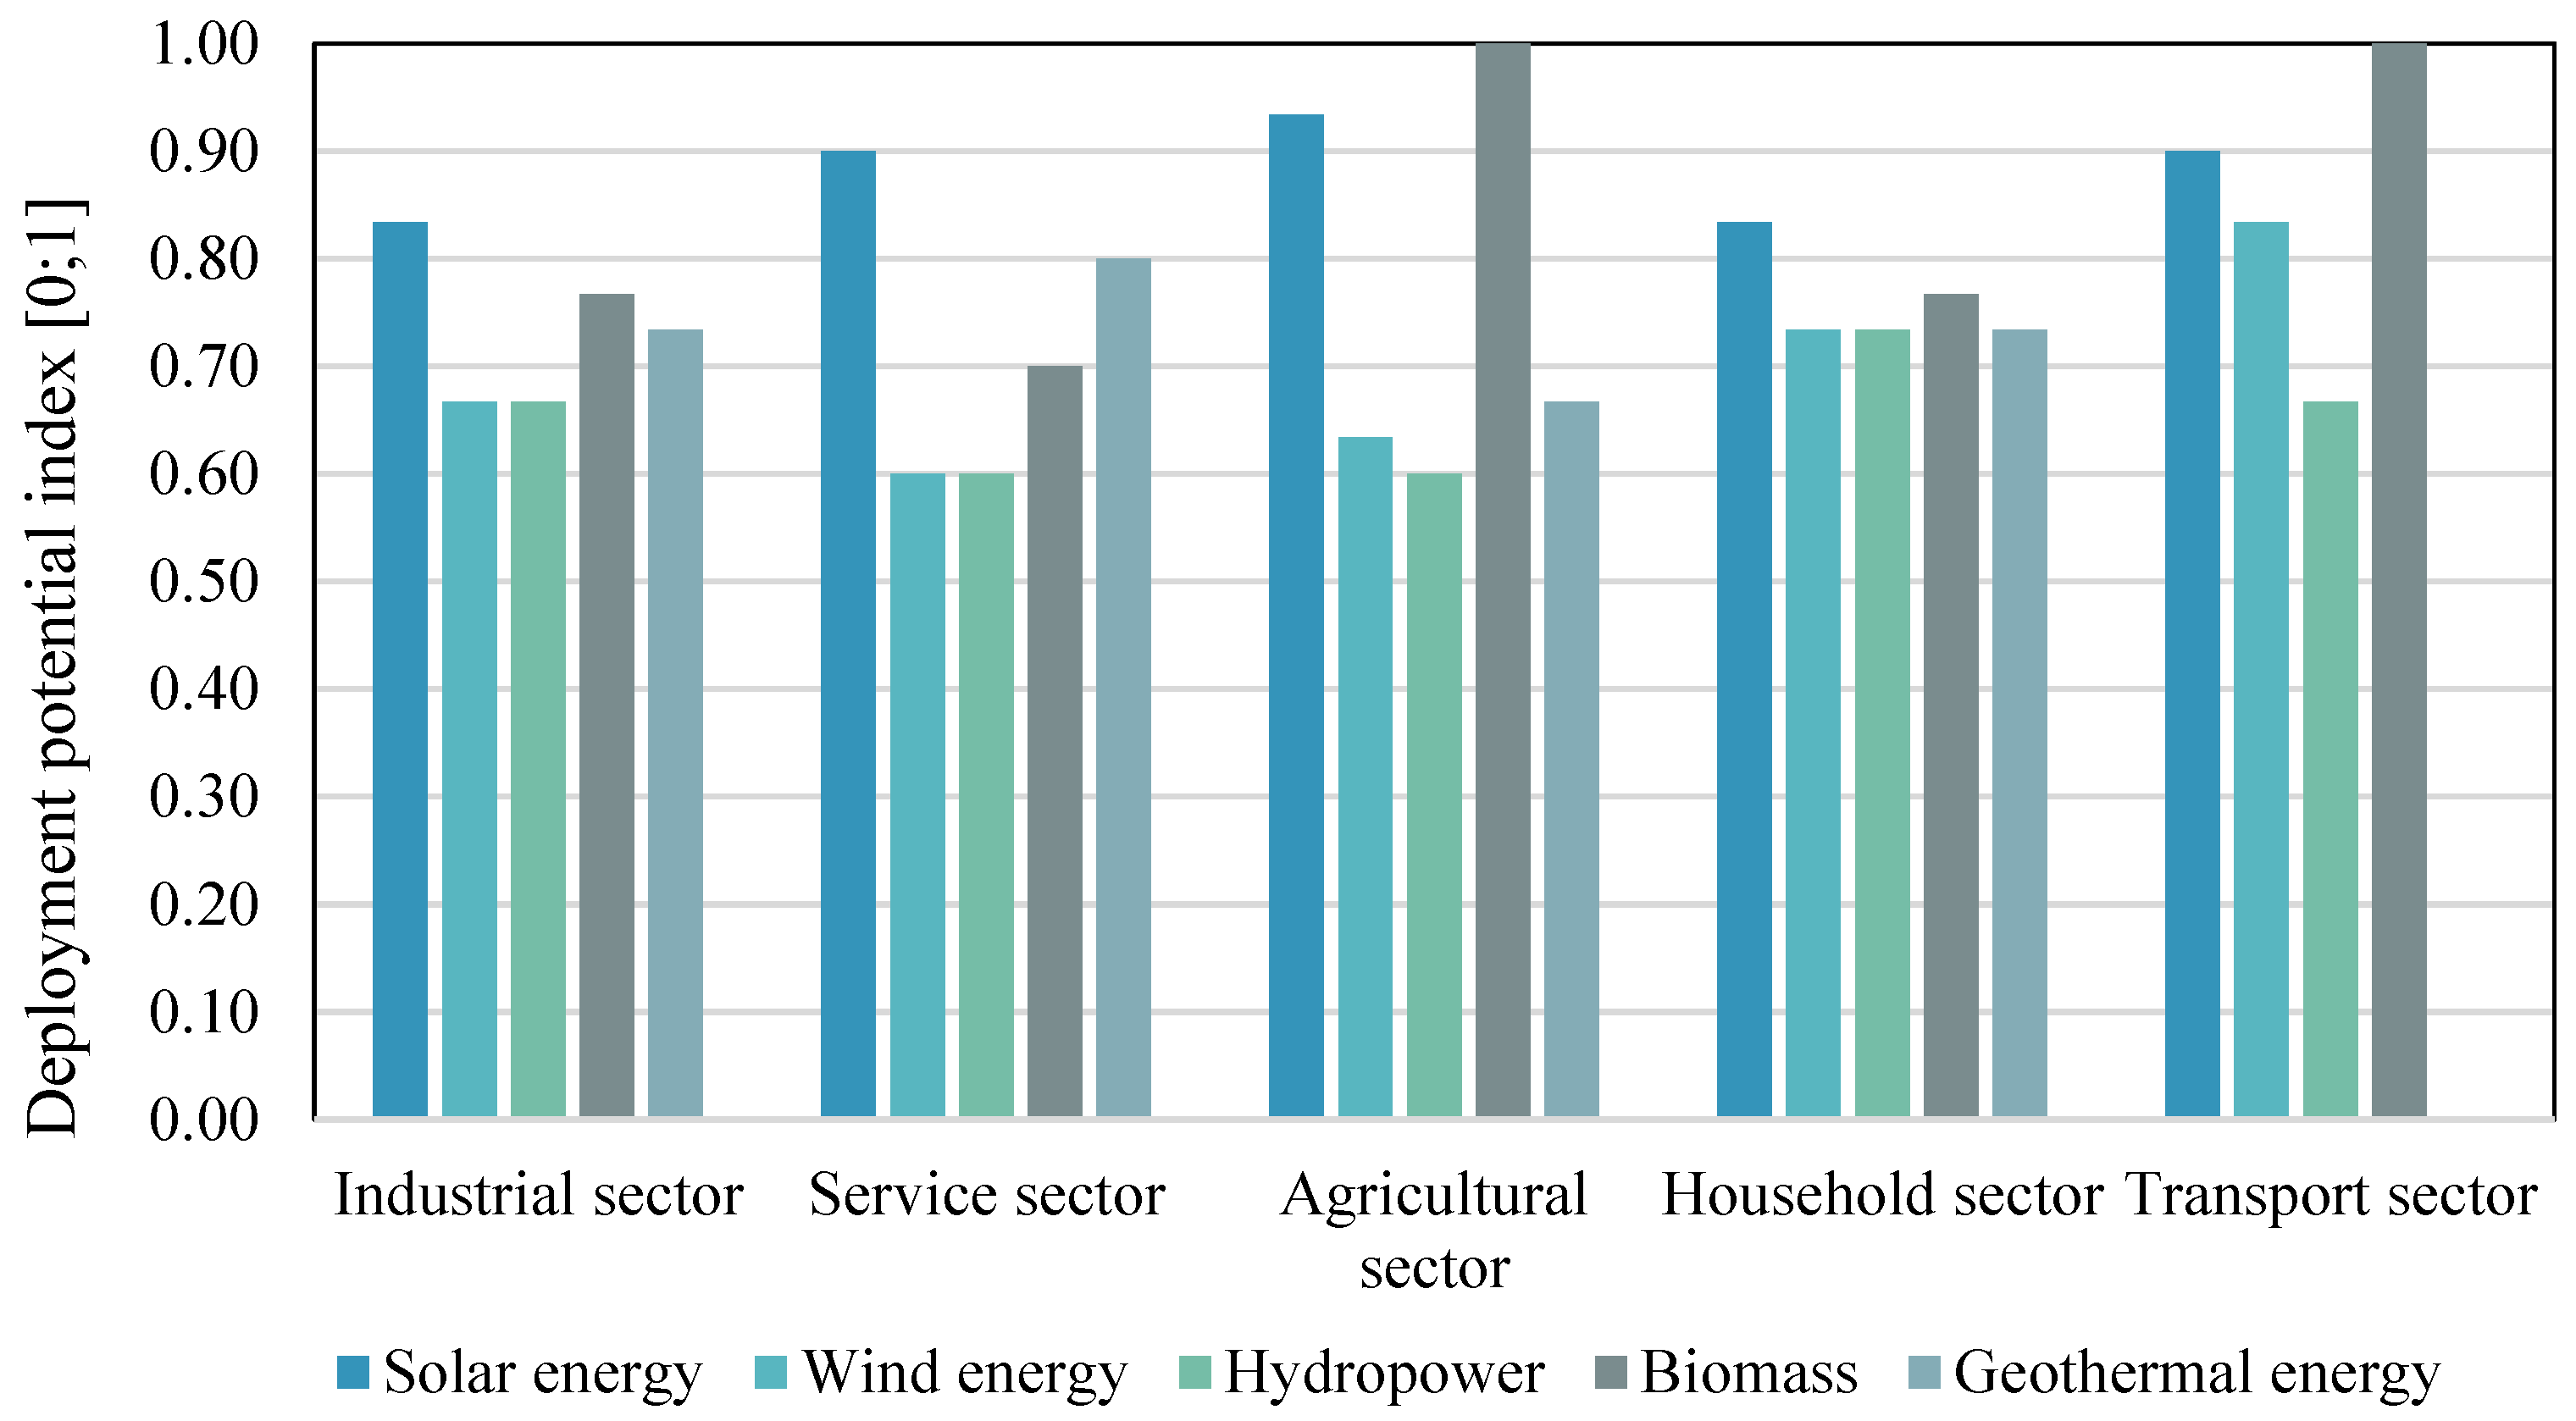
| Solar Energy | Wind Energy | Hydropower | Biomass | Geothermal Energy | |
|---|---|---|---|---|---|
| Industrial sector | 0.83 | 0.67 | 0.67 | 0.77 | 0.73 |
| Service sector | 0.90 | 0.60 | 0.60 | 0.70 | 0.80 |
| Agricultural sector | 0.93 | 0.63 | 0.60 | 1.00 | 0.67 |
| Household sector | 0.83 | 0.73 | 0.73 | 0.77 | 0.73 |
| Transport sector | 0.90 | 0.83 | 0.67 | 1.00 | 0.00 |
| Average values | 0.88 | 0.69 | 0.65 | 0.85 | 0.59 (0.73 *) |
Disclaimer/Publisher’s Note: The statements, opinions and data contained in all publications are solely those of the individual author(s) and contributor(s) and not of MDPI and/or the editor(s). MDPI and/or the editor(s) disclaim responsibility for any injury to people or property resulting from any ideas, methods, instructions or products referred to in the content. |
© 2023 by the authors. Licensee MDPI, Basel, Switzerland. This article is an open access article distributed under the terms and conditions of the Creative Commons Attribution (CC BY) license (https://creativecommons.org/licenses/by/4.0/).
Share and Cite
Balode, L.; Dolge, K.; Blumberga, D. Sector-Specific Pathways to Sustainability: Unravelling the Most Promising Renewable Energy Options. Sustainability 2023, 15, 12636. https://doi.org/10.3390/su151612636
Balode L, Dolge K, Blumberga D. Sector-Specific Pathways to Sustainability: Unravelling the Most Promising Renewable Energy Options. Sustainability. 2023; 15(16):12636. https://doi.org/10.3390/su151612636
Chicago/Turabian StyleBalode, Lauma, Kristiāna Dolge, and Dagnija Blumberga. 2023. "Sector-Specific Pathways to Sustainability: Unravelling the Most Promising Renewable Energy Options" Sustainability 15, no. 16: 12636. https://doi.org/10.3390/su151612636
APA StyleBalode, L., Dolge, K., & Blumberga, D. (2023). Sector-Specific Pathways to Sustainability: Unravelling the Most Promising Renewable Energy Options. Sustainability, 15(16), 12636. https://doi.org/10.3390/su151612636